Market Minds Advisory
Green Ammonia Market

Green Ammonia Market: Shipping Fuel Demand Meets a Stubborn Cost Premium

A commercial reading of green ammonia, where shipping mandates create the first genuine offtake market beyond fertiliser, electrolyzer cost deflation narrows but has not closed the grey premium, and Gulf export projects concentrate global capacity.

Lead Analyst

Bilal Shaikh

Published

September 2026

Make Smarter Decisions with Customized Research Insights

Request a free sample report and evaluate market opportunities, growth trends, and competitive dynamics relevant to your business needs.

2025 MARKET VALUE$2.8BMarket Size 2025
2036 FORECAST VALUE$15.0BBase Case , 2026 to 2036
CAGR 2026 TO 203616.5 %Bull 17.8% / Bear 15.2%
INCREMENTAL OPPORTUNITY$11.8BNet 10- year value creation
EXPANSION MULTIPLE4.61x2036 value over 2026 base
Strategic Levers
M&A Pipeline
Regional Outlook
Country Rankings
Competitive Intelligence
Segmental Deep-dive
Call-Us : 91 93563 13602

Executive Snapshot and Market Trajectory

Shipping decarbonisation mandates have created the first genuine green ammonia demand pool beyond fertiliser, and offtake agreements tied to those mandates now anchor most final investment decisions reaching actual construction today, well ahead of pure cost competitiveness against grey ammonia.
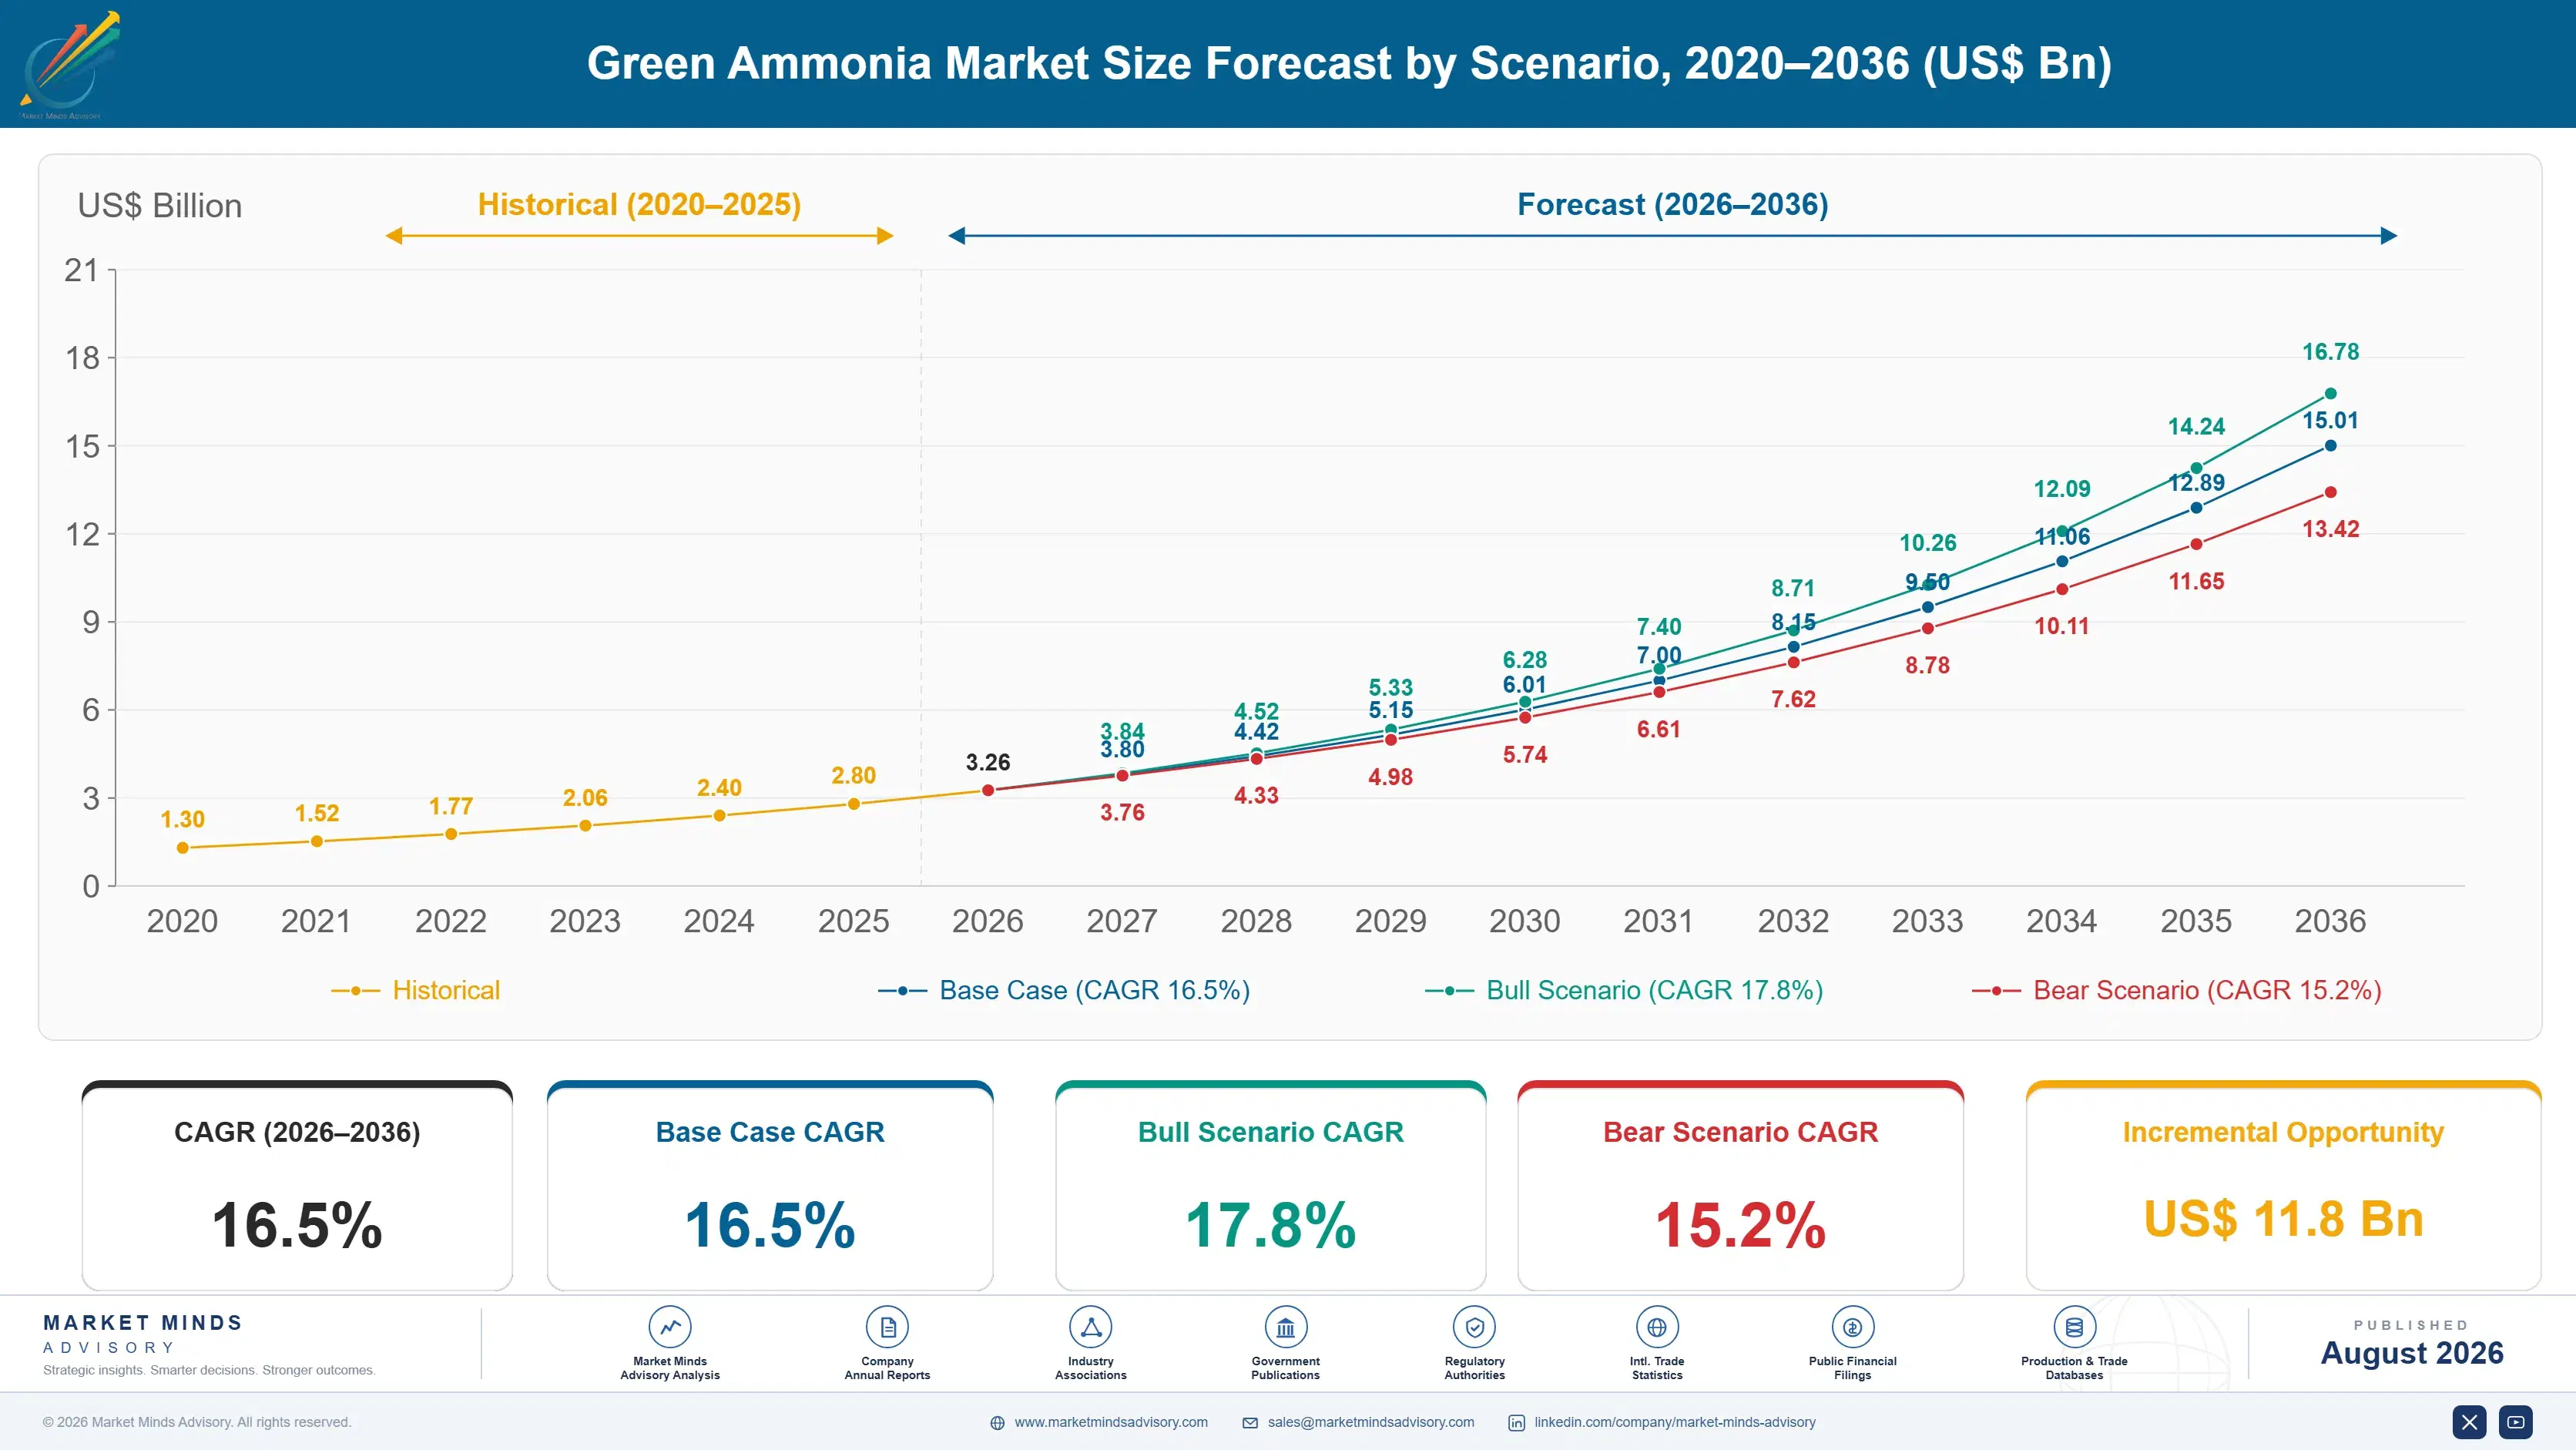
The market stands at USD 2.8 billion in 2025 and reaches USD 15.02 billion by 2036 at a 16.5% CAGR. Marine fuel demand grows fastest at 24.0%, about 1.45 times the overall rate, as shipping operators contract volume years ahead of vessel delivery to secure supply. Western Europe holds 24% of value on regulatory pull, while Australia posts the quickest national growth at 20.5% on renewable resource quality and port access.
Concentration is moderate, with the top five holding roughly 38% of announced production capacity against a crowded field of project developers still reaching final investment decision at meaningful scale. Two distinct forces reshape the competitive field right now. Electrolyzer cost deflation is narrowing the premium over conventional grey ammonia faster than most models assumed just three years ago, and Gulf and African export mega-projects are concentrating global capacity in a handful of resource-advantaged coastal locations.
Market Definition
The green ammonia market covers ammonia synthesised using hydrogen produced from water electrolysis powered by renewable electricity, combined with nitrogen from air separation, valued at production volume for fertiliser, marine fuel, power generation, and industrial feedstock applications. Conventional grey and blue ammonia produced from fossil natural gas or coal, and downstream fertiliser or chemical products manufactured from ammonia, are excluded.
Base Year Value
$2.8B in 2025 (MMA Primary Research Dataset, August 2026)
Forecast Period
2026 to 2036, eleven discrete annual values
CAGR
16.5% base case. Bull 17.8%. Bear 15.2%.
Fastest Growth Segment
Marine Fuel: 24.0% CAGR
Fastest Growth Country
Australia: 20.5% CAGR
Fastest Growth Region
South Asia and Pacific: 18.6% CAGR
Largest Region
Western Europe: 24% of 2025 global value
Market Leaders
Yara International, CF Industries, Fertiglobe, ACME Group, CWP Global. Source: MMA Analysis based on company annual reports and project disclosures.
Primary Survey
n=3,800 procurement and R&D decision-makers, Q4 2025, six countries
Methodology
Demand-side build-up, cross-validated against public data, 47 expert interviews

Green Ammonia Market Forecast Scenarios

green-ammonia-market-size-forecast-scenario-1787324197991
Growth from 2020 to 2025 compounded near 15.2% from a near-zero base, as early pilot and demonstration projects reached first production while the broader project pipeline remained overwhelmingly at feasibility or pre-financing stage across nearly every region tracked worldwide. Final investment decisions accelerated only from 2023 onward, once early offtake agreements finally began clearing negotiation.
Three mechanisms carry the base case to 16.5%. First, shipping decarbonisation mandates under evolving International Maritime Organization rules, which pull forward marine fuel offtake contracts years ahead of vessel delivery. Second, national hydrogen strategies funding first-of-a-kind capacity through direct subsidy and contracts for difference across Europe, the United States, and India specifically today. Third, electrolyzer and renewable power cost deflation, which narrows the grey ammonia premium project by project steadily.
The bull case at 17.8% assumes electrolyzer costs fall faster than current trajectories and shipping mandates tighten on the current regulatory timeline without delay or dilution. The bear case at 15.2% assumes subsidy programmes face budget retrenchment in key markets and renewable power price inflation keeps the grey ammonia premium wide enough to stall final investment decisions on marginal projects.

Why Offtake Contracts Now Decide Which Projects Get Built

Three forces set demand. Shipping decarbonisation mandates provide the newest and fastest-growing layer, since vessel operators must secure alternative fuel supply years before delivery to meet tightening emission rules. Fertiliser demand provides the largest existing base, as agricultural buyers and governments pursue lower-carbon nitrogen supply under sustainability procurement commitments. National hydrogen strategy subsidy provides a third layer, funding first-of-a-kind capacity that would n
MARKET CONCENTRATIONCR5: 38%Fragmented across many early-stage regional project developers globally
GREEN PREMIUM OVER GREYUSD 250 to 500 per tonneReflects electrolyzer capital cost and renewable power pricing gap
TOP PRODUCING REGIONMiddle East and Africa: 8% of valueReflects renewable resource quality and export port infrastructure access
PROJECT FINAL INVESTMENT RATE12 to 18% of announced pipelineMost announced capacity remains at feasibility stage without financing
RENEWABLE POWER COST SHARE55 to 68% of production costElectricity input dominates cash cost far more than equipment
OFFTAKE CONTRACT COVERAGE40 to 65% of planned capacityFinancing generally requires substantial contracted volume in advance
The commercial character rewards contracted offtake over speculative capacity almost entirely. Project financing generally requires forty to sixty-five percent of planned volume under signed offtake agreements before lenders commit capital, which means commercial success depends on securing buyers years before a single tonne ships. Renewable power cost dominates cash cost at fifty-five to sixty-eight percent, well above electrolyzer capital charges, which makes site selection and power procurement the decisive commercial variable.
The next decade turns on two things. Whether electrolyzer and renewable power cost deflation narrows the grey ammonia premium fast enough to reach parity in resource-advantaged locations without permanent subsidy. And whether shipping decarbonisation mandates tighten on schedule, since marine fuel demand depends entirely on regulatory certainty that vessel operators can plan multi-decade asset investment against confidently.
"Everybody in this industry talks about the hydrogen cost curve, and the number that actually matters is the offtake signature. A project with a decade-long shipping contract gets financed at rates a project without one simply cannot access, regardless of whose electrolyzer sits inside it."
Director, Low-Carbon Fuels and Energy Transition Practice · MMA Energy / Low-Car

Market Trends

Shipping Offtake Agreements Now Anchor Final Investment Decisions

Vessel operators facing tightening International Maritime Organization emission rules are signing green ammonia offtake agreements years ahead of vessel delivery, since alternative fuel supply chains take longer to build than the ships themselves in most cases. These agreements, often covering a decade or longer, give developers the contracted revenue lenders require before committing construction capital to a first-of-a-kind facility. Maersk, CMA CGM, and several Japanese shipping groups have signed agreements of this type. The commercial consequence is that marine fuel offtake has become the most reliable signal separating financed projects from those still at feasibility stage.
Market Impact: RFNBO mandate covers 42% share
Electrolyzer Cost Deflation Narrows the Grey Ammonia Premium

Alkaline and proton exchange membrane electrolyzer costs have fallen considerably as Chinese manufacturing scale expanded and installed base grew globally, narrowing the green premium over conventional grey ammonia from levels that made most projects uneconomic without heavy subsidy only a few years ago. The premium now sits at roughly USD 250 to 500 per tonne depending on renewable power cost and site-specific factors, still wide but meaningfully narrower than earlier industry estimates suggested it would be by this point. Renewable power procurement cost, not electrolyzer capital expenditure, increasingly determines which projects reach genuine cost competitiveness fastest.
Market Impact: Subsidies cover 30 to 45%

Market Opportunities and Growth Drivers

European Union Renewable Fuel Mandates Pull Demand Forward

European Union renewable energy directive provisions require a rising share of hydrogen used in industry and shipping to come from renewable sources, creating a regulatory demand floor that ammonia importers and domestic producers can plan investment against with genuine confidence. Carbon border adjustment mechanism provisions add further pressure by raising the effective cost of carbon-intensive ammonia imports into the bloc. Several European fertiliser and chemical companies have signed import offtake agreements with Gulf and North African producers to meet these compliance requirements. The mandate structure gives developers bankable demand visibility voluntary commitments never provided.
Market Impact: Premium adds USD 250 to 500

National Hydrogen Strategies Fund First-of-a-Kind Capacity

The United States, European Union, India, and several Gulf states have launched subsidy programmes, including production tax credits, contracts for difference, and capital grants, designed to close the gap between green and grey ammonia production cost during this early commercialisation phase. India's programme targets several million tonnes of annual capacity through direct incentive payments per kilogram produced. These programmes matter because private capital alone has not moved fast enough to meet stated decarbonisation timelines without public co-investment sharing early-stage risk. Developers increasingly structure financing around subsidy eligibility windows rather than cost curves alone.
Market Impact: Viable sites number under 40 global

Market Restraints and Challenges

Green Premium Over Grey Ammonia Remains Persistently Wide

Green ammonia still costs USD 250 to 500 more per tonne than conventional grey ammonia produced from natural gas, a gap renewable power procurement and electrolyzer capital cost together explain almost entirely. The root cause is that renewable electricity, even in resource-advantaged locations, remains more expensive per unit of energy than natural gas feedstock has historically been for ammonia synthesis. Commercially this stalls final investment decision on projects lacking either premium offtake contracts or direct subsidy support. Developers respond by co-locating with the best renewable resources and blending offtake with subsidy revenue.
Market Impact: Marine fuel segment grows at 24.0%

Renewable Power and Water Availability Constrain Site Selection

Water electrolysis at export scale requires both substantial renewable generation capacity and reliable water supply, narrowing the list of genuinely viable project sites to a small number of coastal locations with strong wind or solar resources and port access. The root cause is straightforward physical geography rather than policy failure, since desalination adds meaningful cost where seawater must substitute for freshwater at the volumes required. Commercially this concentrates the pipeline geographically and raises execution risk where infrastructure remains underdeveloped. Developers co-locate desalination directly with electrolysis and prioritise existing port infrastructure.
Market Impact: Premium narrows toward USD 250
3 additional market trends, 4 additional growth drivers, and 3 additional restraints and challenges are covered in the full report. Contact sales@marketmindsadvisory.com to access the complete intelligence.

Segment CAGR and Growth Architecture

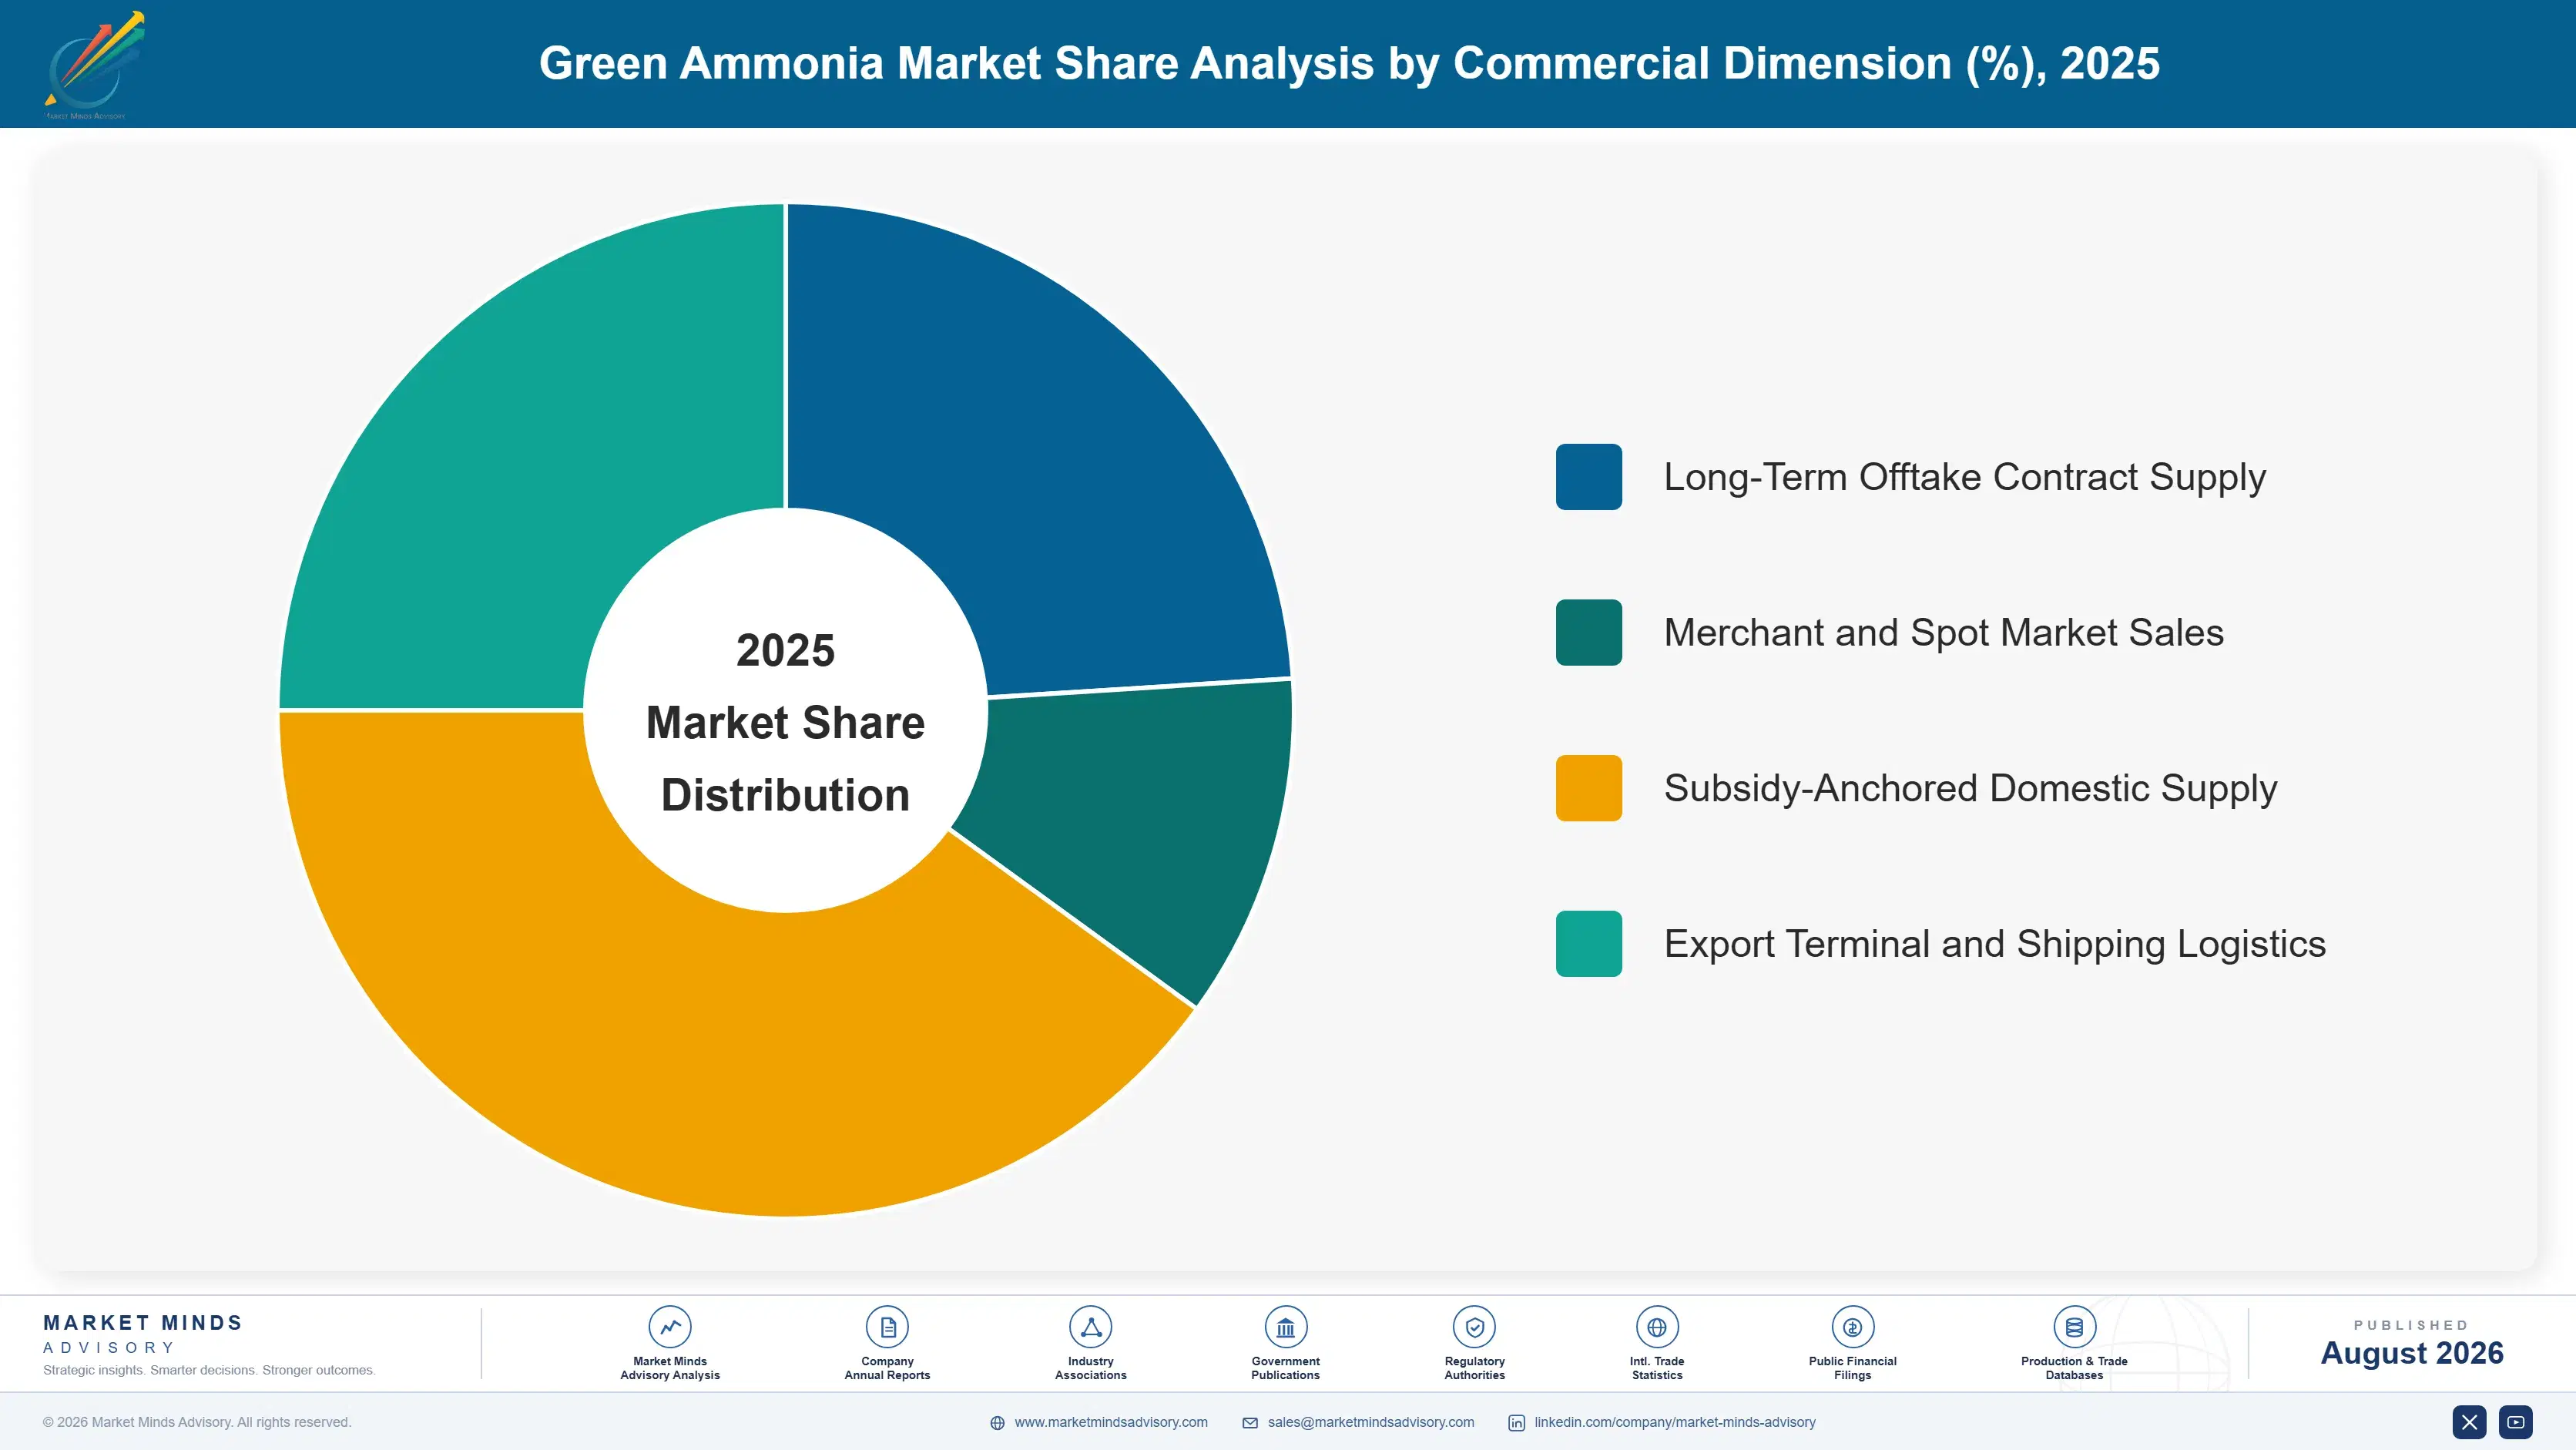
Segmentation follows end-use application, a single commercial logic describing which buyer ultimately consumes the ammonia and under what contractual and financing structure it was originally secured today. Each application carries distinct offtake dynamics, pricing mechanisms, and regulatory drivers, so commercial position tracks application rather than production technology, which appears separately within the framework below.
green-ammonia-market-market-share-analysis-1787324198921

Marine Fuel

Marine fuel demand grows fastest at 24.0%, about 1.45 times the overall 16.5% rate, as shipping operators facing tightening International Maritime Organization emission rules sign offtake agreements years ahead of vessel delivery to secure supply chains that take longer to build than the vessels themselves. This is the newest demand category in the market, with essentially no commercial volume before recent years, growing from that near-zero base at the fastest pace of any application tracked. Maersk, CMA CGM, and several Japanese and Korean shipping groups have signed multi-year agreements anchoring early project financing. Dual-fuel ammonia engine technology remains in early commercial deployment, creating some execution risk offtake volumes have not fully resolved.
CAGR 24.0%

Hydrogen Carrier and Energy Export

Hydrogen carrier and energy export applications grow at 20.0%, the second-fastest category, using ammonia's higher energy density and existing global shipping infrastructure to move renewable energy from resource-rich exporting regions to importing economies lacking sufficient domestic renewable capacity. Japan and South Korea have both signed substantial import agreements with Australian, Middle Eastern, and North African producers specifically for this purpose, treating ammonia as an energy commodity rather than solely as a fertiliser feedstock. Cracking ammonia back into pure hydrogen at the import terminal adds cost and energy loss that direct hydrogen shipping would avoid, a technical trade-off the industry has not yet fully resolved. CWP Global and Fortescue both hold substantial positions in this export-oriented segment specifically.
CAGR 20.0%
Full segment breakdown across 5 segments available in the complete report.

Regional Architecture and Country Demand Map

Renewable resource quality and regulatory pull, not existing ammonia production capacity, set this distribution almost entirely. Western Europe leads on import demand and mandate structure, while Middle East and Africa concentrates production capacity on resource quality and export infrastructure, and South Asia and Pacific posts the fastest growth.

North America

United States production tax credits under recent federal legislation anchor project economics here more directly than any other single factor. North America holds 22% of value, with Gulf Coast projects targeting both domestic fertiliser markets and export to Europe and Asia simultaneously. CF Industries and several joint ventures with industrial gas companies have announced substantial capacity tied explicitly to subsidy eligibility windows that shape financing timelines considerably. Policy uncertainty around subsidy programme continuity has slowed some final investment decisions relative to earlier announced timelines. Growth of 16.0% reflects steady project progression tempered by that policy uncertainty across the sector broadly. Canadian projects add meaningful export-oriented capacity targeting similar Asian and European markets.
Share: 22% | CAGR: 16.0% (2026 to 2036)

Western Europe

Import demand rather than domestic production defines this market above any other factor. Western Europe holds 24% of value, the largest single share, driven by renewable energy directive mandates and carbon border adjustment provisions that create a genuine regulatory demand floor for renewable ammonia importers and domestic producers alike. German, Dutch, and Belgian ports are building import and cracking infrastructure specifically to receive ammonia from Gulf and North African exporters under long-term supply agreements. Domestic production remains limited given renewable power cost relative to import alternatives from more resource-advantaged regions. Growth of 15.0%, the slowest of the seven, reflects import dependence rather than domestic project pipeline expansion. Mandate compliance deadlines increasingly drive near-term contracting decisions across the bloc.
Share: 24% | CAGR: 15.0% (2026 to 2036)
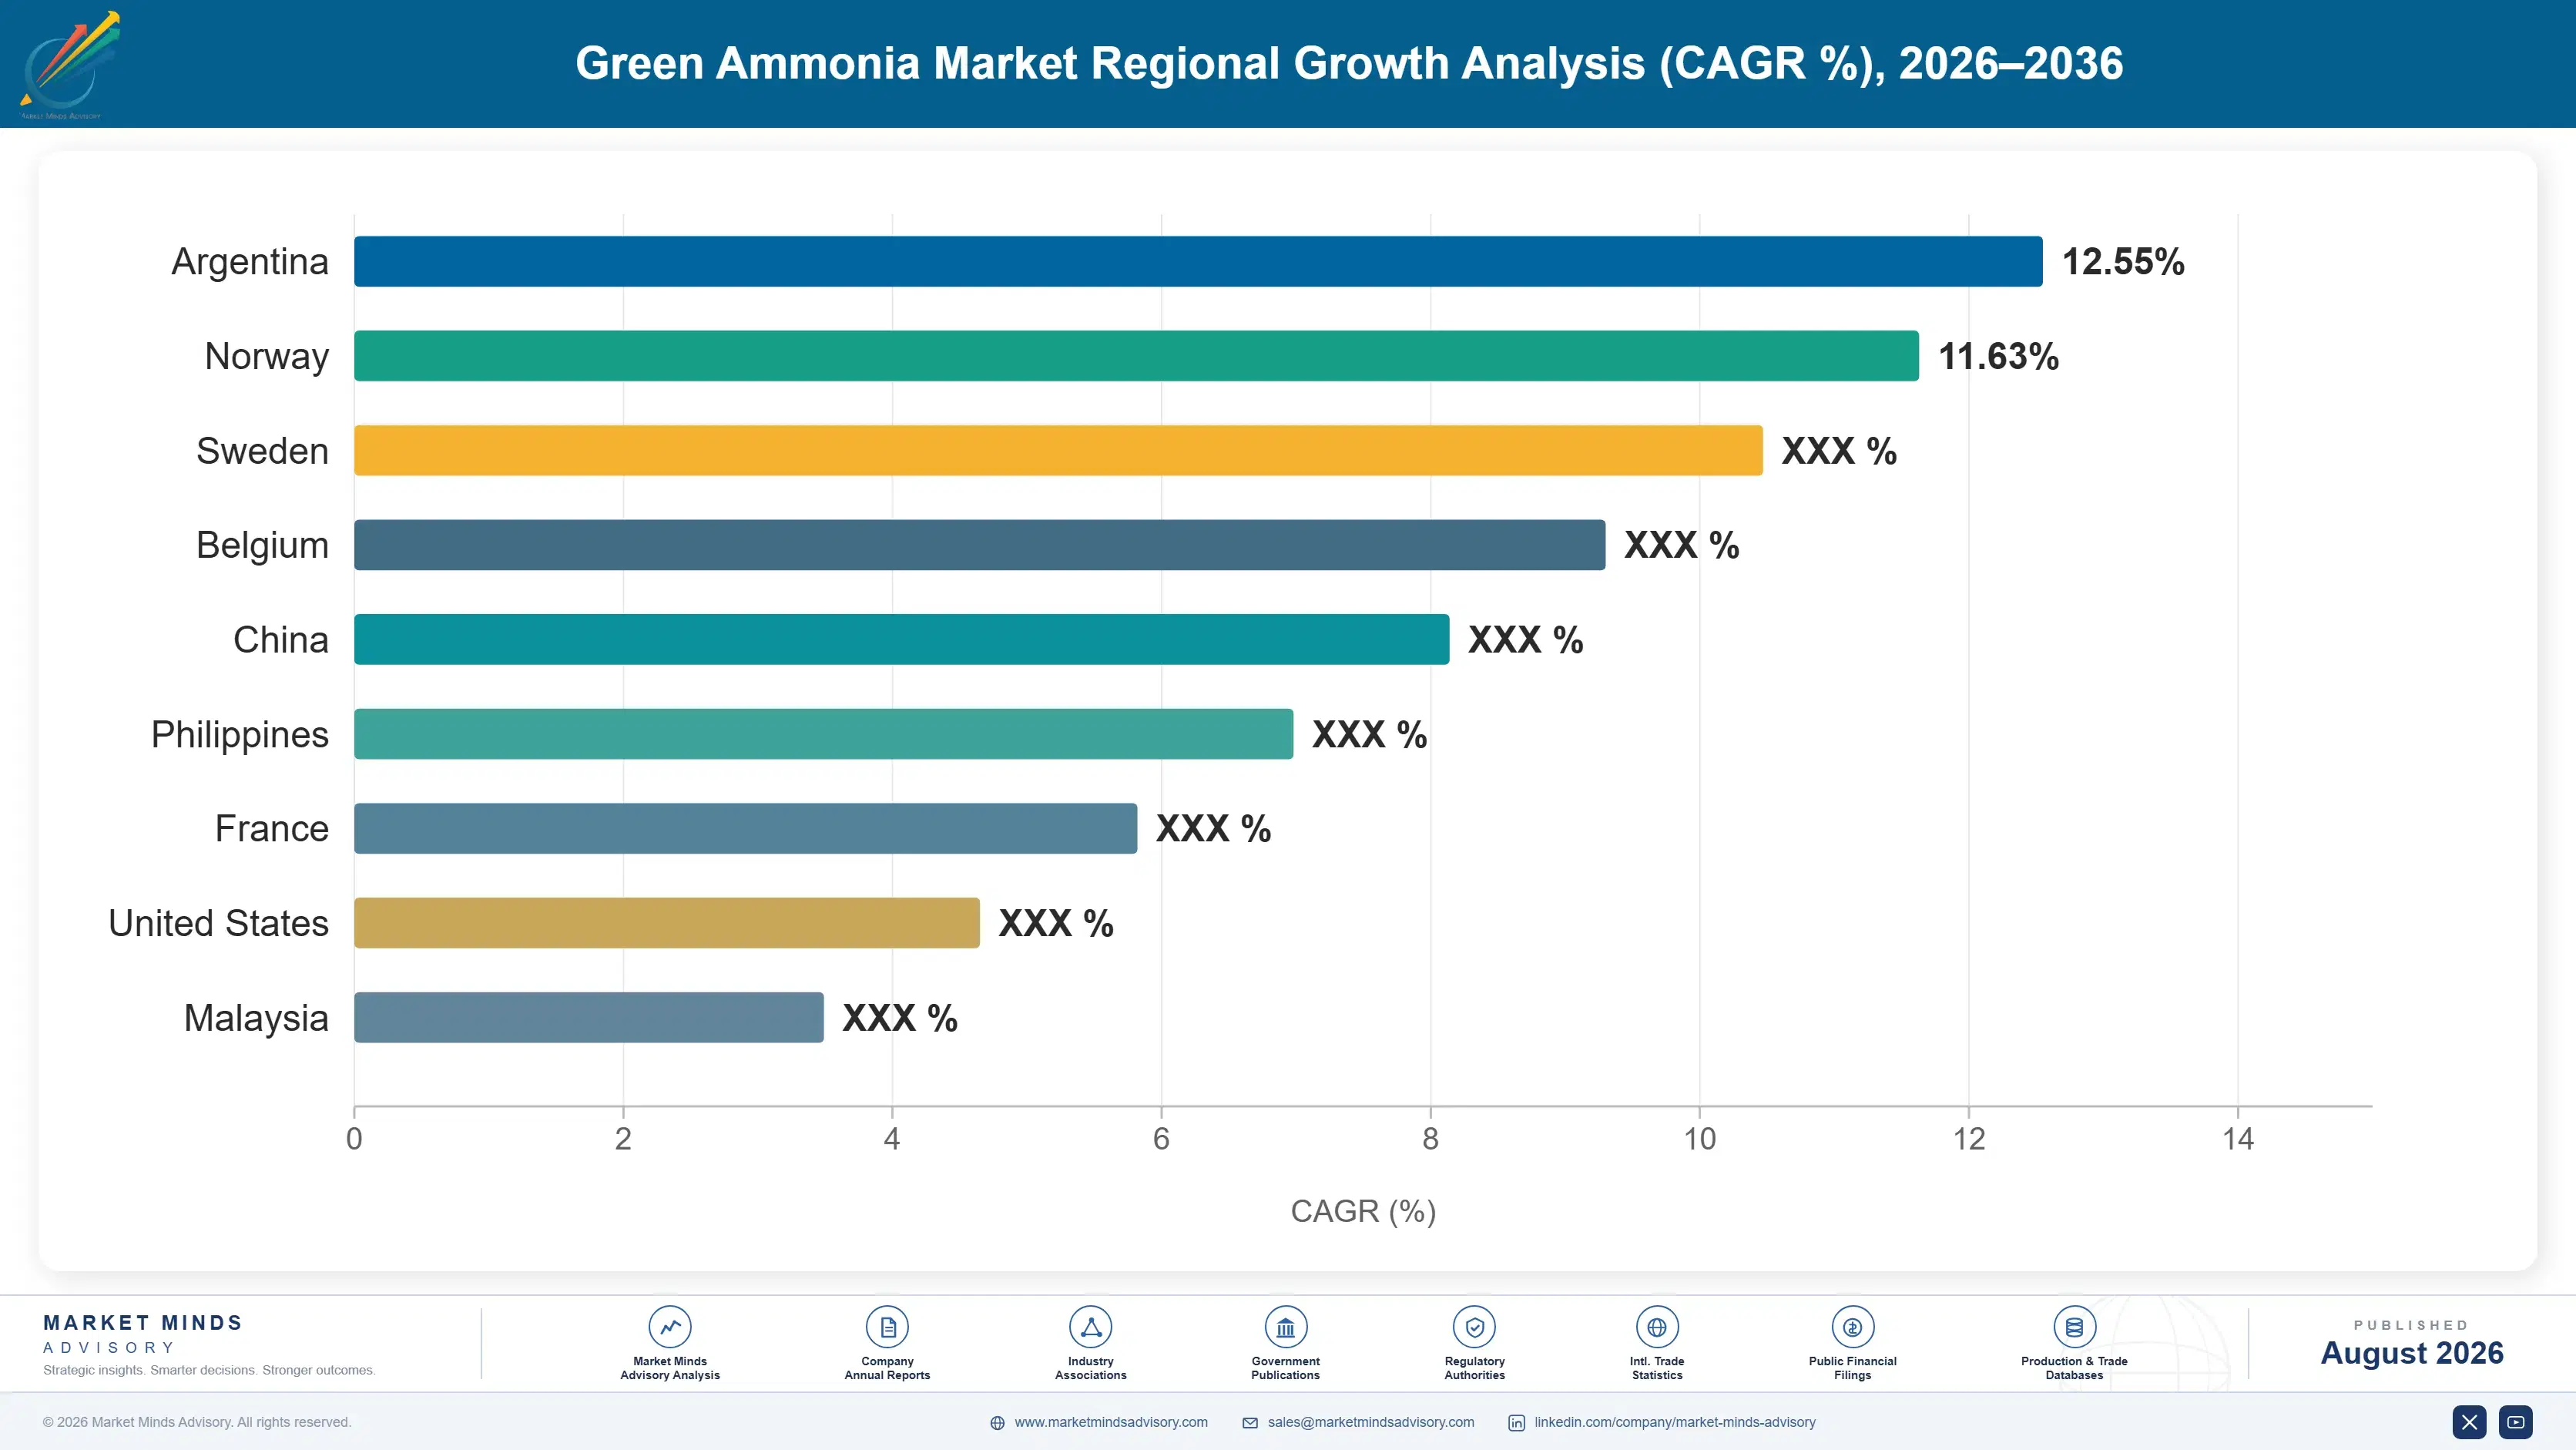
Regional intelligence for 5 additional markets available in the complete report: East Asia, South Asia and Pacific, Latin America, Middle East and Africa, Eastern Europe. Contact sales@marketmindsadvisory.com.
green-ammonia-market-country-cagr-analysis-1787324199736

Where Green Ammonia Value Actually Concentrates Today

Competing purely on production cost concentrates value in exactly the position renewable power pricing determines rather than any commercial choice a developer actually controls day to day. The four moves below shift value toward positions that contracted offtake and regulatory certainty genuinely protect: marine fuel offtake, subsidy-eligible capacity, resource-advantaged siting, and blended contract structures.

Secure Marine Fuel Offtake Ahead of Vessel Delivery

Shipping operators facing tightening International Maritime Organization emission rules sign green ammonia offtake agreements years ahead of vessel delivery, since alternative fuel supply chains take longer to build than the ships themselves in nearly every case examined. Developers securing these agreements early capture financing terms that speculative capacity simply cannot access, given how heavily project lenders weight contracted revenue visibility before committing construction capital at this early commercialisation stage. Marine fuel demand is growing at 24.0% against a 16.5% overall market, and that gap will only widen as more vessel operators reach their own compliance deadlines.
Market Impact: Marine fuel demand grows at 24.0% v

Prioritise Subsidy-Eligible Capacity Within Funding Windows

National hydrogen strategies in the United States, European Union, India, and several Gulf states fund first-of-a-kind capacity through production tax credits, contracts for difference, and direct capital grants that can close 30 to 45 percent of the gap between green and grey ammonia production cost during this early commercialisation phase. Developers structuring financing around subsidy eligibility windows, rather than treating public funding as an afterthought, reach final investment decision meaningfully faster than those relying on premium offtake pricing alone to bridge the same economic gap entirely on their own today.
Market Impact: Subsidies close 30 to 45% of cost g

Site Projects in Genuinely Resource-Advantaged Locations

Renewable power cost accounts for 55 to 68 percent of production cost, which makes site selection the single most consequential commercial decision a developer makes, well ahead of electrolyzer technology choice or overall plant configuration decisions made later. Gulf, Australian, and Chilean sites combining exceptional wind or solar resources with existing port infrastructure reach cost competitiveness meaningfully faster than sites requiring new transmission or export infrastructure built specifically for the project. Developers underweighting site quality in favour of proximity to existing industrial infrastructure consistently underperform on realised production cost once operational.
Market Impact: Power costs run 55 to 68% of total

Blend Subsidy Revenue With Premium Offtake Contracts

Projects combining public subsidy revenue with premium-paying shipping or European import offtake contracts reach financial close more reliably than those depending on either single revenue source alone, since lenders discount projects exposed to any one counterparty or policy risk considerably more heavily than genuinely diversified revenue structures typically would allow. Financing generally requires 40 to 65 percent of planned volume under signed offtake agreements before capital commits, and blending revenue types both increases achievable contract coverage and reduces the effective cost of capital a project faces at critical financing milestones.
Market Impact: Offtake coverage reaches 40 to 65%

Who Controls the Margin Pool

Concentration is moderate: the top five hold roughly 38% of announced capacity, with a crowded field of regional developers and energy majors competing for the same resource-advantaged sites and counterparties. The gap between leaders and challengers is financing capability and offtake relationships rather than production technology, fairly widely available. All participants are assessed on announced production capacity in tonnes per annum as disclosed in filings, held consistently throughout.
Competition runs along four lines. First, offtake contracting relationships with shipping operators and European importers facing regulatory deadlines. Second, access to genuinely resource-advantaged sites combining renewable quality with export infrastructure. Third, subsidy eligibility and government relationship capability across multiple jurisdictions simultaneously. Fourth, project financing and execution track record, which matters increasingly as the industry moves from feasibility studies toward actual construction.

Pressure is building from two directions. Energy majors with balance sheet capacity are entering project development at scale, displacing smaller developers lacking comparable access to cheap capital. Established fertiliser producers including Yara and CF Industries are converting existing infrastructure and customer relationships into green ammonia positioning faster than new entrants can replicate. Rankings should favour developers combining resource-advantaged sites with contracted offtake over bare announced capacity.
green-ammonia-market-company-positioning-matrix-1787324200638

Competitive Moat and Risk Dimensions

YARA INTERNATIONAL

Moat: Existing ammonia infrastructure and customers

Yara operates extensive existing ammonia production and distribution infrastructure worldwide, giving it customer relationships and logistics capability that new entrants must build from nothing. Its fertiliser customer base provides a captive demand channel for green ammonia as sustainability procurement requirements tighten across European agriculture. Decades of ammonia industry operating experience reduce execution risk relative to newer project developers.
YARA INTERNATIONAL

Risk: Legacy grey ammonia asset exposure

Yara's existing production base runs overwhelmingly on conventional grey ammonia technology, creating stranded asset risk as carbon border adjustment mechanisms and customer sustainability requirements tighten over the coming decade. Converting or replacing that installed base requires capital at a scale that competes directly with new green capacity investment. Newer, purpose-built green ammonia developers face none of this legacy transition burden.
CF INDUSTRIES

Moat: United States subsidy positioning depth

CF Industries has positioned its announced green ammonia capacity around United States federal production tax credit eligibility, securing economics pure-play developers without comparable regulatory relationships struggle to replicate quickly. Its existing Gulf Coast ammonia infrastructure and export logistics provide a genuine head start converting announced capacity into operating projects. Strong balance sheet capacity supports funding multiple project developments.
CF INDUSTRIES

Risk: Domestic policy continuity dependence

CF Industries' green ammonia economics depend heavily on federal subsidy programme continuity, which faces genuine political uncertainty across election cycles that could alter eligibility rules or funding levels materially. Renewable power procurement costs in its Gulf Coast target region remain less favourable than Gulf or Australian sites, narrowing its competitive positioning on cost alone considerably against those better-resourced locations.

Players Tracked

Prominent Players

Yara International
CF Industries
Fertiglobe
ACME Group
CWP Global

Other Key Players

OCI Global
Copenhagen Infrastructure Partners
Air Products
Linde
Uniper
RWE
TotalEnergies
Fortescue
BP
Orsted
Iberdrola
Engie
Sumitomo Corporation
Mitsui
ACWA Power

Recent Developments

FEBRUARY 2025

Fertiglobe signs long-term green ammonia offtake agreement with European importer

Fertiglobe signed a long-term offtake agreement with a European fertiliser and industrial buyer for green ammonia produced at its Egyptian facility, covering volume compliant with renewable fuel directive requirements. This was a commercial offtake agreement rather than any acquisition or joint venture, anchoring financing for expanded production capacity specifically.
Signal: Offtake agreements tied to European mandat
OCTOBER 2024

Fortescue and Japanese utility sign ammonia import cooperation agreement

Fortescue signed a cooperation agreement with a Japanese utility covering green ammonia import volumes and joint technical work on ammonia co-firing feasibility at existing power generation facilities. This was a cooperation and offtake agreement rather than a merger or acquisition, supporting Fortescue's Australian project pipeline directly.
Signal: Energy security motivations increasingly d
MAY 2025

ACME Group completes acquisition of renewable power development assets

ACME Group completed the acquisition of renewable power development assets to secure dedicated electricity supply for its green ammonia project pipeline in India, reducing dependence on third-party power purchase agreements. This was a genuine acquisition of development-stage renewable assets rather than a joint venture, vertically integrating power supply directly.
Signal: Vertical integration into renewable power

Renewable Power, Electrolyzer Capital, and Water

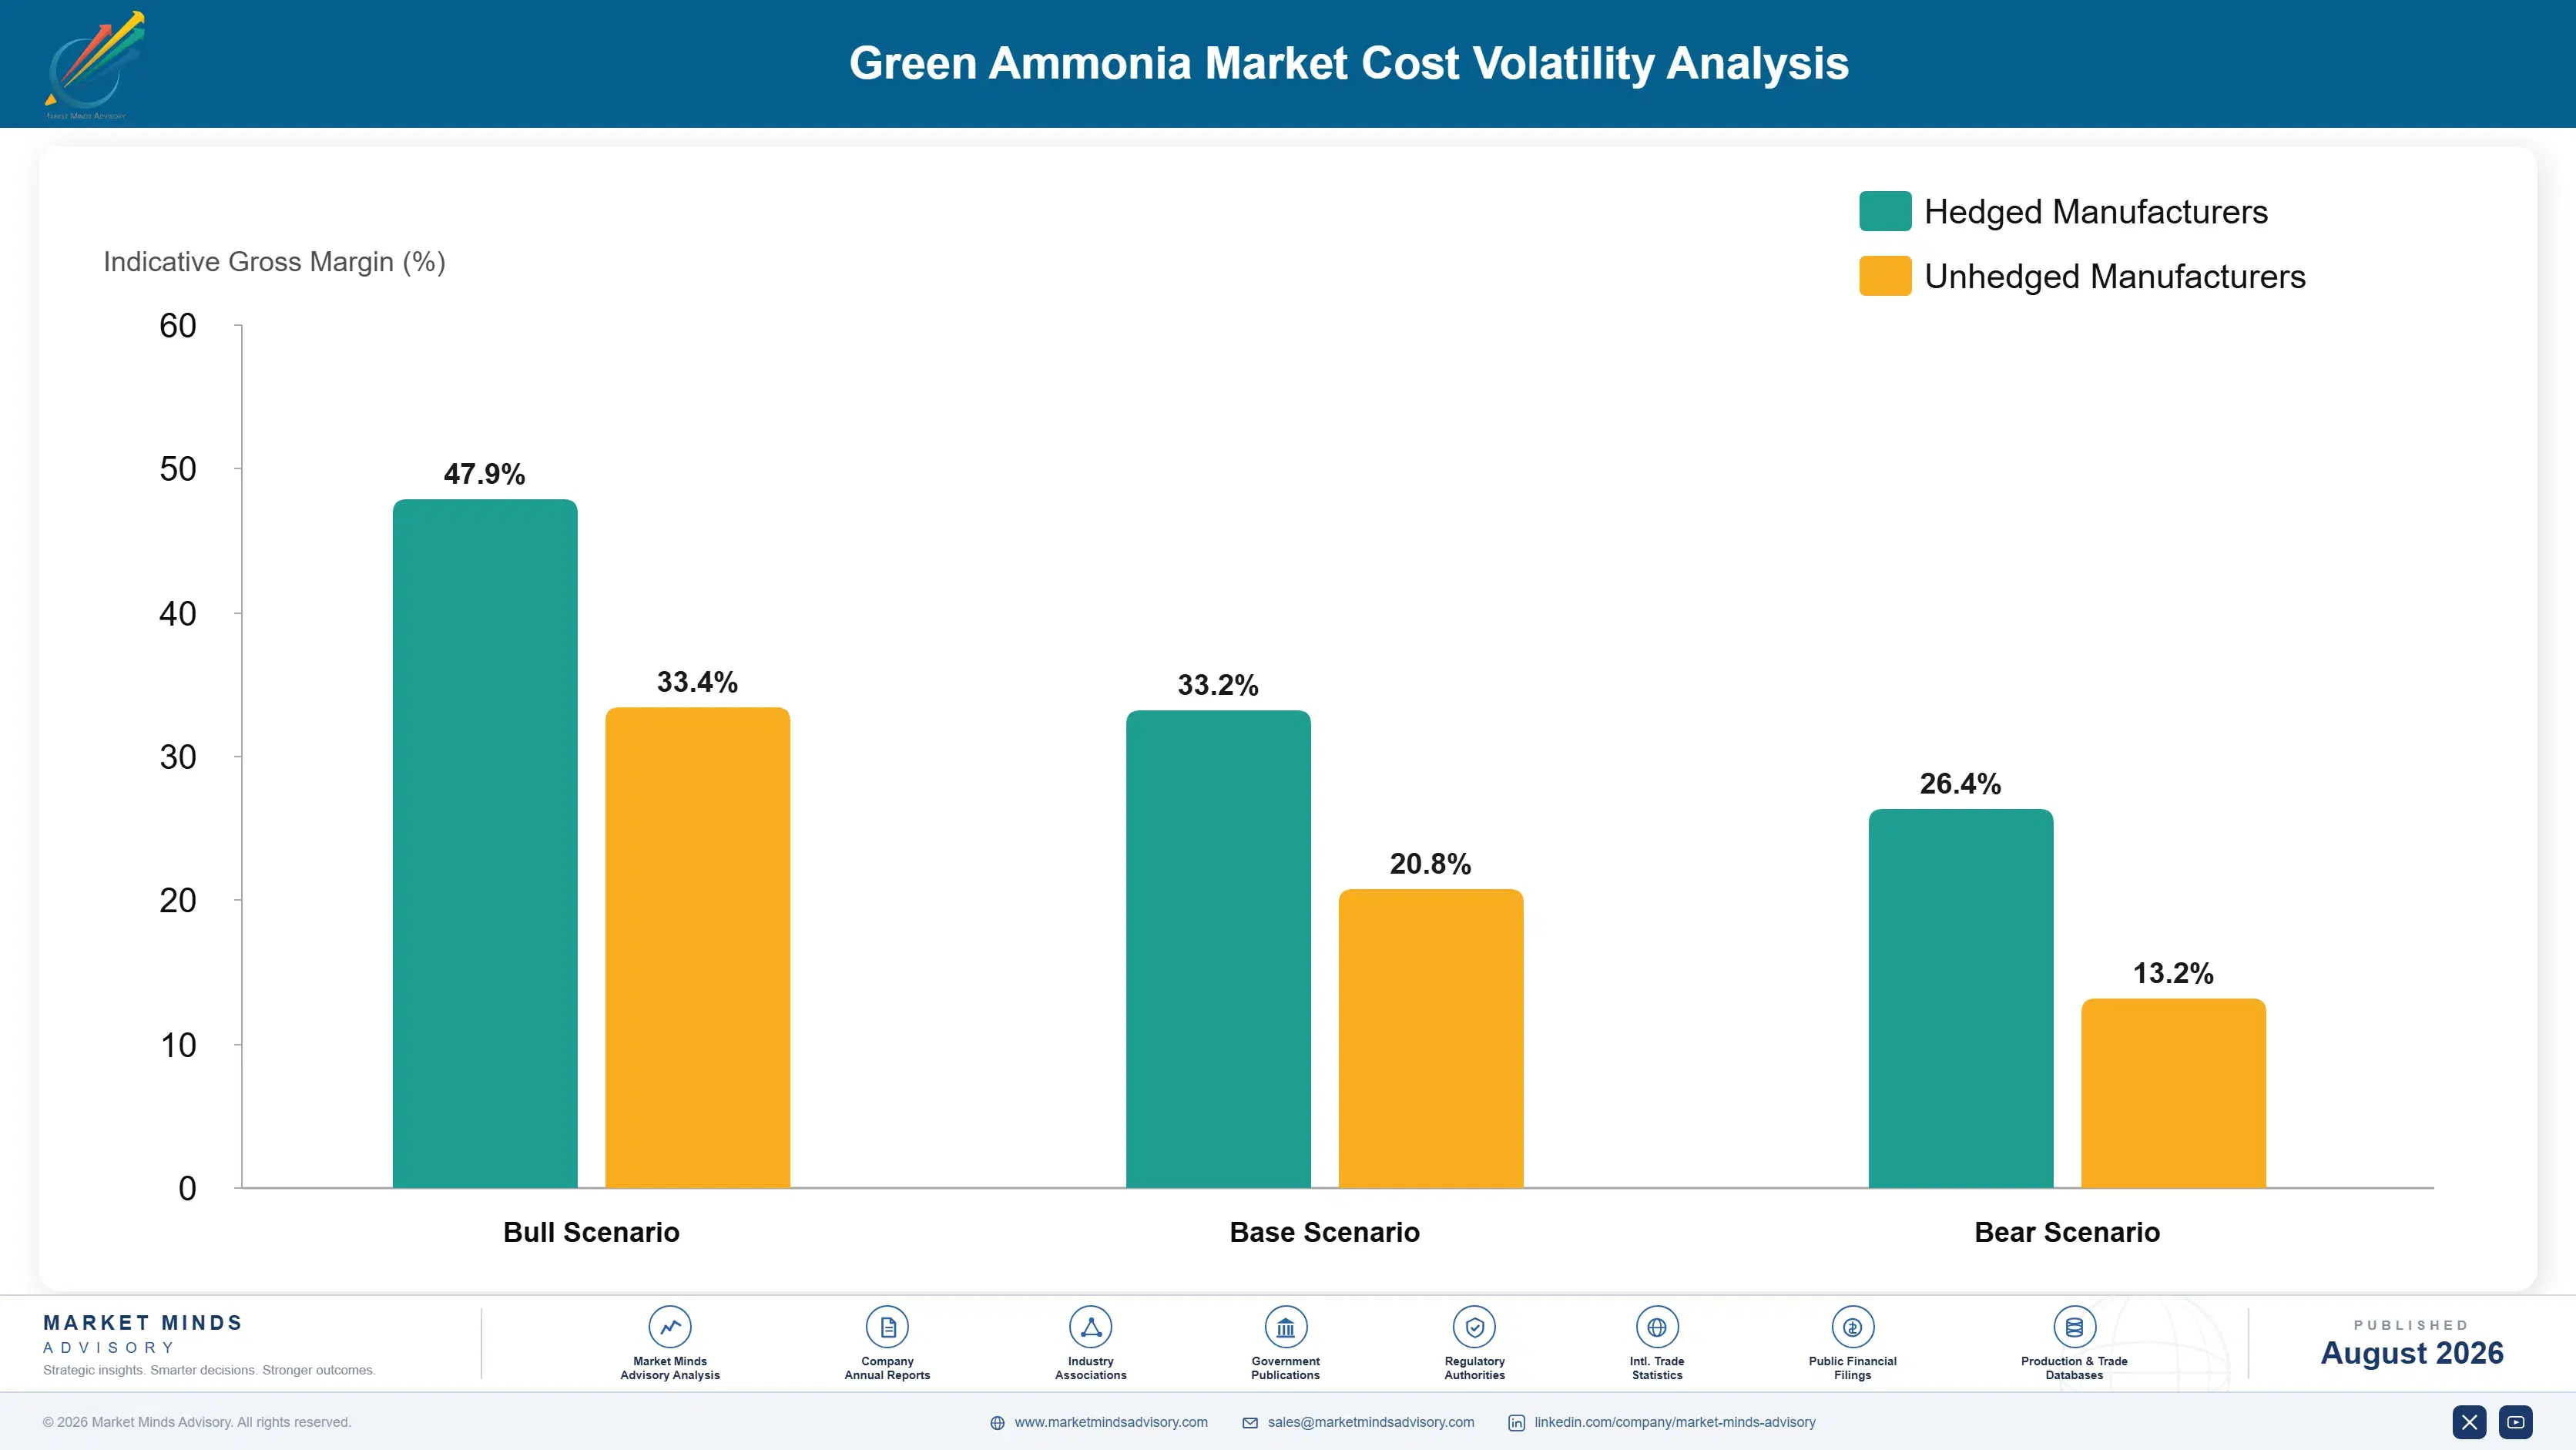
Renewable power procurement dominates green ammonia cash cost, accounting for 55 to 68 percent of production cost depending on site quality and power purchase agreement structure. Electrolyzer capital charges add a further 18 to 28 percent, while water treatment, nitrogen separation, and balance-of-plant costs make up the remainder. This cost structure differs fundamentally from grey ammonia, where gas feedstock rather than electricity dominates cash cost.
Renewable power price volatility through 2022 illustrated the exposure clearly, as European wind and solar power purchase agreement prices rose considerably amid broader energy market disruption following reduced Russian gas supply, per IEA renewable energy market analysis. Several announced European projects delayed final investment decisions as a result of that power price uncertainty. Prices have since stabilised, though remain above pre-2022 levels in several key markets.

Exposure separates clearly by site quality and power procurement structure. Projects with long-term fixed-price renewable power agreements in resource-advantaged locations achieve materially lower and more predictable production cost than those exposed to merchant power pricing or weaker renewable resources. Gulf and Australian sites generally secure more favourable long-term power pricing than European or North American locations given superior renewable resource quality and lower competing power demand.
green-ammonia-market-cost-volatility-analysis-1787324201002

Secure long-term fixed-price renewable power agreements

Merchant power price exposure destroyed project economics for several developers during the 2022 European energy price spike specifically. Long-term power purchase agreements with fixed or indexed pricing structures provide the cost certainty project lenders require before committing capital. The trade-off is reduced ability to benefit when merchant power prices fall, which most developers accept given financing requirements.

Co-locate production directly with renewable generation assets

Transmission cost and grid connection delays have slowed several announced projects considerably relative to original timelines and budgets across multiple regions. Co-locating ammonia production directly with dedicated wind or solar generation assets avoids much of this transmission cost and connection risk entirely. This requires sufficient land and renewable resource quality at the specific production site chosen.

Integrate desalination where freshwater access is limited

Water availability constrains site selection meaningfully in several resource-advantaged coastal locations where freshwater supply cannot support project-scale electrolysis at all reliably or affordably. Integrating desalination capacity directly with electrolysis facilities resolves this constraint at meaningful additional capital cost. Gulf and Australian developers have both proven this approach commercially viable at genuine project scale already.

Portfolio Architecture for Margin Defence

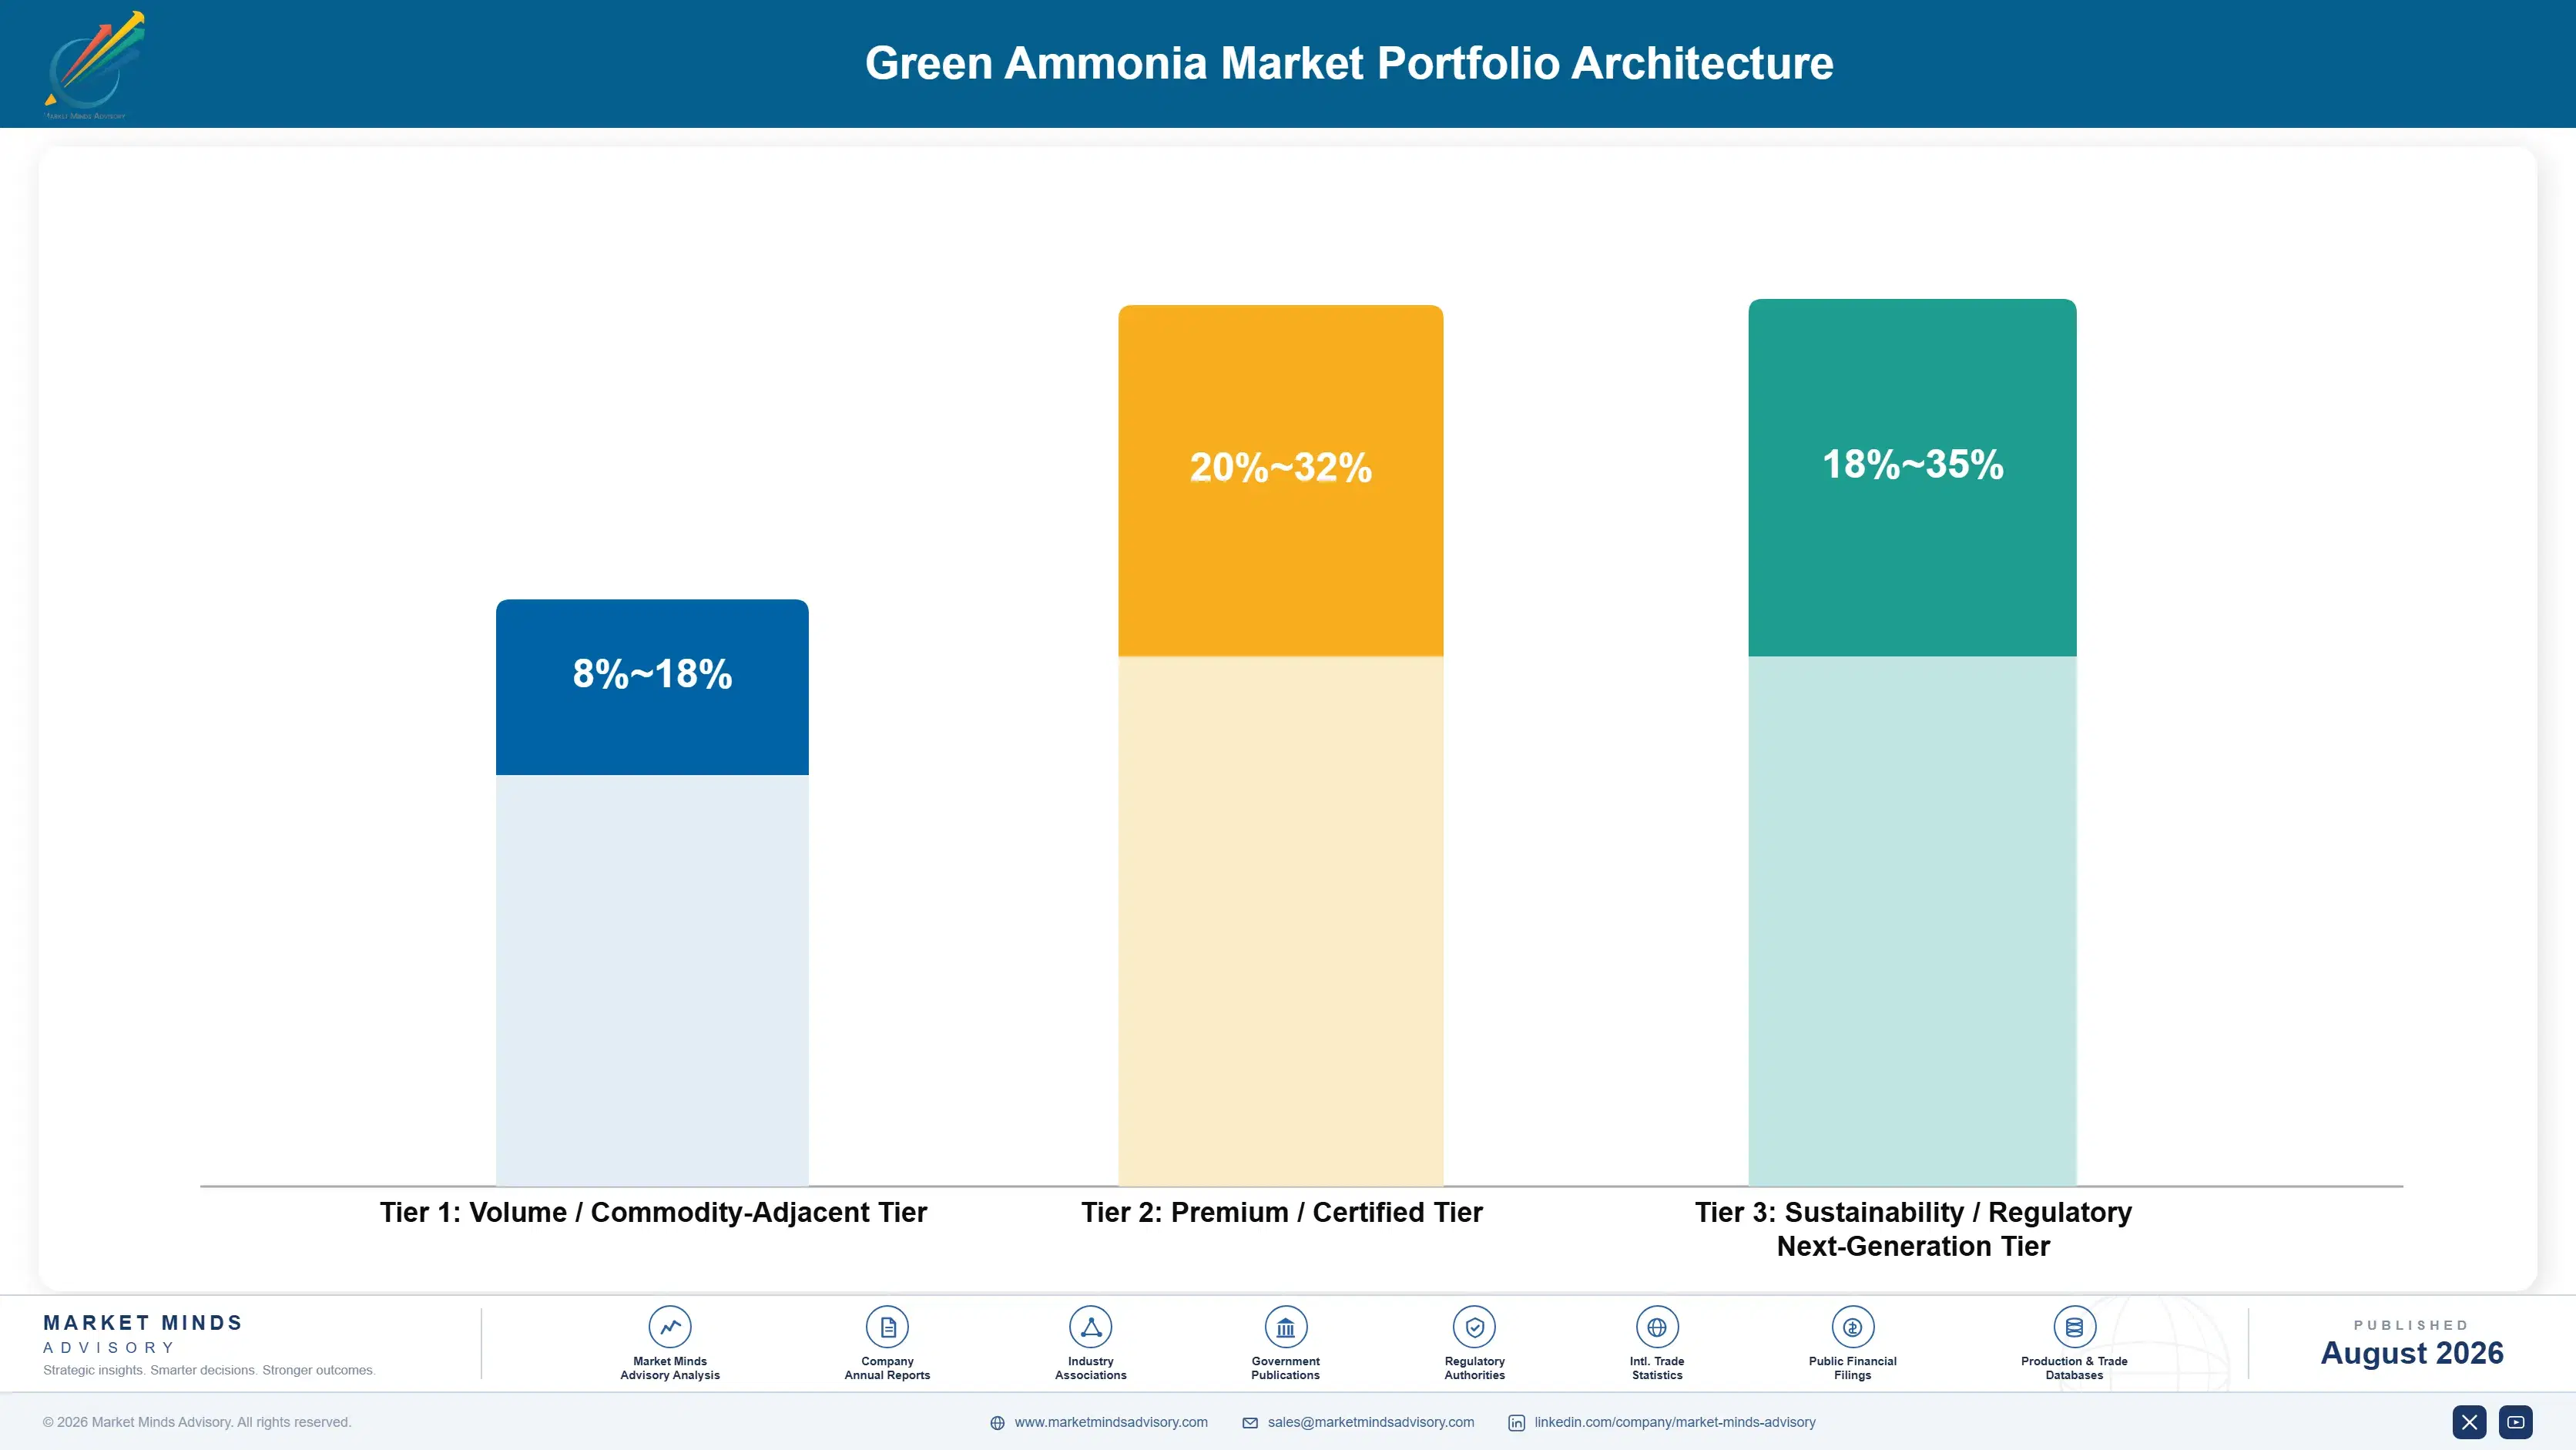
The portfolio splits into three tiers with sharply different economics and risk profiles. Subsidy-dependent capacity in higher-cost regions forms a lower tier, where public funding rather than market pricing determines project viability. Resource-advantaged export capacity with strong offtake contracts earns considerably more, since renewable power cost and contracted revenue support genuine cost competitiveness. Marine fuel and compliance-driven volume sits differently again, priced against reg
The tension runs between projects that can reach financial close today and the broader pipeline still waiting for further cost deflation or subsidy support to become viable. A developer chasing every announced opportunity spreads capital across too many pre-financing projects, while one concentrating on the strongest sites may cede first-mover positioning elsewhere. Companies managing this well sequence site development by financing readiness rather than announcement timing.

High-value pools concentrate where resource quality, offtake certainty, and subsidy eligibility align: Gulf and Australian export capacity with signed shipping or European offtake contracts, and subsidy-anchored capacity in the United States and India timed to funding windows. Speculative capacity without secured offtake or resource advantage sits at the other end, facing the longest path to financial close and the highest risk of never reaching construction.

Volume / Commodity-Adjacent Tier

Subsidy-dependent capacity in higher-cost regions competing primarily on public funding access rather than underlying production economics, facing the narrowest margin once subsidy support eventually phases down across the project lifecycle.
Gross Margin: 8-18%

Premium / Certified Tier

Resource-advantaged export capacity in the Gulf, Australia, and Chile with signed long-term offtake contracts supporting genuine cost competitiveness against conventional grey ammonia benchmarks across most major global energy markets today.
Gross Margin: 20-32%

Sustainability / Regulatory / Next-Generation Tier

Marine fuel and European mandate-compliant volume priced against regulatory necessity, plus emerging hydrogen carrier export capacity serving energy security needs rather than fertiliser demand across most major importing economies worldwide.
Gross Margin: 18-35%
green-ammonia-market-portfolio-architecture-1787324201846

High-value Sub-segments and Strategic Watch-out

Marine Fuel

High value and high growth at 24.0%, the fastest application in the category, driven by shipping decarbonisation mandates that pull offtake contracts years ahead of vessel delivery dates worldwide today. Growing from an essentially zero base only a few years ago, remarkably quickly and consistently across most regions.
Gross Margin: 20-32%

Hydrogen Carrier and Energy Export

High value with strong growth at 20.0%, second-fastest application, using ammonia's energy density and existing shipping infrastructure to move renewable energy between resource-rich and importing economies efficiently and reliably today. Cracking costs remain a genuine technical constraint still being resolved across the industry worldwide currently.
Gross Margin: 18-35%

Fertiliser Feedstock

The volume core by revenue, growing near 12.0% as agricultural buyers pursue lower-carbon nitrogen supply under sustainability procurement commitments across major grain-producing regions worldwide today. Largest existing demand base though the slowest-growing application tracked currently, reflecting its established maturity and scale relative to newer categories.
Gross Margin: 8-18%

Power Generation Co-Firing

The strategic watch-out, growing near 15.0% and dependent entirely on utility willingness to retrofit existing coal and gas power plants for ammonia co-firing at meaningful commercial scale. Technical and economic viability remain genuinely unproven at full commercial scale across most tested facilities so far worldwide.
Gross Margin: 8-18%

How Offtake Contracts Lock In Revenue

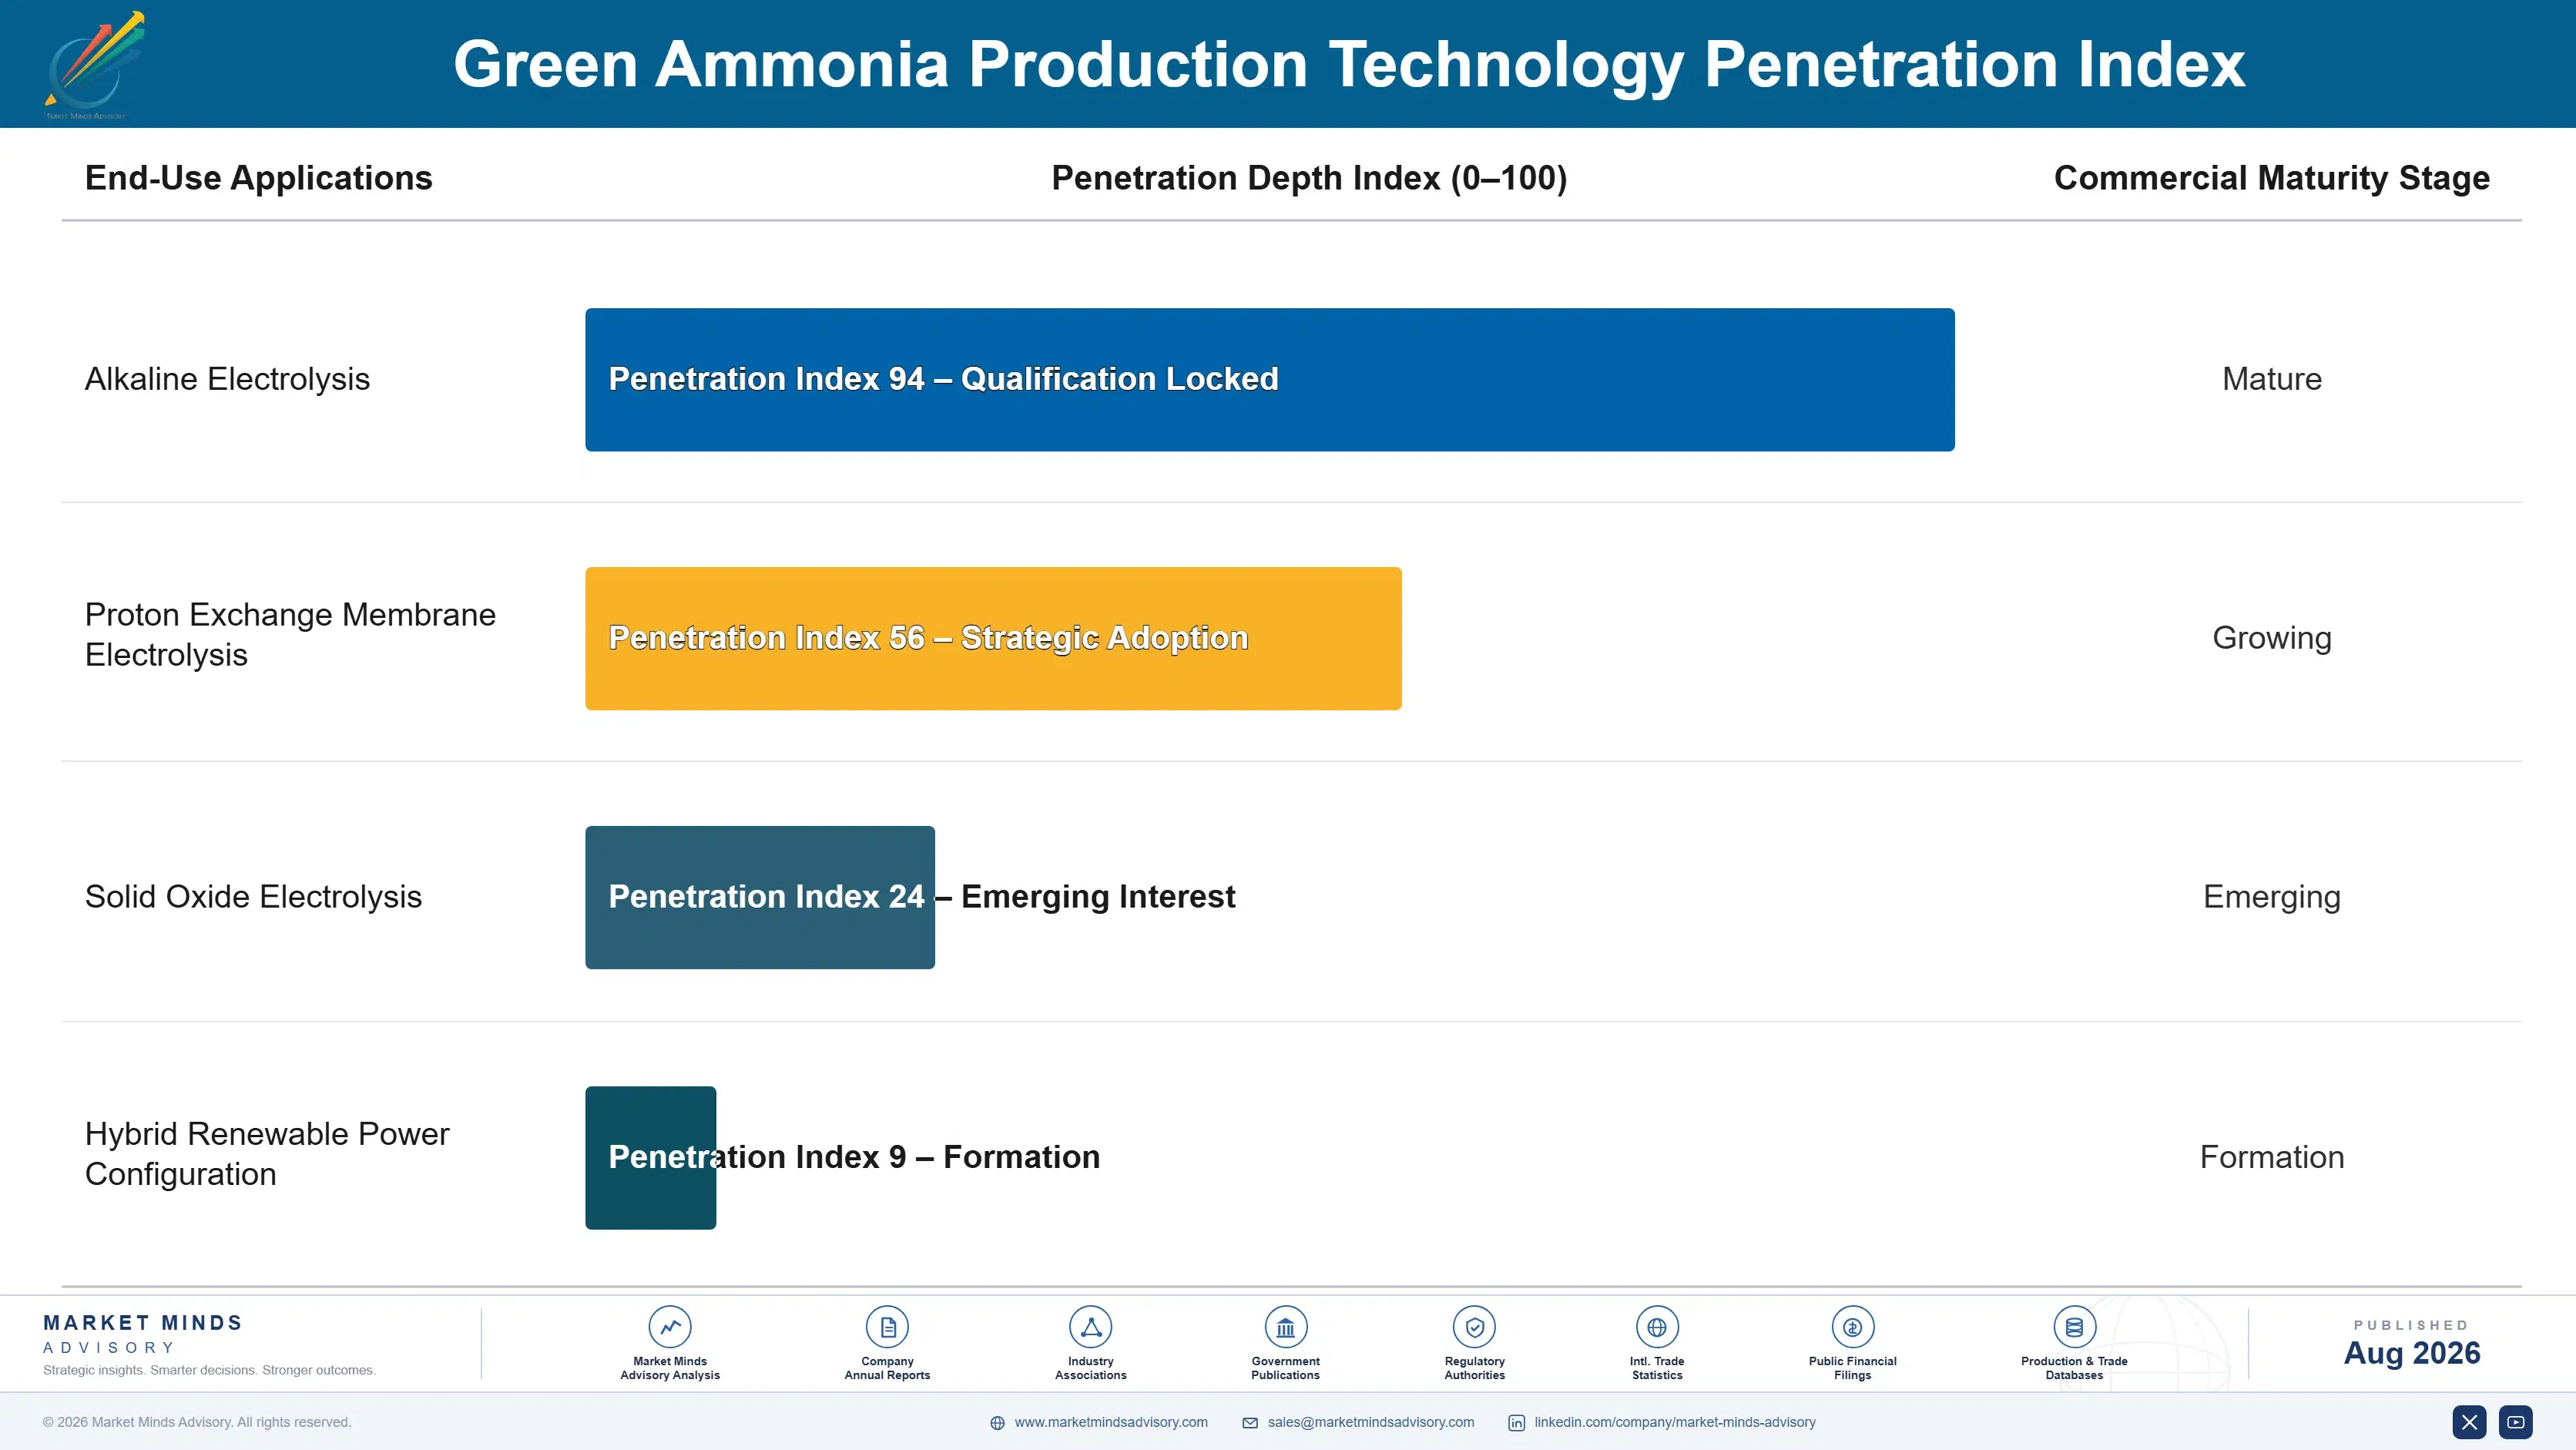
Revenue depends on contracted offtake secured years before production rather than spot market sales in nearly every project reaching financial close. A signed shipping or import offtake agreement, often running a decade or longer, gives lenders the revenue certainty construction financing requires, making offtake contracting the most valuable commercial asset a developer holds before a single tonne ships. Losing a major counterparty can delay or derail an otherwise bankable project.
Adoption depth varies sharply by end-use vertical. Shipping operators commit hardest, since regulatory compliance deadlines leave little flexibility and vessel investment cycles run decades, making early offtake contracting close to mandatory. European fertiliser and chemical buyers sit in the middle, adjusting contracted volume as mandate timelines and carbon border costs evolve. Power generation utilities remain the most tentative adopters, since co-firing economics are still being proven at scale.

Buyer profiles have shifted from agricultural cooperatives toward shipping companies, utilities, and sovereign energy planners who treat ammonia as a strategic commodity rather than solely as a fertiliser input. Japanese and Korean trading houses increasingly negotiate multi-decade import agreements resembling liquefied natural gas contracting more than commodity chemical purchasing. Sustainability officers within European industrial buyers now hold real influence over procurement decisions.
green-ammonia-market-end-use-penetration-index-1787324202761

Our Call on Green Ammonia

These are among the four positions where our research anticipates prominent divergence between winners and laggards over the coming forecast period. Each is grounded in the demand model, the regulatory perimeter, and the announced capacity pipeline.
01 / OFFTAKE DECIDES FINANCING

Contracted revenue matters more than production cost

Project financing generally requires forty to sixty-five percent of planned volume under signed offtake agreements before lenders commit capital, which means commercial success depends on securing buyers years before a single tonne ships anywhere at all. Shipping operators facing tightening emission rules have become the most reliable offtake counterparty, since their compliance deadlines leave genuinely little contracting flexibility. Developers should prioritise offtake relationships as the primary commercial asset, treating production technology and site selection as necessary but ultimately secondary considerations.
02 / SITE QUALITY SETS COST

Renewable resource quality outweighs every other input

Renewable power cost accounts for fifty-five to sixty-eight percent of total production cost, which makes site selection the single most consequential decision a developer makes, well ahead of electrolyzer technology choice or plant configuration decisions. Gulf, Australian, and Chilean sites combining exceptional renewable resources with existing port infrastructure reach cost competitiveness meaningfully faster than sites lacking either advantage simultaneously. Developers should concentrate capital on genuinely resource-advantaged locations rather than spreading investment across sites chosen mainly for proximity to existing infrastructure.
03 / SUBSIDY WINDOWS ARE FINITE

First-of-a-kind funding will not remain available indefinitely

National hydrogen strategies fund first-of-a-kind capacity through subsidies that close thirty to forty-five percent of the cost gap against grey ammonia, but these programmes carry political and budgetary risk that could alter eligibility or funding levels within a single election cycle. Developers structuring financing around current subsidy windows reach final investment decision meaningfully faster than those waiting for further cost deflation alone. Companies should treat subsidy eligibility as a time-limited resource requiring deliberate speed rather than a permanent feature of project economics.
04 / MARINE FUEL RESHAPES DEMAND

Shipping compliance timelines now dictate industry pacing

Marine fuel demand grows at 24.0% against a 16.5% overall market because shipping operators facing tightening International Maritime Organization rules must secure alternative fuel supply years before vessel delivery given how long those supply chains take to build. This demand category barely existed several years ago and now anchors a meaningful share of announced project financing across multiple regions simultaneously. Developers should track shipping regulatory timelines as closely as their own construction schedules, since marine fuel demand depends entirely on that regulatory certainty holding.

Engagement Snapshot From the Field

A live engagement with an industry participant carrying material or product regulatory and market exposure ahead of a defining policy shift, showing how our research translates into a defensible multi-year portfolio strategy.
MARKET MINDS ADVISORY · CLIENT ENGAGEMENT SUMMARY
Green Ammonia Producer Strategic Portfolio Review and Transition Roadmap 2026·Investment Scenario on Green Ammonia Exposure Evaluation 2025-26
CLIENT PROFILE
An independent renewable energy developer with three announced green ammonia projects across two continents engaged MMA to prioritise capital allocation ahead of a planned equity funding round. The client reported combined announced capacity of roughly 900,000 tonnes annually, with none of the three projects yet reaching final investment decision at the time of engagement (client-reported, unverified by MMA).
STRATEGIC CHALLENGE
Leadership had allocated development spending roughly evenly across all three projects despite meaningfully different resource quality, offtake progress, and subsidy eligibility between sites. Investors ahead of the funding round wanted evidence that capital would concentrate on the project most likely to reach financial close first. The board lacked a consistent framework for comparing sites across these very different commercial and regulatory dimensions.
MMA APPROACH
MMA benchmarked renewable power cost, water availability, and port infrastructure across all three sites against comparable operating and announced projects globally. We assessed offtake negotiation progress and subsidy eligibility windows specific to each project's jurisdiction. We then modelled financial close probability and timeline for each site under current market conditions.
KEY FINDINGS
  1. One site combined resource quality in the top quartile globally with subsidy eligibility expiring within eighteen months, creating clear urgency the client's even allocation approach had not reflected.
  2. A second site faced water availability constraints that would require desalination investment adding roughly 15% to total project capital cost beyond original estimates (client-reported, unverified by MMA).
  3. The third site had the weakest resource quality of the three but the most advanced offtake negotiations, suggesting a longer-term rather than immediate development priority.
  4. Concentrating remaining development budget on the first site improved projected financial close timeline by approximately fourteen months against the original even-allocation plan.
CLIENT PROFILE
An independent renewable energy developer with three announced green ammonia projects across two continents engaged MMA to prioritise capital allocation ahead of a planned equity funding round. The client reported combined announced capacity of roughly 900,000 tonnes annually, with none of the three projects yet reaching final investment decision at the time of engagement (client-reported, unverified by MMA).
STRATEGIC CHALLENGE
Leadership had allocated development spending roughly evenly across all three projects despite meaningfully different resource quality, offtake progress, and subsidy eligibility between sites. Investors ahead of the funding round wanted evidence that capital would concentrate on the project most likely to reach financial close first. The board lacked a consistent framework for comparing sites across these very different commercial and regulatory dimensions.
MMA APPROACH
MMA benchmarked renewable power cost, water availability, and port infrastructure across all three sites against comparable operating and announced projects globally. We assessed offtake negotiation progress and subsidy eligibility windows specific to each project's jurisdiction. We then modelled financial close probability and timeline for each site under current market conditions.
KEY FINDINGS
  1. One site combined resource quality in the top quartile globally with subsidy eligibility expiring within eighteen months, creating clear urgency the client's even allocation approach had not reflected.
  2. A second site faced water availability constraints that would require desalination investment adding roughly 15% to total project capital cost beyond original estimates (client-reported, unverified by MMA).
  3. The third site had the weakest resource quality of the three but the most advanced offtake negotiations, suggesting a longer-term rather than immediate development priority.
  4. Concentrating remaining development budget on the first site improved projected financial close timeline by approximately fourteen months against the original even-allocation plan.
RECOMMENDED STRATEGY
Phase 1: Phase 1 (0 to 6 months): Concentrate development spending and subsidy application effort entirely on the top-quartile resource site immediately. Phase 2: Phase 2 (6 to 18 months): Complete offtake negotiations and secure subsidy eligibility fully before the identified funding window closes. Phase 3: Phase 3 (18 to 36 months): Resume development on the remaining two sites using lessons and relationships built from the first.
OUTCOME
The client concentrated capital on the highest-priority site and secured subsidy eligibility within the identified window, reaching final investment decision meaningfully ahead of the original even-allocation timeline planned initially. The funding round closed successfully, with investors specifically citing the prioritisation framework as a factor (client-reported, unverified by MMA).

Frequently Asked Questions

Foundational context covering the market sizes, CAGR, scope, country, region and competition that inform every finding below. This section is provided to cover basics and most often pre-purchase conversations, answered from the MMA Primary Research Dataset.

What is the current size of the Green Ammonia Market?

The global green ammonia market is valued at USD 2.8 billion in 2025, covering ammonia produced from renewable electrolysis hydrogen for fertiliser, marine fuel, and industrial applications. Conventional grey and blue ammonia are excluded.

How large will the Green Ammonia Market be by 2036?

The market is forecast to reach USD 15.02 billion by 2036 in the base case, about 4.61 times the 2026 level. That represents incremental value of roughly USD 11.76 billion across the decade.

What is the CAGR for the Green Ammonia Market 2026 to 2036?

The market grows at a 16.5% CAGR in the base case, with bull and bear scenarios at 17.8% and 15.2%. The spread turns mainly on electrolyzer cost deflation and shipping mandate timing.

Which segment is growing fastest?

Marine fuel demand grows fastest at 24.0%, about 1.45 times the overall rate, as shipping operators secure supply years ahead of mandates. Hydrogen carrier and energy export follows at 20.0%.

Who are the major companies in the Green Ammonia Market?

Leading companies include Yara International, CF Industries, Fertiglobe, ACME Group, and CWP Global. Concentration is moderate, with the top five holding roughly 38% of announced capacity.

Which country is growing fastest?

Australia grows fastest at a 20.5% CAGR, on exceptional renewable resource quality and established export port infrastructure. India follows on national hydrogen strategy incentive funding.

Report Segmentation Architecture

The full report scope spans multiple orthogonal segmentation dimensions, with cross-tabulated demand data provided for each dimension pair. Coverage extends further to regional breakdowns, trend trajectories, and the competitive detail needed to support segment-level decision-making.

By End-Use Application

  • Fertiliser Feedstock
  • Marine Fuel
  • Power Generation Co-Firing
  • Industrial Feedstock
  • Hydrogen Carrier and Energy Export

By Production Technology

  • Alkaline Electrolysis
  • Proton Exchange Membrane Electrolysis
  • Solid Oxide Electrolysis
  • Hybrid Renewable Power Configuration

By Commercial Dimension

  • Long-Term Offtake Contract Supply
  • Merchant and Spot Market Sales
  • Subsidy-Anchored Domestic Supply
  • Export Terminal and Shipping Logistics

By Region

  • North America
  • Western Europe
  • East Asia
  • South Asia and Pacific
  • Latin America
  • Middle East and Africa
  • Eastern Europe

Scope, Methodology, and Coverage

Every figure in this report is reproducible from documented input assumptions. The scope below maps the historical period, the forecast horizon, the segmentation dimensions, and the countries covered, alongside the underlying primary and qualitative methodology.
Historical Period
2020 to 2025
Forecast Period
2026 to 2036
Base Year
2025 (USD billions; MMA Primary Research Dataset, August 2026)
Market Definition
The green ammonia market comprises ammonia synthesised from hydrogen produced by water electrolysis powered by renewable electricity combined with nitrogen from air separation, valued at production volume across fertiliser, marine fuel, power generation, and industrial feedstock end uses. Conventional grey ammonia produced from steam methane reforming of natural gas, blue ammonia produced with carbon capture, and downstream fertiliser or industrial chemical products manufactured using ammonia as an input are excluded.
Quantitative Units
USD billions (current prices); production volume in metric tons where applicable
Segmentation Dimensions
By End-Use Application; By Production Technology; By Commercial Dimension; By Region
Regions Covered
North America, Western Europe, East Asia, South Asia and Pacific, Latin America, Middle East and Africa, Eastern Europe
Countries Covered
USA, China, Germany, France, UK, Japan, South Korea, India, Australia, Canada, Brazil, Mexico, Indonesia, Vietnam, Thailand, Malaysia, UAE, Saudi Arabia, South Africa, Nigeria, Turkey, Poland, Netherlands, Italy, Spain, Sweden, Switzerland, Argentina, Colombia, Singapore, and additional markets relevant to this sector
Key Companies Profiled
Yara International, CF Industries, Fertiglobe, ACME Group, CWP Global, OCI Global, Copenhagen Infrastructure Partners, Air Products, Linde, Uniper, RWE, TotalEnergies, Fortescue, BP, Orsted, Iberdrola, Engie, Sumitomo Corporation, Mitsui, ACWA Power
Quantitative Methodology
Primary survey, n=3,800 respondents, Q4 2025, six countries; demand-side model with trade association cross-validation
Qualitative Methodology
47 expert interviews, Q4 2025; applied to validate demand model assumptions, identify emerging dynamics, and assess competitive positioning
Report Format
PDF and XLSX data workbook (Word format preview document)
Publisher
Market Minds Advisory
Report Code
MMA-2026-ENE-103
Published
August 2026
Contact
sales@marketmindsadvisory.com | www.marketmindsadvisory.com

Purchase the full Green Ammonia Market Report (2026 to 2036).

The full MMA Green Ammonia report sizes the market across five end-use applications, four production technologies, four commercial channels, and seven regions through 2036. It profiles 20 companies on a consistent announced production capacity basis, scoring each on offtake contracting depth, site resource quality, subsidy positioning, and project execution track record. Scenario models quantify how shipping decarbonisation mandates, electrolyzer cost deflation, and national hydrogen subsidy programmes move both project pipeline conversion and achievable cost by application. The report also includes site-level resource quality benchmarking, offtake contract structure analysis, and subsidy programme tracking across major jurisdictions for developer and investor strategy teams.
Five-application and four-channel market sizing to 2036
Twenty-company benchmark on announced capacity basis
Site-level renewable resource and cost competitiveness benchmarking
Offtake contract structure and financing readiness analysis
National hydrogen subsidy programme tracking across jurisdictions
Shipping decarbonisation mandate timeline and demand impact tracking

Built For The People Who Decide

From boardroom strategy to bench-side execution, this report is read cover-to-cover by leaders shaping the next decade of their industry, turning demand scenarios, market dynamics and valuation benchmarks into decisions.
CXOs/ Presidents/ VPs/ Managers
M&A and Corporate Development
Strategy Teams and R&D Heads
Procurement and Product Directors
Regulatory and Compliance Leaders
Investor Relations and Equity Analysts