Market Minds Advisory
Gravity Energy Storage Market

Gravity Energy Storage Market: Gravity Energy Storage Market: The Shaft Matters More Than The Machine

Lithium wins at four hours and everybody knows it. The argument for lifting a mass is a thirty-five year asset that never degrades, sited in a shaft somebody else already dug.

Lead Analyst

Published

September 2026

Make Smarter Decisions with Customized Research Insights

Request a free sample report and evaluate market opportunities, growth trends, and competitive dynamics relevant to your business needs.

2025 MARKET VALUE$0.4BMarket Size 2025
2036 FORECAST VALUE$1.9BBase Case , 2026 to 2036
CAGR 2026 TO 203615.4 %Bull 16.8% / Bear 14.0%
INCREMENTAL OPPORTUNITY$1.5BNet 10- year value creation
EXPANSION MULTIPLE4.20x2036 value over 2026 base
Strategic Levers
M&A Pipeline
Regional Outlook
Country Rankings
Competitive Intelligence
Segmental Deep-dive
Call-Us : 91 93563 13602

Executive Snapshot and Market Trajectory.

The case for gravity storage is not efficiency and it is not capital cost, because lithium beats it on both. It is that a mass and a winch do not degrade, so the asset cycles for thirty-five years without the augmentation capex a battery project must budget.
Decommissioned mine shaft systems grow at 23.1%, half again the market rate of 15.4%, because the shaft is the most expensive component and it has already been dug, lined and connected to a grid built for the mine's load. East Asia holds 30% of demand, and the reason is inventory rather than policy: China closed thousands of coal mines through a state capacity reduction programme and every one of them left a hole behind.
Concentration is unusually high at 62% of contracted capacity, which is what a technology looks like before anybody has built very many. The competitive question is not who wins on engineering, because the machines are broadly similar. It is who secures the shafts and the grid connections attached to them, and that is a land and permitting contest rather than a technical one. Very few developers are staffed for it.
Market Definition
The gravity energy storage market covers grid-connected systems that store electrical energy by raising a solid or dense mass and recover it by controlled descent through a generator, spanning modular tower and block systems, decommissioned mine shaft systems, rail and incline mass systems, high-density fluid hillside systems, piston and underground water column systems, and marine and subsea gravity systems. Scope is measured as installed and contracted energy capacity. Excluded are conventional pumped hydro storage, compressed air energy storage, flywheel systems, all electrochemical batteries, and mechanical storage embedded in industrial equipment.
Base Year Value
$0.4B in 2025 (MMA Primary Research Dataset, August 2026)
Forecast Period
2026 to 2036, eleven discrete annual values
CAGR
15.4% base case. Bull 16.8%. Bear 14.0%.
Fastest Growth Segment
Decommissioned Mine Shaft Systems: 23.1% CAGR
Fastest Growth Country
India: 17.6% CAGR
Fastest Growth Region
South Asia and Pacific: 17.6% CAGR
Largest Region
East Asia: 30% of 2025 global value
Market Leaders
Energy Vault, Gravitricity, Green Gravity, RheEnergise and Sink Float Solutions. Source: MMA Analysis, July 2026.
Primary Survey
n=3,800 procurement and R&D decision-makers, Q4 2025, six countries
Methodology
Demand-side build-up, cross-validated against public data, 47 expert interviews

Gravity Energy Storage Market Forecast Scenarios

gravity-energy-storage-market-size-forecast-scenario-1788193666026
Between 2020 and 2025 the sector compounded at 14.2%, and nearly all of it was demonstration rather than deployment. First commercial-scale units reached operation in China and pilot shafts were commissioned in Europe, which proved the engineering worked and proved almost nothing about the economics. The pipeline that exists today was written by developers rather than by utilities, which is the honest position.
The 15.4% base case rests on three mechanisms. Interconnection queues have become the binding constraint on storage development everywhere, and a decommissioned mine site arrives with an energised connection built for the mine's load. Duration requirements are lengthening past the four hours where lithium is unbeatable, into the six to twelve hour band where cycle life dominates cost. And mine closure programmes across China, Europe and Australia keep releasing shafts. None of the three requires a technical breakthrough.
The bull case at 16.8% turns on a utility signing a twenty-year offtake against cycle life rather than against capex, which would reprice the whole category overnight. The bear case at 14.0% is the lithium cost curve continuing down: at 8 hours the window is already narrow, and iron-air chemistry is arriving underneath it as well.

The Shaft Is The Asset

Most analysis of this technology argues about round-trip efficiency and reaches the wrong conclusion. Gravity systems recover around 80% of what goes in, against better than 90% for lithium, and on capital cost per kilowatt-hour at short duration lithium wins comfortably as well. Neither number is the argument. A mass on a cable does not lose capacity with cycling, which changes the shape of the cost curve.
TOP FIVE CONCENTRATION62%Share of contracted capacity held by five largest developers
INSTALLED SYSTEM COSTUSD 245/kWhCapital cost per unit of energy storage capacity
ROUND-TRIP EFFICIENCY80%Energy recovered relative to energy consumed lifting the mass
DESIGN CYCLE LIFE35 yearsOperating life achieved without capacity fade or cell replacement
TYPICAL DISCHARGE DURATION8 hoursMedian rated duration across contracted and announced project pipeline
SHAFT REUSE SAVING38%Capital reduction from siting inside an existing mine shaft
A lithium project cycling daily budgets augmentation capex, replacing cells as capacity fades, and the schedule for that sits in every financial model in the industry. A gravity system has nothing to augment. The design life is 35 years and the maintenance is winch, cable and bearing work that hoisting engineers have done for a century. Whether a utility will price that difference is an open question.
The siting question decides more than the engineering does. Sinking a shaft costs more than everything that goes inside it, so a system built in an existing mine shaft removes roughly 38% of capital cost before anything else happens. The shaft also arrives with a grid connection sized for the mine's load and already energised, and interconnection is now the constraint that kills storage projects.
"Everybody argues about round-trip efficiency and nobody asks what the asset is worth in year twenty-five, when the lithium next door is on its third set of cells. The developers who win will be the ones who found the shafts first, not the ones with the best drive train."
Director, Long Duration Storage Practice · MMA Energy Practice · August 2026

Market Trends

Interconnection queues made existing grid connections valuable

Grid interconnection has replaced capital cost as the binding constraint on storage development across North America, Europe and Australia, with queue waits running years rather than months. A decommissioned mine arrives with a connection built to carry the mine's own load, already energised and already studied, which removes the single longest item from a development schedule. That is worth more than any efficiency advantage a competing technology can offer, and it explains why decommissioned shaft systems grow at 23.1% against a market rate of 15.4% rather than anything about the machines themselves.
Market Impact: Removes 38% of capital cost

Duration requirements moved past lithium's strongest band

Storage procurement has shifted from two and four hour products toward six, eight and twelve hour requirements as renewable penetration rises and evening ramps lengthen. Lithium remains unbeatable at four hours and its advantage narrows steadily as duration extends, because adding hours means adding cells while a gravity system adds only mass and height. Median rated duration across the contracted gravity pipeline now sits at 8 hours. The technology has no case at all below that point, which is a boundary the industry states far less often than it should.
Market Impact: Delivers 35 years without fade

Market Opportunities and Growth Drivers

Mine closure programmes keep releasing usable shafts

China's coal capacity reduction programme closed thousands of mines and left the shafts behind, and European and Australian closure programmes have done the same on smaller scales. Each shaft represents the most expensive part of a gravity system already dug, lined and proven sound, at no acquisition cost to a developer who reaches the site first. Siting inside one removes roughly 38% of capital cost. The supply is finite, geographically fixed and being claimed now, which makes this a land acquisition contest that most developers are not organised to fight.
Market Impact: Eliminates durations under 6 hours

Cycle life without degradation changes lifetime economics

A mass raised and lowered on a cable loses no capacity, which means a gravity asset delivers the same energy in year thirty-five as it did on the first day. Lithium projects budget augmentation capex against a fade curve and replace cells partway through the term, and that schedule sits inside every storage financial model built today. Removing it changes lifetime cost more than any efficiency difference does. Whether a utility will price a thirty-five year asset properly is the question this whole sector turns on. Very few have been asked to.
Market Impact: Adds 300 basis points cost

Market Restraints and Challenges

Lithium costs fell faster than anybody modelled

Lithium-ion pack and system costs have fallen far enough that gravity storage has no economic case at all below roughly six hours of duration, which removes the largest and most liquid part of the storage procurement market from consideration entirely. The root cause is manufacturing scale in an industry gravity storage cannot match, since a shaft and a winch are civil works rather than production line output. Commercial impact is a narrow addressable window. Participants are responding by targeting long duration tenders specifically, pursuing sites with existing connections, and pricing against thirty-five year cycle life rather than against installed capex.
Market Impact: Removes years from 1 schedule

Nobody has financed one at full scale

Project finance for storage prices against a track record, and gravity storage has demonstration units rather than a fleet with twenty years of operating data behind it. The root cause is circular: lenders want performance history, performance history requires financed projects, and the first mover carries a cost of capital that makes its own economics look worse than they are. Commercial impact is a financing premium of several hundred basis points. Mitigation runs through development bank participation, utility balance sheet ownership, insurance-backed performance guarantees and hoisting equipment suppliers standing behind availability.
Market Impact: Targets 8 hour duration requirements
3 additional market trends, 4 additional growth drivers, and 2 additional restraints and challenges are covered in the full report. Contact sales@marketmindsadvisory.com to access the complete intelligence.

Segment CAGR and Growth Architecture

Segmentation follows system architecture, the dimension on which siting requirement, capital cost and permitting pathway all move together. Tower and rail systems can be built anywhere and pay full civil cost for the privilege. Shaft and hillside systems depend on geography somebody else already created, which is why they carry the growth and the whole contest with it.
gravity-energy-storage-market-market-share-analysis-1788193666579

Decommissioned Mine Shaft Systems

Decommissioned mine shaft systems grow at 23.1%, half again the market rate of 15.4%, because two of the three expensive problems in this technology are already solved before a developer arrives. The shaft is dug, lined and proven, which removes roughly 38% of capital cost. The grid connection was built to carry the mine's load, is already energised and already studied, which removes the interconnection queue that now kills more storage projects than economics does. What remains is a winch, a drive and a mass. The supply of suitable shafts is finite and geographically fixed, so this segment is a land acquisition contest dressed up as an engineering one. Very few developers see it that way.
CAGR 23.1%

Modular Tower and Block Systems

Modular tower and block systems at 18.6% solve the problem the shaft approach cannot, which is that a shaft has to already be there. A tower can be built wherever a grid connection and a foundation exist, which makes the addressable geography effectively unlimited and the capital cost considerably higher, since the developer pays for the entire height rather than inheriting it. Modularity is the genuine advantage: blocks and hoists ship in containers and assemble on site, so the supply chain looks like manufacturing rather than civil engineering. The first commercial-scale units of this type reached operation in China, and their performance data is what the whole category is currently being judged against.
CAGR 18.6%
Full segment breakdown across 6 segments available in the complete report.

Regional Architecture and Country Demand Map

East Asia takes 30% because China closed thousands of coal mines and left the shafts standing, then built more grid storage than anywhere else. South Asia grows fastest. Western share reflects interconnection pain rather than any technology preference. Nothing about any of this is evenly distributed.

East Asia

Two things happened here at once and together they explain the position. A state coal capacity reduction programme closed thousands of mines across Shanxi, Inner Mongolia and the northeast, leaving an inventory of deep shafts larger than the rest of the world holds combined. Separately, provincial mandates requiring renewable projects to pair with storage created grid-scale demand at a volume no other market approaches. The first commercial-scale gravity units reached operation in Jiangsu, which means the operating data the whole category is judged on was generated here. Chinese hoisting and drive manufacturing supplies the mechanical content at costs Western developers cannot match on any component. That combination is not reproducible anywhere else at all.
Share: 30% | CAGR: 16.6% (2026 to 2036)

North America

Interconnection queues rather than technology preference drive interest here, and the frustration behind that is genuine. Storage developers wait years for connection studies while projects with existing energised connections move immediately, which makes a closed Appalachian or Western coal mine considerably more valuable than its geology suggests. Federal investment tax credit treatment applies to standalone storage regardless of technology, so the fiscal support is present without being specific. Utility procurement is moving toward longer durations as solar penetration rises in California and Texas. The obstacle is financing rather than policy: no American lender has yet underwritten one of these at full commercial scale. Somebody will, and the terms they set will price the whole sector.
Share: 24% | CAGR: 15.0% (2026 to 2036)
Regional intelligence for 5 additional markets available in the complete report: Western Europe, South Asia and Pacific, Latin America, Middle East and Africa, Eastern Europe. Contact sales@marketmindsadvisory.com.
gravity-energy-storage-market-country-cagr-analysis-1788193667103

Four Moves While Sites Remain

None of these four requires the technology to improve, which is fortunate, because the machines are broadly similar and nobody is going to win on drive train design. Each works with what is genuinely scarce here: shafts with live grid connections, patient capital, and a utility willing to price an asset over a thirty-five year term.

Option the shafts before anybody values them

The supply of deep shafts with live grid connections is finite, geographically fixed and currently priced at close to nothing, because the parties holding them regard the liability as a cost rather than the connection as an asset. Siting inside one removes roughly 38% of capital cost and removes the interconnection queue that now kills more storage projects than economics does. Options cost a fraction of a project and expire harmlessly if the technology stalls. Three or four developers understand this and the rest are still refining drive train designs. That will not age well.
Market Impact: Locks in a 38% capital cost reduction early

Price the asset across thirty-five years

Storage procurement compares installed capex per kilowatt-hour, which is the one metric on which this technology loses to lithium at every duration below six hours. A gravity asset delivers the same energy in year 35 as on day one, while a lithium project budgets augmentation capex and replaces cells partway through its term. Presenting levelised cost across the full life rather than installed capex changes the comparison completely, and it is a commercial decision rather than a technical one. Almost every developer still leads with the capex number. Which is a choice, not a constraint.
Market Impact: Compares cost across a full 35 year life

Sell the connection, not the storage

Interconnection queues run years rather than months across North America, Europe and Australia, and that wait now decides which storage projects exist rather than which ones pencil. A closed mine arrives with a connection built for colliery or mining load, already energised and already studied. A developer marketing that connection to a utility is selling schedule certainty rather than a technology, which reaches a completely different buyer inside the same organisation. Utilities pay for time in a way they will not pay for 80% round-trip efficiency. Almost nobody frames the conversation that way.
Market Impact: Removes about 3 years from the project schedule

Bring the hoisting suppliers onto the guarantee

Project finance prices this technology at a premium of roughly 300 basis points because no fleet exists with twenty years of operating data behind it, and that premium makes the economics look worse than the engineering warrants. The mechanical content is winch, cable, drive and bearing work that hoisting manufacturers have warranted in mining for a century. Bringing those suppliers onto an availability guarantee transfers the performance question to a party with a track record, which is exactly what a lender is actually asking for. Nobody has yet structured one that way.
Market Impact: Cuts roughly 300 basis points off the financing cost

Who Controls the Margin Pool

CR5 stands at 62% of announced and contracted capacity in megawatt-hours, which is the only basis on which these participants can be compared, since none of them reports meaningful revenue. That figure describes a technology before deployment rather than a consolidated industry. The gap between the leader and the rest is a gap in projects reached rather than in engineering achieved. Those are different things entirely.
Competition runs on site control, financing access and utility relationships. Site control decides who can build at 38% below the cost everybody else pays. Financing access decides who builds at all, because the first commercial project carries a premium that a well capitalised participant absorbs and a startup does not. Utility relationships decide whether anyone will price a thirty-five year asset properly. Engineering differentiation decides nothing.

Rankings will move when the first full-scale project outside China reaches commercial operation and produces two years of availability data. Everything in this sector is priced on an absence of evidence. The participant that closes that gap first sets the financing terms for everybody who follows. The pressure comes from lenders rather than competitors, which is not a contest engineers win. Engineers were not hired for that.
gravity-energy-storage-market-company-positioning-matrix-1788193667629

Competitive Moat and Risk Dimensions

ENERGY VAULT

Moat: Only fleet with operating data

Commercial-scale units reaching operation in China give the group the only multi-year performance record in the category, and every lender evaluating this technology is looking at that data because nothing else exists. Operating history cannot be engineered or acquired, only accumulated. Competitors are several years behind on the one asset that actually decides financing terms.
ENERGY VAULT

Risk: Greenfield siting carries full cost

A tower built on flat ground pays for its entire height in civil works and steel, which is the cost line shaft reuse removes almost completely. Competing against a developer holding an existing shaft means competing on a cost base roughly 38% higher, using broadly similar machinery. Engineering quality does not close a gap of that size.
GRAVITRICITY

Moat: Shaft engineering and site relationships

Deep experience in shaft assessment, winding gear and mine reopening consent gives the group a working position with mine owners and closure authorities that a storage developer approaching from the energy side does not have. Those relationships decide site access years before any procurement happens. Building them requires mining credibility rather than energy credibility.
GRAVITRICITY

Risk: Capital base limits project scale

First commercial projects in this technology carry a financing premium of several hundred basis points, which a utility balance sheet absorbs and a development company cannot. Holding good sites without the capital to build on them invites a larger participant to acquire the position rather than compete for it. Site control without funding is a temporary advantage.

Players Tracked

Prominent Players

Energy Vault
Gravitricity
Green Gravity
RheEnergise
Sink Float Solutions

Other Key Players

ARES North America
Heindl Energy
Gravity Power
China Tianying
Atlas Renewable
China Energy Engineering Corporation
Enel Green Power
EDF Renewables
Korea Electric Power Corporation
Siemens Energy
ABB
WEG
Liebherr
Konecranes
Vinci Construction

Recent Developments

MARCH 2025

Chinese commercial unit published first full-year operating data

The first commercial-scale gravity storage unit in China completed a full year of grid operation and its availability and round-trip performance data entered the public record. Lenders evaluating the technology now have one operating reference rather than none, which is a small number that changes financing conversations considerably.
Signal: One year of real operating data is worth more here than a decade of engineering studies.
JULY 2025

Australian state funded mine shaft feasibility programme

An Australian state government funded feasibility work on gravity storage in decommissioned hard rock shafts, a direct grant rather than any equity stake or joint venture. The programme targets sites where transmission built for mining load remains energised, which is the specific combination that makes the economics work.
Signal: Public money is going to site assessment rather than to technology, which is the correct instinct.
NOVEMBER 2025

European developer secured options on Silesian colliery shafts

A European developer secured long-term options on several Silesian colliery shafts scheduled for closure, at costs a fraction of a single feasibility study. The sites carry energised grid connections built for colliery load and sit inside a transition funding programme designed to create employment on former mining land.
Signal: The land contest is running years ahead of the procurement, and almost nobody is competing in it.

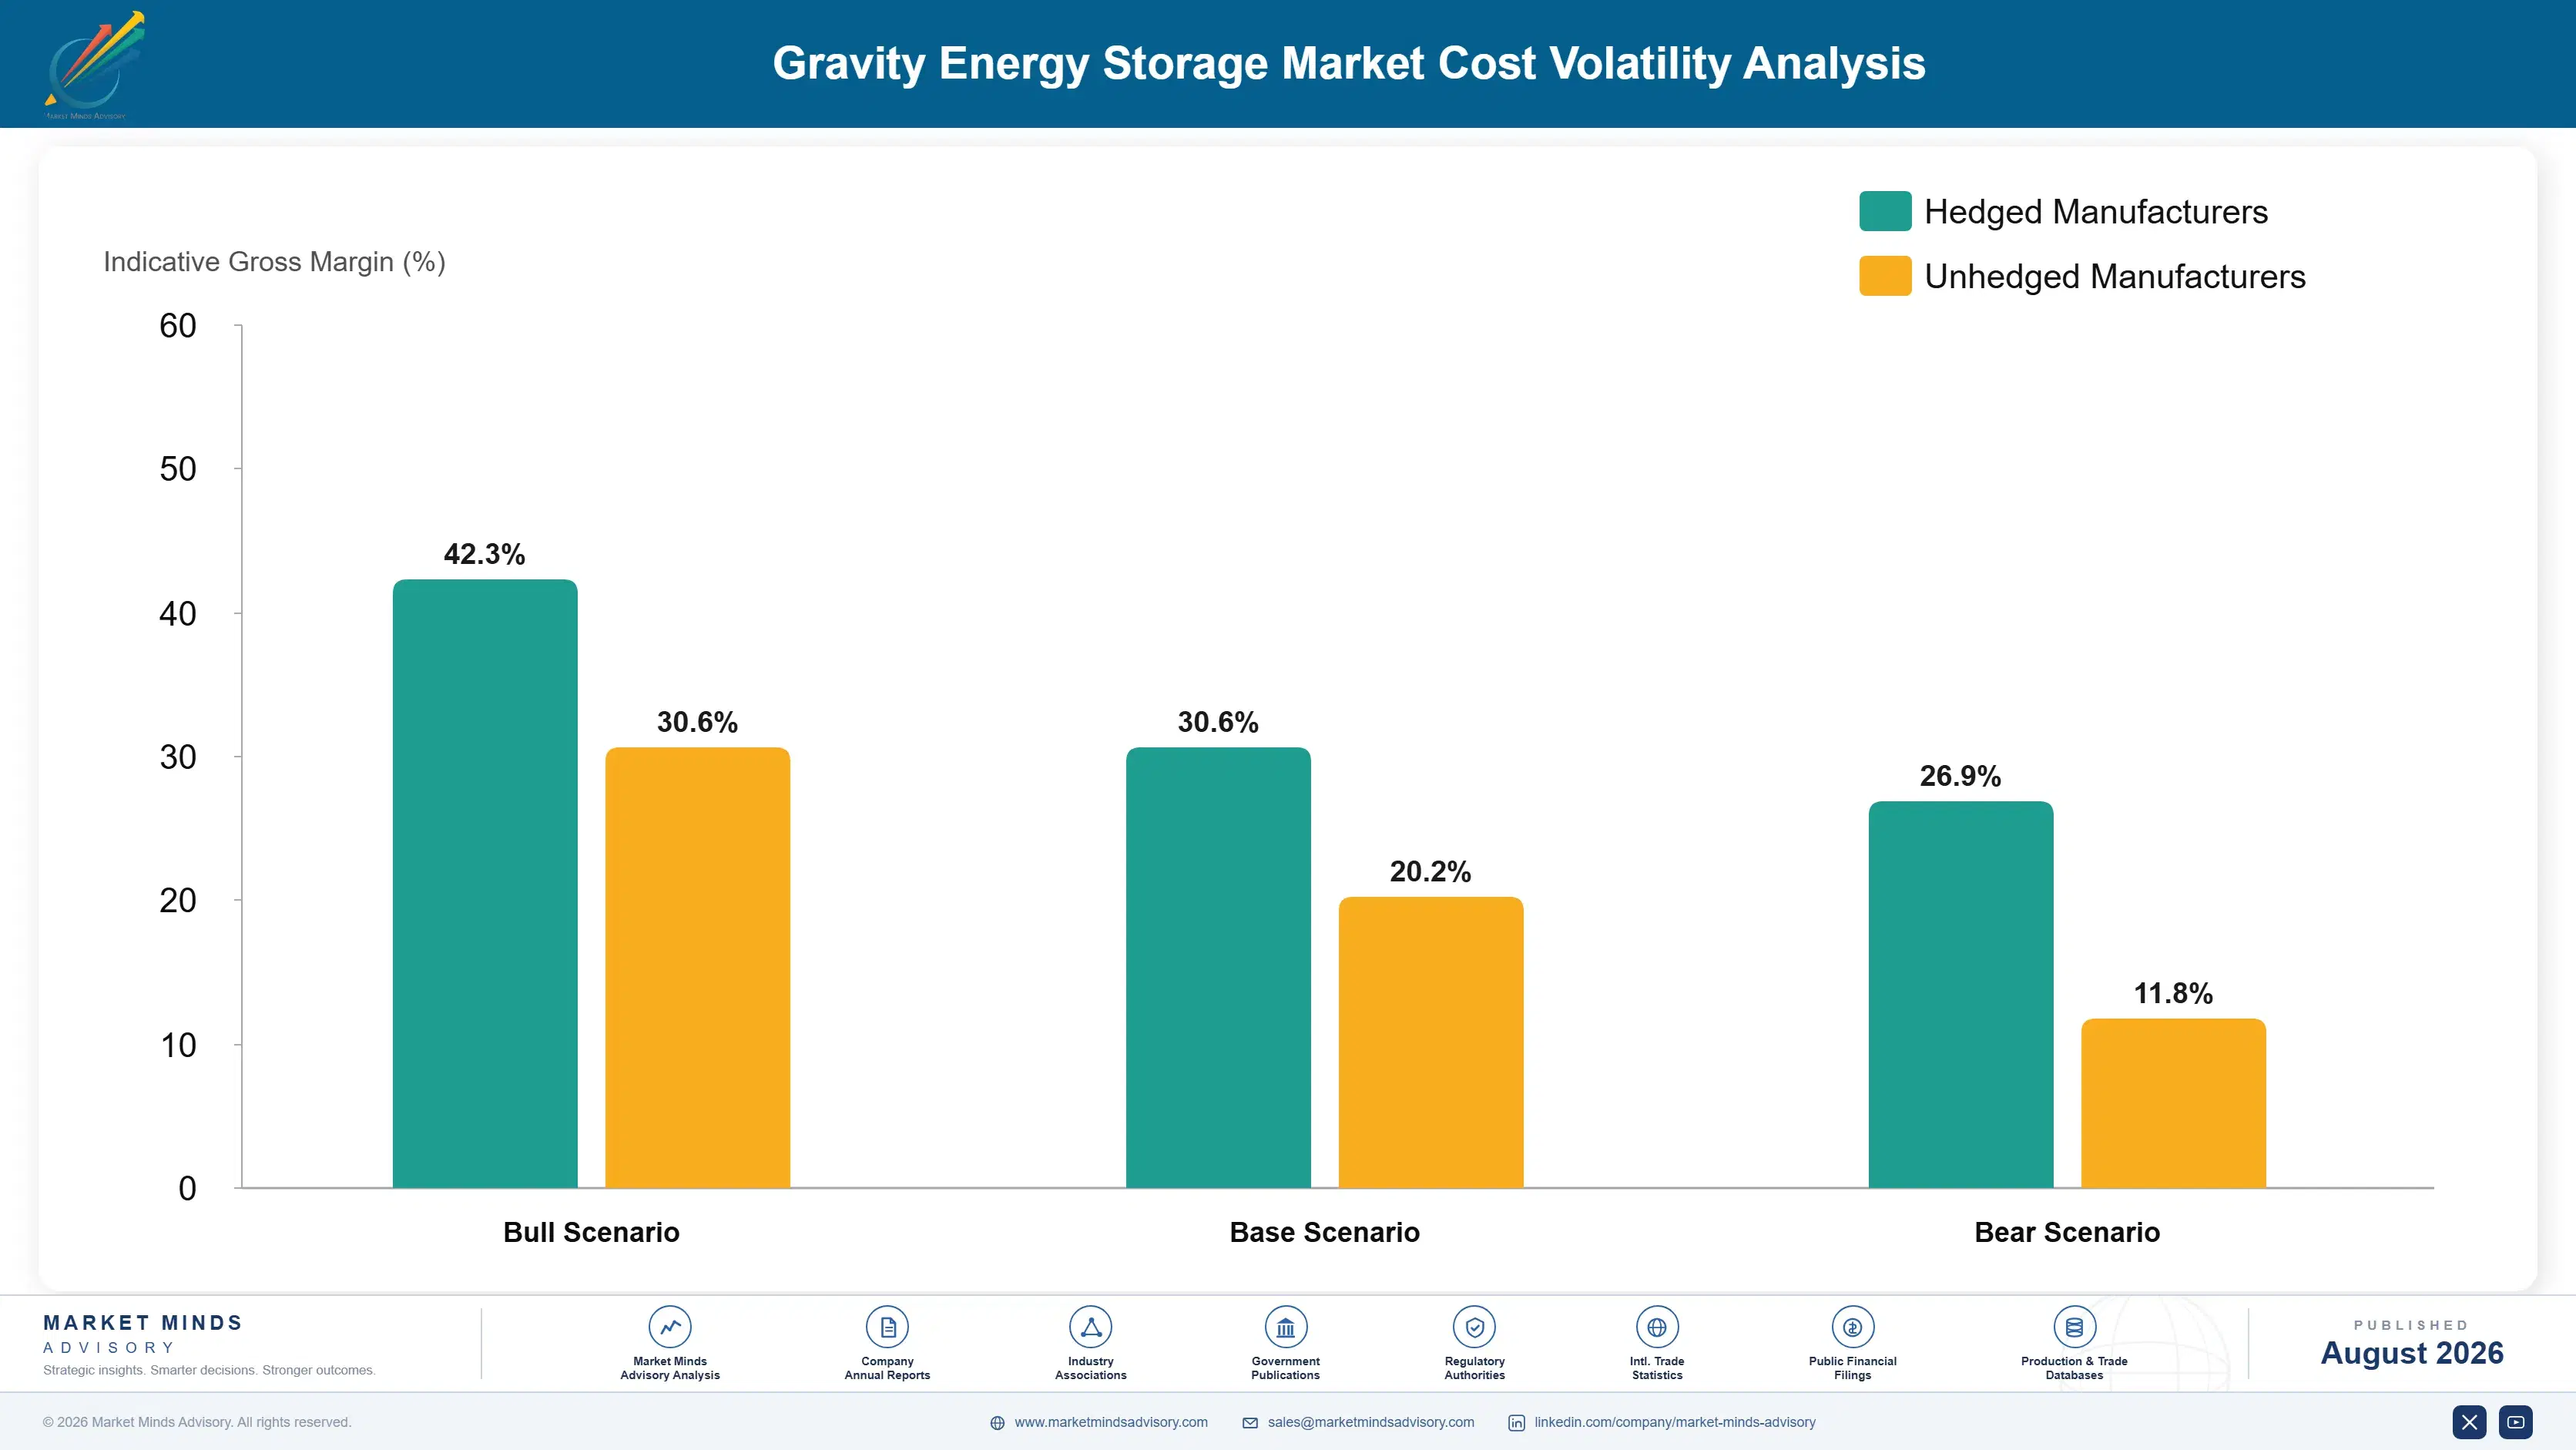
Steel, Concrete And Civil Works

Civil works and shaft preparation account for roughly 41% of installed cost on a new-build system, steel and concrete for the mass a further 19%, and the drive train, cable and power electronics around 27%. Steel and cement come from regional producers priced off energy and freight. The hoisting content comes from a narrow set of mining equipment manufacturers, European and Chinese.
Cement and steel pricing through the European energy crisis showed how exposed a civil-heavy technology is. The International Energy Agency documented the scale of industrial energy price movement across 2022, and cement production costs moved with it because kilns run on gas and coal. Projects with fixed-price construction contracts held their budgets. Those pricing civil works at tender absorbed increases that pushed several demonstration schemes past the point where any lender would proceed.

Exposure varies by siting rather than by procurement skill. A shaft reuse project barely touches the civil cost line that dominates a new-build system, which is why the same technology can look economic in Silesia and impossible on flat ground nearby. Developers without site control are competing on a cost base they cannot influence. Nothing about better purchasing closes that gap at all.
gravity-energy-storage-market-cost-volatility-analysis-1788193667825

Fix construction cost before financial close

Civil works are 41% of installed cost on a new-build system and cement and steel both move with industrial energy pricing, as the last European energy cycle demonstrated. A fixed-price construction contract costs a contingency premium and removes the line most likely to push a project past what a lender will accept. Several demonstration schemes learned this expensively.

Site inside an existing shaft wherever possible

Shaft reuse removes roughly 38% of capital cost and barely touches the civil line that dominates a new-build system, which is the largest cost lever available in this technology. It also removes the interconnection wait. The constraint is that suitable shafts are finite and geographically fixed, so the lever is available only to developers who secured sites.

Transfer availability risk to hoisting suppliers

The mechanical content is winch, cable, drive and bearing work that mining equipment manufacturers have warranted for a century, and those firms carry balance sheets and track records that a storage developer does not. An availability guarantee from them answers the question a lender is actually asking, and it costs less than the financing premium it removes.

Portfolio Architecture for Margin Defence

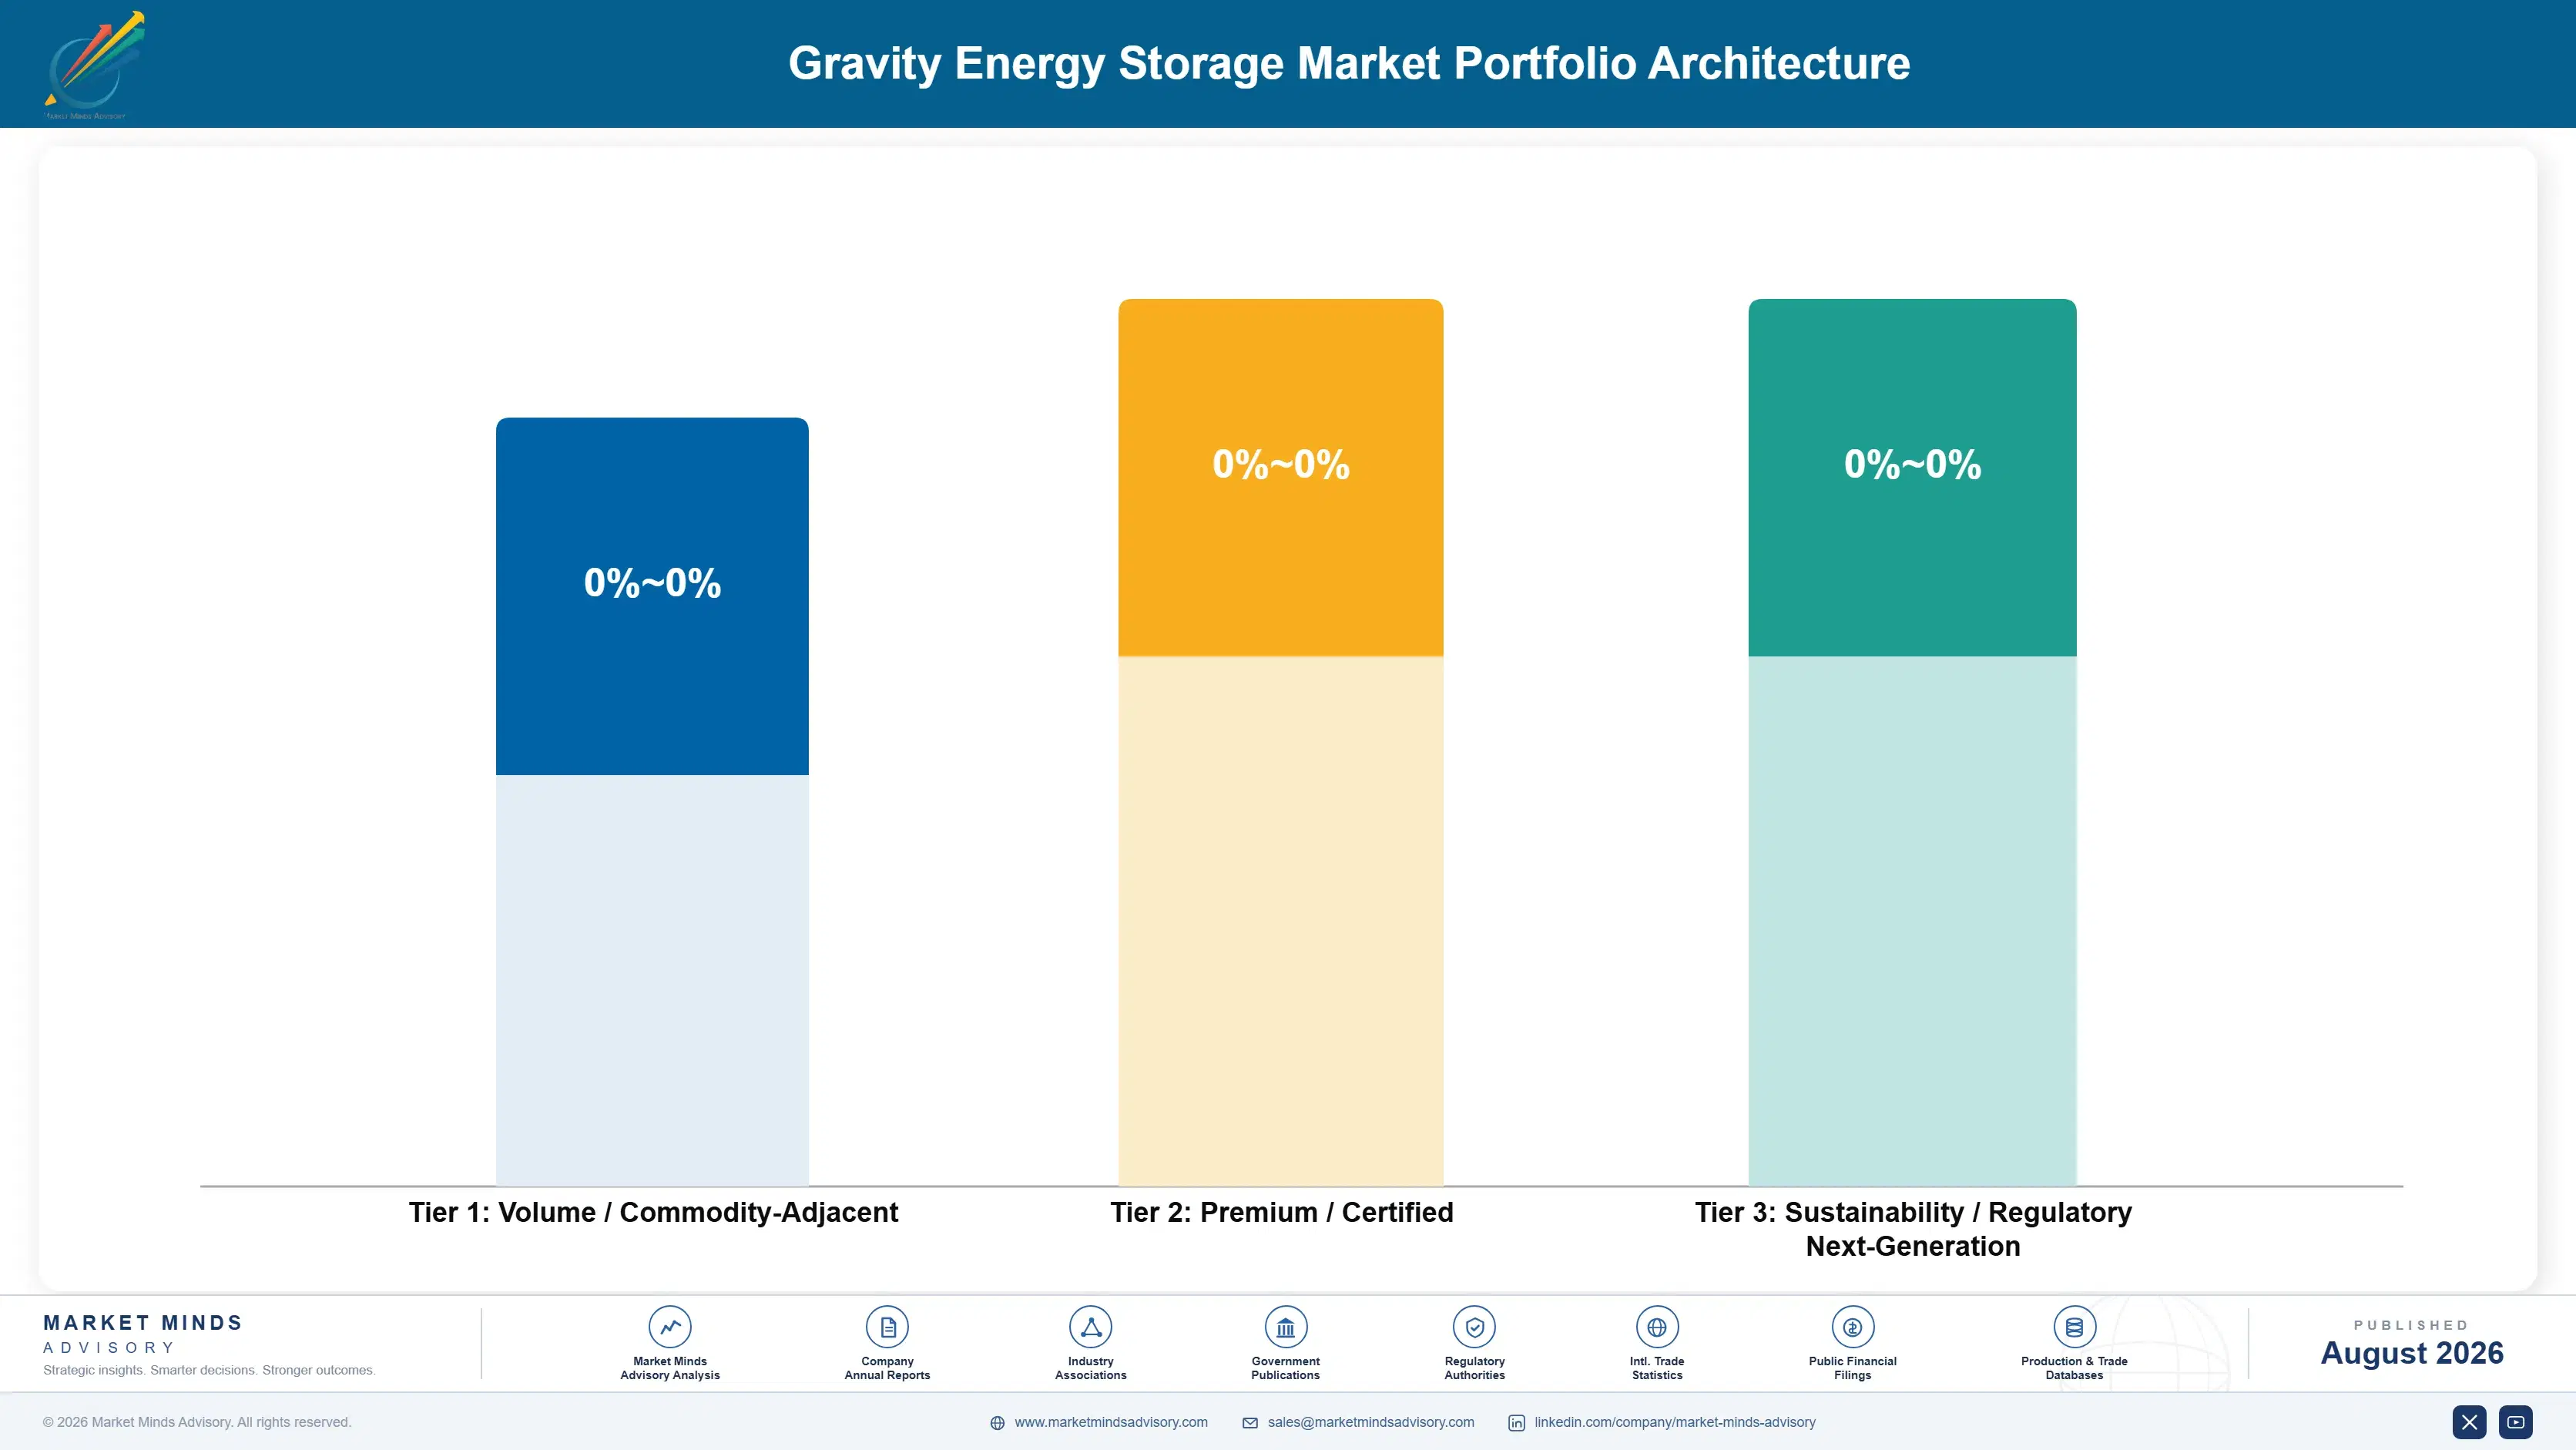
Margin here follows site quality rather than engineering, which is not how any of these businesses present themselves. A project inside an existing shaft with a live connection earns a return a new-build tower on flat ground cannot approach, using identical equipment and almost identical software. Participants costing by site rather than by system run a completely different business from those still selling a technology at all.
Volume and premium pull against each other through the site pipeline rather than the factory. New-build tower projects can be signed anywhere and they build the operating record that makes everything else financeable, at returns that barely justify the effort. Shaft projects earn properly and there are only so many of them. Running only the shafts means too few projects to prove anything to a lender.

High-value pools sit in shaft site control, in long-term service contracts and in licensing the system to regional partners. The third is the one nobody prices properly: a developer with proven engineering and no capital can reach markets it will never build in, and Chinese deployment happened through exactly that route. Licensing earns less per project and reaches considerably more of them than building ever will.

Volume / Commodity-Adjacent

New-build tower and rail projects on greenfield sites, competing directly against lithium on installed capital cost per kilowatt-hour. Margins are thin because the developer pays for the full civil scope. The 9 point spread reflects whether construction is self-performed or subcontracted at tender.
Gross Margin: 12 to 21%

Premium / Certified

Shaft reuse projects with existing energised grid connections, where inherited civil works and interconnection remove the two costs that decide viability. Site control rather than engineering supports the return. The 9 point spread reflects shaft depth and the condition of the existing lining.
Gross Margin: 28 to 37%

Sustainability / Regulatory / Next-Generation

Technology licensing to regional partners, long-term service agreements and system integration supplied to third-party developers. Margins are high because capital intensity sits with somebody else. The 18 point spread separates licensing income from service contracts and integration work, which behave very differently.
Gross Margin: 40 to 58%
gravity-energy-storage-market-portfolio-architecture-1788193668318

High-value Sub-segments and Strategic Watch-out

Decommissioned Mine Shaft Systems

High value and high growth at 23.1%. Inherited civil works and a live grid connection remove the two costs that decide whether a project happens, and the site supply is finite. The 8 point spread reflects shaft condition and remediation liability inherited alongside the site.
Gross Margin: 34 to 42%

Modular Tower and Block Systems

High value with strong growth at 18.6%. It can be built anywhere, which makes the addressable geography unlimited and the capital cost considerably higher than shaft reuse. The 8 point spread reflects whether blocks are manufactured internally or simply sourced from regional concrete suppliers instead.
Gross Margin: 20 to 28%

Rail and Incline Mass Systems

The volume core of the greenfield tier. It earns modestly and it builds the operating record that makes everything else financeable, which is worth more than the margin. The 8 point spread reflects gradient and the length of track required per megawatt-hour of rated capacity.
Gross Margin: 16 to 24%

Marine and Subsea Gravity Systems

The strategic watch-out. Subsea buoyancy and seabed mass concepts remain at demonstration stage with marine installation costs nobody has proven at scale. The 26 point spread separates coastal shallow-water schemes from deep offshore concepts that may never reach commercial operation at all in actual practice.
Gross Margin: 8 to 34%

Who Signs A Thirty-Five Year Deal

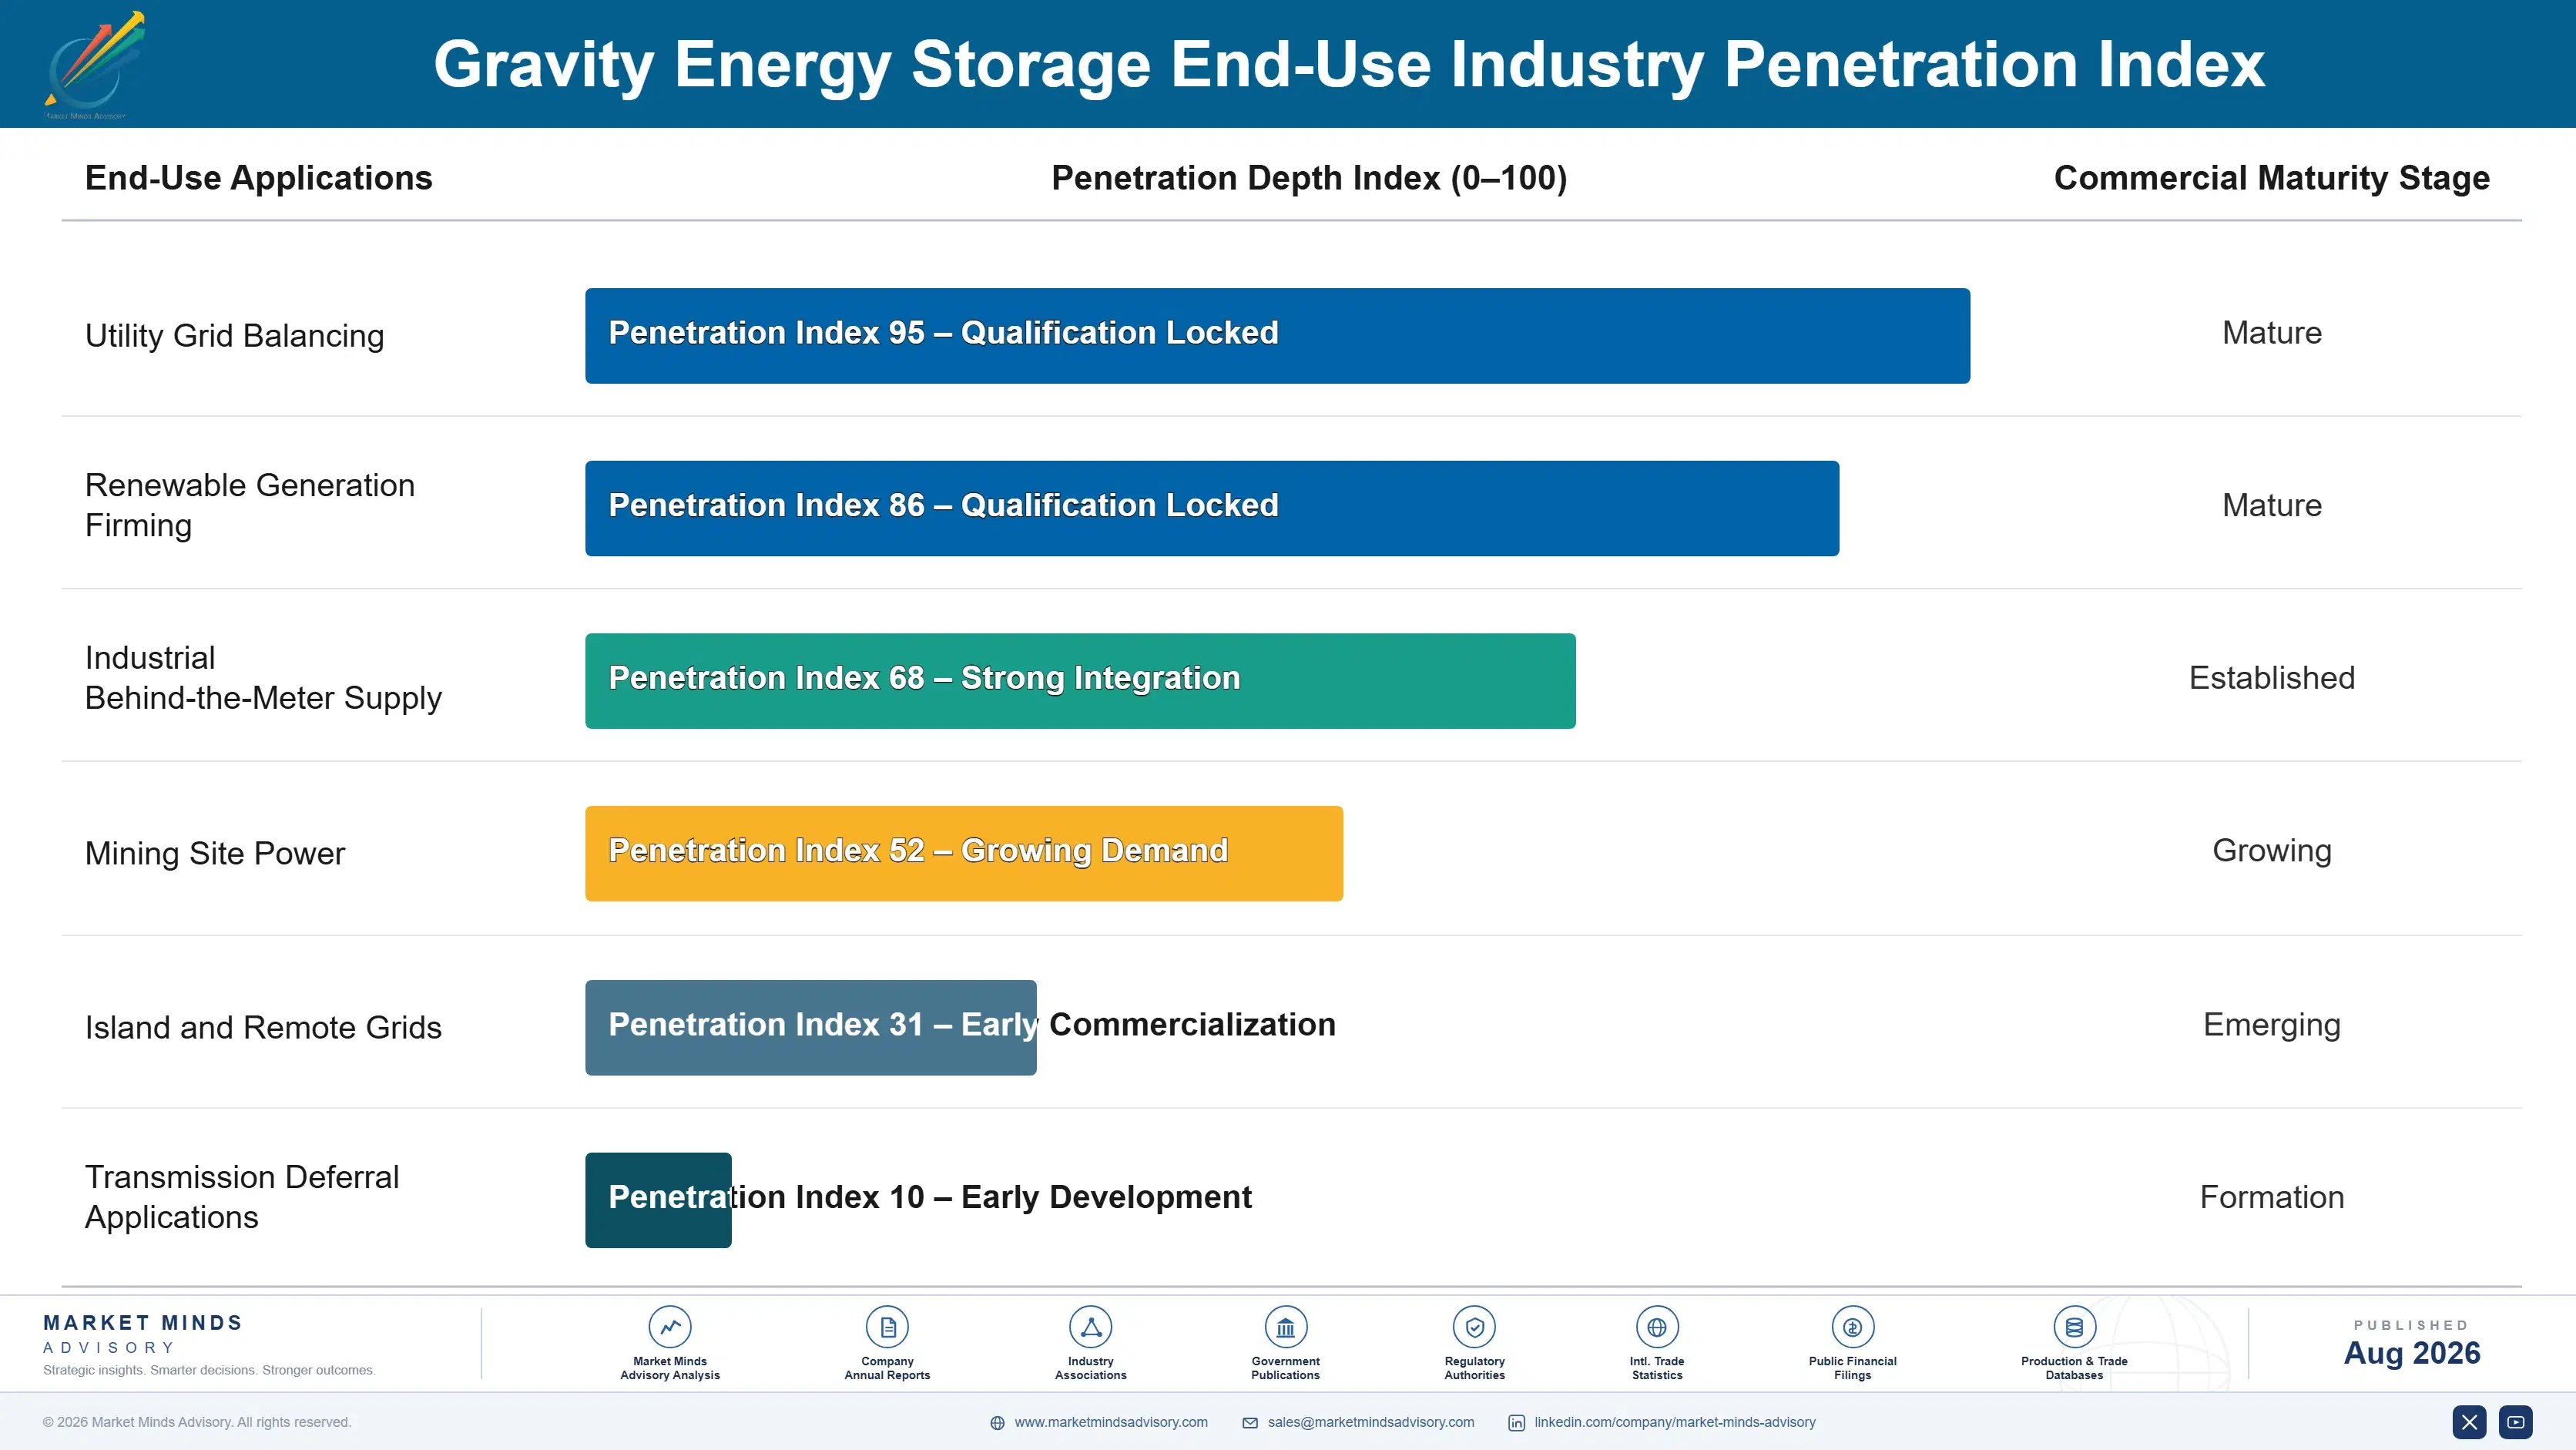
The annuity here is unlike anything in the battery world because the asset does not decay. A gravity system signed on a twenty-year offtake delivers identical performance in the final year, so the revenue line is genuinely flat rather than modelled with a fade curve underneath it. Service revenue runs alongside at low intensity, since the maintenance is mechanical inspection rather than any cell replacement.
Adoption depth varies enormously by buyer type rather than by geography. A vertically integrated utility owning generation and network can value a thirty-five year asset properly, because it holds the balance sheet that long. An independent developer selling into a fifteen-year offtake cannot, and prices accordingly. Mining companies with closure liabilities form a third buyer type entirely, valuing the site solution as much as the storage.

Buyer profiles have shifted from engineering departments toward development and land teams, and almost nobody has restaffed for it. Ten years ago this technology was evaluated by people asking about round-trip efficiency. Today the decisive conversation is with whoever controls a shaft and its grid connection, which is a landowner, a mining company or a regional government rather than an engineer. Most developers still hire engineers.
gravity-energy-storage-market-end-use-penetration-index-1788193668818

What Decides This Sector

These are among the four positions where our research anticipates prominent divergence between winners and laggards over the coming forecast period. Each is grounded in the demand model, the regulatory perimeter, and the announced capacity pipeline.
01 / SHAFT SITE CONTROL

Option the sites before anybody prices them

The supply of deep shafts with live grid connections is finite, geographically fixed and currently priced at close to nothing, because the parties holding them treat the liability as a cost rather than the connection as an asset. Siting inside one removes roughly 38% of capital cost and removes the interconnection queue that now kills more storage projects than economics does. Options cost a fraction of a project, expire harmlessly if the technology stalls, and three or four developers have understood this.
02 / LIFETIME COST PRESENTATION

Argue the thirty-five year number, not the capex

Storage procurement compares installed capital cost per kilowatt-hour, which is the single metric on which this technology loses to lithium at every duration below six hours and will keep losing indefinitely. A gravity asset delivers the same energy in year 35 as on day one, while a lithium project budgets augmentation capex and replaces cells partway through the term. Presenting levelised cost across the full life changes the comparison completely, and almost every developer still leads with the capex number instead.
03 / INTERCONNECTION SCHEDULE SELLING

Sell the grid connection, not the storage

Interconnection queues run years rather than months across North America, Europe and Australia, and that wait now decides which storage projects exist rather than which ones simply pencil out on paper. A closed mine arrives with a connection built for colliery load, already energised and already studied, which is schedule certainty rather than a technology. That reaches a completely different buyer inside a utility, and utilities pay for time in a way they will never pay for 80% round-trip efficiency.
04 / AVAILABILITY RISK TRANSFER

Put the hoisting suppliers behind the guarantee

Project finance prices this technology at a premium of roughly 300 basis points because no fleet exists with twenty years of operating data behind it, and that premium makes the economics look considerably worse than the engineering warrants. The mechanical content is winch, cable, drive and bearing work that mining equipment manufacturers have warranted for a century on balance sheets a developer cannot match. Bringing them onto an availability guarantee answers what the lender is actually asking, and nobody has structured one.

Engagement Snapshot From the Field

A live engagement with an industry participant carrying material or product regulatory and market exposure ahead of a defining policy shift, showing how our research translates into a defensible multi-year portfolio strategy.
MARKET MINDS ADVISORY · CLIENT ENGAGEMENT SUMMARY
Gravity Energy Storage Producer Strategic Portfolio Review and Transition Roadmap 2026·Investment Scenario on Gravity Energy Storage Exposure Evaluation 2025-26
CLIENT PROFILE
A European vertically integrated utility with generation, network and supply businesses across four countries, operating a renewable portfolio approaching nine gigawatts and facing evening ramp requirements its existing four hour battery fleet could not cover (client-reported, unverified by MMA). Management had been asked to identify long duration options without committing to unproven technology. The board had already rejected two hydrogen proposals.
STRATEGIC CHALLENGE
Eight and twelve hour requirements were arriving in national capacity procurement, and lithium at those durations priced badly while pumped hydro sites had been taken decades earlier. Management wanted to know whether gravity storage was a genuine option or a demonstration curiosity, and what a first project would have to look like to clear an investment committee.
MMA APPROACH
MMA mapped every decommissioned deep shaft within the client's four markets against transmission capacity, connection status and remediation liability, producing a ranked site list rather than a technology assessment. Forty-seven expert interviews with hoisting manufacturers, mine closure authorities, transmission operators and project lenders established what could be built, what could be permitted and what could be financed.
KEY FINDINGS
  1. Eleven shafts in the client's markets held live transmission connections above 50 megawatts, and 4 of them had no competing redevelopment proposal attached.
  2. Shaft reuse cut modelled capital cost by 38% against a greenfield tower, which moved the technology inside the client's own internal return threshold.
  3. Every lender interviewed priced the first project at a premium, and every one of them said a hoisting supplier guarantee would materially reduce it.
  4. Permitting rather than engineering set the schedule, with subsidence and water assessments running eighteen to thirty months across every one of the four markets.
CLIENT PROFILE
A European vertically integrated utility with generation, network and supply businesses across four countries, operating a renewable portfolio approaching nine gigawatts and facing evening ramp requirements its existing four hour battery fleet could not cover (client-reported, unverified by MMA). Management had been asked to identify long duration options without committing to unproven technology. The board had already rejected two hydrogen proposals.
STRATEGIC CHALLENGE
Eight and twelve hour requirements were arriving in national capacity procurement, and lithium at those durations priced badly while pumped hydro sites had been taken decades earlier. Management wanted to know whether gravity storage was a genuine option or a demonstration curiosity, and what a first project would have to look like to clear an investment committee.
MMA APPROACH
MMA mapped every decommissioned deep shaft within the client's four markets against transmission capacity, connection status and remediation liability, producing a ranked site list rather than a technology assessment. Forty-seven expert interviews with hoisting manufacturers, mine closure authorities, transmission operators and project lenders established what could be built, what could be permitted and what could be financed.
KEY FINDINGS
  1. Eleven shafts in the client's markets held live transmission connections above 50 megawatts, and 4 of them had no competing redevelopment proposal attached.
  2. Shaft reuse cut modelled capital cost by 38% against a greenfield tower, which moved the technology inside the client's own internal return threshold.
  3. Every lender interviewed priced the first project at a premium, and every one of them said a hoisting supplier guarantee would materially reduce it.
  4. Permitting rather than engineering set the schedule, with subsidence and water assessments running eighteen to thirty months across every one of the four markets.
RECOMMENDED STRATEGY
Phase 1: Phase one: option the 4 uncontested shafts immediately at nominal cost, before any competing redevelopment proposal is lodged against any of them. Phase 2: Phase two: start subsidence and water permitting on the two best sites now, since that assessment rather than engineering sets the schedule. Phase 3: Phase three: negotiate an availability guarantee with a hoisting manufacturer before approaching lenders, rather than after they price the first premium.
OUTCOME
Within four quarters the utility held options on all 4 uncontested shafts at a cost below a single feasibility study, and permitting had begun on two of them (client-reported, unverified by MMA). A hoisting manufacturer agreed guarantee terms in principle. No construction has started yet and none of it was expected to at this early stage.

Frequently Asked Questions

Foundational context covering the market sizes, CAGR, scope, country, region and competition that inform every finding below. This section is provided to cover basics and most often pre-purchase conversations, answered from the MMA Primary Research Dataset.

What is the current size of the Gravity Energy Storage Market?

The global gravity energy storage market was valued at USD 0.4 billion in 2025, covering grid-connected systems that store energy by raising a mass. The 2026 figure reaches USD 0.46 billion.

How large will the Gravity Energy Storage Market be by 2036?

MMA forecasts USD 1.93 billion by 2036, an increase of USD 1.47 billion over the 2026 base. That represents an expansion multiple of 4.20 times across the forecast period.

What is the CAGR for the Gravity Energy Storage Market 2026 to 2036?

The base case compound annual growth rate is 15.4%, with a bull case at 16.8% and a bear case at 14.0%. Historical growth between 2020 and 2025 ran at 14.2%.

Which segment is growing fastest?

Decommissioned mine shaft systems grow at 23.1%, half again the market rate of 15.4%, because the shaft and its grid connection already exist. Modular tower systems follow at 18.6%.

Who are the major companies in the Gravity Energy Storage Market?

Energy Vault, Gravitricity, Green Gravity, RheEnergise and Sink Float Solutions lead on announced and contracted capacity, with combined CR5 of 62%. Concentration reflects a technology before deployment.

Which country is growing fastest?

India grows fastest at 17.6%, on enormous solar buildout with evening ramps that four hour batteries cannot cover. South Asia and Pacific leads regionally at 17.6%, driven largely by Australia.

Report Segmentation Architecture

The full report scope spans multiple orthogonal segmentation dimensions, with cross-tabulated demand data provided for each dimension pair. Coverage extends further to regional breakdowns, trend trajectories, and the competitive detail needed to support segment-level decision-making.

By System Architecture

  • Modular Tower and Block Systems
  • Decommissioned Mine Shaft Systems
  • Rail and Incline Mass Systems
  • High-Density Fluid Hillside Systems
  • Piston and Underground Water Column Systems
  • Marine and Subsea Gravity Systems

By End-Use Industry

  • Utility Grid Balancing
  • Renewable Generation Firming
  • Industrial Behind-the-Meter Supply
  • Mining Site Power
  • Island and Remote Grids
  • Transmission Deferral Applications

By Commercial Dimension

  • Utility Owned Assets
  • Independent Power Producer Ownership
  • Technology Licensing Agreements
  • Engineering and Construction Contracts
  • Long-Term Service Agreements
  • Storage as a Service Contracts

By Region

  • North America
  • Western Europe
  • East Asia
  • South Asia and Pacific
  • Latin America
  • Middle East and Africa
  • Eastern Europe

Scope, Methodology, and Coverage

Every figure in this report is reproducible from documented input assumptions. The scope below maps the historical period, the forecast horizon, the segmentation dimensions, and the countries covered, alongside the underlying primary and qualitative methodology.
Historical Period
2020 to 2025
Forecast Period
2026 to 2036
Base Year
2025 (USD billions; MMA Primary Research Dataset, August 2026)
Market Definition
The gravity energy storage market covers grid-connected systems that store electrical energy by raising a solid or dense mass and recover it by controlled descent through a generator, spanning modular tower and block systems, decommissioned mine shaft systems, rail and incline mass systems, high-density fluid hillside systems, piston and underground water column systems, and marine and subsea gravity systems. Scope is measured as installed and contracted energy capacity. Excluded are conventional pumped hydro storage, compressed air energy storage, flywheel systems, all electrochemical batteries, and mechanical storage embedded in industrial equipment.
Quantitative Units
USD billion, 2025 base year, 2026 to 2036 forecast period
Segmentation Dimensions
System architecture, end-use application, commercial model, region
Regions Covered
North America, Western Europe, East Asia, South Asia and Pacific, Latin America, Middle East and Africa, Eastern Europe
Countries Covered
United States, Canada, Germany, United Kingdom, Spain, Italy, Poland, Czechia, China, Japan, South Korea, India, Australia, Brazil, Chile, Saudi Arabia, United Arab Emirates, South Africa
Key Companies Profiled
20 companies across storage developers, hoisting suppliers and utility deployers
Quantitative Methodology
Primary survey, n=3,800 respondents, Q4 2025, six countries; demand-side model with trade association cross-validation
Qualitative Methodology
47 expert interviews, Q4 2025; applied to validate demand model assumptions, identify emerging dynamics, and assess competitive positioning
Report Format
PDF and XLSX data workbook (Word format preview document)
Publisher
Market Minds Advisory
Report Code
MMA-2026-ENE-311
Published
August 2026
Contact
sales@marketmindsadvisory.com | www.marketmindsadvisory.com

Purchase the full Gravity Energy Storage Market Report (2026 to 2036).

The full MMA report on the gravity energy storage market runs to detailed architecture and regional models across the 2026 to 2036 forecast period, with capital cost benchmarks separated by system type and siting route. It profiles 20 companies on a consistent announced and contracted capacity basis, covering storage developers, hoisting and drive suppliers and the utilities deploying them. Decommissioned shaft inventory is mapped against transmission capacity and connection status by market. Regional chapters cover the seven MMA regions with country-level detail on the eighteen markets surveyed. Primary research draws on a quantitative survey of 3,800 respondents across six countries and 47 expert interviews conducted in Q4 2025.
Capital cost benchmarks by system type and siting
Decommissioned shaft inventory mapped against transmission connection status
Levelised cost modelling across thirty-five year asset lives
Twenty company profiles on consistent contracted capacity basis
Project financing terms and premium analysis by market
Seven regional chapters with eighteen country detail tables

Built For The People Who Decide

From boardroom strategy to bench-side execution, this report is read cover-to-cover by leaders shaping the next decade of their industry, turning demand scenarios, market dynamics and valuation benchmarks into decisions.
CXOs/ Presidents/ VPs/ Managers
M&A and Corporate Development
Strategy Teams and R&D Heads
Procurement and Product Directors
Regulatory and Compliance Leaders
Investor Relations and Equity Analysts