Market Minds Advisory
Graphene Nanocomposites Market

Graphene Nanocomposites Market: Trends and Forecast 2026 to 2036

Electric vehicle battery electrode development and defense composite programmes are pulling graphene nanocomposite production toward energy storage and structural applications, even as Chinese production capacity scales faster than certification and standardization frameworks can keep pace.

Lead Analyst

Bilal Shaikh

Published

September 2026

Make Smarter Decisions with Customized Research Insights

Request a free sample report and evaluate market opportunities, growth trends, and competitive dynamics relevant to your business needs.

2025 MARKET VALUE$1.6BMarket Size 2025
2036 FORECAST VALUE$7.8BBase Case , 2026 to 2036
CAGR 2026 TO 203615.5 %Bull 16.9% / Bear 14.1%
INCREMENTAL OPPORTUNITY$6.0BNet 10- year value creation
EXPANSION MULTIPLE4.22x2036 value over 2026 base
Strategic Levers
M&A Pipeline
Regional Outlook
Country Rankings
Competitive Intelligence
Segmental Deep-dive
Call-Us : 91 93563 13602

Executive Snapshot and Market Trajectory

Graphene nanocomposite demand is shifting decisively toward energy storage electrode applications as electric vehicle battery producers seek higher conductivity and capacity materials, even as structural polymer and metal matrix composite applications continue expanding steadily across aerospace and automotive manufacturing sectors worldwide.
Commercial forces now split the market between research-stage buyers testing graphene nanocomposite formulations in pilot programmes and commercial-scale buyers integrating qualified materials into production battery, coating, and structural composite lines. Energy storage electrode applications are the fastest-growing format, expanding as battery producers pursue higher energy density and faster charging characteristics graphene additives enable. East Asia and North America together account for the majority of global demand, split between production scale and advanced materials research activity.
Competitive intensity concentrates among a handful of graphene producers holding consistent quality and dispersion process expertise required for reliable nanocomposite performance, leaving application-specific formulation more fragmented across smaller specialty compounders. Standardization gaps around graphene quality grading add a further layer of complexity, making it difficult for buyers to compare suppliers on a consistent basis. Production capacity in China has scaled faster than quality certification frameworks, creating genuine buyer uncertainty.
Market Definition
The Graphene Nanocomposites Market covers graphene and graphene derivative materials dispersed into polymer, metal, and ceramic matrices to enhance conductivity, strength, or barrier properties. It excludes standalone graphene powder or film products not yet incorporated into a composite matrix, and unrelated carbon nanotube or fullerene nanocomposite categories.
Base Year Value
$1.6B in 2025 (MMA Primary Research Dataset, August 2026)
Forecast Period
2026 to 2036, eleven discrete annual values
CAGR
15.5% base case. Bull 16.9%. Bear 14.1%.
Fastest Growth Segment
Graphene Nanocomposite Energy Storage Electrodes: 19.5% CAGR
Fastest Growth Country
India: 18.0% CAGR
Fastest Growth Region
South Asia and Pacific: 17.5% CAGR
Largest Region
East Asia: 33% of 2025 global value
Market Leaders
Directa Plus, First Graphene, Haydale, Graphenea, XG Sciences (MMA Analysis, 2025).
Primary Survey
n=3,800 procurement and R&D decision-makers, Q4 2025, six countries
Methodology
Demand-side build-up, cross-validated against public data, 47 expert interviews

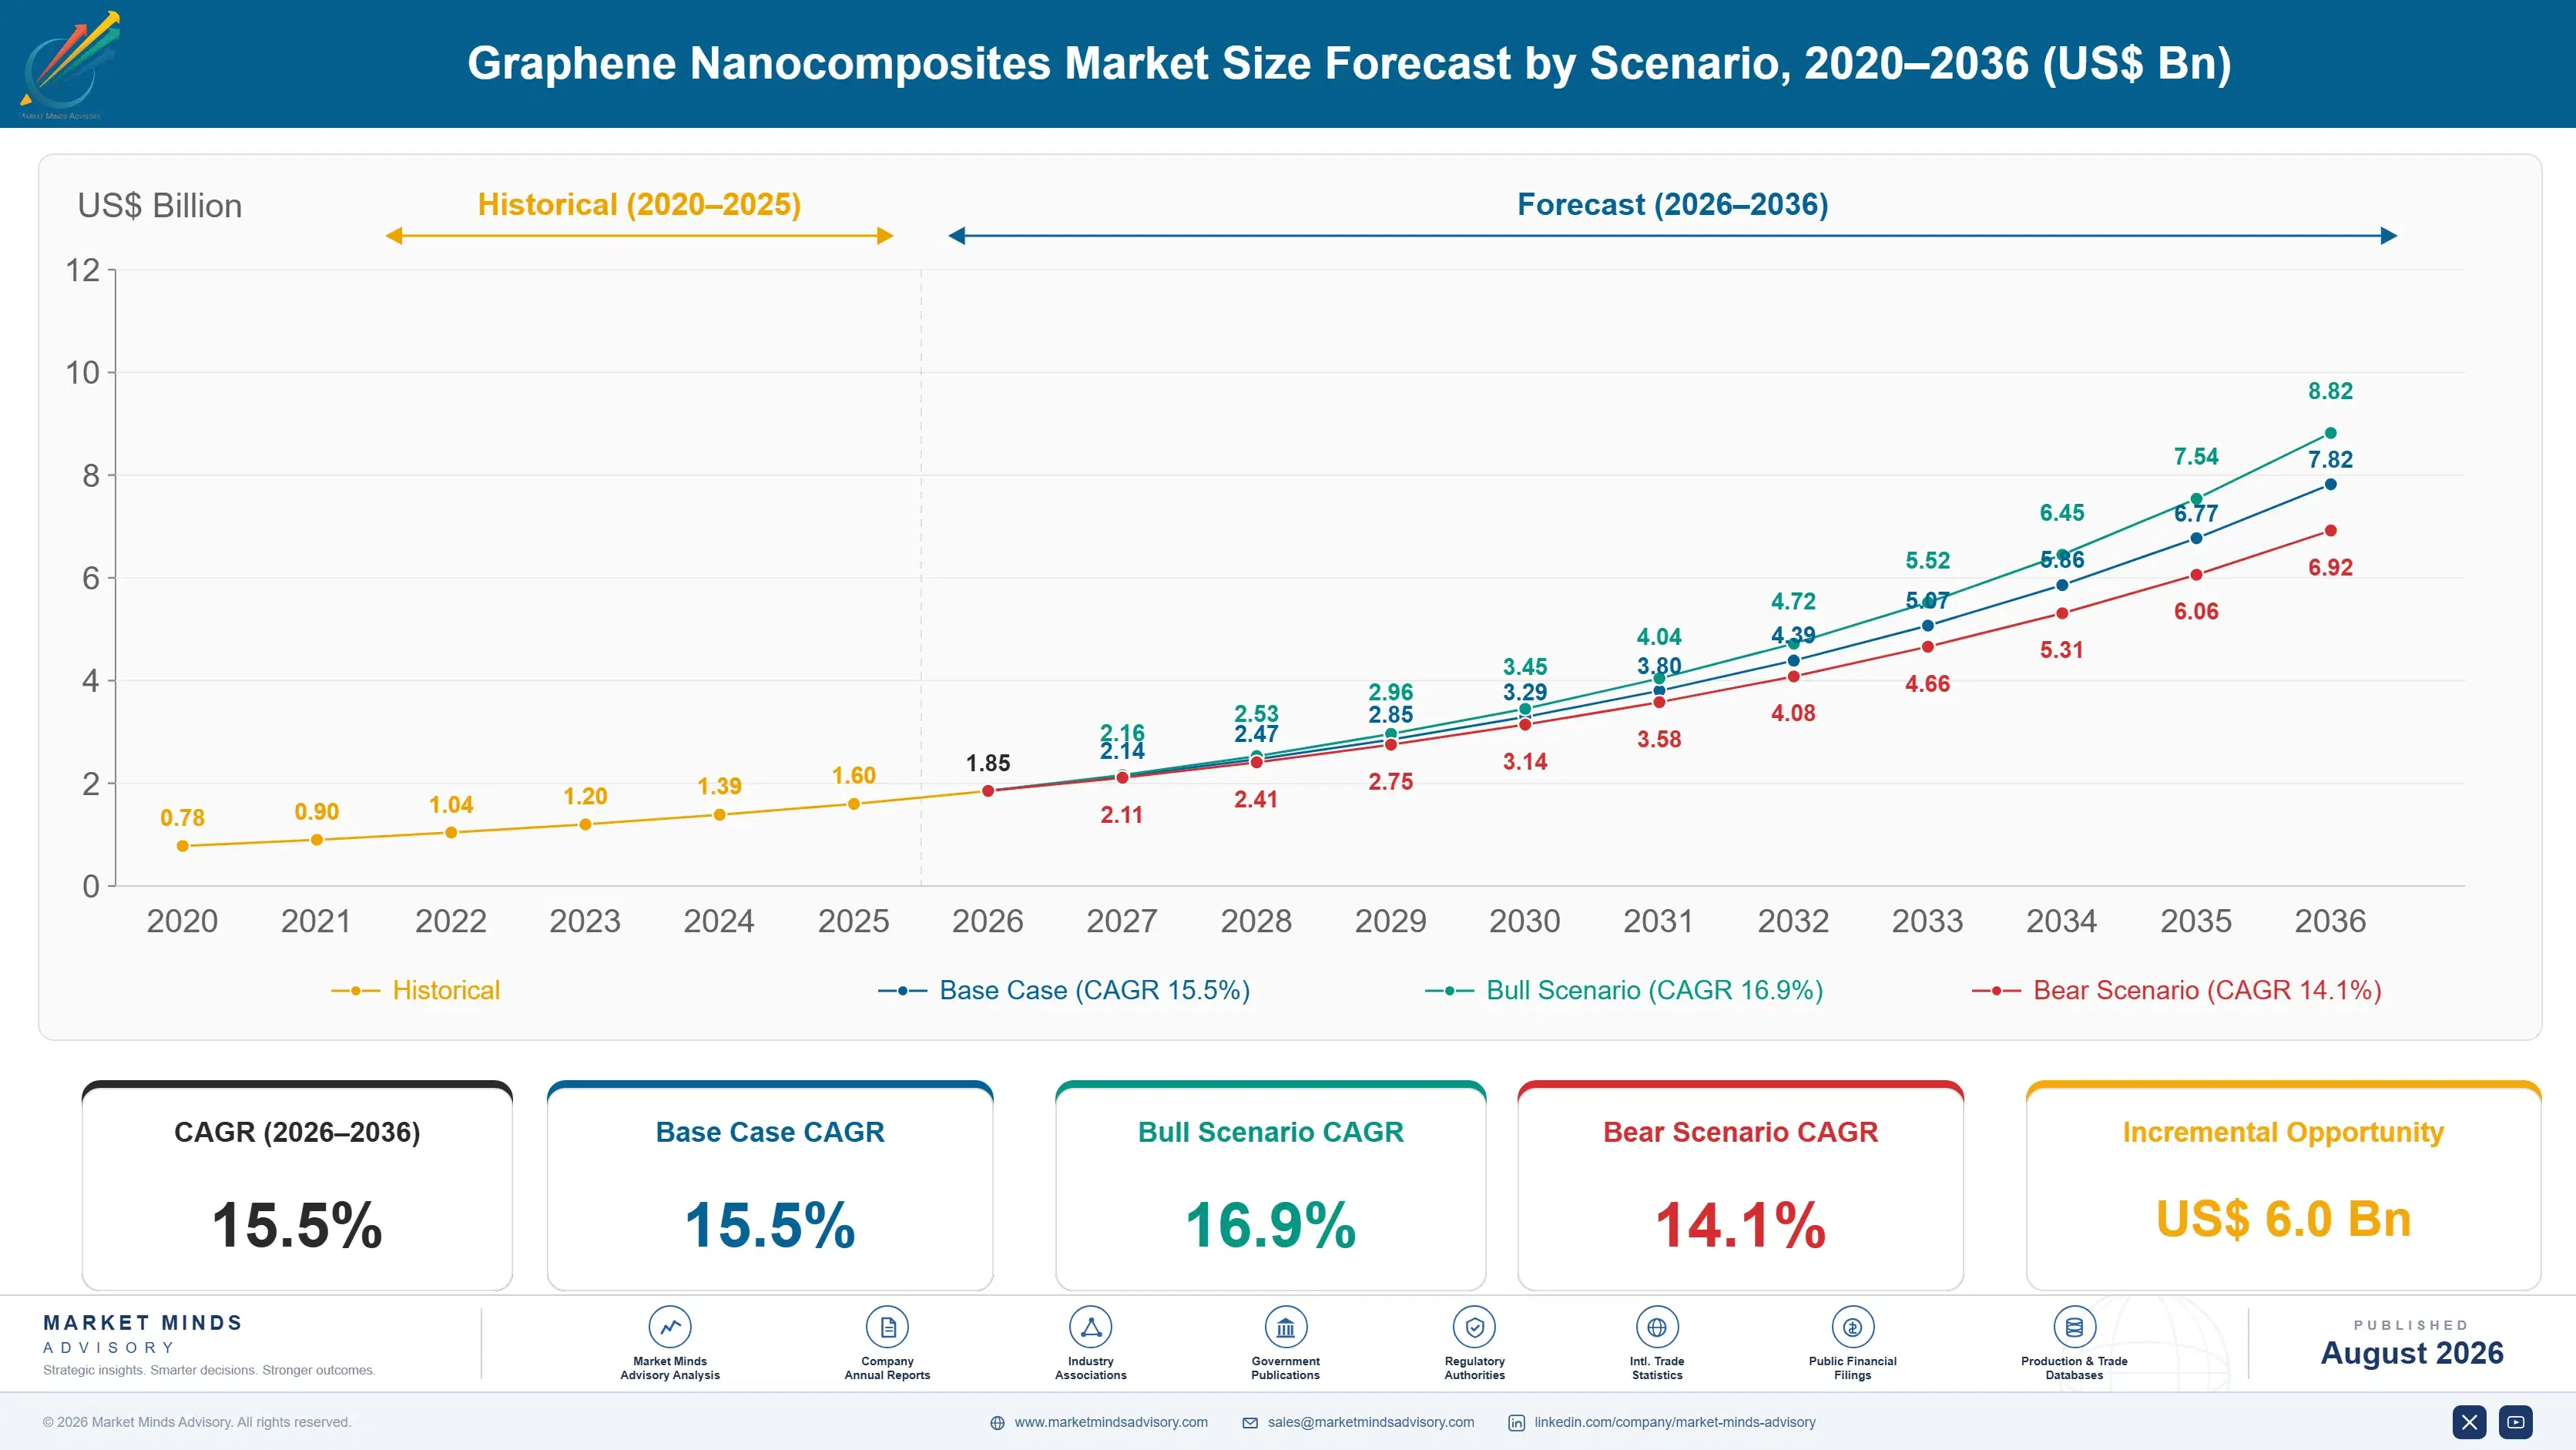
Graphene Nanocomposites Market Forecast Scenarios

graphene-nanocomposites-market-size-forecast-scenario-1787552988570
The graphene nanocomposite market grew at an estimated 14.0% annually between 2020 and 2025, supported by expanding research and pilot-scale commercialization across battery, coating, and structural composite applications worldwide. Growth accelerated toward the end of the period as electric vehicle battery producers began qualifying graphene-enhanced electrode materials for early commercial production runs across multiple battery chemistries.
The base case assumes 15.5% annual growth through 2036, driven by three commercial mechanisms: expanding electric vehicle battery production requiring higher-performance electrode materials, growing aerospace and automotive adoption of graphene-reinforced structural composites, and continued Chinese production capacity expansion lowering per-unit graphene costs for downstream compounders across the industry. Quality standardization efforts are also gradually building buyer confidence, favoring producers who already meet emerging consistency benchmarks over suppliers without documented quality control processes in place.
The bull case, at 16.9%, assumes accelerated electric vehicle battery adoption drives faster graphene electrode qualification across multiple battery chemistries and vehicle platforms simultaneously worldwide, ahead of current projections. The bear case, at 14.1%, assumes persistent quality inconsistency and standardization gaps slow commercial-scale adoption beyond pilot programmes longer than currently expected across most application categories and end markets.

Nascent Material Awaits Commercial-Scale Quality Consistency

The Graphene Nanocomposites Market remains a genuinely nascent industry despite more than a decade of research investment, still working through the standardization and quality consistency challenges that separate laboratory-scale promise from reliable commercial-scale performance. Graphene's exceptional conductivity and strength properties make it valuable across battery, coating, and structural composite applications, but dispersion quality varies significantly between suppliers.
MARKET CONCENTRATION42%Top five producers hold combined global market share
AVERAGE SELLING PRICE$95 per kgReflects blended pricing across research and commercial grade material
TOP PRODUCER SHARE45%China leads global manufacturing capacity for this material
CAPACITY UTILIZATION58%Producers run plants well below typical mature industry ceiling
FEEDSTOCK SHARE OF COGS35%Graphite precursor inputs represent a meaningful share of costs
EXPORT TRADE INTENSITY40%Meaningful share of output crosses borders before final integration
Production spans a wide quality spectrum, from research-grade graphene produced in small batches with tight quality control to lower-cost bulk graphene oxide produced at commercial scale primarily in China with more variable consistency. This quality variation makes supplier qualification a genuinely important process for buyers integrating graphene nanocomposites into commercial products, since inconsistent dispersion quality can undermine the very performance benefits graphene is meant to deliver in a finished composite material.
Capacity utilization runs well below typical mature industry levels, reflecting substantial graphene production capacity built ahead of confirmed commercial demand across most application categories. Feedstock costs, dominated by graphite precursor material, represent a moderate share of total cost of goods sold, leaving processing and dispersion expertise as the primary differentiator between producers competing for commercial-scale customer qualification across the market.
"This market has been ten years away from breaking out for about ten years now, and the honest answer is that quality inconsistency, not the underlying physics, is what's holding it back. The producers solving dispersion quality at commercial scale are the ones actually converting battery pilot programmes into real orders."
Senior Analyst, Advanced Materials and Nanotechnology Practice · MMA Chemicals and Materials Practice · August 2026

Market Trends

Electric Vehicle Battery Electrode Qualification Accelerates Steadily

Electric vehicle battery producers are moving graphene-enhanced electrode materials from pilot testing into early commercial production runs at a pace that has accelerated meaningfully since 2023, as battery chemistry developers seek higher conductivity and faster charging characteristics graphene additives can deliver. Several major battery producers have announced qualification programmes for graphene-enhanced anode and cathode materials over the past two years, moving beyond the purely academic research phase that characterized this application for much of the previous decade. Producers who have already passed battery-grade qualification testing are positioned to capture recurring supply relationships as electric vehicle production volumes continue expanding.
Market Impact: Battery capacity expansion accelerated since 2022

Quality Standardization Frameworks Slowly Emerge Industry-Wide

Industry bodies and research consortia have begun developing graphene quality grading standards since 2023, aiming to give buyers a consistent basis for comparing suppliers whose graphene material has historically varied widely in purity, layer count, and dispersion characteristics. This standardization effort remains incomplete, but early frameworks are already helping larger commercial buyers screen suppliers more efficiently than the purely trial-and-error qualification process that characterized the market previously. Producers who proactively align their quality documentation with emerging standards are seeing faster buyer qualification cycles than producers still relying on informal, non-standardized specification sheets.
Market Impact: Costs declined meaningfully since 2022

Market Opportunities and Growth Drivers

Electric Vehicle Battery Production Scales Rapidly Worldwide

Global electric vehicle battery production has scaled rapidly since 2022, with major battery manufacturers announcing gigafactory capacity expansions across North America, Europe, and Asia to meet growing automaker demand for domestically produced cells. Each battery chemistry generation seeks incremental performance improvements in conductivity, charging speed, and cycle life, and graphene additive suppliers who can demonstrate reliable performance gains at commercial battery scale are increasingly winning qualification slots in next-generation battery designs. This scaling creates a large and growing addressable market for graphene nanocomposite electrode materials that did not meaningfully exist five years ago.
Market Impact: Qualification processes take 12+ months

Chinese Production Capacity Expansion Lowers Material Costs

Chinese graphene producers have expanded production capacity substantially since 2022, driving down per-unit graphene and graphene oxide costs meaningfully compared to prices just a few years earlier when production remained largely research-scale and small-batch across most facilities. This cost decline is opening graphene nanocomposite formulations to price-sensitive applications in coatings and consumer products that could not previously justify graphene's cost premium over conventional additives available on the market. Producers positioned to source from this expanding Chinese capacity base are capturing cost advantages that smaller, higher-cost regional producers increasingly struggle to match.
Market Impact: Grading frameworks emerged since 2023

Market Restraints and Challenges

Quality Inconsistency Limits Commercial-Scale Adoption Pace

Graphene quality varies substantially between suppliers in terms of layer count, purity, and dispersion characteristics, and this inconsistency remains the single largest barrier preventing faster commercial-scale adoption across most application categories. The root cause is the absence of mature, universally adopted manufacturing standards comparable to those governing established materials like carbon fiber or engineering plastics. The commercial impact includes lengthy and expensive supplier qualification processes for buyers, and producers are responding by investing in analytical testing infrastructure and pursuing early alignment with emerging industry quality grading frameworks to differentiate themselves.
Market Impact: Qualification programmes launched over 2 years

Standardization Gaps Complicate Cross-Supplier Quality Comparison

The absence of universally adopted graphene quality grading standards makes it genuinely difficult for buyers to compare suppliers on a consistent, apples-to-apples basis, since different producers report layer count and purity using inconsistent methodologies across the industry. The root cause is the technology's relative youth compared to more established nanomaterials with decades of standardization history behind them. The commercial impact falls hardest on smaller buyers lacking in-house testing capability, and industry consortia are responding by developing shared grading frameworks that several larger producers have already begun adopting voluntarily ahead of formal regulation.
Market Impact: Standards development began since 2023
2 additional market trends, 2 additional growth drivers, and 2 additional restraints and challenges are covered in the full report. Contact sales@marketmindsadvisory.com to access the complete intelligence.

Segment CAGR and Growth Architecture

Segmentation follows matrix and application type, the classification materials engineers use when specifying formulation requirements, since each category demands a distinct dispersion process through different manufacturing steps rather than a shared production pathway, and each typically involves its own separate qualification testing protocol and supplier relationship across all six categories examined in this report.
graphene-nanocomposites-market-market-share-analysis-1787552990057

Graphene Nanocomposite Energy Storage Electrodes

Energy storage electrode applications are the fastest-growing segment, expanding at 19.5% annually as electric vehicle battery producers increasingly specify graphene-enhanced anode and cathode materials for higher conductivity and faster charging performance across multiple battery chemistry generations currently entering commercial production at scale worldwide across leading manufacturers and gigafactory sites everywhere. This application requires battery-grade dispersion consistency distinct from coating or structural composite requirements, favoring producers who have invested in dedicated quality control infrastructure for this specific use case over general-purpose graphene suppliers lacking that capability entirely. Demand concentrates heavily in regions with large battery manufacturing bases, particularly East Asia and North America, where gigafactory investment continues expanding steadily each year.
CAGR 19.5%

Graphene Nanocomposite Sensors and Electronics

Sensors and electronics applications, the second-fastest segment at 18.2% annually, use graphene nanocomposites for flexible circuit substrates, biosensors, and conductive ink formulations requiring precise electrical property control that few alternative materials can match at comparable cost or performance level available today anywhere in the entire world market currently and reliably every day. This segment commands meaningfully higher pricing than bulk coating or structural grades, reflecting the specialized formulation and testing requirements electronics manufacturers demand before qualifying a supplier for integration into finished devices and products across most comparable categories available. Growth concentrates most heavily in regions with strong electronics manufacturing bases, particularly East Asia and parts of North America and Europe.
CAGR 18.2%
Full segment breakdown across 6 segments available in the complete report.

Regional Architecture and Country Demand Map

East Asia leads regional demand given China's dominant graphene production capacity and expanding battery manufacturing base. North America follows closely on advanced materials research and battery electrode development, while South Asia and Pacific grows fastest as India scales its own electronics and battery manufacturing capacity.

North America

North America's demand centers on electric vehicle battery electrode development and defense-related structural composite research, with major battery manufacturers and aerospace primes both running active graphene nanocomposite qualification programmes across multiple facilities and testing sites nationwide today and consistently. The region hosts significant advanced materials research infrastructure at universities and national laboratories, translating academic breakthroughs into commercial pilot programmes faster than in many other regions globally. Domestic graphene production capacity remains smaller than China's, leaving North American compounders reliant on imported bulk graphene for cost-sensitive applications while reserving domestic research-grade production for the highest-value battery and aerospace qualification work requiring the tightest quality control standards available anywhere in the industry today.
Share: 26% | CAGR: 16.0% (2026 to 2036)

Western Europe

Western Europe's demand draws on the region's historical leadership in graphene research, since the material was first isolated at the University of Manchester, and the European Union's Graphene Flagship programme has funded commercialization research for over a decade across multiple member states and research institutions consistently and reliably every single year without fail. Automotive and aerospace composite applications drive meaningful demand in Germany and France, while coatings and specialty chemical applications contribute steady volume elsewhere across the broader region. Chinese import competition on bulk graphene has pressured European producers to focus increasingly on higher-value research-grade and application-specific formulation work rather than competing directly on commodity graphene oxide pricing alone today.
Share: 20% | CAGR: 14.0% (2026 to 2036)
Regional intelligence for 5 additional markets available in the complete report: East Asia, South Asia and Pacific, Latin America, Middle East and Africa, Eastern Europe. Contact sales@marketmindsadvisory.com.
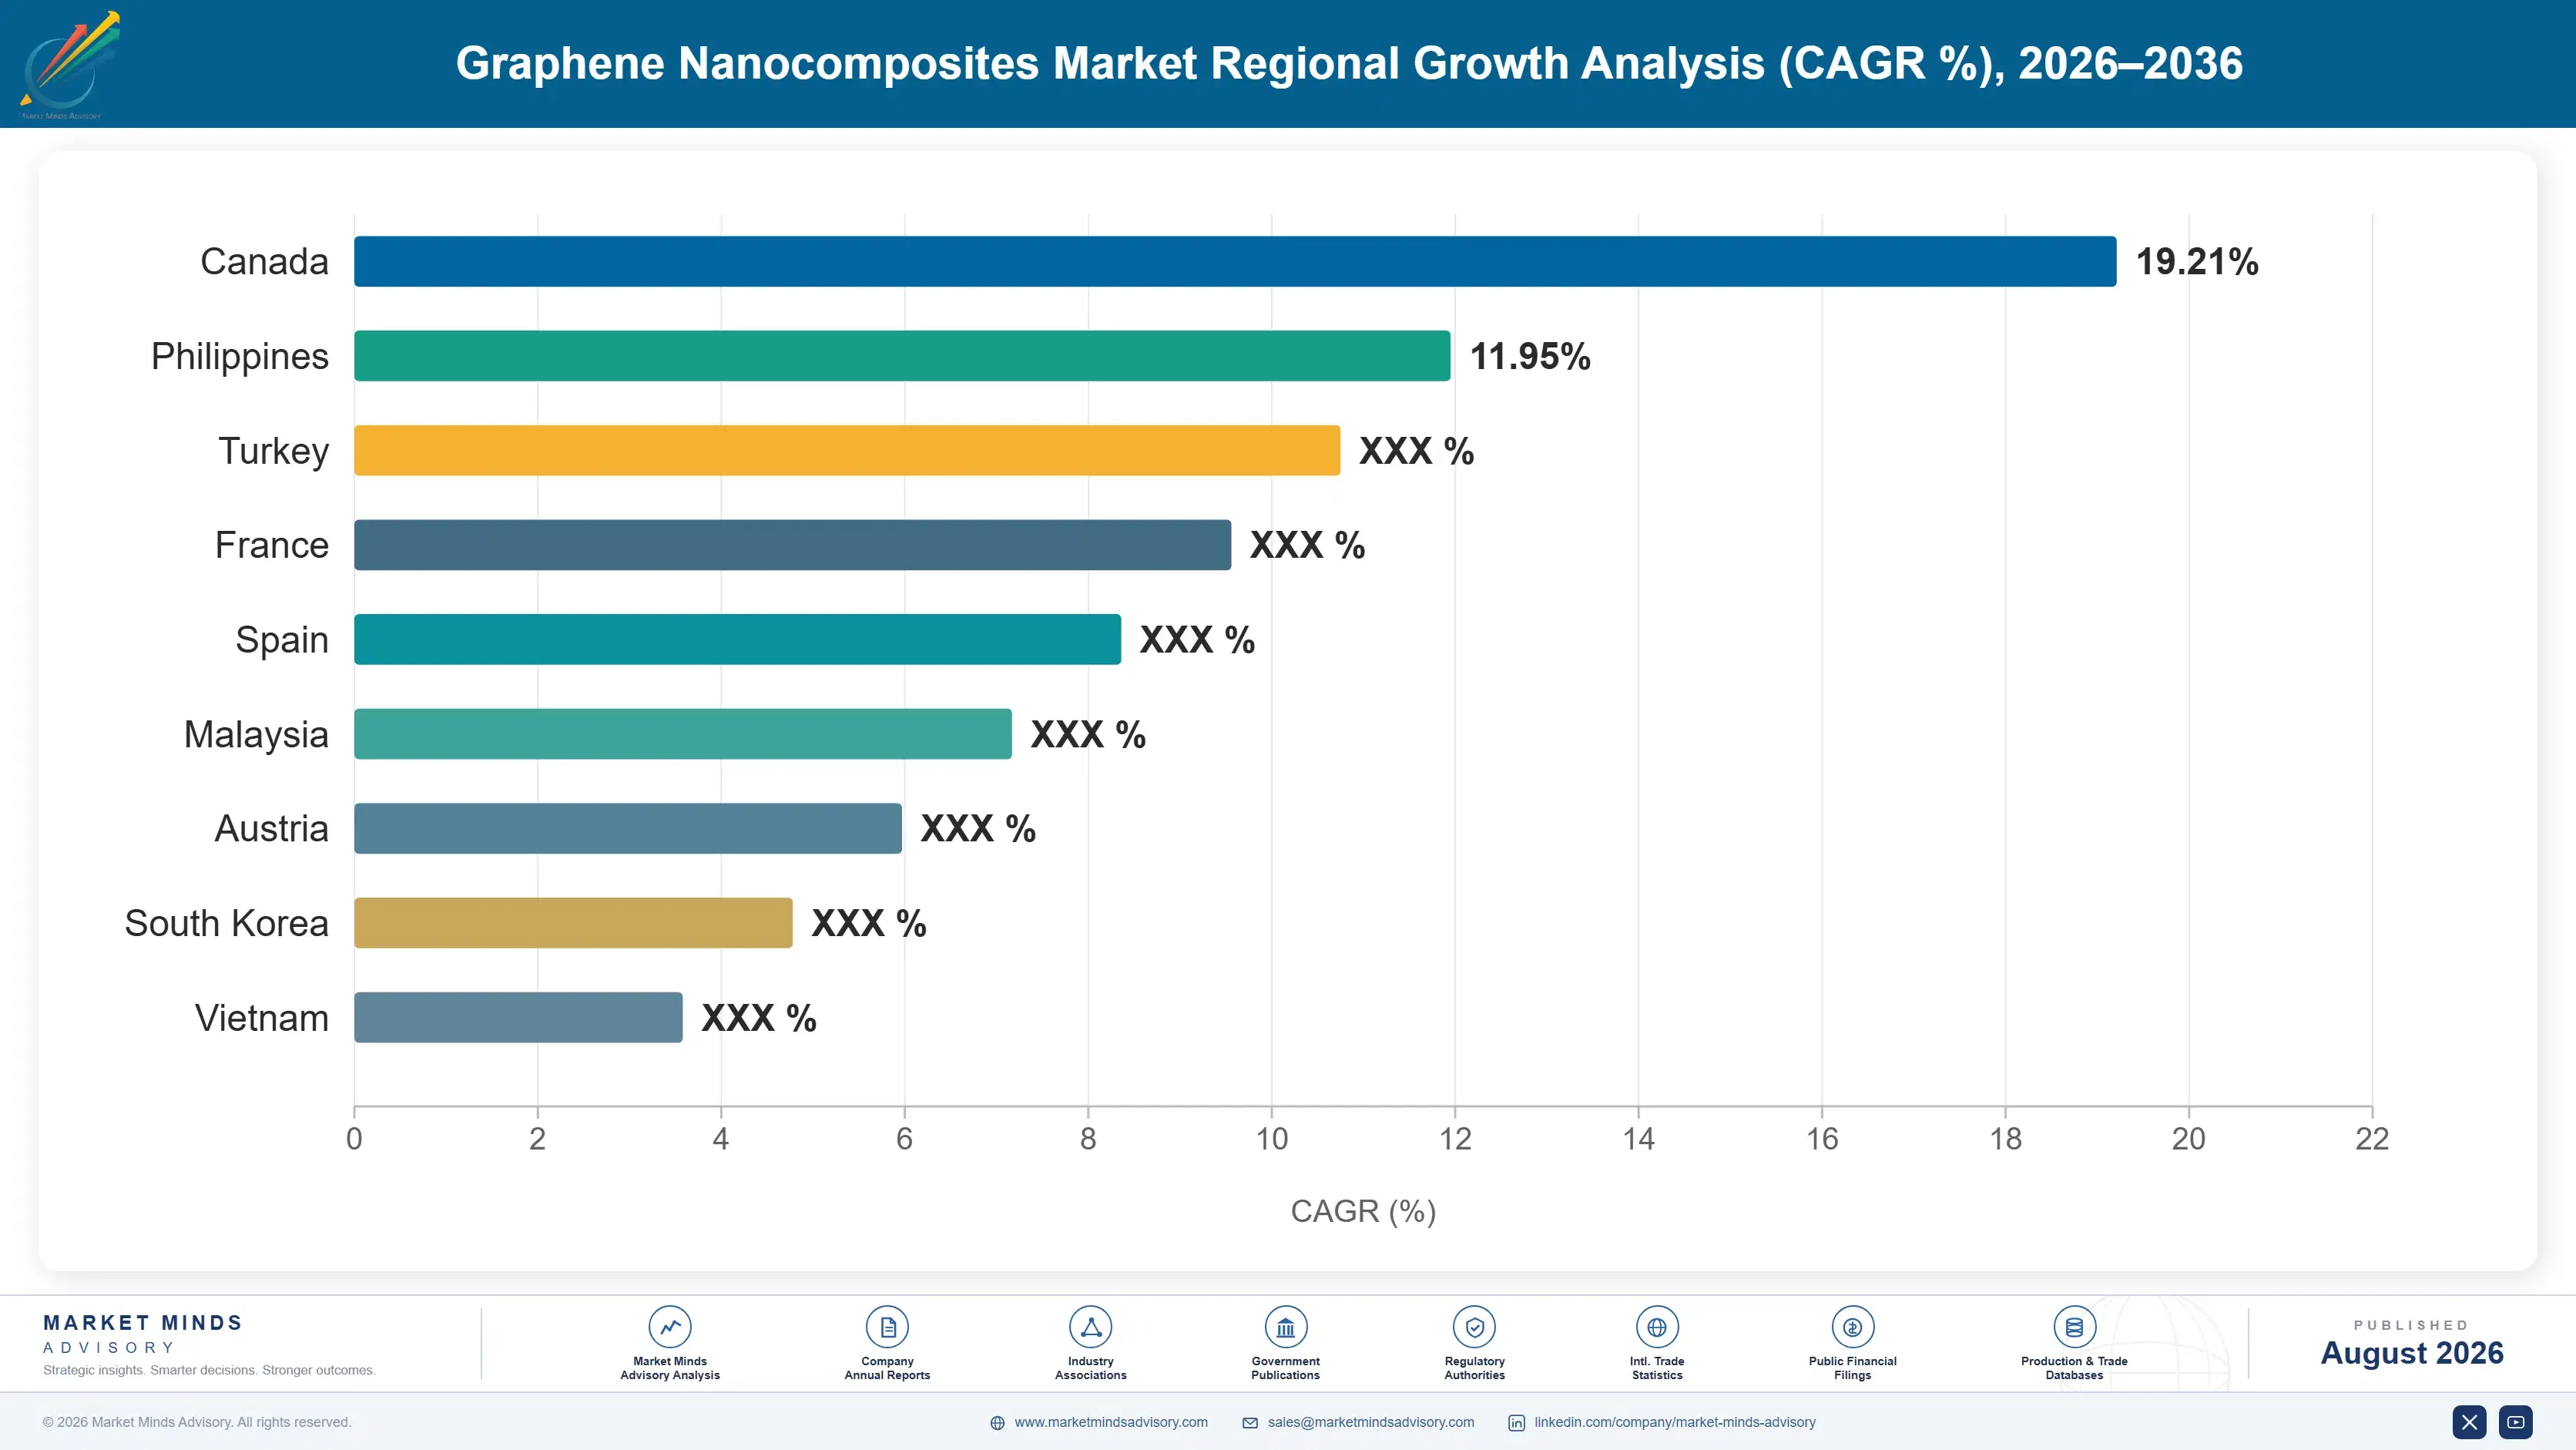
graphene-nanocomposites-market-country-cagr-analysis-1787552991451

Where Graphene Nanocomposite Producers Can Capture Margin

Margin expansion in this market concentrates around battery-grade quality certification, standardization leadership, backward integration into graphite feedstock, and geographic proximity to battery and electronics manufacturing clusters, four distinct commercial moves that convert existing production capability into premium pricing rather than requiring entirely new synthesis technology or unproven process investment upfront, each accessible to established producers today.

Pursue Battery-Grade Quality Certification For Electrode Applications

Producers currently outside battery-grade qualification are leaving the highest-growth segment of the market entirely to a small number of qualified incumbents, even though the underlying graphene production process is fundamentally similar across quality grades. Pursuing certification from battery manufacturer qualification programmes typically takes twelve to eighteen months and requires meaningful investment in analytical testing infrastructure, but successfully certified producers gain access to pricing 2 to 3 times higher than bulk industrial rates on comparable volumes. Producers with existing dispersion process expertise are best positioned to make this transition profitably and quickly.
Market Impact: Captures pricing 2 to 3 times higher than commodity

Lead Industry Quality Standardization Efforts Proactively

Producers who proactively align their quality documentation and testing protocols with emerging industry standardization frameworks are seeing meaningfully faster buyer qualification cycles than producers still relying on informal, non-standardized specification sheets and processes. Leading standardization efforts also builds valuable relationships with the industry consortia and research bodies shaping future grading frameworks, giving early movers influence over standards that competitors will eventually be forced to adopt regardless. Producers actively participating in these standardization efforts report qualification cycle times roughly 30% shorter than producers relying purely on ad hoc, buyer-specific testing processes.
Market Impact: Standardization cuts qualification cycles by roughly 30% faster

Pursue Backward Integration Into Graphite Feedstock Production

Larger producers with sufficient balance sheet capacity can integrate backward into graphite feedstock production directly, capturing the margin that would otherwise flow entirely to third-party mining and processing suppliers while also gaining more reliable feedstock access during periods of tight raw material availability across the broader supply chain. Producers who moved on this over the past several years reported feedstock cost savings of roughly 20% compared to peers still purchasing graphite feedstock on the open market at prevailing spot prices, a meaningful margin advantage that compounds over multi-year production cycles and volumes.
Market Impact: Backward integration saves roughly 20% on feedstock costs

Locate Production Near Battery Manufacturing Gigafactory Clusters

Producers who site new or expanded production capacity near concentrated battery manufacturing gigafactory clusters in East Asia and North America reduce shipping cost and lead time for electrode material customers who value reliable, short-cycle delivery over marginal price differences. This geographic proximity advantage matters more as battery producers move toward just-in-time inventory management, and producers within a shorter delivery radius have captured roughly 25% more new gigafactory customer volume over the past two years than distant competitors. Building or acquiring capacity in these clusters is now a genuine competitive differentiator.
Market Impact: Proximity captured roughly 25% more gigafactory customer volume

Who Controls the Margin Pool

The Graphene Nanocomposites Market shows moderate concentration with a CR5 of 42%, evaluated on a revenue basis across both research-grade and bulk commercial production. Directa Plus and First Graphene lead the qualified commercial-grade segment specifically, while the gap between these two leaders and the third-ranked challenger widens further once purely research-scale revenue is excluded from the comparison.
Current competitive activity centers on battery-grade qualification expansion, with several mid-tier producers investing in analytical testing infrastructure to access premium pricing previously reserved for established graphene specialists. Capacity investment is also concentrated in electrode-grade material production rather than bulk coating-grade graphene, reflecting where margin and demand growth both point. Chinese domestic producers are simultaneously scaling bulk graphene oxide capacity to reduce reliance on imported higher-cost specialty material.

Emerging pressure comes from standardization gaps that continue slowing commercial-scale adoption across most application categories, which could delay revenue realization if quality grading frameworks take longer to mature than currently expected. Rankings could shift meaningfully if a mid-tier producer completes battery-grade qualification faster than incumbents expect, since qualification status rather than raw production scale increasingly determines access to the highest-margin electrode material contracts.
graphene-nanocomposites-market-company-positioning-matrix-1787552992319

Competitive Moat and Risk Dimensions

DIRECTA PLUS

Moat: Vertically Integrated Production Chain

Directa Plus operates vertically integrated production from graphite feedstock through finished graphene nanoplatelet products, giving the company tighter quality control across the entire manufacturing chain than competitors purchasing intermediate materials from third parties. This integration lets Directa Plus offer more consistent dispersion quality to battery and textile customers requiring reliable performance.
DIRECTA PLUS

Risk: European Cost Base Exposure

Directa Plus operates primarily from European production facilities, exposing the company to higher energy and labor costs than Chinese competitors producing bulk graphene at meaningfully lower per-unit cost. This cost disadvantage limits Directa Plus's ability to compete on price in commodity-grade applications, pushing the company toward higher-value specialty segments where quality differentiation matters more than raw cost.
FIRST GRAPHENE

Moat: Direct Graphite Feedstock Access

First Graphene benefits from direct access to Australian graphite feedstock deposits, reducing the company's exposure to the feedstock price volatility and supply chain length that affects competitors sourcing graphite from more distant or less stable regions. This feedstock proximity supports more predictable production costs and delivery timelines for commercial customers.
FIRST GRAPHENE

Risk: Limited Global Distribution Reach

First Graphene's global distribution network remains smaller than larger, more established competitors, limiting the company's ability to serve customers efficiently outside its core Australian and Asian markets. This distribution gap could slow First Graphene's ability to capture emerging demand in North American and European battery manufacturing hubs relative to competitors with broader existing sales infrastructure.

Players Tracked

Prominent Players

Directa Plus
First Graphene
Haydale
XG Sciences
NanoXplore

Other Key Players

Graphenea
Applied Graphene Materials
Global Graphene Group
Thomas Swan and Co
Talga Group
Versarien
Angstron Materials
BeDimensional
Graphene Square
Ningbo Morsh Technology
Sixth Element Materials Technology
Deyang Carbonene Technology
Standard Graphene
Cabot Corporation
Grafoid

Recent Developments

MARCH 2025

Directa Plus announced completion of expanded graphene nanoplatelet production capacity at its Italian facility, adding dedicated line capacity for battery-grade electrode material. The expansion responds directly to rising electric vehicle battery demand and positions the company to qualify additional battery manufacturer customers requiring consistent, high-purity graphene dispersion.
Signal: Confirms incumbents are investing ahead of confirmed battery demand growth across multiple vehicle platforms and battery chemistries worldwide
JULY 2025

First Graphene signed a multi-year supply agreement with a major battery manufacturer for graphene-enhanced electrode additive material, securing recurring volume tied to the customer's expanding gigafactory production capacity. The agreement reflects the broader industry shift toward long-term specialty material supply relationships over spot-market purchasing arrangements.
Signal: Signals battery producers are locking in graphene supply relationships well ahead of announced capacity expansion cycles globally
NOVEMBER 2025

A Chinese domestic producer commissioned a new graphene oxide production facility designed to reduce national reliance on imported specialty electrode material, part of a broader government-backed advanced materials self-sufficiency initiative. The facility adds meaningful qualified capacity to the East Asian regional supply base for battery-grade material.
Signal: Indicates China is pursuing domestic graphene self-sufficiency deliberately and steadily across its broader manufacturing base nationwide

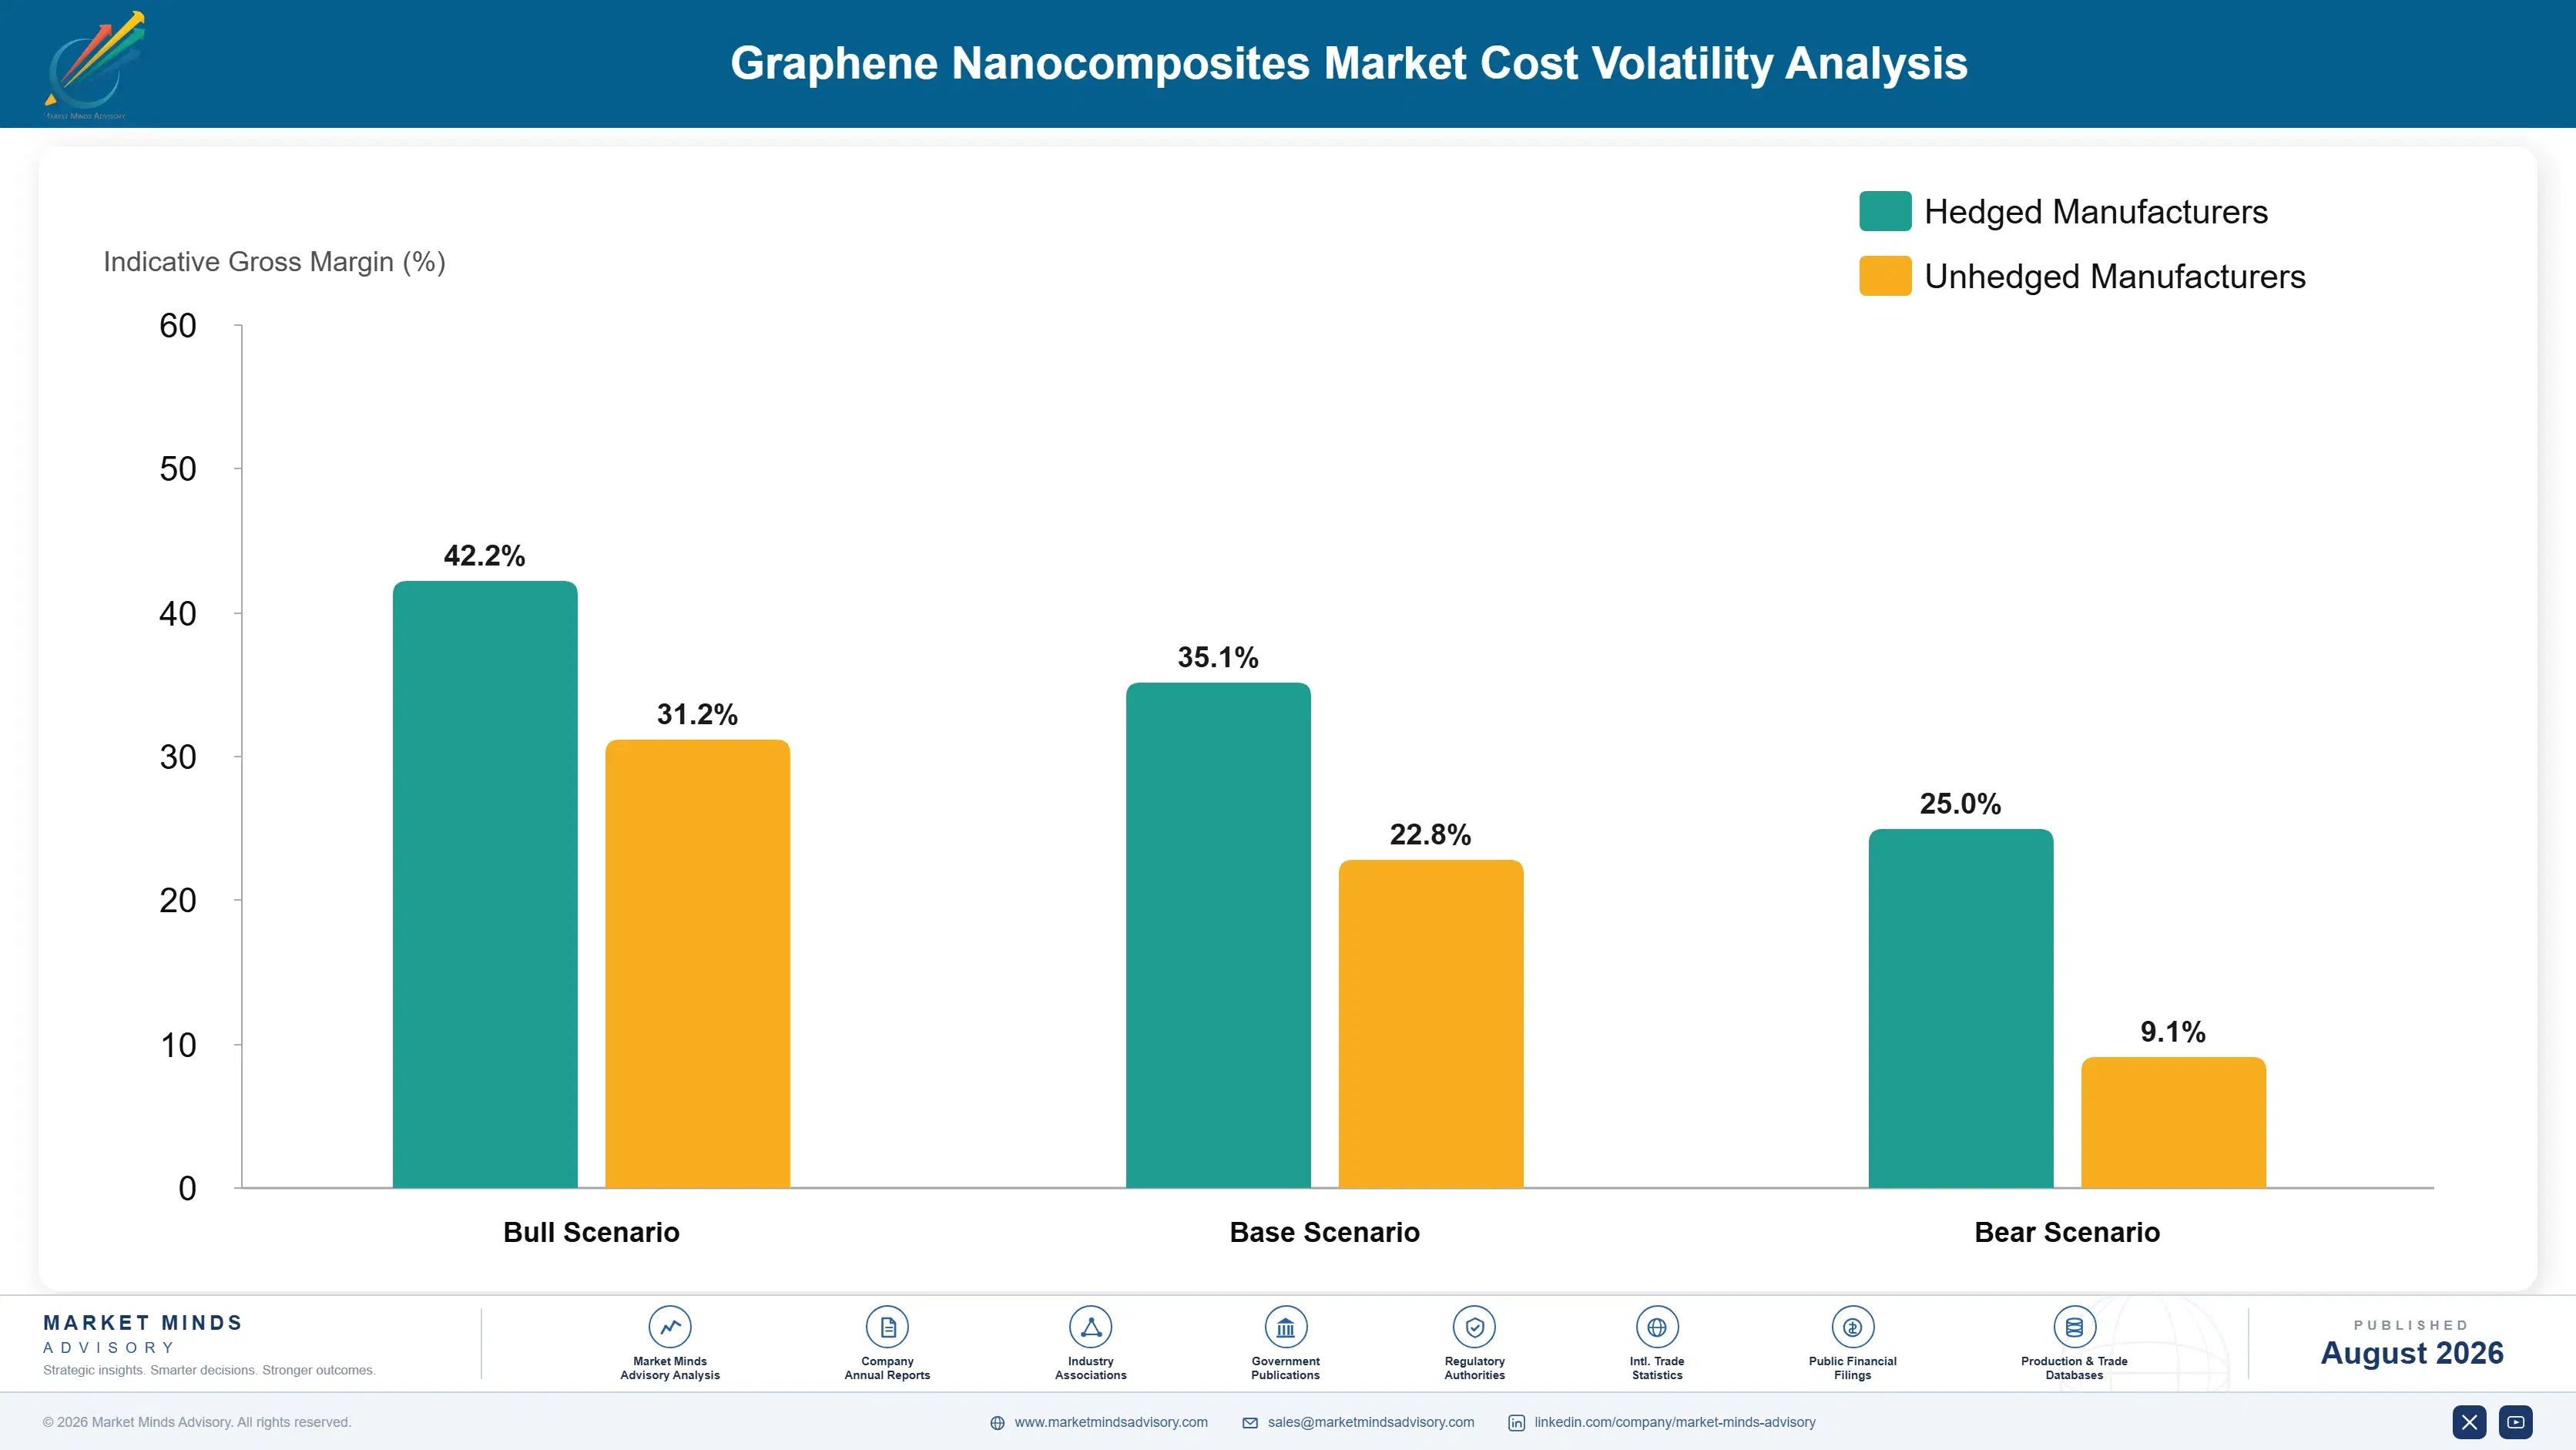
Graphite Feedstock and Energy Exposure

Graphite feedstock and processing energy together represent 35% to 45% of cost of goods sold for graphene producers, with natural and synthetic graphite sourced primarily from China, Brazil, and Mozambique rather than diversified global supply chains across most producing regions. Energy costs for exfoliation and oxidation processing add a substantial secondary cost component given the intensive processing required.
Graphite prices rose meaningfully through 2023 as Chinese export restrictions on graphite products, implemented for national security reasons, tightened global supply availability for producers outside China according to China MIIT export policy announcements. Producers without diversified feedstock sourcing absorbed most of this disruption directly, facing longer lead times and higher landed costs, while producers with established non-Chinese supply relationships weathered the disruption considerably better across comparable production volumes.

This feedstock exposure creates a genuine competitive disadvantage for producers outside China relative to Chinese competitors with direct access to domestic graphite deposits and lower processing energy costs across the country. Smaller producers without diversified sourcing face the sharpest exposure, since large diversified competitors can absorb short-term supply disruption more easily across broader production bases and multiple feedstock origin countries.
graphene-nanocomposites-market-cost-volatility-analysis-1787552992617

Diversify Graphite Feedstock Sourcing Geographically

Sourcing graphite from multiple geographic origins, rather than relying primarily on Chinese supply, reduces exposure to export restrictions and trade policy shifts that disrupted global availability through 2023. Producers already diversifying toward Brazilian and Mozambican graphite sources reported smoother supply continuity during the disruption than peers dependent entirely on Chinese feedstock imports for their production needs.

Secure Long-Term Graphite Supply Agreements

Negotiating multi-year supply agreements with graphite mining and processing partners protects against the kind of export restriction disruption that hit availability hard through 2023. This gives producers predictable feedstock access to plan production scheduling around well in advance, rather than facing spot-market shortages and price spikes unpredictably during future policy shifts and trade disputes.

Invest in Energy-Efficient Exfoliation Process Technology

Investing in more energy-efficient exfoliation and oxidation process technology reduces the substantial energy cost component of graphene production, improving margin resilience regardless of graphite feedstock price movements over time. Producers who have already upgraded processing equipment report meaningfully lower energy costs per unit of output than peers still operating older, less efficient production lines today.

Portfolio Architecture for Margin Defence

Graphene nanocomposite margins split sharply by application grade. Bulk graphene oxide sold for coating applications competes largely on price, with gross margins near 15% to 22%, while battery-grade electrode material and electronics-grade formulations command materially higher pricing. Battery-grade and sensor-grade material sits in a premium tier where quality certification and testing support justify gross margins between 30% and 40% depending on customer relationship depth.
Bulk coating-grade material still anchors meaningful revenue for many producers given steady industrial coating demand, but the margin tension is real. Producers chasing bulk volume alone see margins compressed by feedstock and energy volatility discussed earlier, while producers who shift mix toward battery-grade and electronics-grade material convert flat unit growth into meaningfully expanding profit pools instead, capturing the segment's fastest-growing demand.

High-value margin pools concentrate specifically around electric vehicle battery programmes requiring certified electrode-grade graphene, where qualification status locks in premium pricing for the full duration of a battery production programme. Sensor and electronics applications represent a growing secondary pool, as flexible circuit and biosensor manufacturers increasingly specify graphene nanocomposites over alternative conductive materials for applications requiring precise electrical property control.

Bulk graphene oxide and coating-grade material sold for industrial coatings and construction applications worldwide, with gross margins near 15% to 22% and limited differentiation between regional suppliers beyond delivery reliability.
Gross Margin

Battery-grade electrode material and electronics-grade formulations sold to gigafactories and device manufacturers with quality certification support, commanding gross margins between 30% and 38% through consistent dispersion performance and rigorous testing.
Gross Margin

Next-generation sensor and biosensor formulations tied to medical diagnostics and flexible electronics applications worldwide today, commanding the highest margins near 38% to 45% given limited qualified supplier competition currently available.
Gross Margin
graphene-nanocomposites-market-portfolio-architecture-1787552994096

High-value Sub-segments and Strategic Watch-out

Graphene Nanocomposite Energy Storage Electrodes

Energy storage electrodes combine the fastest visible-segment growth with strong margin economics, driven by electric vehicle battery producers switching to graphene-enhanced electrode materials. Producers with established battery-grade qualification and dispersion consistency are positioned to convert this combination of growth and margin into disproportionate profit expansion through 2036.

Graphene Nanocomposite Sensors and Electronics

Sensors and electronics applications already anchor a growing revenue pool tied to flexible circuits, biosensors, and conductive ink formulations requiring precise electrical property control. The segment offers the strongest margin economics in the entire market, though testing requirements and qualification timelines limit how quickly new entrants can compete effectively.

Bulk Coating-Grade Graphene Oxide

Bulk coating-grade graphene oxide remains a volume core for many producers, supplying industrial coating and construction applications that prioritize cost and delivery reliability over dispersion sophistication. Growth here tracks general industrial coating demand closely rather than outpacing it, and margins stay compressed by feedstock volatility and price competition.

Standardization Gap Risk

Standardization gaps remain a genuine strategic watch-out because the absence of universally adopted quality grading standards continues slowing commercial-scale adoption faster than producers can build buyer confidence. Producers slow to align with emerging standardization frameworks risk losing qualification opportunities to competitors who move first on shared grading systems.

Qualification-Gated Battery Demand Cycles

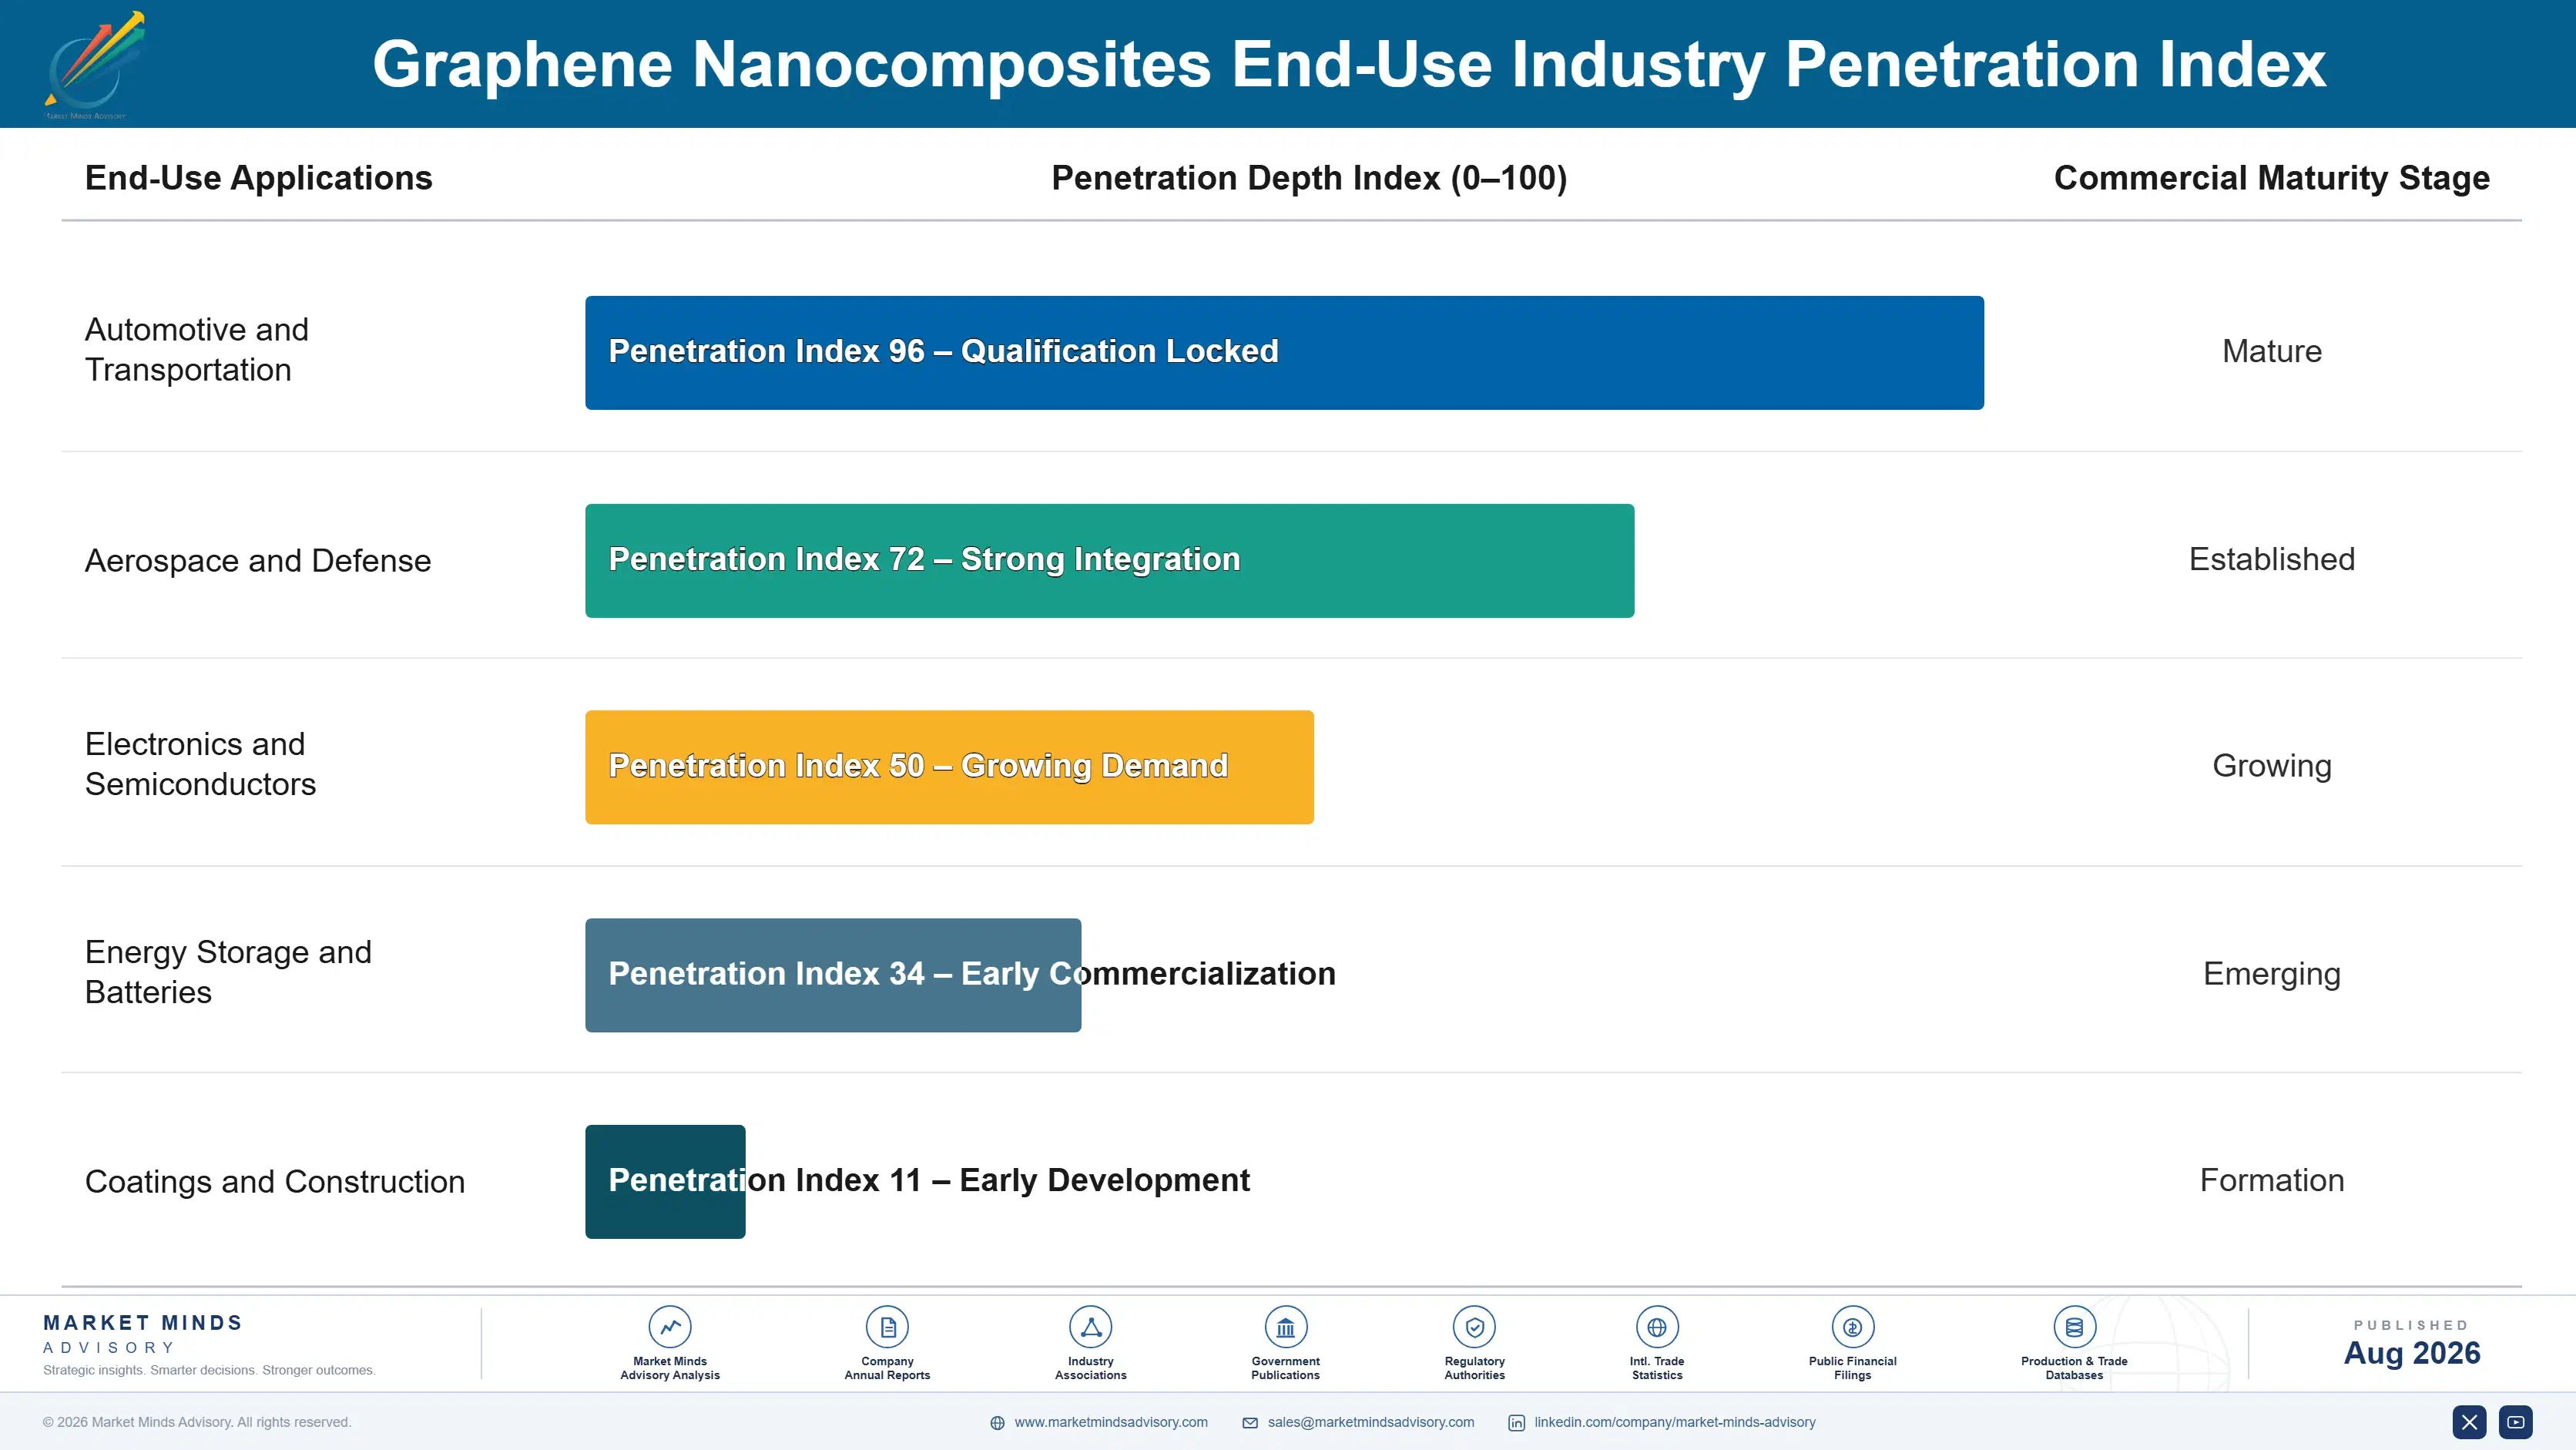
Graphene nanocomposite demand behaves like an annuity business once a producer earns qualification on a battery production programme, because requalifying a new supplier mid-programme carries meaningful cost and schedule risk for battery manufacturers. This locks in recurring purchasing across the full duration of a battery platform's production run, often spanning several years of committed volume.
Adoption stickiness varies meaningfully by end-use vertical. Battery electrode applications show the deepest stickiness because supplier qualification is tied to a specific battery chemistry's safety certification and rarely gets reopened once approved, while bulk coating buyers switch suppliers more readily based on short-term pricing. Sensor and electronics applications sit between the two, with moderate switching costs tied to device-level testing rather than full regulatory certification requirements.

Buyer profiles are shifting generationally as battery and electronics procurement moves from individual materials engineers making informal supplier choices toward centralized qualification teams applying formal, standardized testing protocols across multiple product lines and business units simultaneously. Younger engineers entering these procurement functions also carry stronger familiarity with graphene chemistry from academic training, pushing graphene-enhanced formulations into design conversations earlier than the previous generation typically allowed.
graphene-nanocomposites-market-end-use-penetration-index-1787552995476

Where Graphene Strategy Wins

These are among the four positions where our research anticipates prominent divergence between winners and laggards over the coming forecast period. Each is grounded in the demand model, the regulatory perimeter, and the announced capacity pipeline.
01 / BATTERY CERTIFICATION STRATEGY

Pursue Battery-Grade Certification Before Requirements Tighten Further

Battery-grade certification already commands pricing 2 to 3 times higher than bulk industrial rates, and producers without qualification status are locked out of the fastest-growing segment of this entire market indefinitely and completely. Pursuing certification now, before battery manufacturer qualification requirements tighten further, gives producers a head start that competitors starting later simply cannot recover through faster execution alone. Producers with existing dispersion process expertise should treat this certification investment as the single highest-leverage move available to them this coming decade.
02 / STANDARDIZATION LEADERSHIP PRIORITY

Lead Quality Standardization Efforts Ahead Of Formal Regulation

Producers who lead industry quality standardization efforts are seeing qualification cycles run roughly 30% faster than producers relying purely on ad hoc, buyer-specific testing processes across the broader global market today and tomorrow. Standardization leadership also builds valuable relationships with the consortia shaping future grading frameworks, giving early movers influence over standards competitors will eventually be forced to adopt regardless of their preference or timeline. Waiting for standards to fully mature before engaging erases this influence and speed advantage entirely.
03 / FEEDSTOCK INTEGRATION PRIORITY

Prioritize Backward Integration Into Graphite Feedstock

Backward integration into graphite feedstock production delivered roughly 20% cost savings for producers who moved on it over the past several years, a durable advantage that compounds across every subsequent production cycle and budget year without exception. Producers still purchasing feedstock on the open market remain exposed to the kind of export restriction volatility that disrupted availability meaningfully through 2023 across the broader industry. Feedstock integration should now be treated as a core strategic priority rather than a secondary cost consideration.
04 / GEOGRAPHIC MANUFACTURING FOOTPRINT

Build Manufacturing Presence In East Asia Or North America

East Asia and North America together represent the largest combined demand base, driven by graphene production scale in one region and battery and aerospace research activity in the other, and China is actively scaling downstream qualification capability through domestic investment. Producers without meaningful manufacturing presence in at least one of these two regions are ceding share to domestic competitors serving buyers with shorter lead times and lower landed costs. Building local capacity in one of these regions is now close to a competitive necessity.

Engagement Snapshot From the Field

A live engagement with an industry participant carrying material or product regulatory and market exposure ahead of a defining policy shift, showing how our research translates into a defensible multi-year portfolio strategy.
MARKET MINDS ADVISORY · CLIENT ENGAGEMENT SUMMARY
Graphene Nanocomposites Producer Strategic Portfolio Review and Transition Roadmap 2026·Investment Scenario on Graphene Nanocomposites Exposure Evaluation 2025-26
CLIENT PROFILE
The client is a mid-sized graphene producer serving industrial coating and specialty chemical customers across two continents, with annual revenue in the tens of millions of dollars. The company had built its position entirely on bulk coating-grade graphene oxide but had never pursued battery-grade certification despite holding dispersion process capacity technically comparable to specialty competitors already serving electric vehicle battery customers.
STRATEGIC CHALLENGE
Coating-grade margins had compressed as Chinese production capacity expanded and per-unit costs declined industry-wide, while the client lacked visibility into what battery-grade certification would actually require, how long it would take, and whether the investment would pay back within a reasonable timeframe. Leadership needed a credible, data-backed case before committing capital to a quality upgrade with an uncertain outcome.
MMA APPROACH
MMA conducted primary interviews with the client's process engineers, two battery manufacturer procurement officials, and three specialty competitors' former employees to map the specific certification requirements and realistic timeline for battery-grade qualification. The engagement combined this qualitative work with a financial model comparing battery-grade versus coating-grade margins, quantifying the payback period under conservative and optimistic qualification timeline scenarios.
KEY FINDINGS
  1. Certification lead time for battery-grade graphene averaged sixteen months across the interviewed procurement officials, longer than the client's initial internal estimate of nine months by a meaningful margin.
  2. Battery-grade competitors priced their material at gross margins 18 to 22 percentage points above the client's coating-grade line, confirming a payback period under three years even in conservative scenarios.
  3. Two of three former competitor employees interviewed identified dispersion consistency testing, not raw production capacity, as the single largest barrier smaller producers faced when pursuing battery-grade certification independently.
  4. The client's existing dispersion equipment met roughly 70% of battery-grade testing requirements already, needing only incremental investment in analytical testing infrastructure to close the remaining qualification gap.
CLIENT PROFILE
The client is a mid-sized graphene producer serving industrial coating and specialty chemical customers across two continents, with annual revenue in the tens of millions of dollars. The company had built its position entirely on bulk coating-grade graphene oxide but had never pursued battery-grade certification despite holding dispersion process capacity technically comparable to specialty competitors already serving electric vehicle battery customers.
STRATEGIC CHALLENGE
Coating-grade margins had compressed as Chinese production capacity expanded and per-unit costs declined industry-wide, while the client lacked visibility into what battery-grade certification would actually require, how long it would take, and whether the investment would pay back within a reasonable timeframe. Leadership needed a credible, data-backed case before committing capital to a quality upgrade with an uncertain outcome.
MMA APPROACH
MMA conducted primary interviews with the client's process engineers, two battery manufacturer procurement officials, and three specialty competitors' former employees to map the specific certification requirements and realistic timeline for battery-grade qualification. The engagement combined this qualitative work with a financial model comparing battery-grade versus coating-grade margins, quantifying the payback period under conservative and optimistic qualification timeline scenarios.
KEY FINDINGS
  1. Certification lead time for battery-grade graphene averaged sixteen months across the interviewed procurement officials, longer than the client's initial internal estimate of nine months by a meaningful margin.
  2. Battery-grade competitors priced their material at gross margins 18 to 22 percentage points above the client's coating-grade line, confirming a payback period under three years even in conservative scenarios.
  3. Two of three former competitor employees interviewed identified dispersion consistency testing, not raw production capacity, as the single largest barrier smaller producers faced when pursuing battery-grade certification independently.
  4. The client's existing dispersion equipment met roughly 70% of battery-grade testing requirements already, needing only incremental investment in analytical testing infrastructure to close the remaining qualification gap.
RECOMMENDED STRATEGY
Phase 1: Invest in analytical testing infrastructure immediately, closing the identified 30% testing gap before beginning formal certification submission with battery manufacturer qualification programmes and their auditors. Phase 2: Begin qualification proceedings with the manufacturer showing the shortest historical certification timeline, while continuing coating-grade production to fund the qualification investment during the process. Phase 3: Launch battery-grade electrode material products upon certification completion, targeting the interviewed procurement contacts as anchor customers for the first qualified programme wins available.
OUTCOME
Within nineteen months of the engagement, the client completed battery-grade certification and won its first qualified supply contract with a mid-sized electric vehicle battery manufacturer. Qualified product revenue reached 8% of total sales within the first year of launch, with gross margin on that line reported at 35%, figures client-reported and unverified by MMA.

Frequently Asked Questions

Foundational context covering the market sizes, CAGR, scope, country, region and competition that inform every finding below. This section is provided to cover basics and most often pre-purchase conversations, answered from the MMA Primary Research Dataset.

What is the current size of the Graphene Nanocomposites Market?

The Graphene Nanocomposites Market reached an estimated $1.6 billion in global value during 2025, the base year for this report. Growth is driven by electric vehicle battery electrode qualification alongside expanding structural composite and coating applications.

How large will the Graphene Nanocomposites Market be by 2036?

MMA projects the market will reach approximately $7.8 billion by 2036, nearly quadrupling from its 2025 base value. This expansion reflects a compound annual growth rate of 15.5% sustained across the full forecast period.

What is the CAGR for the Graphene Nanocomposites Market 2026 to 2036?

The base case compound annual growth rate is 15.5% across the 2026 to 2036 forecast window. Bull and bear scenarios range from 16.9% to 14.1%, depending on battery adoption and standardization progress.

Which segment is growing fastest?

Energy storage electrode applications are the fastest-growing segment, expanding at 19.5% annually, roughly 1.3 times the overall market rate. Sensors and electronics applications follow closely as the second-fastest segment given growing biosensor demand.

Who are the major companies in the Graphene Nanocomposites Market?

Leading suppliers include Directa Plus, First Graphene, Haydale, XG Sciences, and NanoXplore, together holding an estimated 42% combined share. Competition is evaluated on a revenue basis across research-grade and commercial production.

Which country is growing fastest?

India is the fastest-growing major market, expanding at approximately 18.0% annually as its battery and electronics manufacturing self-reliance programmes accelerate. This outpaces the global average meaningfully across both research and commercial-grade demand.

Report Segmentation Architecture

The full report scope spans multiple orthogonal segmentation dimensions, with cross-tabulated demand data provided for each dimension pair. Coverage extends further to regional breakdowns, trend trajectories, and the competitive detail needed to support segment-level decision-making.

By Matrix and Application Type

  • Graphene-Polymer Nanocomposites
  • Graphene-Metal Matrix Nanocomposites
  • Graphene-Ceramic Nanocomposites
  • Graphene Nanocomposite Coatings and Films
  • Graphene Nanocomposite Energy Storage Electrodes
  • Graphene Nanocomposite Sensors and Electronics

By End-Use Industry

  • Automotive and Transportation
  • Aerospace and Defense
  • Electronics and Semiconductors
  • Energy Storage and Batteries
  • Coatings and Construction

By Commercial Dimension

  • Direct Battery Manufacturer Contracts
  • Industrial Distributor Sales
  • OEM Electronics Integration
  • Research and Development Supply

By Region

  • North America
  • Western Europe
  • East Asia
  • South Asia and Pacific
  • Latin America
  • Middle East and Africa
  • Eastern Europe

Scope, Methodology, and Coverage

Every figure in this report is reproducible from documented input assumptions. The scope below maps the historical period, the forecast horizon, the segmentation dimensions, and the countries covered, alongside the underlying primary and qualitative methodology.
Historical Period
2020 to 2025
Forecast Period
2026 to 2036
Base Year
2025 (USD billions; MMA Primary Research Dataset, August 2026)
Market Definition
The Graphene Nanocomposites Market covers graphene and graphene derivative materials dispersed into polymer, metal, and ceramic matrices to enhance conductivity, strength, or barrier properties. It excludes standalone graphene powder or film products not yet incorporated into a composite matrix, and unrelated carbon nanotube or fullerene nanocomposite categories.
Quantitative Units
USD billions (current prices); metric tons for volume-referenced segment discussion where applicable
Segmentation Dimensions
By Matrix and Application Type; By End-Use Industry; By Commercial Dimension; By Region
Regions Covered
North America, Western Europe, East Asia, South Asia and Pacific, Latin America, Middle East and Africa, Eastern Europe
Countries Covered
USA, China, Germany, France, UK, Japan, South Korea, India, Australia, Canada, Brazil, Mexico, Indonesia, Vietnam, Thailand, Malaysia, UAE, Saudi Arabia, South Africa, Nigeria, Turkey, Poland, Netherlands, Italy, Spain, Sweden, Switzerland, Argentina, Colombia, Singapore, and additional markets relevant to this sector
Key Companies Profiled
Directa Plus, First Graphene, Haydale, XG Sciences, NanoXplore, Graphenea, Applied Graphene Materials, Global Graphene Group, Thomas Swan and Co, Talga Group, Versarien, Angstron Materials, BeDimensional, Graphene Square, Ningbo Morsh Technology, Sixth Element Materials Technology, Deyang Carbonene Technology, Standard Graphene, Cabot Corporation, Grafoid
Quantitative Methodology
Primary survey, n=3,800 respondents, Q4 2025, six countries; demand-side model with trade association cross-validation
Qualitative Methodology
47 expert interviews, Q4 2025; applied to validate demand model assumptions, identify emerging dynamics, and assess competitive positioning
Report Format
PDF and XLSX data workbook (Word format preview document)
Publisher
Market Minds Advisory
Report Code
MMA-2026-CHM-218
Published
August 2026
Contact
sales@marketmindsadvisory.com | www.marketmindsadvisory.com

Purchase the full Graphene Nanocomposites Market Report (2026 to 2036).

This report provides a comprehensive, ten-year forecast of the global Graphene Nanocomposites Market. Coverage spans battery electrode, sensor and electronics, structural composite, and coating applications across all seven world regions. Deliverables include segment-level and regional sizing to 2036, competitive benchmarking of twenty profiled companies on a consistent revenue basis, and feedstock cost exposure analysis. A strategic verdict identifies where producers should concentrate capital and certification investment over the coming decade. The report is built from primary survey data, expert interviews, and company disclosures rather than secondary aggregation.
Ten-year sizing and CAGR forecasts across seven global regions
Segment-level analysis of battery, sensor, and structural applications
Competitive benchmarking of twenty profiled graphene manufacturers
Graphite feedstock cost exposure and mitigation strategy analysis
Battery-grade certification and standardization timeline tracking by region
Strategic verdict on capital allocation and certification investment priorities

Built For The People Who Decide

From boardroom strategy to bench-side execution, this report is read cover-to-cover by leaders shaping the next decade of their industry, turning demand scenarios, market dynamics and valuation benchmarks into decisions.
CXOs/ Presidents/ VPs/ Managers
M&A and Corporate Development
Strategy Teams and R&D Heads
Procurement and Product Directors
Regulatory and Compliance Leaders
Investor Relations and Equity Analysts