Market Minds Advisory
Grant Management Software Market

Grant Management Software Market: Grant Management Software Market: Award Administration, Compliance and Subrecipient Oversight, 2026 to 2036

Almost two thirds of these systems are bought after an audit finding rather than before one, which makes the category a response to statutory consequence rather than a decision about administrative efficiency anywhere.

Lead Analyst

Published

September 2026

Make Smarter Decisions with Customized Research Insights

Request a free sample report and evaluate market opportunities, growth trends, and competitive dynamics relevant to your business needs.

2025 MARKET VALUE$2.6BMarket Size 2025
2036 FORECAST VALUE$7.4BBase Case , 2026 to 2036
CAGR 2026 TO 20369.8 %Bull 11.0% / Bear 8.5%
INCREMENTAL OPPORTUNITY$4.5BNet 10- year value creation
EXPANSION MULTIPLE2.55x2036 value over 2026 base
Strategic Levers
M&A Pipeline
Regional Outlook
Country Rankings
Competitive Intelligence
Segmental Deep-dive
Call-Us : 91 93563 13602

Executive Snapshot and Market Trajectory.

Grant management software is bought to survive audits, not to manage grants. Roughly 64% of purchases follow an adverse finding or a failed single audit, which means the buying trigger is a statutory consequence rather than an efficiency calculation. That distinction shapes everything about how the category sells.
Compliance reporting and audit automation grows at 14.7%, half again the market rate of 9.8%, because subrecipient monitoring obligations expanded faster than any agency could staff for. North America holds 38% of licence value on the strength of federal award volume and the audit regime attached to it. Elsewhere, demand follows whichever supervisory framework has teeth. Statutory consequence, not administrative ambition, decides where this software gets bought at all.
The vendor field is unusually fragmented, with the top five holding only 34% and dozens of regional specialists serving single agency types. Consolidation has started but moves slowly, because public procurement rules protect incumbents through long contract terms. Meanwhile grantees keep parallel spreadsheets in 58% of cases, which tells you the promised administrative relief has not arrived. The reconciliation gap between funder portals and grantee accounting remains the largest unaddressed opening in the category today.
Market Definition
The grant management software market covers systems that administer the award lifecycle for grantors and grantees, including application intake and review, award and disbursement management, compliance and audit reporting, subrecipient monitoring, financial reconciliation, and outcome measurement. It excludes general accounting and enterprise resource planning platforms, donor fundraising and constituent relationship management software, and procurement or contract management systems for purchased goods and services.
Base Year Value
$2.6B in 2025 (MMA Primary Research Dataset, September 2026)
Forecast Period
2026 to 2036, eleven discrete annual values
CAGR
9.8% base case. Bull 11.0%. Bear 8.5%.
Fastest Growth Segment
Compliance Reporting And Audit Automation: 14.7% CAGR
Fastest Growth Country
India: 13.2% CAGR
Fastest Growth Region
South Asia and Pacific: 12.0% CAGR
Largest Region
North America: 38% of 2025 global value
Market Leaders
Bonterra, Blackbaud, Submittable, Euna Solutions, and Fluxx lead the field. Source: MMA Primary Research Dataset, July 2026.
Primary Survey
n=3,800 procurement and R&D decision-makers, Q4 2025, six countries
Methodology
Demand-side build-up, cross-validated against public data, 47 expert interviews

Grant Management Software Market Forecast Scenarios

grant-management-software-market-size-forecast-scenario-1790004132870
Growth between 2020 and 2025 was pulled forward by emergency disbursement. Pandemic relief programmes and infrastructure funding pushed enormous award volume through agencies whose administration ran on spreadsheets, and the audit findings that followed created a buying wave nobody had planned for. Historical growth of 8.7% conceals a sharply uneven pattern, with two very strong years followed by digestion as agencies absorbed what they bought under pressure.
The base case at 9.8% rests on three mechanisms. Subrecipient monitoring obligations continue to expand faster than agency headcount, which forces automation regardless of budget appetite. Outcome reporting requirements attached to newer funding programmes cannot be satisfied by financial systems alone. And generational replacement of custom-built agency systems, many written more than fifteen years ago and now unsupportable, converts internal maintenance budget into commercial licence spend at a steady annual rate.
The bull case at 11.0% depends on statutory reporting standards becoming machine-readable across major funders, which would make manual submission untenable overnight. The bear case at 8.5% is a public spending contraction: grant administration budgets are discretionary in a way that award disbursement is not, and agencies under fiscal pressure defer system replacement for years while running unsupported software.

Audit Findings Drive The Purchase

Nobody buys this software because grant administration is tedious. They buy it because an auditor wrote something down. About 64% of deals begin with an adverse finding, a failed single audit, or a funder's corrective action plan, and the evaluation that follows is short, defensive, and led by a finance director rather than a programme officer. Programme staff are consulted, rarely decisive.
TOP FIVE CONCENTRATION34%Share of licence value held by the leading vendors
MEDIAN CONTRACT VALUEUSD 96,000Annual subscription paid by a typical agency buyer
AUDIT-TRIGGERED PURCHASES64%Deals initiated after an adverse finding or failed audit
IMPLEMENTATION DURATION31 weeksMedian period from contract signature to first live cycle
PARALLEL SPREADSHEET USE58%Grantees maintaining separate records alongside the funder portal
GROSS RENEWAL RATE93%Subscriptions renewed without downgrade at the anniversary date
That origin explains the renewal behaviour. Gross renewal reaches 93%, higher than almost any comparable public sector software category, because removing the system means explaining to an auditor why you removed it. It also explains why functional breadth loses to evidentiary completeness in evaluations, and why vendors who lead with user experience consistently lose to vendors who lead with the audit trail. Defensive purchases produce defensive renewals, year after year.
What the software has not done is reduce work for grantees. In 58% of cases the receiving organisation keeps parallel records, because the funder's portal does not reconcile to its own accounting and the two must be kept in step manually. That gap is the largest unaddressed opportunity in the category and the clearest source of grantee dissatisfaction. Almost no vendor has closed it properly yet.
"This is the only enterprise software category we cover where the buyer is genuinely not the user and never becomes one. Vendors who design for the auditor rather than the programme officer win, which is uncomfortable but consistently true across every deal we examined."
Practice Director, Public Sector and Nonprofit Technology · MMA Technology Practice · September 2026

Market Trends

Subrecipient Monitoring Obligations Outrun Available Agency Headcount

Pass-through entities carry responsibility for what their subrecipients do with awarded money, and the monitoring standard has tightened while agency staffing has not. A mid-sized state department may pass funds to two hundred organisations and be answerable for every one of them. Risk assessment, documented site visits, and corrective action tracking cannot be done manually at that count, which turns monitoring modules from an option into a requirement. About 41% of new licence value in the past two years attached to subrecipient functionality specifically, and it is the module most frequently added to an existing contract mid-term.
Market Impact: Adds 12,000 newly obligated organisations
Custom Agency Systems Reach End Of Supportable Life

A large share of public grant administration still runs on systems built internally, many of them more than fifteen years old, maintained by staff who have retired. Security review increasingly fails these systems outright, which forces the decision that budget pressure had deferred. Replacement converts internal maintenance spend into commercial licence spend at close to a one-to-one rate, and it produces unusually large single contracts because an entire programme portfolio migrates at once. Roughly 27% of current pipeline value sits in replacement of internally built systems, and that share has risen in each of the past three years.
Market Impact: Appears in 38% of evaluations

Market Opportunities and Growth Drivers

Single Audit Thresholds Expand The Obligated Population

Raising or lowering the expenditure threshold that triggers a single audit moves thousands of organisations in or out of a formal compliance regime, and every organisation crossing the line needs evidence it did not previously have to produce. Recent threshold and reporting changes brought a substantial number of mid-sized nonprofits and smaller municipalities into scope for the first time. These buyers have no internal compliance function, so they buy software rather than hire, and they buy quickly because the deadline is fixed. Contract values are modest but volume is high, and renewal is close to automatic.
Market Impact: Affects 58% of grantee deployments

Outcome Reporting Attaches To Newer Funding Programmes

Funders increasingly require evidence of what the money achieved, not merely that it was spent within permitted categories. Financial systems cannot answer that question, and the reporting templates attached to newer infrastructure, climate, and workforce programmes demand structured outcome data on a fixed schedule. Agencies that cannot produce it risk clawback or non-renewal of the programme itself. Outcome measurement modules now appear in about 38% of new agency evaluations, up sharply from a marginal position five years ago, and they are the functionality most often decisive when two otherwise similar vendors compete.
Market Impact: Locks contracts 5 to 7 years

Market Restraints and Challenges

Grantees Keep Parallel Records Despite Portal Deployment

In 58% of cases the receiving organisation maintains its own spreadsheets alongside the funder's system. The root cause is reconciliation: the portal's categories do not map to the grantee's chart of accounts, so every submission requires manual translation and the organisation keeps its own version as the authoritative one. Commercially this caps the value a vendor can claim, weakens grantee-side references, and leaves the promised administrative relief undelivered. Participants are responding with accounting system connectors, configurable category mapping, and in a few cases direct ledger integration, though adoption of these features remains uneven across the installed base.
Market Impact: Drives 41% of new licence value

Public Procurement Terms Lock Incumbents For Years

Agency contracts commonly run five to seven years with renewal options, and re-procurement demands effort that understaffed administration teams avoid unless something has failed. The root cause is procurement law designed to prevent favouritism, which in practice produces stability that favours whoever won last time. For challengers this means addressable demand in any given year is a fraction of the installed base, which slows consolidation and depresses growth. Vendors work around it through cooperative purchasing vehicles, pre-negotiated schedules, and modular additions sold to existing contracts without triggering a full competitive process.
Market Impact: Holds 27% of pipeline value
4 additional market trends, 3 additional growth drivers, and 2 additional restraints and challenges are covered in the full report. Contact sales@marketmindsadvisory.com to access the complete intelligence.

Segment CAGR and Growth Architecture

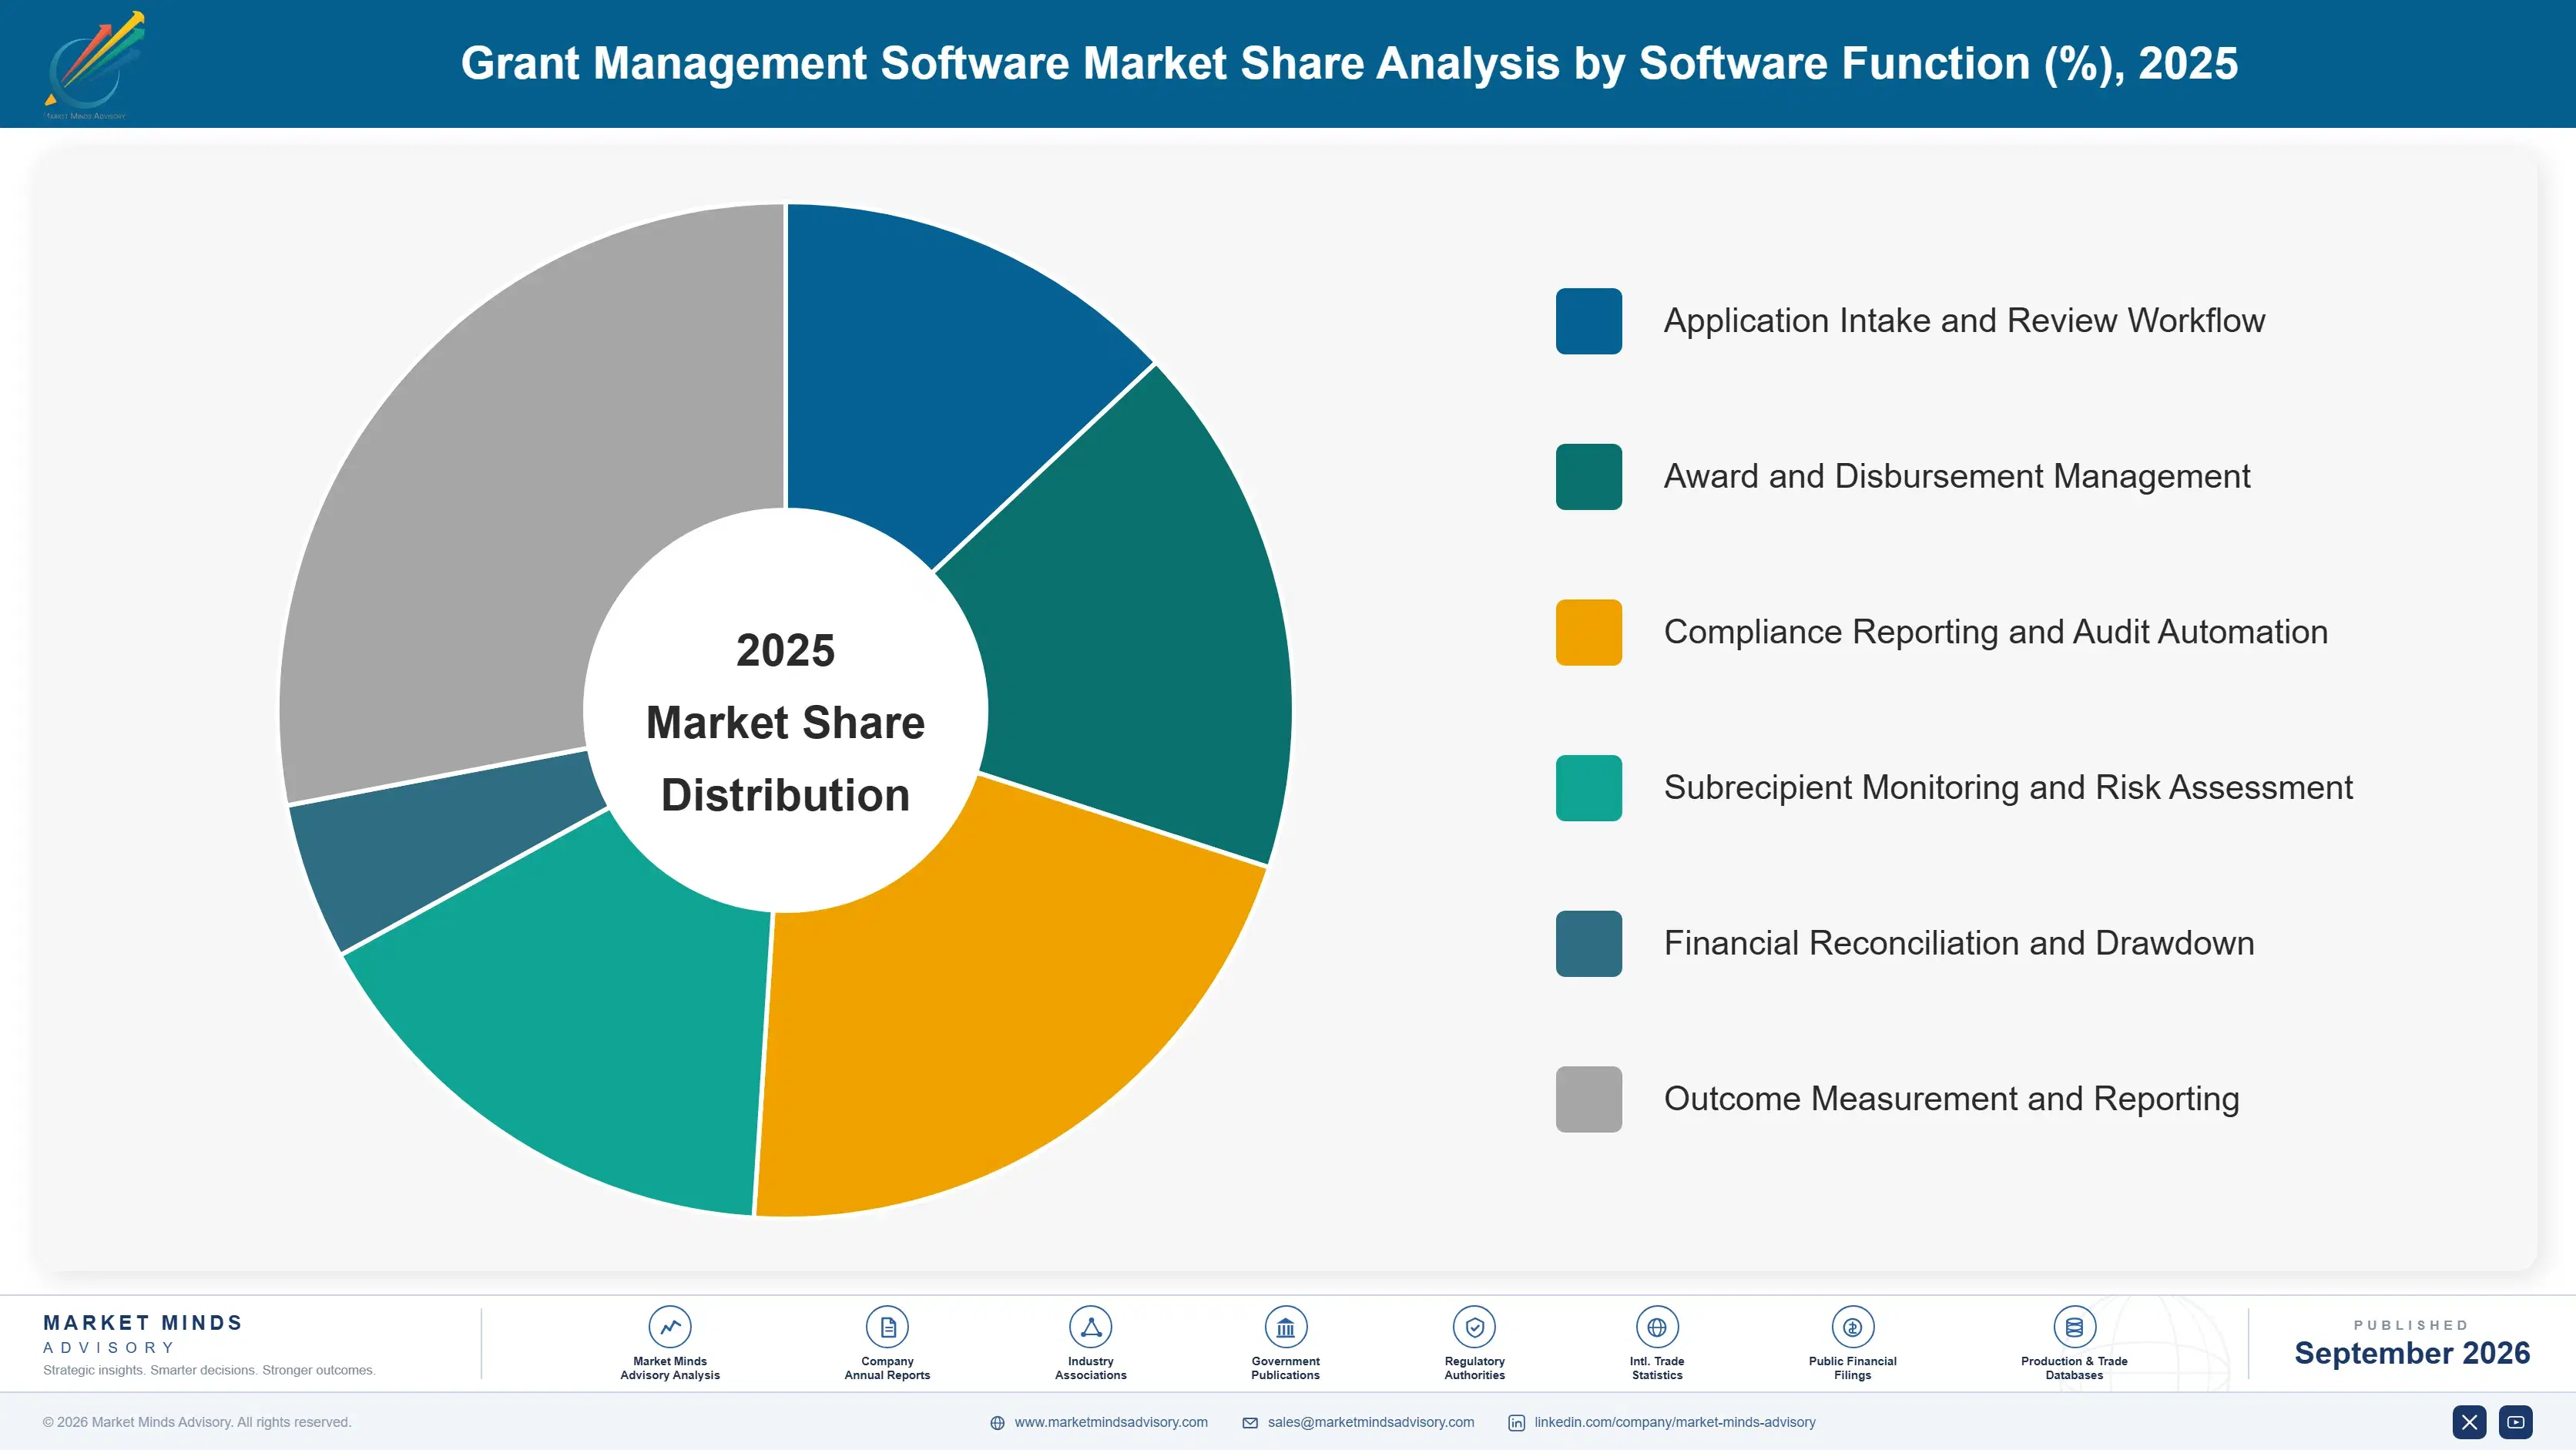
Segmentation follows software function across the award lifecycle. Six functional segments describe what the system does: application intake and review workflow, award and disbursement management, compliance reporting and audit automation, subrecipient monitoring and risk assessment, financial reconciliation and drawdown, and outcome measurement. Most buyers begin with two and add the rest at renewal. Two more usually follow later.
grant-management-software-market-market-share-analysis-1790004133458

Compliance Reporting And Audit Automation

Compliance reporting grows at 14.7%, half again the market rate of 9.8%, and the reason is that this is what buyers actually came for. When 64% of purchases follow an audit finding, the module that produces defensible evidence carries the whole business case and the rest of the platform is bought around it. Demand strengthens each time a reporting standard changes, because agencies discover their existing configuration cannot produce the new format. Vendors with a track record of shipping standard changes ahead of the deadline win renewals on that alone. Displacement of incumbents, where it happens at all, happens over a missed reporting deadline rather than over price. Price is almost never the deciding factor here.
CAGR 14.7%

Subrecipient Monitoring And Risk Assessment

Subrecipient monitoring grows at 11.4% on an obligation that expanded without corresponding staffing. Pass-through entities answer for money they no longer control, across counts that regularly reach several hundred organisations, and the standard now expects documented risk assessment rather than a signed assurance. That is administratively impossible by hand at scale. The module accounts for about 41% of new licence value and is the one most often added mid-term to an existing contract, which makes it commercially valuable out of proportion to its share, since it expands accounts without triggering competitive re-procurement. Vendors treat it as the primary land-and-expand path into locked agency contracts. No other module expands accounts as reliably as this one does.
CAGR 11.4%
Full segment breakdown across 6 segments available in the complete report.

Regional Architecture and Country Demand Map

Regional shares track where formal grant audit regimes carry statutory consequence, not where public money is disbursed. That distinction matters, because several regions move very large award volumes through government-built systems that never reach the commercial software market at all in practice. Consequence rather than volume sets demand.

North America

At 38% North America sits well above the standard band, and the justification is the single audit regime: no other jurisdiction attaches comparable statutory audit consequence to grant expenditure across federal, state, tribal, and nonprofit recipients simultaneously. Federal award volume passes through tens of thousands of pass-through entities, each answerable for subrecipient conduct, which creates obligated demand that exists nowhere else at this density. Canadian provincial and federal transfer programmes add a smaller but similar buyer group. Growth of 9.0% trails several regions because penetration is already high and activity is dominated by replacement of internally built systems rather than by organisations buying for the first time. Replacement contracts are the largest in the category.
Share: 38% | CAGR: 9.0% (2026 to 2036)

Western Europe

Demand here concentrates in the administration of European Union cohesion and regional development funding, where managing authorities in member states must evidence eligibility of expenditure to auditors who can and do demand repayment. That is a genuine consequence and it drives genuine purchasing. National research councils and arts funders form a second, smaller buyer group with quite different requirements around peer review workflow. Growth of 8.3% is the slowest of the seven regions, held back by long procurement cycles, by fragmentation across twenty-odd national administrative traditions, and by a preference among larger member states for systems commissioned rather than licensed from commercial vendors. Commissioned systems absorb much of the potential demand here.
Share: 22% | CAGR: 8.3% (2026 to 2036)
Regional intelligence for 5 additional markets available in the complete report: East Asia, South Asia and Pacific, Latin America, Middle East and Africa, Eastern Europe. Contact sales@marketmindsadvisory.com.
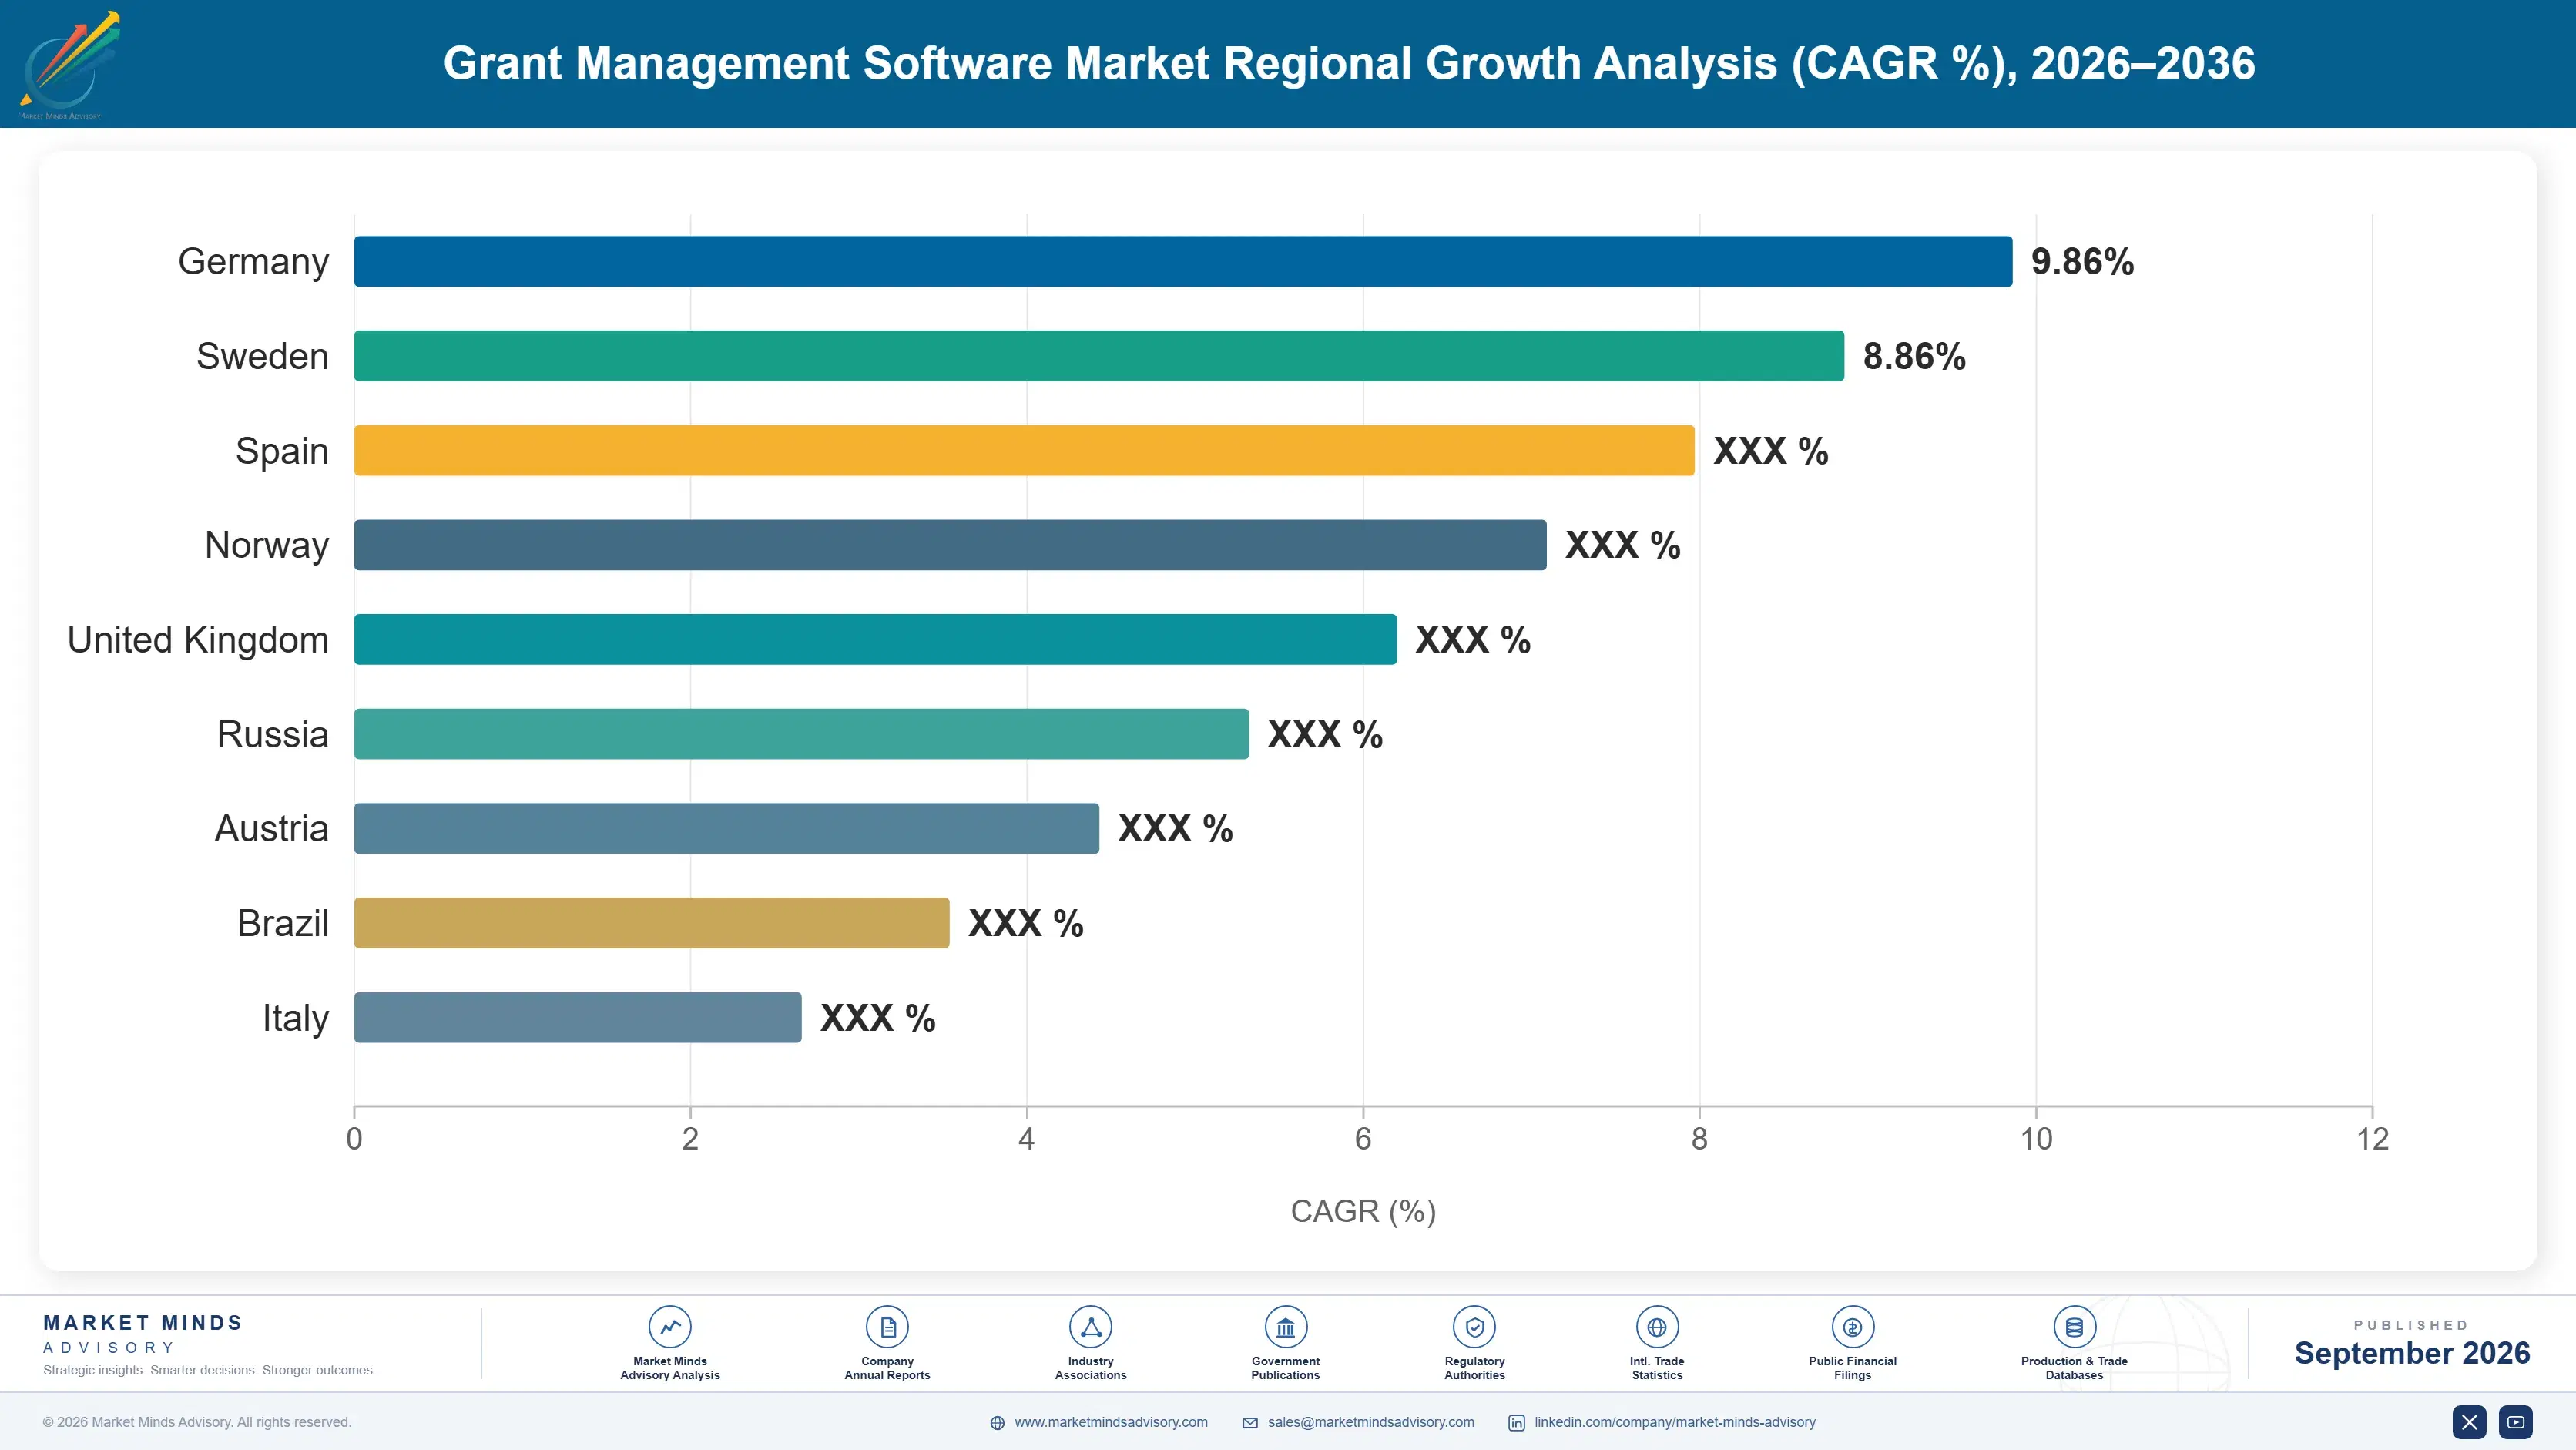
grant-management-software-market-country-cagr-analysis-1790004133985

Where Vendors Earn Beyond Renewal

Four commercial moves separate vendors that expand accounts from vendors that merely keep them. Each works around the same constraint: public procurement locks contracts for years, so growth has to come from inside existing relationships rather than from competitive displacement, which almost never becomes available in any given year. Displacement is not a viable primary strategy.

Sell Subrecipient Monitoring Into Locked Agency Contracts

Monitoring modules can usually be added to an existing agreement without triggering a full competitive process, which makes them the only reliable growth path inside a five to seven year contract term. The obligation is expanding independently of budget appetite, so the sale does not require creating demand. Vendors running this motion systematically report account values rising 22% to 31% over a contract term without a single competitive event. It also deepens the configuration, which raises the cost of eventual re-procurement for the agency considerably. The obligation arrives whether the budget does or not.
Market Impact: Grows account value by 22% to 31% overall

Ship Reporting Standard Changes Before The Deadline

Every change to a statutory reporting format is a moment when an agency discovers its configuration cannot produce the required output. Vendors who ship the change 8 to 12 weeks ahead of the deadline convert a moment of institutional anxiety into a renewal argument that needs no discounting. Those who ship late lose accounts that were otherwise secure, because a missed reporting deadline is the one failure a finance director cannot absorb. This is the single clearest determinant of retention in the category and it costs relatively little to do well.
Market Impact: Protects a 93% gross annual renewal rate overall

Build Accounting Connectors To End Parallel Records

Grantees keep their own spreadsheets in 58% of deployments because the portal will not reconcile to their chart of accounts. Direct connectors to the three accounting packages most common among mid-sized nonprofits remove that translation work entirely. Vendors offering them report grantee satisfaction scores roughly 19 points higher, which matters because grantee complaints are what put an agency contract at risk during re-procurement. The work is unglamorous integration engineering, and almost nobody has completed it properly across the installed base yet. Grantee complaints surface precisely when a contract comes up for re-procurement review.
Market Impact: Lifts grantee satisfaction scores by roughly 19 points

Enter Through Cooperative Public Purchasing Vehicles

Pre-negotiated cooperative schedules let an agency buy without running its own procurement, which collapses a nine month process into a few weeks and is the only practical route into buyers who would otherwise never open a competition. Vendors listed on the major vehicles close roughly 2.4 times as many new public agency deals per year as those relying on direct procurement alone. Listing costs administrative effort and some pricing transparency, and it is worth both, particularly for challengers with no incumbent position to defend. It is the fastest route into an otherwise closed buyer.
Market Impact: Closes about 2.4 times more new agency deals

Who Controls the Margin Pool

This is a fragmented field by the standards of enterprise software. The top five hold 34% of licence value measured consistently on that basis across all participants, and beneath them sit dozens of specialists serving a single agency type, funding stream, or country. The gap between the leader and the fifth participant is narrow, and no vendor holds a position that a determined competitor could not attack given an open procurement.
Competition currently turns on three things: demonstrated audit defensibility, speed of shipping statutory reporting changes, and presence on cooperative purchasing vehicles. Price matters less than outsiders expect, because the alternative to buying is an audit finding rather than a cheaper product. Functional breadth is losing ground to evidentiary completeness in how evaluations are actually scored. Evaluations reward evidence over features.

Consolidation has begun but proceeds slowly, since long contract terms mean an acquirer buys an installed base it cannot immediately migrate. Private equity backed roll-ups are the main mechanism. Rankings will shift toward whoever holds the replacement pipeline for internally built agency systems, which is where the largest individual contracts in the category now sit. Those contracts are large, slow, and rarely contested twice.
grant-management-software-market-company-positioning-matrix-1790004134512

Competitive Moat and Risk Dimensions

BONTERRA

Moat: Breadth Across Grantor Sides

Holding products used by funders and by receiving organisations gives visibility into both sides of the same award relationship, which few competitors can match. That position supports reconciliation features others cannot build and makes the company a defensible default for foundations administering complex multi-year portfolios across many recipients simultaneously.
BONTERRA

Risk: Integration Debt From Acquisitions

The portfolio was assembled through multiple acquisitions, and product overlap creates confusion in evaluations where a buyer wants one system rather than a family of them. Rationalising the estate risks disrupting installed accounts precisely when long procurement cycles make any customer disturbance unusually expensive to recover from later.
BLACKBAUD

Moat: Entrenched Foundation Installed Base

Decades of presence among private foundations and higher education institutions produce switching costs that go well past software, extending into finance processes, historical award records, and staff familiarity. Re-procurement in this buyer group is rare, and when it happens the incumbent starts with an advantage that competitors find expensive to overcome.
BLACKBAUD

Risk: Public Agency Presence Thin

The strongest growth in the category sits in public agency replacement of internally built systems, where the company's position is weaker than its foundation footprint suggests. Competing there demands procurement capability, cooperative vehicle listings, and audit credentials built for statutory regimes rather than for private grant-making practice.

Players Tracked

Prominent Players

Bonterra
Blackbaud
Submittable
Euna Solutions
Fluxx

Other Key Players

SmartSimple
Foundant Technologies
WizeHive
Streamlyne
eCivis
AmpliFund
Salesforce
Workday
Cayuse
InfoReady
Optimy
Good Grants
Zengine
GrantVantage
Kaleidoscope

Recent Developments

FEBRUARY 2026

Euna Solutions Adds Subrecipient Risk Scoring To Agency Platform

Euna Solutions released automated subrecipient risk assessment and corrective action tracking, allowing pass-through entities to document monitoring across several hundred receiving organisations without proportional staffing increases, and to evidence that documentation directly to auditors on request. Risk scoring runs against prior findings and expenditure history.
Signal: Monitoring functionality is being sold into locked contracts because competitive procurement rarely opens for challengers anywhere.
OCTOBER 2025

Submittable Publishes Accounting Package Connectors For Grantees

Submittable released direct connectors to accounting packages common among mid-sized nonprofits, addressing the reconciliation gap that leads most receiving organisations to maintain parallel spreadsheets alongside the funder portal throughout the reporting cycle and beyond closeout. Category mapping is configurable to each recipient's own chart of accounts.
Signal: Grantee experience is becoming a genuine retention factor because complaints surface during agency re-procurement reviews later.
JUNE 2025

Foundant Technologies Acquires Regional Grant Administration Specialist

Foundant Technologies completed an acquisition of a regional specialist serving community foundations, consolidating two overlapping installed bases in a segment where long contract terms make organic displacement extremely slow and acquisition the practical route to scale. Both installed bases serve community foundations with overlapping functional requirements.
Signal: Roll-up acquisition is the main consolidation mechanism because long public contract terms block organic displacement entirely.

What Delivery Actually Costs Vendors

Cost of delivery is dominated by people rather than infrastructure. Implementation and configuration staff account for 31% to 38% of cost of goods sold, ongoing customer support a further 18% to 24%, and cloud hosting with the security accreditation that public buyers require another 11% to 15%. Accreditation cost is procured almost entirely from a small number of audit and hosting providers, which concentrates that exposure narrowly.
Public sector cloud accreditation costs rose materially through 2024 and 2025 as authorisation requirements tightened. One publicly traded participant attributed a measurable share of gross margin decline that year to accreditation and hosting cost in its annual report, and several smaller vendors withdrew from public agency segments entirely rather than carry the expense. The barrier now functions as an entry cost rather than a running one.

The competitive disadvantage mechanism is concentrated in implementation. A vendor whose median deployment runs 31 weeks with heavy configuration carries service cost that a vendor with pre-configured programme templates does not, and cannot price against it in competitive bids. Exposure varies by player type. Large vendors amortise accreditation across many accounts. Single-country specialists carry it against a small base and are steadily being priced out.
grant-management-software-market-cost-volatility-analysis-1790004134709

Pre-Configured Templates For Common Funding Programmes

Shipping ready configurations for the funding programmes that recur across agencies removes most bespoke setup work. Vendors that built template libraries report implementation effort falling by roughly a third, which converts directly into gross margin and shortens the period before an account generates a usable reference for the next competitive bid. Reference generation accelerates accordingly.

Certified Implementation Partners In Regional Markets

Delegating configuration to accredited partners in markets too small to justify direct staffing moves service cost off the vendor income statement while preserving quality through certification. The trade is margin on services for reach, and it works best where contract values are modest and deployment volume is high enough to sustain partner economics. Certification protects delivery quality.

Shared Accreditation Across Multiple Product Lines

Public sector hosting authorisation is expensive to obtain and comparatively cheap to extend, so vendors carrying several products through one accreditation boundary spread the cost across a wider revenue base. This favours larger portfolios and is a genuine reason smaller single-product specialists have retreated from public agency work over the past two years. Scale genuinely matters here.

Portfolio Architecture for Margin Defence

Margin in this category follows how directly a module answers an auditor. Application intake and review workflow is close to commodity, since the function is well understood and several adequate alternatives exist at low cost. Compliance reporting, subrecipient monitoring, and audit evidence retention earn considerably more, because the consequence of failure is statutory rather than operational and buyers price accordingly.
The tension between volume and premium plays out through implementation cost rather than through pricing. High-volume, low-value deployments among small nonprofits are only profitable where configuration is templated, and vendors who serve that tier with bespoke setup lose money on every account. Premium agency work carries much higher contract value but also 31 week deployments, which delays margin realisation substantially. Templating decides whether the lower tier is viable.

High-value pools concentrate where an audit regime has genuine consequence and the buyer is large enough to fund a proper system: North American federal pass-through entities, European Union managing authorities, and Gulf sovereign foundations. What these share is that failure costs the organisation money or standing directly. Where consequence is weak, buyers treat the software as optional and pay accordingly. Consequence, not budget size, sets willingness to pay.

Volume / Commodity-Adjacent

Application intake, review workflow, and basic award tracking. Well-understood functionality with numerous low-cost alternatives, sold largely to smaller nonprofits and foundations. The nine-point range reflects wide variation in whether vendors deploy templates or configure each account individually.
Gross Margin: 54% to 63%

Premium / Certified

Compliance reporting, financial reconciliation, and drawdown management for accredited public agency buyers. Security accreditation forms a genuine entry barrier and contract terms run long. The eight-point range separates vendors amortising accreditation broadly from those carrying it against a narrow base.
Gross Margin: 70% to 78%

Sustainability / Regulatory / Next-Generation

Subrecipient monitoring, audit evidence retention, and outcome measurement against funder frameworks. Statutory consequence supports pricing that functional comparison alone would not justify. The eight-point range reflects how few vendors hold credible capability across all three areas simultaneously today.
Gross Margin: 77% to 85%
grant-management-software-market-portfolio-architecture-1790004135219

High-value Sub-segments and Strategic Watch-out

Compliance Reporting And Audit Automation

Highest value and fastest growth at 14.7%, carrying the business case for most purchases in the category. Each statutory reporting change refreshes demand across the installed base. The eight-point range reflects differences in how quickly vendors ship format changes ahead of deadlines. Late shipping loses secure accounts.
Gross Margin: 78% to 86%

Subrecipient Monitoring And Risk Assessment

High value with moderate growth at 11.4%, and commercially valuable beyond its share because it expands locked contracts without competitive re-procurement. Demand tracks monitoring obligation rather than budget cycles, making it unusually predictable across both public agency and foundation buyers. Mid-term additions avoid competitive events entirely.
Gross Margin: 74% to 81%

Award And Disbursement Management

The volume core of the category, present in essentially every deployment and rarely the deciding factor in an evaluation. Growth tracks the market rate closely. Competitive events are infrequent given contract terms, so share here changes slowly and mostly through acquisition rather than displacement. Pricing power is limited.
Gross Margin: 66% to 73%

Small Nonprofit Self-Service Deployment

The strategic watch-out. Newly obligated small organisations need software but cannot fund implementation, and vendors serving them with configured deployments lose money on every account. The thirteen-point range reflects the gap between templated self-service delivery and bespoke setup economics entirely. Serving this tier without templates destroys margin.
Gross Margin: 44% to 57%

Why These Contracts Persist

Revenue behaves like compliance infrastructure, which is to say it is extremely durable and expands slowly. Gross renewal of 93% exceeds almost every comparable public sector category, and the reason is defensive: removing a system that an auditor has seen requires explaining why, and no finance director wants that conversation. Expansion comes through modules added mid-term rather than through seat growth.
Stickiness varies by buyer type more than by size. Public agencies under statutory audit regimes effectively never leave, with measured churn below two percent annually. European managing authorities behave similarly. Private foundations churn more freely, since their obligations are self-imposed and a board can decide the software is not worth its cost. Corporate grant-making programmes are the least stable of all, following changes in corporate priority.

The buyer profile has shifted. Programme officers drove early purchasing and bought on ease of use for applicants. Finance directors and compliance officers now lead most evaluations, and they ask about evidence retention, reporting format currency, and audit trail completeness. Vendors still presenting applicant experience as the primary argument are losing deals they would have won five years ago.
grant-management-software-market-end-use-penetration-index-1790004135773

Where This Market Rewards

These are among the four positions where our research anticipates prominent divergence between winners and laggards over the coming forecast period. Each is grounded in the demand model, the regulatory perimeter, and the announced capacity pipeline.
01 / AUDIT EVIDENCE POSITIONING

Sell defensibility to finance, not convenience to programme staff

About 64% of purchases follow an adverse finding or failed audit, which means the person signing is a finance director managing statutory exposure rather than a programme officer seeking a better workflow. Evaluations are short, defensive, and scored on evidentiary completeness rather than functional breadth or applicant experience. Vendors whose primary argument remains ease of use are losing deals they would comfortably have won five years ago, and the trend is continuing, with finance leadership taking an ever larger role in scoring.
02 / REPORTING STANDARD CURRENCY

Shipping format changes early decides retention outright

Every statutory reporting change is a moment when an agency discovers its configuration cannot produce the required output, and the vendor's response determines whether renewal is a formality or a competition. Shipping 8 to 12 weeks ahead of the deadline converts institutional anxiety into a renewal argument requiring no discount at all. Shipping late loses accounts that were otherwise secure, because a missed deadline is the one failure a finance director cannot absorb, and the whole account can turn on that single failure.
03 / LOCKED CONTRACT EXPANSION

Growth comes from inside accounts, not from displacement

Public procurement terms run five to seven years, so competitive opportunity in any given year covers a small fraction of the installed base and displacement is not a viable primary strategy. Subrecipient monitoring modules can be added mid-term without triggering full re-procurement, and vendors running that motion systematically report account values rising 22% to 31% across a contract term. Cooperative purchasing vehicles are the other route, closing roughly 2.4 times more new deals per year than direct procurement alone achieves.
04 / GRANTEE RECONCILIATION GAP

Parallel spreadsheets are the largest unaddressed opportunity

Receiving organisations keep their own records in 58% of deployments because the funder portal will not reconcile to their chart of accounts, which means the promised administrative relief has simply not been delivered anywhere. Accounting connectors close that gap and lift grantee satisfaction by roughly 19 points in the vendors that have built them. It matters commercially because grantee complaints are exactly what surfaces during an agency re-procurement review, long before any formal competitive evaluation begins in earnest, where they carry disproportionate weight with the buyer.

Engagement Snapshot From the Field

A live engagement with an industry participant carrying material or product regulatory and market exposure ahead of a defining policy shift, showing how our research translates into a defensible multi-year portfolio strategy.
MARKET MINDS ADVISORY · CLIENT ENGAGEMENT SUMMARY
Grant Management Software Producer Strategic Portfolio Review and Transition Roadmap 2026·Investment Scenario on Grant Management Software Exposure Evaluation 2025-26
CLIENT PROFILE
A state workforce development agency disbursing approximately USD 410 million annually (client-reported, unverified by MMA) through 180 subrecipient organisations across training, apprenticeship, and reemployment programmes. Administration ran on an internally built system commissioned in 2009, maintained by two staff members approaching retirement, and the agency had received repeat audit findings on subrecipient monitoring documentation in consecutive years.
STRATEGIC CHALLENGE
The internal system had failed a security review and could not be brought into compliance economically. Replacement required a competitive procurement the agency had not run in sixteen years, against a market of more than thirty vendors nobody internally could differentiate. Two consecutive audit findings meant the timeline was externally imposed rather than negotiable.
MMA APPROACH
MMA mapped the vendor field against the agency's specific statutory reporting obligations, scored twelve candidates on audit evidence capability and reporting format currency rather than on functional checklists, and modelled total cost including implementation across a seven year term. Reference interviews with comparable state agencies tested delivered performance against vendor claims.
KEY FINDINGS
  1. Only five of the thirty-one vendors identified could demonstrate shipping the most recent statutory reporting format change ahead of the compliance deadline.
  2. Implementation effort varied by a factor of nearly three across shortlisted vendors, driven almost entirely by whether programme templates existed for workforce funding.
  3. Subrecipient monitoring capability, the source of both audit findings, was materially weaker than marketing materials suggested in four of the twelve scored candidates.
  4. Cooperative purchasing vehicle availability would compress the procurement timeline by roughly seven months when measured against a full competitive process run internally.
CLIENT PROFILE
A state workforce development agency disbursing approximately USD 410 million annually (client-reported, unverified by MMA) through 180 subrecipient organisations across training, apprenticeship, and reemployment programmes. Administration ran on an internally built system commissioned in 2009, maintained by two staff members approaching retirement, and the agency had received repeat audit findings on subrecipient monitoring documentation in consecutive years.
STRATEGIC CHALLENGE
The internal system had failed a security review and could not be brought into compliance economically. Replacement required a competitive procurement the agency had not run in sixteen years, against a market of more than thirty vendors nobody internally could differentiate. Two consecutive audit findings meant the timeline was externally imposed rather than negotiable.
MMA APPROACH
MMA mapped the vendor field against the agency's specific statutory reporting obligations, scored twelve candidates on audit evidence capability and reporting format currency rather than on functional checklists, and modelled total cost including implementation across a seven year term. Reference interviews with comparable state agencies tested delivered performance against vendor claims.
KEY FINDINGS
  1. Only five of the thirty-one vendors identified could demonstrate shipping the most recent statutory reporting format change ahead of the compliance deadline.
  2. Implementation effort varied by a factor of nearly three across shortlisted vendors, driven almost entirely by whether programme templates existed for workforce funding.
  3. Subrecipient monitoring capability, the source of both audit findings, was materially weaker than marketing materials suggested in four of the twelve scored candidates.
  4. Cooperative purchasing vehicle availability would compress the procurement timeline by roughly seven months when measured against a full competitive process run internally.
RECOMMENDED STRATEGY
Phase 1: Phase one: procure through an existing cooperative vehicle to meet the audit corrective action deadline without a full competitive process. Phase 2: Phase two: deploy subrecipient monitoring first, ahead of award administration, to close the specific audit finding driving the replacement decision. Phase 3: Phase three: migrate historical award records and retire the internal system once two full reporting cycles have completed successfully end to end.
OUTCOME
The agency selected a vendor through a cooperative vehicle and reached first live reporting cycle in 22 weeks against a 31 week category median. The subsequent audit closed both prior findings with no new ones raised. Administrative staff time on subrecipient documentation fell by an estimated 40% (client-reported, unverified by MMA).

Frequently Asked Questions

Foundational context covering the market sizes, CAGR, scope, country, region and competition that inform every finding below. This section is provided to cover basics and most often pre-purchase conversations, answered from the MMA Primary Research Dataset.

What is the current size of the Grant Management Software Market?

The market was worth USD 2.6 billion in 2025 and reaches USD 2.9 billion in 2026. Value is measured on contracted software licence and subscription spend.

How large will the Grant Management Software Market be by 2036?

MMA forecasts USD 7.4 billion by 2036, an increase of USD 4.5 billion across the forecast period. That represents 2.55 times the 2026 base of USD 2.9 billion.

What is the CAGR for the Grant Management Software Market 2026 to 2036?

The base case compound annual growth rate is 9.8%, with a bull case at 11.0% and a bear case at 8.5%. Historical growth from 2020 to 2025 ran at 8.7%.

Which segment is growing fastest?

Compliance reporting and audit automation grows at 14.7%, half again the market rate of 9.8%. It carries the business case for most purchases in the category.

Who are the major companies in the Grant Management Software Market?

Bonterra, Blackbaud, Submittable, Euna Solutions, and Fluxx lead, holding 34% of licence value between them. The remainder of the field is unusually fragmented across regional specialists.

Which country is growing fastest?

India grows at 13.2%, driven by corporate social responsibility spending obligations that require companies to evidence eligible expenditure. Contract values there sit far below the global median.

Report Segmentation Architecture

The full report scope spans multiple orthogonal segmentation dimensions, with cross-tabulated demand data provided for each dimension pair. Coverage extends further to regional breakdowns, trend trajectories, and the competitive detail needed to support segment-level decision-making.

By Software Function

  • Application Intake and Review Workflow
  • Award and Disbursement Management
  • Compliance Reporting and Audit Automation
  • Subrecipient Monitoring and Risk Assessment
  • Financial Reconciliation and Drawdown
  • Outcome Measurement and Reporting

By End-Use Industry

  • Federal and National Government
  • State, Provincial and Local Government
  • Private and Community Foundations
  • Higher Education and Research Institutions
  • International Development and Multilateral Funders
  • Corporate Grant-Making Programmes

By Commercial Dimension

  • Direct Agency Procurement
  • Cooperative Purchasing Vehicle
  • Systems Integrator Delivered
  • Certified Implementation Partner
  • Cloud Marketplace Transacted
  • Self-Service Subscription

By Region

  • North America
  • Western Europe
  • East Asia
  • South Asia and Pacific
  • Latin America
  • Middle East and Africa
  • Eastern Europe

Scope, Methodology, and Coverage

Every figure in this report is reproducible from documented input assumptions. The scope below maps the historical period, the forecast horizon, the segmentation dimensions, and the countries covered, alongside the underlying primary and qualitative methodology.
Historical Period
2020 to 2025
Forecast Period
2026 to 2036
Base Year
2025 (USD billions; MMA Primary Research Dataset, September 2026)
Market Definition
The grant management software market covers systems administering the award lifecycle for grantors and grantees, including application intake and review, award and disbursement management, compliance and audit reporting, subrecipient monitoring and risk assessment, financial reconciliation and drawdown, and outcome measurement. It excludes general accounting and enterprise resource planning platforms, donor fundraising and constituent relationship management software, and procurement systems for purchased goods and services.
Quantitative Units
USD billions, contracted licence and subscription value
Segmentation Dimensions
Software function, end-use industry, commercial dimension, region
Regions Covered
North America, Western Europe, East Asia, South Asia and Pacific, Latin America, Middle East and Africa, Eastern Europe
Countries Covered
United States, Canada, United Kingdom, Germany, France, Netherlands, Sweden, Spain, Italy, Japan, South Korea, China, India, Australia, New Zealand, Singapore, Brazil, Mexico, Colombia, Chile, Saudi Arabia, United Arab Emirates, South Africa, Kenya, Poland, Romania, Hungary
Key Companies Profiled
Bonterra, Blackbaud, Submittable, Euna Solutions, Fluxx, SmartSimple, Foundant Technologies, WizeHive, Streamlyne, eCivis, AmpliFund, Salesforce, Workday, Cayuse, InfoReady, Optimy, Good Grants, Zengine, GrantVantage, Kaleidoscope
Quantitative Methodology
Primary survey, n=3,800 respondents, Q4 2025, six countries; demand-side model with trade association cross-validation
Qualitative Methodology
47 expert interviews, Q4 2025; applied to validate demand model assumptions, identify emerging dynamics, and assess competitive positioning
Report Format
PDF and XLSX data workbook (Word format preview document)
Publisher
Market Minds Advisory
Report Code
MMA-2026-TEC-351
Published
September 2026
Contact
sales@marketmindsadvisory.com | www.marketmindsadvisory.com

Purchase the full Grant Management Software Market Report (2026 to 2036).

The full report sizes the grant management software market across six software functions, seven regions, and twenty-seven countries, with forecasts to 2036 under base, bull, and bear cases. It examines why roughly two thirds of purchases follow an audit finding rather than an efficiency decision, and what that means for how vendors should position, price, and retain. Competitive analysis covers twenty participants evaluated consistently on contracted licence value, with detailed treatment of procurement lock-in, cooperative purchasing vehicles, and roll-up consolidation. Cost structure, margin architecture by function, and regional audit regime drivers are analysed in full. Primary research includes 3,800 survey responses and 47 expert interviews.
Six software functions sized and forecast separately
Twenty participants evaluated on contracted licence value
Regional audit regime drivers across seven geographies
Margin architecture by software function and tier
Procurement lock-in analysis with contract term evidence
Implementation cost benchmarks and delivery model comparison

Built For The People Who Decide

From boardroom strategy to bench-side execution, this report is read cover-to-cover by leaders shaping the next decade of their industry, turning demand scenarios, market dynamics and valuation benchmarks into decisions.
CXOs/ Presidents/ VPs/ Managers
M&A and Corporate Development
Strategy Teams and R&D Heads
Procurement and Product Directors
Regulatory and Compliance Leaders
Investor Relations and Equity Analysts