Market Minds Advisory
Glycol Ethers Market

Glycol Ethers Market: Propylene-Series Substitution and the Low-Toxicity Formulation Shift

Propylene glycol ethers with substantially lower toxicity profiles are displacing legacy ethylene-series solvents across coatings, cleaning, and cosmetics formulations, forcing manufacturers to defend installed ethylene-series production capacity against reformulation pressure from regulatory bodies and downstream brand owners.

Lead Analyst

Bilal Shaikh

Published

September 2026

Make Smarter Decisions with Customized Research Insights

Request a free sample report and evaluate market opportunities, growth trends, and competitive dynamics relevant to your business needs.

2025 MARKET VALUE$7.2BMarket Size 2025
2036 FORECAST VALUE$13.4BBase Case , 2026 to 2036
CAGR 2026 TO 20365.8 %Bull 7.0% / Bear 4.6%
INCREMENTAL OPPORTUNITY$5.8BNet 10- year value creation
EXPANSION MULTIPLE1.76x2036 value over 2026 base
Strategic Levers
M&A Pipeline
Regional Outlook
Country Rankings
Competitive Intelligence
Segmental Deep-dive
Call-Us : 91 93563 13602

Executive Snapshot and Market Trajectory

Propylene glycol ethers with substantially lower toxicity profiles are displacing legacy ethylene-series solvents, and formulators increasingly select suppliers on regulatory compliance depth rather than per-kilogram cost alone this procurement cycle across most coatings and cleaning applications. Bundled regulatory documentation support increasingly factors into that decision too.
Paints and coatings applications drive most volume consumption, but propylene glycol ethers are pulling share fastest as brand owners reformulate away from ethylene-series solvents ahead of tightening regulatory deadlines. East Asia holds the deepest production base on China's dominant coatings manufacturing scale, while North America's reformulation pace is expanding steadily as major coatings brands complete compliance-driven product transitions. Manufacturers with strong East Asian distribution keep capturing disproportionate incremental volume growth.
Five manufacturers hold roughly fifty-eight percent of production capacity, leaving meaningful room for regional and specialty-focused challengers to compete on price and technical service depth. Widening comparative data on toxicity profiles and a growing body of regulatory compliance literature are reshaping which solvent chemistries formulators default to across both coatings and cleaning applications nationwide this decade. Manufacturers watch this shift closely nationwide. Regional producers competing on price add further pressure on established formulary positions.
Market Definition
This market covers glycol ether solvents used as coalescing agents, cleaning solvents, and processing aids in coatings, cleaning products, and industrial formulations, including both ethylene-series and propylene-series products. It excludes glycol ether acetates sold as standalone specialty esters and unrelated polyether polyol chemistries.
Base Year Value
$7.2B in 2025 (MMA Primary Research Dataset, August 2026)
Forecast Period
2026 to 2036, eleven discrete annual values
CAGR
5.8% base case. Bull 7.0%. Bear 4.6%.
Fastest Growth Segment
Propylene Glycol Ethers (P-Series): 8.5% CAGR
Fastest Growth Country
China: 8.0% CAGR
Fastest Growth Region
South Asia and Pacific: 7.8% CAGR
Largest Region
East Asia: 30% of 2025 global value
Market Leaders
Dow, LyondellBasell, Eastman Chemical, Shell, BASF. Source: MMA Analysis based on company annual reports.
Primary Survey
n=3,800 procurement and R&D decision-makers, Q4 2025, six countries
Methodology
Demand-side build-up, cross-validated against public data, 47 expert interviews

Glycol Ethers Market Forecast Scenarios

glycol-ethers-market-trends-size-forecast-scenario-1787310562406
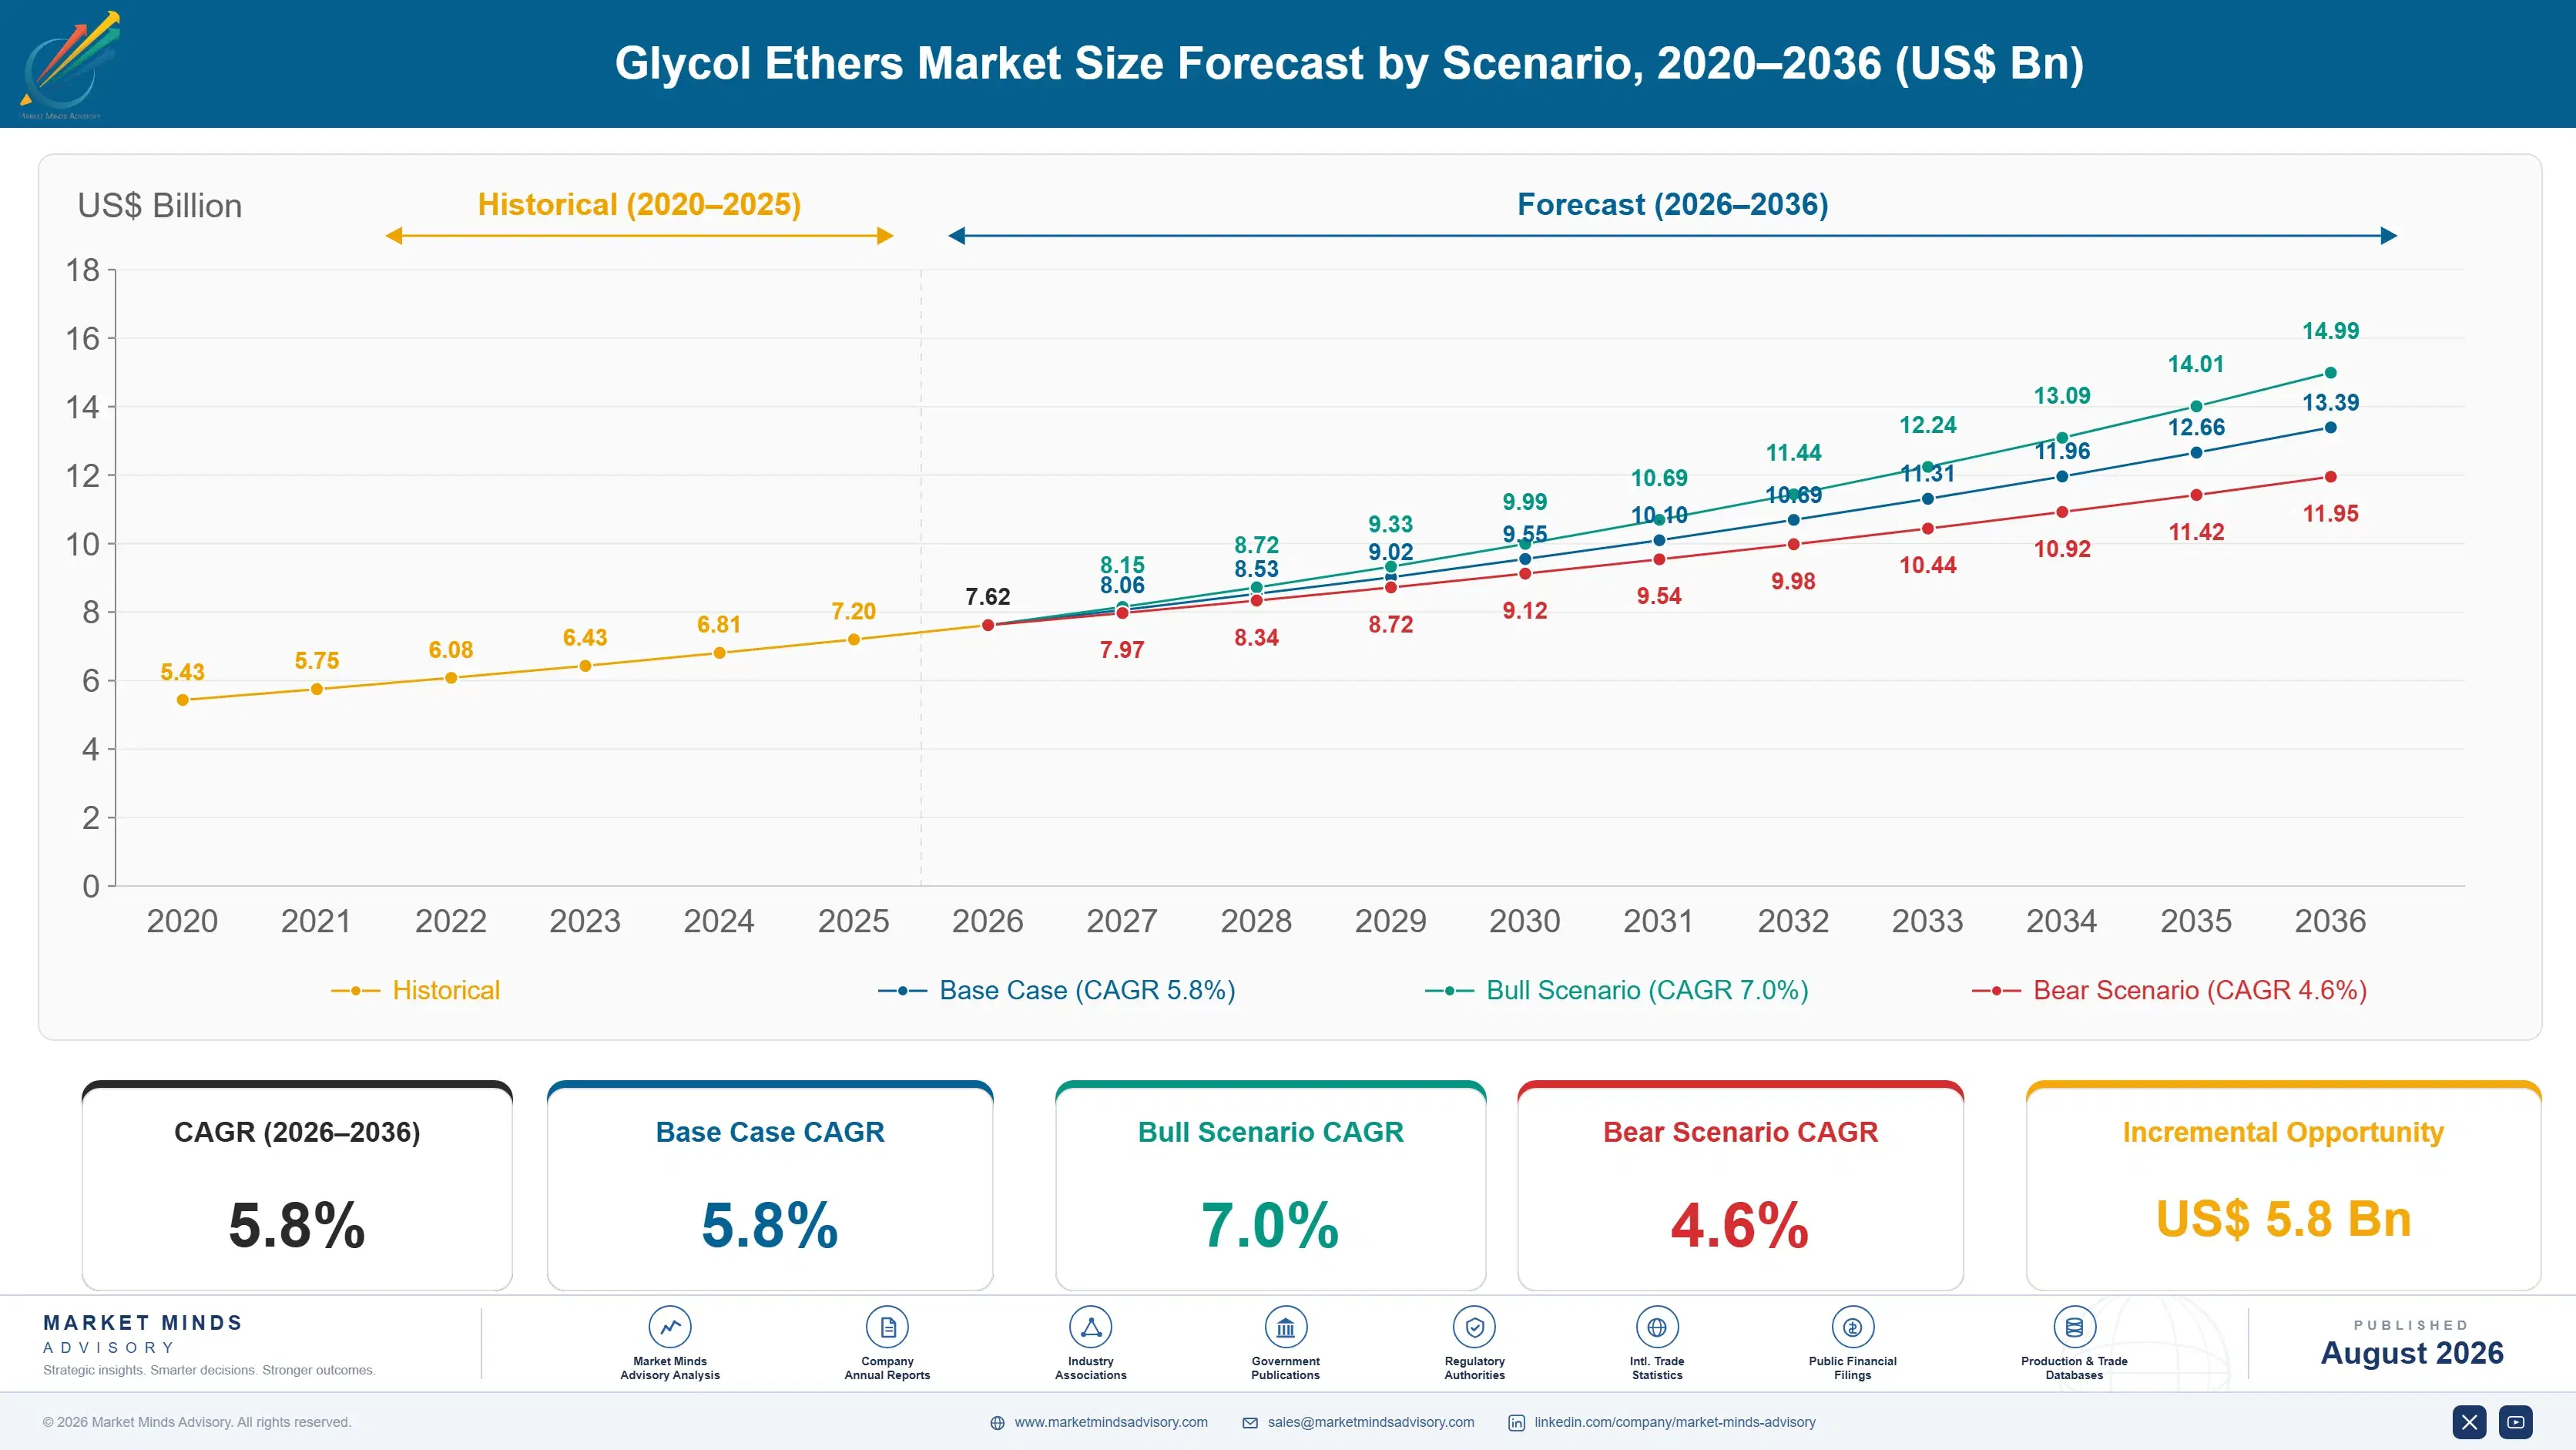
Category volume grew steadily across 2020 to 2025 as coatings and cleaning formulators began transitioning away from ethylene-series solvents ahead of tightening regional regulatory deadlines. Growth decelerated briefly in 2021 amid pandemic-related construction and coatings demand disruption before resuming its prior trajectory through the remainder of the historical period into 2025. Large coatings brands led this early transition before smaller formulators followed.
The base case assumes continued mid-single-digit growth in propylene-series conversion, expanding bio-based glycol ether adoption across premium coatings and cosmetics formulations, and steady replacement demand as formulators complete multi-year reformulation programs across major product lines. Feedstock price volatility, reformulation validation timelines, and regulatory approval cycles remain the binding constraints on faster diffusion across smaller regional formulators. Regional distribution partnerships continue expanding to reach smaller formulators gradually across most markets. Larger producers scale reformulation support faster than smaller regional competitors.
The bull case rests on accelerating regulatory restrictions on ethylene-series solvents pulling forward reformulation demand industry-wide and accelerating premium propylene-series conversion. The bear case centers on feedstock cost volatility compressing formulator margins, which could delay reformulation investment and depress category growth through the middle of the forecast period nationwide. Manufacturers are watching both scenarios closely as feedstock markets evolve.

Regulatory Compliance Depth as the Defining Purchase Criterion

Glycol ethers sit at the intersection of commodity petrochemical production and specialty formulation chemistry, and the category's growth increasingly tracks which producers can supply the toxicity profile and performance characteristics that coatings and cleaning formulators now specify as baseline procurement requirements. Procurement criteria are shifting accordingly at major formulators this budget cycle. Manufacturers who can demonstrate that compliance depth fastest win at the point of fo
MARKET CONCENTRATION (CR5)58%top five holders control most global production capacity
AVERAGE PRICE PER TONNE$1,850typical propylene glycol ether cost per metric tonne
LEADING COUNTRY SHARE24%China dominates global production volume by far
P-SERIES ATTACH RATE42%new coatings formulations now specifying propylene-series solvents
FEEDSTOCK COST SHARE OF COGS54%portion of unit cost tied to propylene oxide feedstock
REFORMULATION-DRIVEN REVENUE SHARE38%portion of category revenue tied to regulatory reformulation
Commercially, the category behaves like a feedstock-linked commodity business layered with growing specialty premiums: bulk ethylene-series volume carries thin margins tied to feedstock pricing, but propylene-series and bio-based products command meaningfully higher per-tonne pricing as regulatory and brand-driven reformulation continues. Reformulation-driven demand increasingly determines blended margin more than production scale alone. Manufacturers with strong specialty product mixes are outperforming pure commodity competitors on blended margin nationwide.
The next decade will be shaped by propylene-series solvents becoming standard rather than premium, expanding bio-based product lines beyond niche premium applications alone, and formulator procurement committees demanding demonstrated toxicity and performance data before approving new supplier qualification. Manufacturers investing early in expanded regulatory documentation stand to capture disproportionate long-term share. Manufacturers who fund comparative toxicity studies stand to capture disproportionate formulator share.
"Ethylene-series glycol ethers built this category, but regulatory pressure is what is rebuilding it. Every reformulation cycle a major coatings brand runs now defaults to propylene-series first, and that default is what is moving volume."
Director, Chemicals and Materials Practice · MMA Chemicals and Materials Practic

Market Trends

Propylene-Series Solvents Displace Ethylene-Series Chemistry

Propylene glycol ethers deliver comparable solvency performance to ethylene-series products while carrying substantially lower reproductive toxicity classifications, letting formulators meet tightening regulatory labeling requirements without sacrificing coating performance. Early comparative data shows meaningfully fewer workplace exposure incident reports when facilities transition from ethylene-series to propylene-series solvent handling protocols. Three of the five leading manufacturers now offer broad propylene-series portfolios as their flagship coatings solvent offering, and two smaller competitors have announced expanded capacity entering production in 2026 targeting additional application segments. Procurement teams increasingly treat propylene-series compatibility as baseline, not an upsell, for new formulation approvals.
Market Impact: Adds 340,000 tonnes annual demand
Bio-Based Formulations Expand Beyond Premium Niche Applications

Bio-based glycol ethers derived from renewable feedstocks are expanding beyond premium cosmetics applications into mainstream coatings and cleaning formulations as brand owners pursue sustainability commitments across their broader product portfolios. Seven major coatings brands have announced bio-based solvent sourcing targets since 2023, meaningfully expanding the addressable demand base for renewable feedstock glycol ethers. Formulator procurement teams have updated sourcing guidance to reference bio-based content explicitly as a preferred specification for an expanding range of premium and mainstream product lines this forecast period. Manufacturers extending validated bio-based product lines fastest are capturing this expanding demand ahead of slower rivals.
Market Impact: Lengthens sales cycles by 2 months

Market Opportunities and Growth Drivers

Tightening Solvent Emission Regulations Drive Reformulation Demand

Tightening volatile organic compound emission regulations across major markets continue driving formulators toward lower-emission glycol ether chemistries, directly expanding demand for propylene-series and bio-based alternatives over legacy ethylene-series products. Several large coatings manufacturers report meaningfully accelerated reformulation timelines over the past five years as regional VOC emission limits have tightened across major production and end-use markets. This regulation-driven demand is pulling incremental volume toward producers with the broadest compliant product portfolios, reinforcing incumbent advantage among manufacturers with the deepest existing regulatory affairs capability. Manufacturers with the deepest regulatory affairs teams are capturing this incremental volume fastest across major markets.
Market Impact: Compresses margins by 6 to 9%

Construction and Industrial Coatings Volume Continues Expanding

Rising global construction activity and industrial coatings demand continue expanding the addressable base for glycol ether solvents, since coatings formulations remain the largest single application segment for the category. Several large coatings producers report meaningfully higher solvent consumption over the past five years as construction activity and industrial maintenance coatings demand have both grown across major regional markets. This volume-driven growth is pulling incremental demand toward producers with the most reliable supply chains, reinforcing incumbent advantage among the largest existing suppliers nationwide. Manufacturers positioned early in this demand growth stand to gain disproportionate long-term share across major regional markets.
Market Impact: Extends qualification cycles by 8 m

Market Restraints and Challenges

Feedstock Price Volatility Compresses Producer Margins

Propylene oxide and ethylene oxide feedstock prices have swung meaningfully over recent years, compressing producer margins during periods of tight petrochemical feedstock supply and volatile crude oil pricing. The root cause is glycol ether producers' structural dependence on feedstock chemistries whose pricing is set by broader petrochemical market dynamics outside producer control. The commercial impact falls hardest on smaller regional producers without long-term feedstock supply contracts, who report meaningfully more volatile margins than the largest integrated manufacturers. Manufacturers are mitigating this through long-term feedstock supply agreements and expanded backward integration into feedstock production where economically viable.
Market Impact: Adds 42% P-series attach rate

Reformulation Validation Timelines Slow Adoption Pace

Formulators must validate new solvent chemistries against performance, stability, and regulatory requirements before switching from established ethylene-series products, creating lengthy qualification timelines that slow reformulation adoption pace. The root cause is the technical complexity of coatings formulation, where solvent substitution can affect drying time, film formation, and long-term stability in ways that require extensive testing before commercial deployment. The commercial impact extends sales cycles for propylene-series and bio-based producers competing against entrenched ethylene-series incumbents with established formulation track records. Manufacturers are mitigating this by funding formulator technical support teams and co-development programs that accelerate validation timelines.
Market Impact: Expands bio-based demand by 22%
3 additional market trends, 4 additional growth drivers, and 2 additional restraints and challenges are covered in the full report. Contact sales@marketmindsadvisory.com to access the complete intelligence.

Segment CAGR and Growth Architecture

The market segments by product chemistry type, the classification formulators actually use when selecting among competing solvent options for coatings and cleaning formulations. Propylene glycol ethers lead all categories on growth as regulatory compliance earns broader formulator preference across most reformulation programs this forecast cycle. Bio-based and green chemistries remain the established choice for premium sustainability-focused applications.
glycol-ethers-market-trends-market-share-analysis-1787310562940

Propylene Glycol Ethers (P-Series)

Propylene glycol ethers deliver comparable solvency performance to ethylene-series products while carrying substantially lower reproductive toxicity classifications, letting formulators meet tightening regulatory labeling requirements without sacrificing coating performance characteristics. Growing at 8.5% annually, roughly 1.5 times the overall market rate, this segment is pulling share from every other chemistry category as comparative data documents fewer workplace exposure incidents with propylene-series solvent handling. Three of the five leading manufacturers now offer broad propylene-series portfolios as their flagship offering, and two smaller competitors have expanded capacity entering production in 2026. Formulator procurement teams increasingly specify propylene-series compatibility as a baseline requirement. Payers and regulatory bodies in select markets are also beginning to recognize this compliance advantage in labeling policy.
CAGR 8.5%

Bio-Based and Green Glycol Ethers

Bio-based and green glycol ethers derived from renewable feedstocks serve formulators pursuing sustainability commitments across premium cosmetics, coatings, and cleaning product lines beyond the mainstream commodity segment. Growing at 7.6% annually, this segment benefits from expanding brand owner sustainability targets and growing consumer preference for renewable-content formulations across multiple end-use categories. Premium coatings and cosmetics formulators remain the primary demand driver, using bio-based chemistries for applications where sustainability positioning provides meaningful brand differentiation value. Manufacturers continue expanding renewable feedstock sourcing and production capacity to broaden adoption beyond premium niche applications alone. This positioning keeps the segment relevant even as propylene-series adoption accelerates industry-wide across mainstream applications and premium product lines nationwide.
CAGR 7.6%
Full segment breakdown across 6 segments available in the complete report.

Regional Architecture and Country Demand Map

East Asia leads on China's dominant coatings and solvent manufacturing scale, followed by North America's steady propylene-series reformulation pace. Western Europe trails on more conservative reformulation timelines relative to underlying demand. South Asia and Pacific posts the fastest regional growth off a smaller established base nationwide.

North America

United States production volume dominates this region on the strength of its dense coatings and cleaning products manufacturing base and consistent reformulation investment among major national brand owners. Canada's smaller, more fragmented production system adds modest volume but moves at a slower reformulation pace than comparable American manufacturers. Rising volatile organic compound emission regulation continues pulling formulation decisions toward propylene-series and bio-based chemistries faster than in any other market. Coatings and cleaning products manufacturer budgets remain comparatively well funded, and propylene-series attach rates on new formulations keep rising steadily across most major producer networks nationwide this forecast period. Propylene-series attach rates continue climbing quarter over quarter nationwide. Regulatory affairs teams continue expanding compliance documentation capability.
Share: 24% | CAGR: 5.5% (2026 to 2036)

Western Europe

Regulatory approval here moves through national and European Union chemical safety frameworks rather than individual manufacturer decisions, which slows adoption of premium propylene-series chemistries relative to the pace of United States reformulation decisions. Germany and France carry the largest procedural volumes, supported by established coatings and cleaning products manufacturing networks within their respective national systems. The United Kingdom's dedicated chemical safety reformulation framework has meaningfully standardized supplier qualification timelines since its introduction across regional manufacturer networks. Growth trails the global average as EU chemical safety bodies increasingly demand comparative-effectiveness data before approving expanded propylene-series specification across product categories. Reimbursement pathways for bio-based product qualification remain inconsistent across member states. Payer scrutiny is expected to intensify further as compliance pressure grows.
Share: 20% | CAGR: 4.3% (2026 to 2036)
Regional intelligence for 5 additional markets available in the complete report: East Asia, South Asia and Pacific, Latin America, Middle East and Africa, Eastern Europe. Contact sales@marketmindsadvisory.com.
glycol-ethers-market-trends-country-cagr-analysis-1787310563450

Where Glycol Ether Producers Can Still Expand Margin

Propylene-series attach rates, regulatory documentation depth, and long-term supply contract structures offer the clearest paths to margin expansion as core commodity pricing faces growing formulator scrutiny across major coatings and cleaning products manufacturers evaluating annual supplier qualification decisions this budget cycle nationwide. particularly among the largest coatings manufacturers standardizing solvent formularies across multiple plants.

Propylene-Series Conversion Growth Program

Propylene-series glycol ethers command a documented price premium of roughly 25 to 35 percent over standard ethylene-series products, reflecting the added production complexity and lower toxicity classification built into each tonne. Manufacturers are using formulator reformulation cycle timing to convert existing coatings accounts rather than compete solely for new customers. This lever depends on continued formulator willingness to fund the premium tier, which comparative toxicity and performance data increasingly supports as regulatory compliance evidence accumulates across larger multi-site studies. Manufacturers publishing detailed comparative toxicity data are winning formulator trust fastest across major markets.
Market Impact: Adds a documented 25-35% price prem

Regulatory Compliance Documentation Bundling

Bundling regulatory compliance documentation, including toxicity data packages and safety data sheet support, into supply contracts is emerging as a way to deepen formulator relationships beyond transactional bulk sales priced around $1,850 per tonne. Formulators using manufacturer-provided compliance documentation report meaningfully faster internal approval timelines than those managing regulatory documentation independently without dedicated support. This lever scales fastest among the largest manufacturers with dedicated regulatory affairs teams, and it is increasingly cited by formulator procurement teams as a deciding factor. Manufacturers view this as a durable, long-horizon account investment. Larger formulators lead early adoption of this bundled compliance service.
Market Impact: Improves formulator approval speed

Long-Term Supply Contract Consistency Programs

Long-term supply contracts guaranteeing feedstock-adjusted pricing consistency across successive delivery cycles represent a growing services opportunity priced with modest premium spreads as formulators seek to hedge against feedstock price volatility beyond single-order purchasing decisions. Manufacturers bundling multi-year consistency guarantees into initial contracts report improved win rates in competitive formulator procurement processes, particularly among cost-conscious mid-sized coatings manufacturers. This lever requires sustained feedstock hedging infrastructure investment but creates a durable differentiation point that smaller manufacturers currently struggle to replicate. This evidence investment increasingly separates winners from laggards industry-wide. Smaller manufacturers struggle to fund comparable hedging infrastructure at this scale.
Market Impact: Extends annual contract value by ro

Formulator Technical Support Certification Programs

Structured formulator technical support and certification programs, often bundled into new supply contracts at no additional charge initially, are increasingly monetized as standalone paid offerings priced near $8,000 per formulation project once manufacturers seek to accelerate reformulation validation timelines. Manufacturers offering certified technical support pathways report stronger supplier loyalty and lower switching rates among trained formulation chemists compared with manufacturers relying solely on informal peer instruction. This lever remains underdeveloped industry-wide, leaving meaningful room to expand. Manufacturers see this as durable investment rather than a one-time sales tactic. Larger manufacturers lead early adoption of this technical support investment.
Market Impact: Generates roughly $8,000 per new fo

Who Controls the Margin Pool

Five manufacturers control roughly fifty-eight percent of production capacity, and the gap between the top three and the remaining two leaders is meaningful: Dow, LyondellBasell, and Eastman Chemical each carry established multi-decade petrochemical production infrastructure that Shell and BASF are still building out region by region across additional specialty product lines. Independent formulators and coatings manufacturers alike weigh this infrastructure gap heavily during supplier selection.
Current competitive activity centers on three fronts: propylene-series capacity expansion backed by growing regulatory compliance data, bio-based product portfolio development aimed at capturing premium sustainability-driven demand, and long-term supply contract structures designed to lock in formulator relationships ahead of major reformulation cycles. Manufacturers with dedicated regulatory affairs teams are winning a disproportionate share of these accounts. Manufacturers with dedicated bio-based product development teams are also winning multi-year supply agreements.

Emerging pressure is coming from Chinese regional manufacturers like Sinopec and Jiangsu Sopo Chemical, which lack broad global commercial infrastructure but are pursuing aggressive price positioning within their home market. Rankings among the top five could shift meaningfully if a regional player's growing domestic capacity base proves durable enough to win share from multinational incumbents ahead of the next forecast cycle.
glycol-ethers-market-trends-company-positioning-matrix-1787310563969

Competitive Moat and Risk Dimensions

DOW INC.

Moat: Broad Petrochemical Portfolio Scale

Dow's decades-long presence across petrochemical production gives it feedstock integration and manufacturing scale that smaller competitors cannot replicate quickly. Its broad chemicals portfolio also lets sales teams bundle glycol ether contracts with other solvent and specialty chemical purchases at the formulator account level. Long-standing distribution relationships also protect against price-based displacement.
DOW INC.

Risk: Slower Bio-Based Product Rollout

Dow's bio-based glycol ether product line reached market later than smaller, more focused competitors, ceding early comparative sustainability data generation to rivals building registries first among premium formulators. Its scale advantage in commercial infrastructure does not automatically translate into technology leadership on the renewable feedstock dimension increasingly driving formulator procurement decisions nationwide.
LYONDELLBASELL INDUSTRIES N.V.

Moat: Deep Coatings Formulator Relationships

LyondellBasell built its reputation specifically within coatings and cleaning products formulator partnerships over decades, giving it deep technical relationships and formulary presence among major brand owners that newer entrants struggle to match. This clinical trust continues generating steady formulary retention even as competitors introduce comparable propylene-series products.
LYONDELLBASELL INDUSTRIES N.V.

Risk: Narrower Specialty Product Breadth

As a commodity-focused producer without the broadest specialty and bio-based product portfolio, LyondellBasell carries less differentiation depth than diversified competitors like Dow across large formulator contracts. Formulators seeking single-vendor procurement simplicity increasingly favor manufacturers offering integrated commodity and specialty portfolios nationwide. Multinational rivals continue widening this differentiation gap across most major formulator markets.

Players Tracked

Prominent Players

Dow Inc.
LyondellBasell Industries N.V.
Eastman Chemical Company
Shell plc
BASF SE

Other Key Players

INEOS Group Holdings S.A.
Sasol Limited
Ashland Inc.
Clariant AG
LOTTE Chemical Corporation
PTT Global Chemical Public Company Limited
China Petroleum & Chemical Corporation
Nippon Nyukazai Co., Ltd.
Kishida Chemical Co., Ltd.
Manali Petrochemicals Limited
Oxiteno S.A.
Indorama Ventures Public Company Limited
Chang Chun Petrochemical Co., Ltd.
Jiangsu Sopo Chemical Co., Ltd.
Sanjiang Fine Chemicals Co., Ltd.

Recent Developments

MARCH 2025

Eastman Chemical Expands Propylene-Series Production Capacity

Eastman Chemical announced an expansion of its propylene-series glycol ether production capacity at an existing facility, adding output to meet growing reformulation-driven demand across coatings and cleaning products customers. The expansion follows several years of allocation-limited access that had periodically constrained customer orders across affected geographies.
Signal: Signals manufacturers are prioritizing pro
AUGUST 2025

BASF Acquires a Regional Bio-Based Solvent Developer

BASF completed the acquisition of a privately held regional bio-based solvent developer to strengthen its renewable feedstock glycol ether portfolio. The deal brings in-house bio-based formulation capability BASF previously accessed through a licensing arrangement with a third-party developer. Academic and industry observers report strong early interest in the combined offering.
Signal: Indicates diversified incumbents are movin
JANUARY 2026

Shell and a Regional Coatings Manufacturer Sign Supply Agreement

Shell signed a multi-year supply agreement with a large regional coatings manufacturer tying a portion of pricing to documented feedstock cost stability across the manufacturer's procurement volume. The agreement is among the largest long-term contracts announced in the category to date. Competitors are watching this contract structure's outcomes closely.
Signal: Suggests long-term supply contracting is m

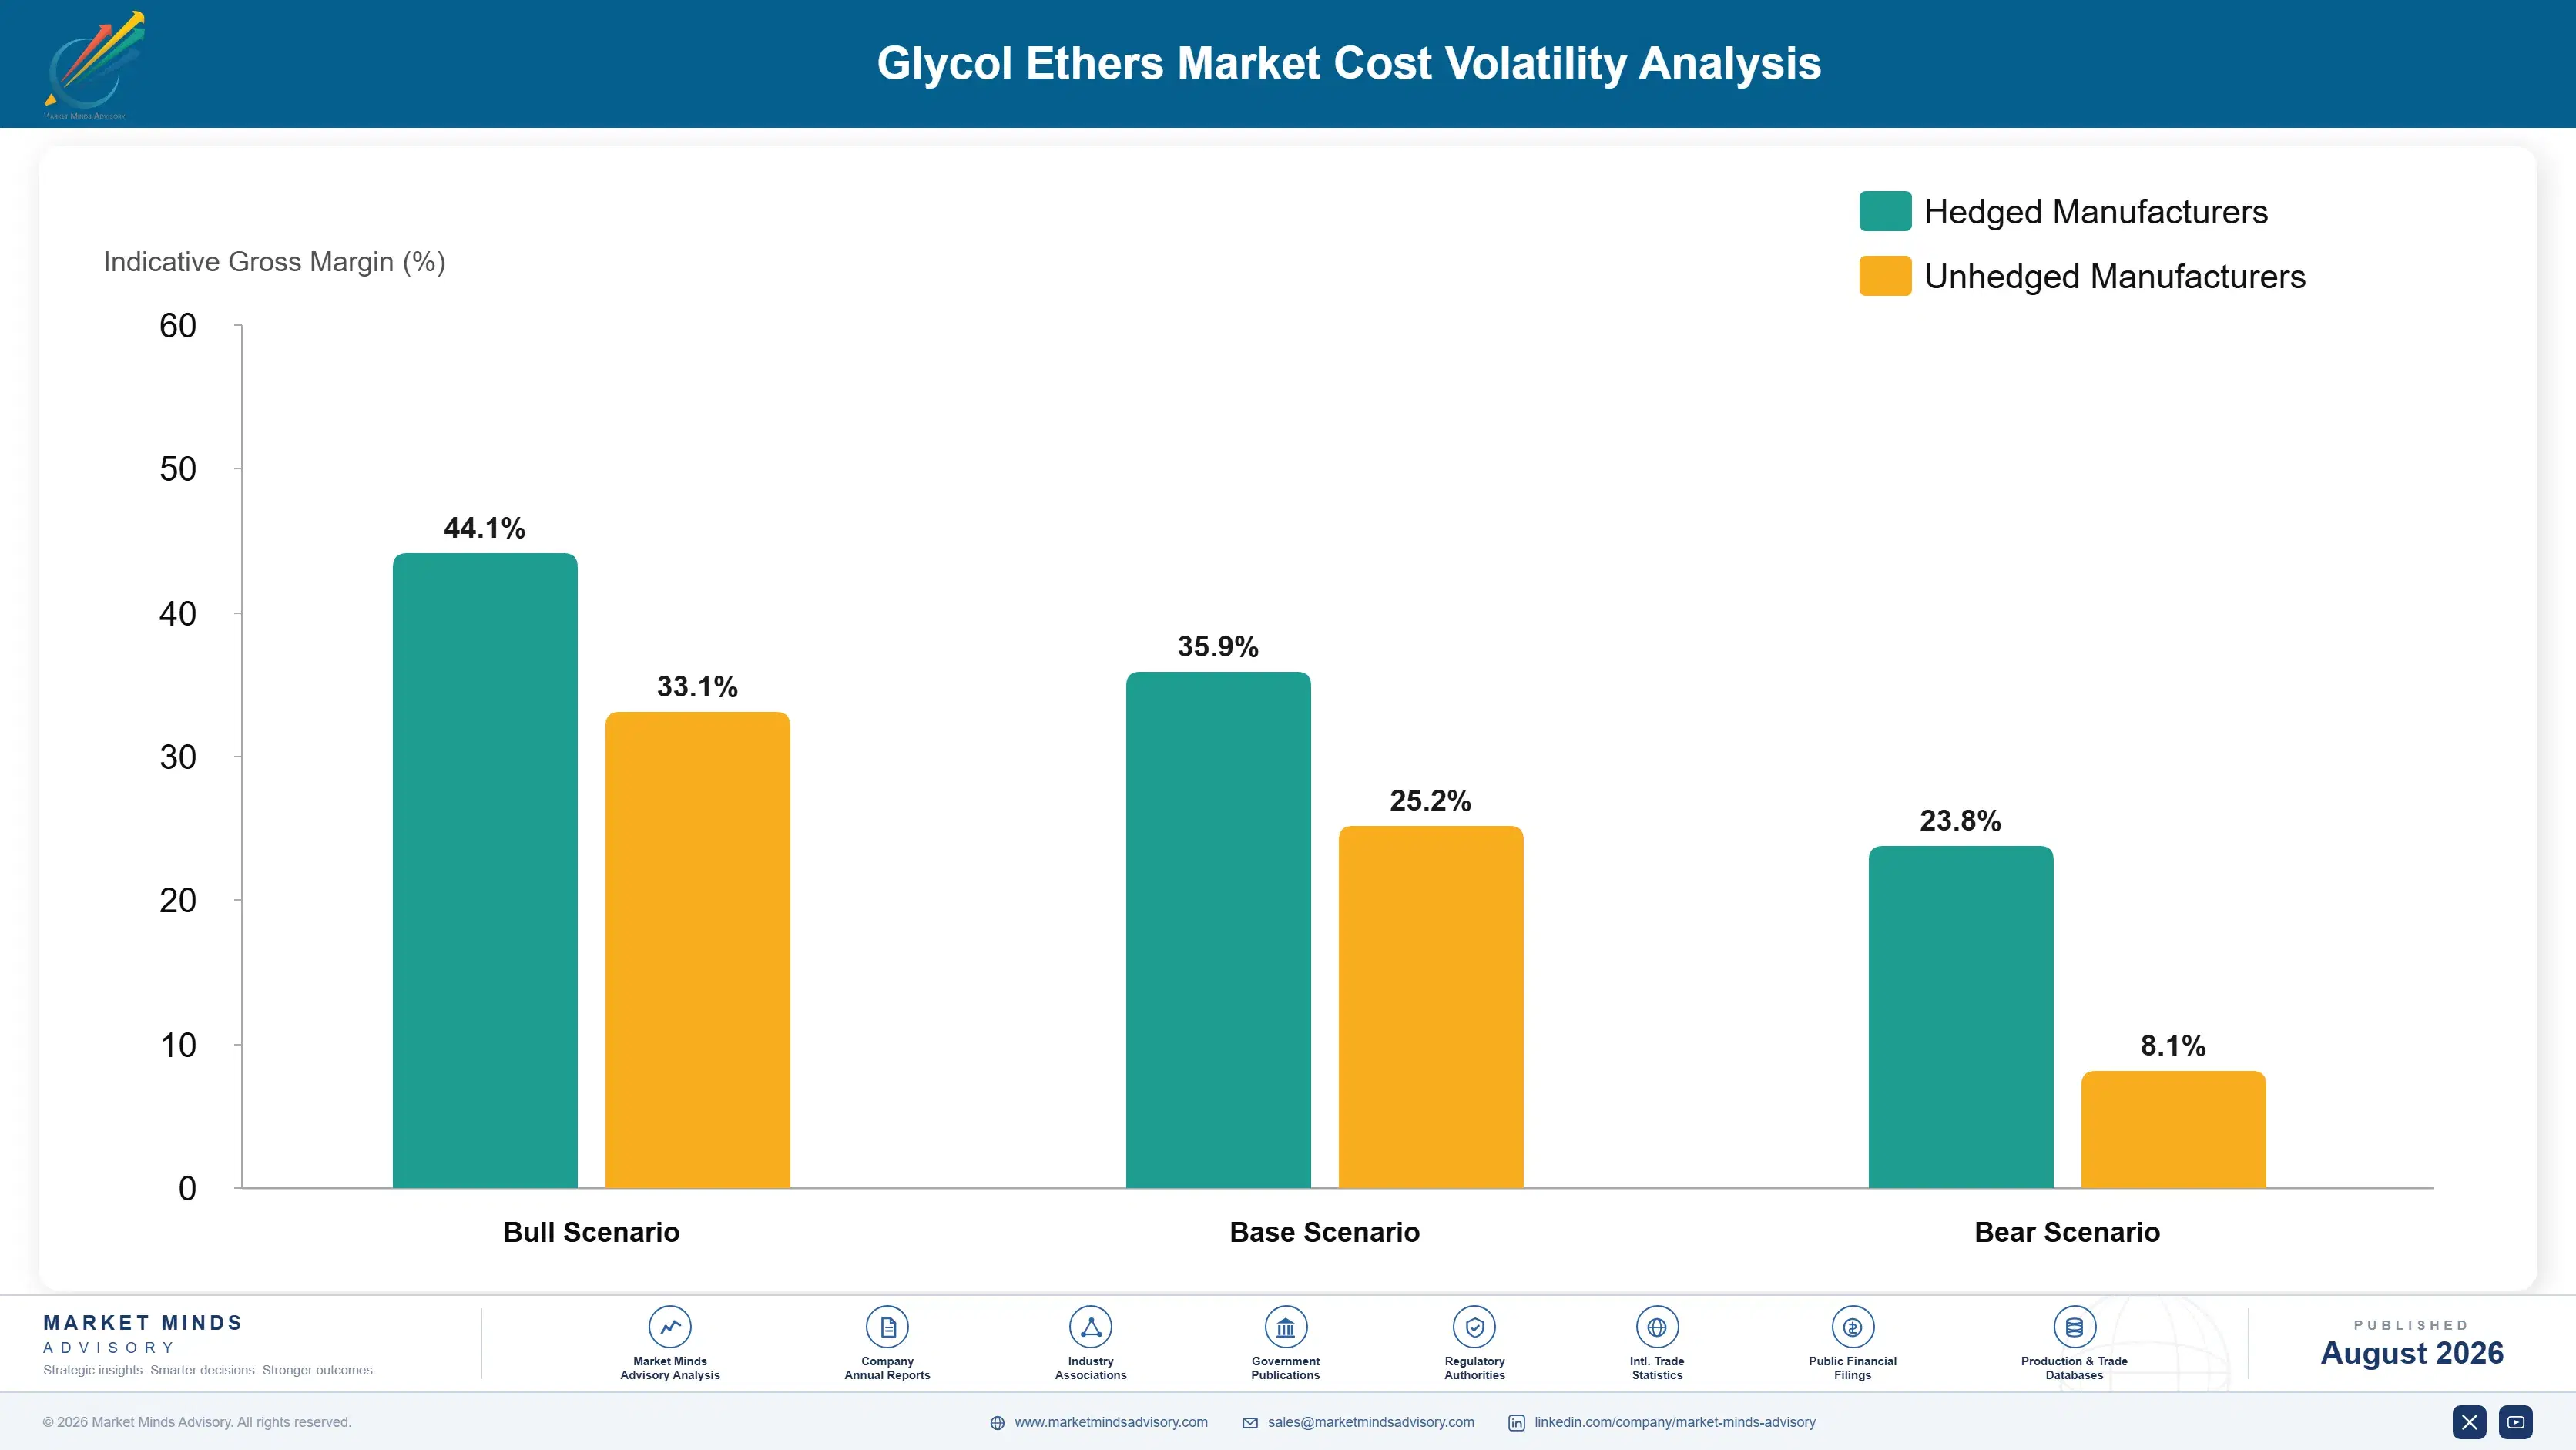
Propylene Oxide and Ethylene Oxide Feedstock Exposure

Glycol ether production depends on propylene oxide and ethylene oxide feedstocks, catalyst systems, and specialized reactor capacity, together representing a substantial share of unit cost of goods sold across the category. Propylene oxide and ethylene oxide feedstocks are sourced predominantly from a small number of qualified petrochemical producers in the United States, Germany, and China.
Propylene oxide feedstock prices rose meaningfully during 2022 and 2023 amid tight petrochemical supply and volatile crude oil pricing that affected upstream propylene availability across major production regions, a dynamic documented in company annual report disclosures across the sector during that period. Several manufacturers responded by securing longer-term feedstock supply contracts and expanding backward integration, though full price normalization took roughly two years to complete across the industry, according to sector-wide supply data.

Smaller manufacturers without long-term feedstock supply agreements or backward integration into propylene oxide production face proportionally higher exposure to input cost inflation during periods of tight petrochemical supply. The largest manufacturers' scale purchasing agreements and vertically integrated feedstock production capacity provide meaningful cost and supply certainty advantages that smaller, regional entrants have not yet been able to replicate at comparable volume and reliability.
glycol-ethers-market-trends-cost-volatility-analysis-1787310564163

Long-Term Feedstock Supply Agreements

Leading manufacturers now maintain multi-year supply agreements with qualified propylene oxide and ethylene oxide feedstock producers, reducing exposure to short-term price volatility across production lines. This contracting strategy adds negotiation complexity upfront but has measurably shortened recovery time during subsequent feedstock disruptions, according to recent company disclosures and supplier audits. Multiple manufacturers have adopted this approach industry-wide in recent years.

Backward Integration Into Feedstock Production

The largest manufacturers have invested in backward integration into propylene oxide and ethylene oxide production capacity, reducing dependence on external feedstock suppliers during periods of tight industry-wide capacity. This integration requires substantial upfront capital investment but provides meaningful cost and supply certainty advantages over the long term. This advantage compounds meaningfully during extended periods of tight capacity.

Increased Safety Stock for Critical Feedstocks

Manufacturers have raised safety stock levels for the highest-risk feedstocks identified during the 2022 to 2023 supply disruption, trading modest inventory carrying cost increases for meaningfully reduced production disruption risk during future supply shocks across the broader glycol ether category. Carrying costs remain modest relative to the disruption risk avoided across most producing regions.

Portfolio Architecture for Margin Defence

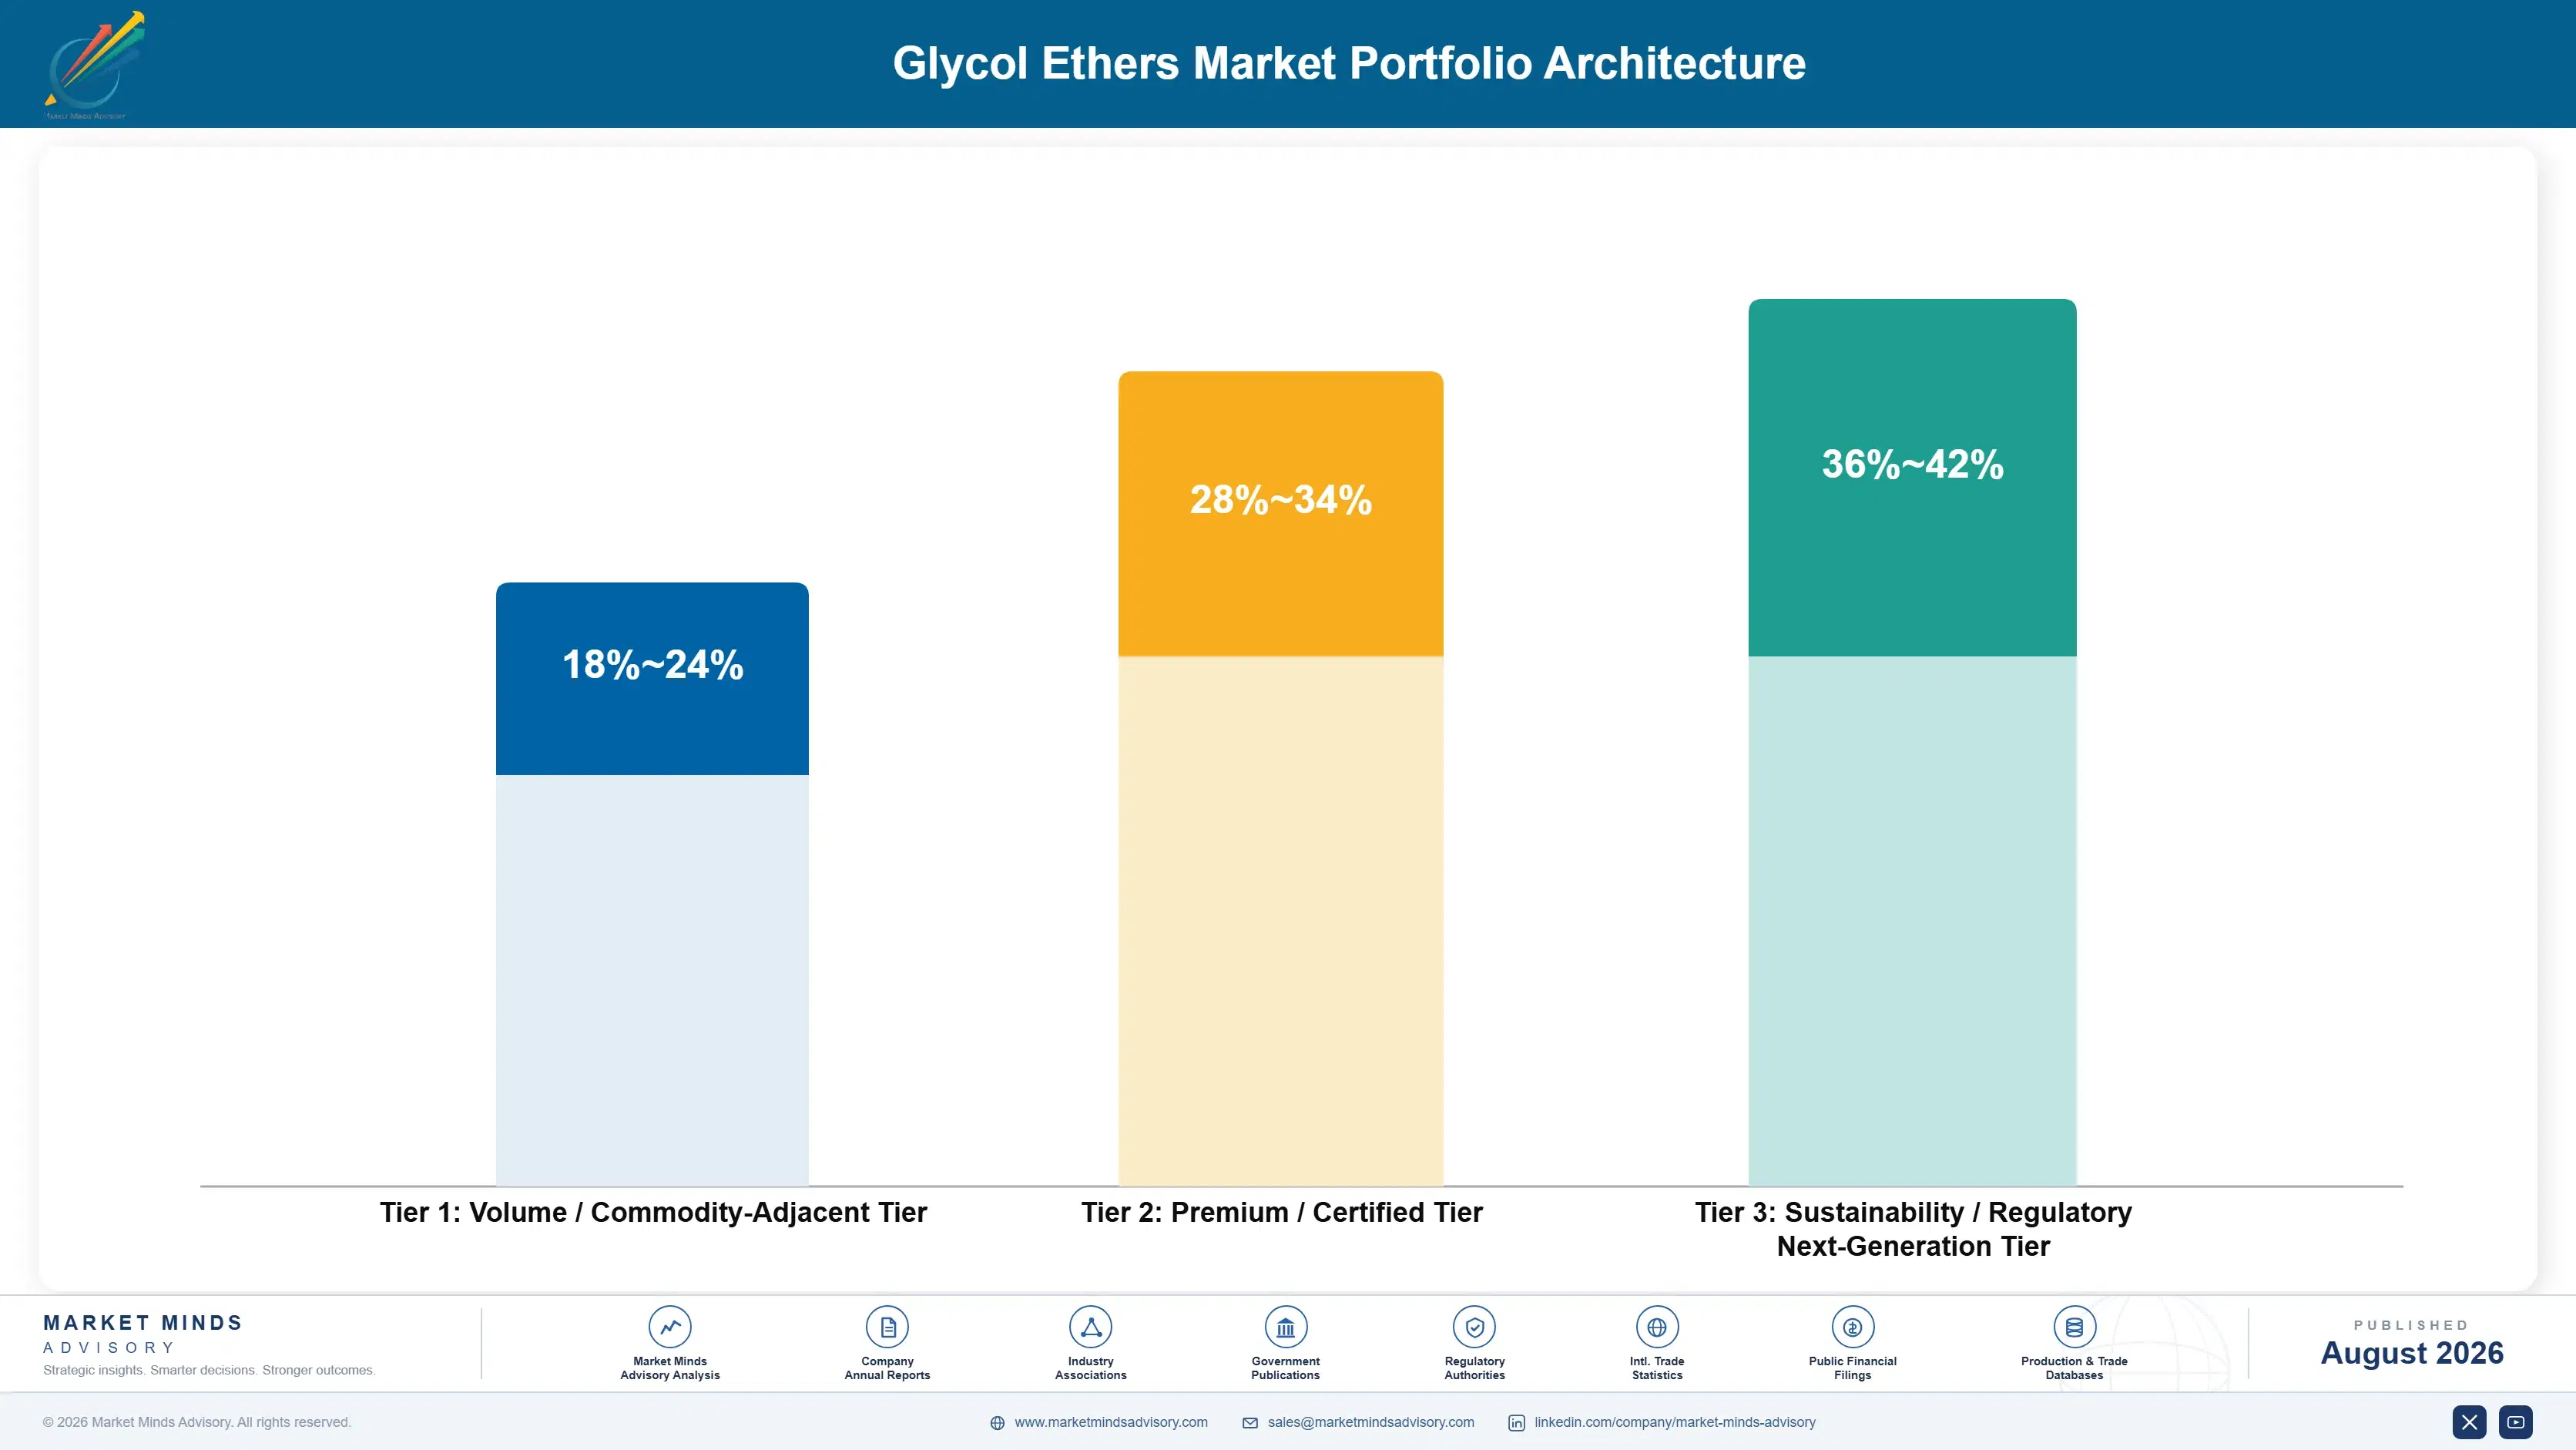
The category's margin architecture separates into three tiers: volume-adjacent ethylene-series and aromatic blend products carrying the thinnest margins around twenty-one percent, propylene-series and specialty blend chemistries carrying stronger margins in the low thirties, and bio-based and green glycol ethers commanding the highest prices and margins as regulatory and sustainability evidence continues to strengthen across the formulator base. This tiering broadly mirrors how procurement commi
Manufacturers face a persistent tension between defending ethylene-series volume, which remains familiar to a large cohort of established formulators, and pushing customers toward premium propylene-series and bio-based chemistries that carry meaningfully better unit economics but require additional reformulation validation investment to sell effectively across busy coatings and cleaning products operations nationwide. Procurement committees increasingly scrutinize this trade-off during annual supplier qualification renewal negotiations.

High-value margin pools concentrate specifically in bio-based and green glycol ethers and their associated technical support and long-term contract revenue, where renewable sourcing and recurring service fees combine to lift blended margins well above the ethylene-series baseline across the broader portfolio and production volume this forecast period. Manufacturers investing early in this convergence stand to capture disproportionate long-term value.

Volume / Commodity-Adjacent Tier

Ethylene-series and aromatic glycol ether blends sold primarily on established clinical track record and price competitiveness against newer propylene-series products. Smaller formulators with constrained budgets remain the primary buyer segment.
Gross Margin: 18-24%

Premium / Certified Tier

Propylene glycol ethers and specialty blend products carrying documented compliance evidence and broader formulator familiarity than bio-based alternatives, positioned as the established middle tier across most coatings manufacturers nationwide. Mid-sized formulators unable to justify premium costs frequently select this tier.
Gross Margin: 28-34%

Sustainability / Regulatory / Next-Generation Tier

Bio-based and green glycol ethers bundled with technical support and long-term contract structures tied to documented sustainability outcomes across large formulator network populations and premium brand owners. Premium coatings and cosmetics brands pursuing sustainability positioning lead adoption in this tier.
Gross Margin: 36-42%
glycol-ethers-market-trends-portfolio-architecture-1787310564666

High-value Sub-segments and Strategic Watch-out

Propylene Glycol Ethers (P-Series)

The fastest-growing, highest-margin segment as formulators increasingly specify propylene-series compatibility as a baseline procurement requirement nationwide. Manufacturers with broad portfolios are converting formulator share ahead of scheduled reformulation cycles, capturing premium pricing across major accounts. Payer coverage recognition continues expanding. across most major producing and consuming regions.
Gross Margin: 32-38%

Bio-Based and Green Glycol Ethers

A large, established, high-margin segment benefiting from expanding brand owner sustainability targets and growing consumer preference for renewable-content formulations across multiple end-use categories and premium product lines. Manufacturers continue expanding renewable feedstock sourcing each product cycle to broaden adoption. Larger brand owners lead early adoption of these renewable formulations.
Gross Margin: 30-36%

Ethylene Glycol Ethers (E-Series)

A steady, mid-margin segment sold primarily on established track record and price competitiveness, facing gradual share erosion as propylene-series and bio-based products earn broader formulator recognition across most major reimbursement geographies this period. Independent formulators remain the primary buyers for now. Manufacturers continue defending price against propylene-series encroachment.
Gross Margin: 18-24%

Aromatic Glycol Ether Blends

A shrinking legacy segment losing share to propylene-series and bio-based alternatives with superior toxicity profiles, though it retains a niche among smaller formulators prioritizing lower upfront cost over compliance depth. Independent formulators with tighter budgets favor this segment still. Manufacturers continue serving this legacy segment steadily overall.
Gross Margin: 16-22%

Formulation Cycle and Reformulation Economics

Revenue in this category behaves like a recurring consumable business tied directly to production volume and formulation cycle length rather than a capital equipment purchase: each production run requires fresh solvent consumption, and propylene-series and bio-based protocols carry meaningfully better unit economics as formulators standardize purchasing across multi-site production networks. This recurring structure gives manufacturers meaningful revenue visibility tied closely to coatings and c
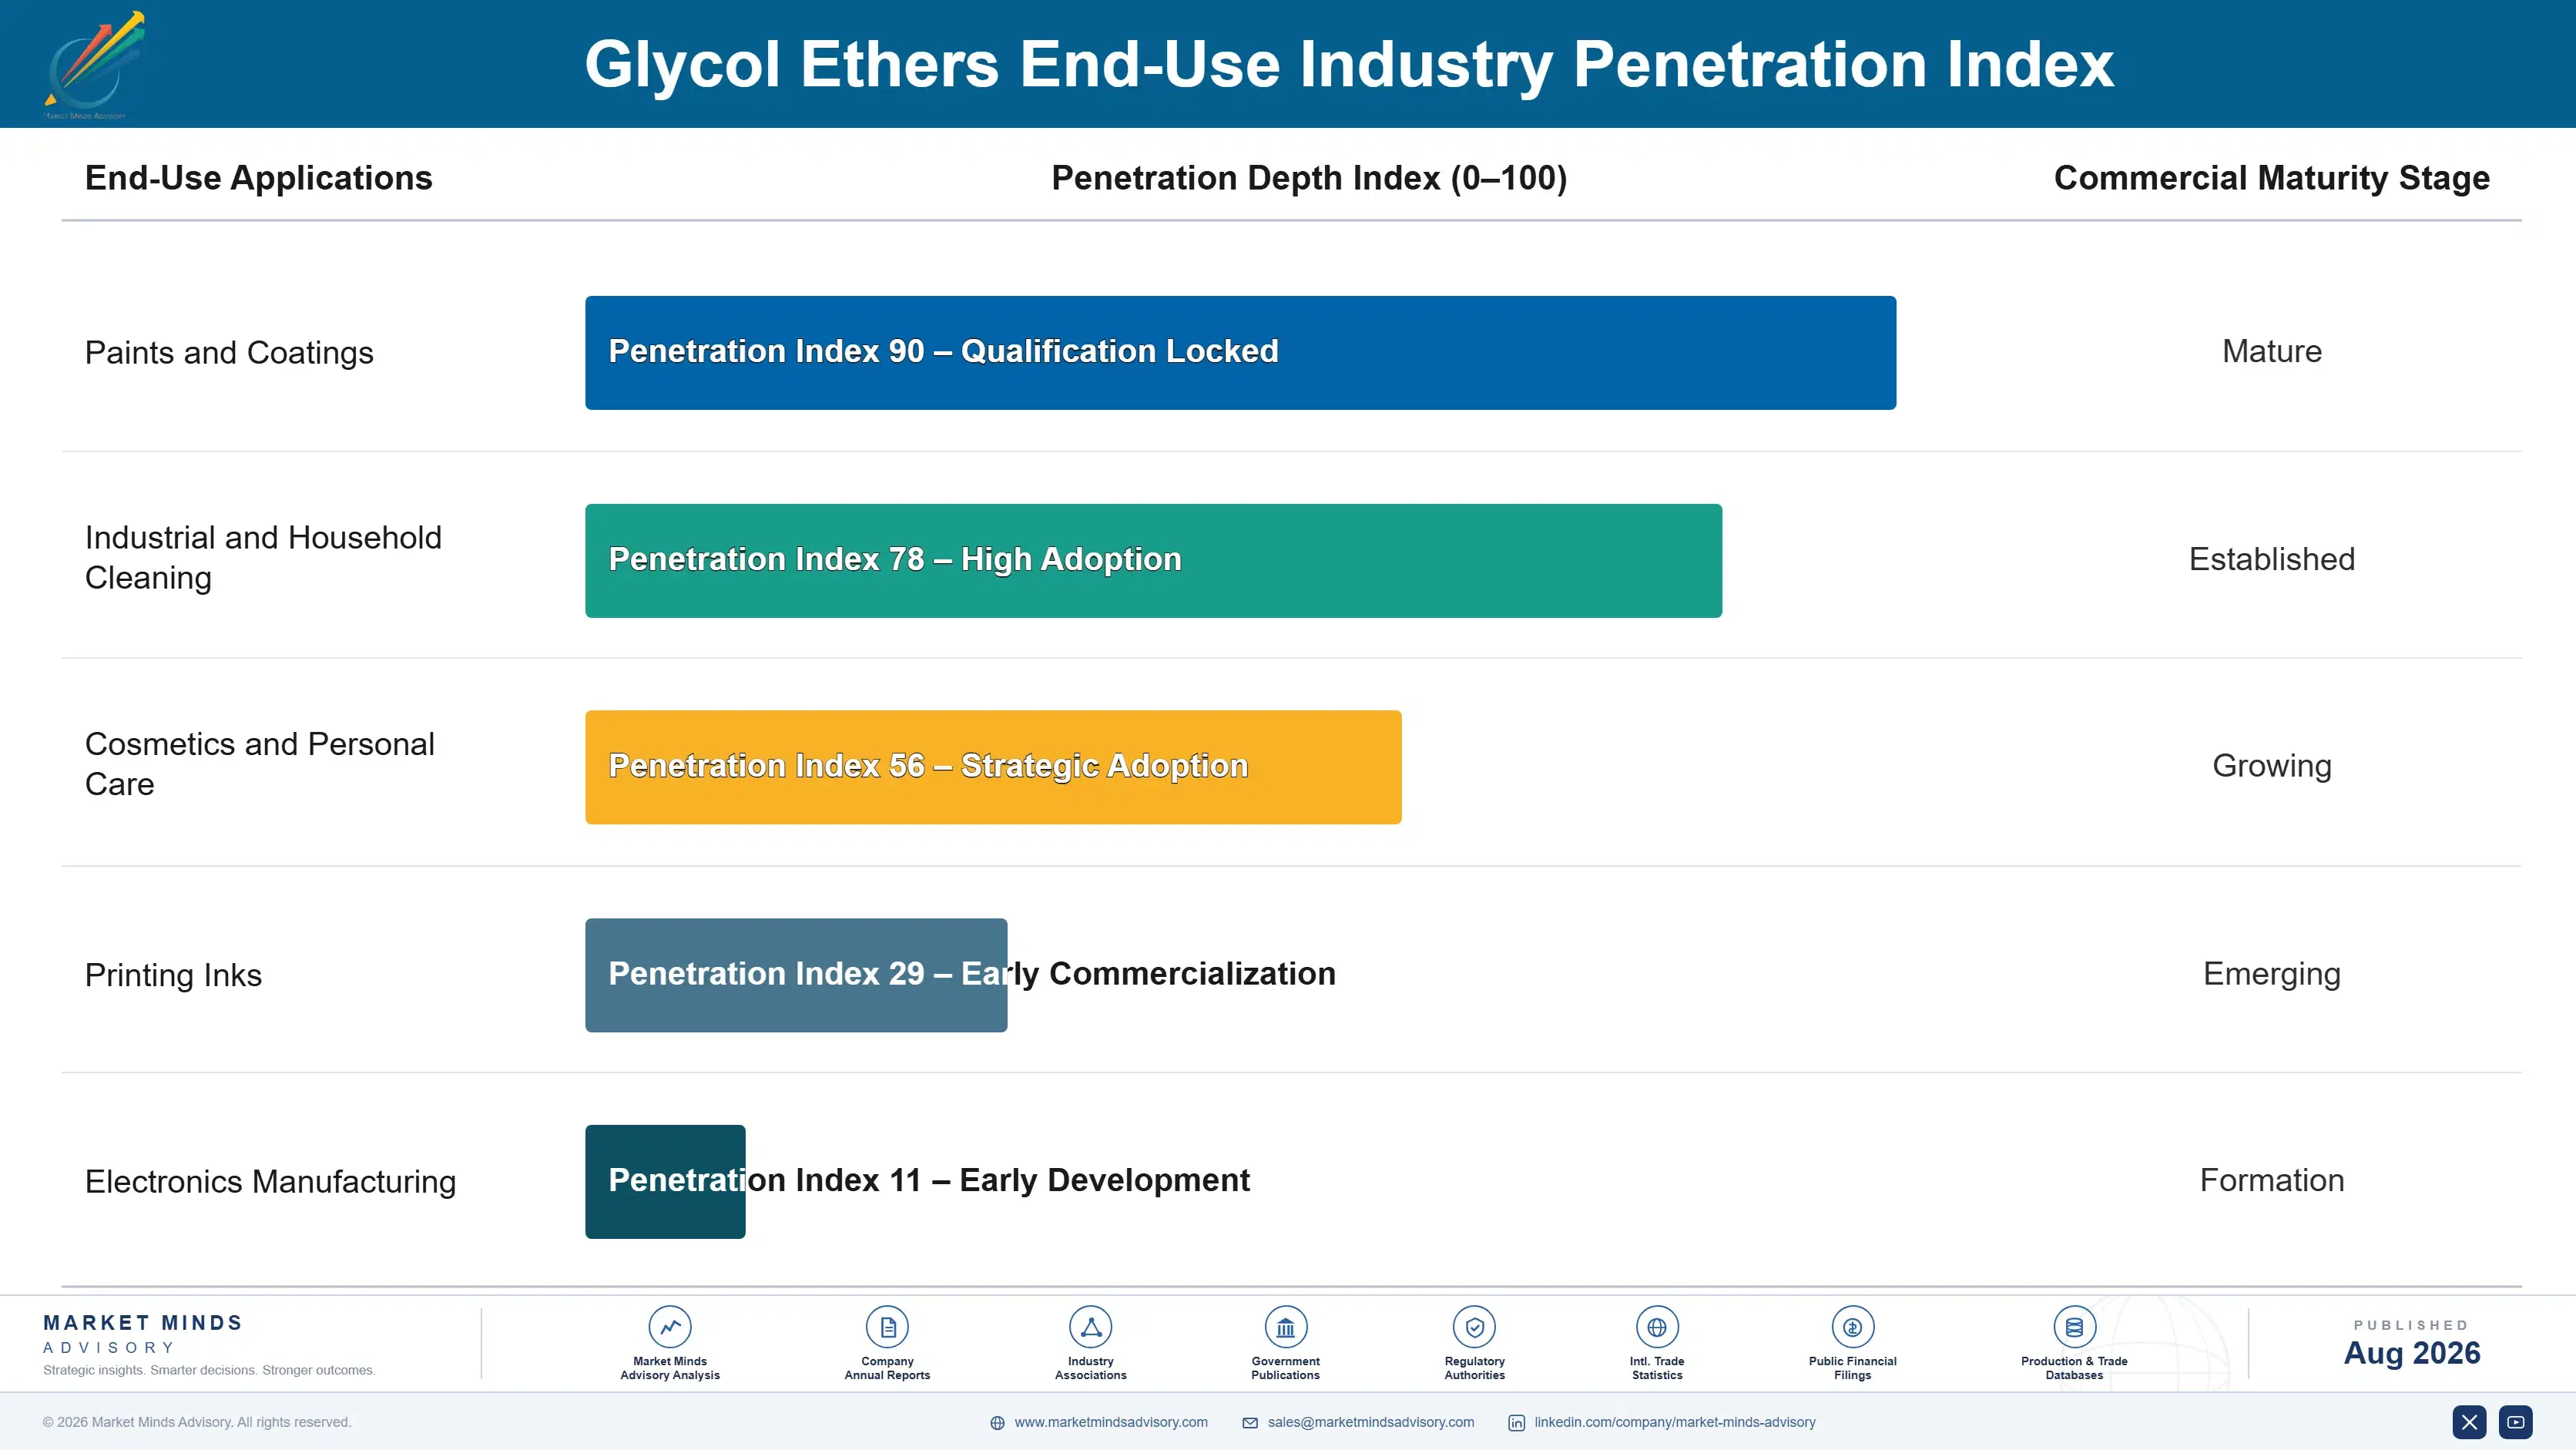
Adoption depth varies meaningfully by end-use vertical. Premium coatings and cosmetics formulators show the deepest, most consistent propylene-series and bio-based adoption, while industrial and commodity cleaning products manufacturers adopt more selectively, reserving premium chemistries for higher-value product lines after exhausting cheaper ethylene-series options already familiar to their production staff. Contract manufacturers represent a smaller but growing adoption segment as private-label formulation demand continues expanding across multiple end-use categories.

A generational shift in buyer profile is underway as younger formulation chemists trained during the regulatory-compliance era default to evidence-based chemistry selection, while an older cohort trained on legacy ethylene-series approaches shows more brand loyalty rooted in decades of prior clinical familiarity and established supplier relationships. Manufacturers increasingly tailor sales approaches differently across these two distinct formulator cohorts to maximize conversion.
glycol-ethers-market-trends-end-use-penetration-index-1787310565151

What Glycol Ether Makers Should Do

These are among the four positions where our research anticipates prominent divergence between winners and laggards over the coming forecast period. Each is grounded in the demand model, the regulatory perimeter, and the announced capacity pipeline.
01 / PROPYLENE-SERIES PORTFOLIO INVESTMENT

Propylene-series is becoming table stakes, not a differentiator, within five years.

Three of the five leading manufacturers already offer broad propylene-series portfolios as their flagship coatings solvent offering, and two smaller competitors have expanded capacity entering production in 2026 across additional application segments. Manufacturers still selling primarily ethylene-series products by 2030 will find themselves competing only on price against platforms with stronger toxicity and compliance evidence backed by multi-site field studies. The investment case for propylene-series chemistry has moved from optional differentiation to a defensive necessity for defending formulator contract position nationwide.
02 / COMPLIANCE DOCUMENTATION STRATEGY

Bundling regulatory documentation deepens formulator account relationships.

Formulators using manufacturer-provided compliance documentation report meaningfully faster internal approval timelines than those managing regulatory documentation independently without dedicated support from a supplier across comparable geographies and product categories. Manufacturers building dedicated regulatory affairs teams now will lock in formulator loyalty before larger, well-resourced competitors catch up on documentation depth across comparable account relationships and supply chains. This service investment increasingly separates preferred suppliers from commodity vendors as procurement consolidates further nationwide across most major markets and formulator networks alike.
03 / LONG-TERM CONTRACT STRATEGY

Early consistency agreements set precedent for pricing feedstock risk.

Shell's January 2026 supply agreement with a regional coatings manufacturer ties pricing explicitly to documented feedstock cost stability, a structure other manufacturers and formulator networks are watching closely this budget cycle across the industry. Manufacturers with strong feedstock hedging capability have the most to gain from moving early into similar contracts ahead of competitors. Those without comparable capability risk being locked out of preferred formulator status as these agreements proliferate nationwide over the next several years across most major reimbursement geographies.
04 / FEEDSTOCK SUPPLY RESILIENCE

Backward integration into feedstock is now a competitive requirement.

The 2022 to 2023 propylene oxide price increase showed clearly that non-integrated manufacturers faced tighter margin pressure than backward-integrated competitors, directly affecting their ability to hold pricing steady during a period of strong underlying demand growth nationwide across most geographies. Smaller manufacturers without the capital scale to pursue backward integration remain more exposed to future feedstock volatility. This resilience gap increasingly factors into formulator procurement decisions alongside clinical evidence and pricing considerations across most major producing regions and formulator networks.

Engagement Snapshot From the Field

A live engagement with an industry participant carrying material or product regulatory and market exposure ahead of a defining policy shift, showing how our research translates into a defensible multi-year portfolio strategy.
MARKET MINDS ADVISORY · CLIENT ENGAGEMENT SUMMARY
Glycol Ethers Producer Strategic Portfolio Review and Transition Roadmap 2026·Investment Scenario on Glycol Ethers Exposure Evaluation 2025-26
CLIENT PROFILE
The client is a regional coatings manufacturer operating three production facilities across a multi-state footprint, formulating several hundred product lines annually across architectural, industrial, and specialty protective coatings. The manufacturer's procurement committee had flagged rising solvent spend and regulatory compliance burden as a category requiring closer review ahead of its next annual sourcing cycle, prompting the engagement.
STRATEGIC CHALLENGE
The manufacturer needed to standardize its solvent formulary, which had grown to include products from three separate suppliers across different production facilities, without disrupting existing product formulations or regulatory approvals already in place. Leadership also wanted a defensible framework for evaluating propylene-series and bio-based chemistries against the ethylene-series products still used across most facilities.
MMA APPROACH
MMA conducted structured interviews with the manufacturer's formulation chemists and procurement committee members, benchmarked solvent pricing and toxicity compliance data against comparable regional coatings manufacturers, and modeled the total cost of reformulation across a two-year transition scenario. The analysis incorporated both published comparative-effectiveness literature and facility-specific production outcomes data. Findings were validated against multiple comparable facility benchmarks.
KEY FINDINGS
  1. Regulatory compliance costs under the fragmented ethylene-series supply base exceeded the incremental cost of standardized propylene-series products across the manufacturer's own facility-level data (client-reported, unverified by MMA).
  2. Consolidating from three suppliers to two preferred vendors was projected to reduce annual solvent spend meaningfully while preserving formulation flexibility across most product lines (client-reported, unverified by MMA).
  3. Standardized propylene-series adoption correlated with measurably fewer regulatory compliance flags per production cycle compared with the prior fragmented ethylene-series approach used across facilities.
  4. Formulation chemists trained through manufacturer-sponsored programs showed measurably higher confidence transitioning production lines independently than staff relying on informal peer instruction alone.
CLIENT PROFILE
The client is a regional coatings manufacturer operating three production facilities across a multi-state footprint, formulating several hundred product lines annually across architectural, industrial, and specialty protective coatings. The manufacturer's procurement committee had flagged rising solvent spend and regulatory compliance burden as a category requiring closer review ahead of its next annual sourcing cycle, prompting the engagement.
STRATEGIC CHALLENGE
The manufacturer needed to standardize its solvent formulary, which had grown to include products from three separate suppliers across different production facilities, without disrupting existing product formulations or regulatory approvals already in place. Leadership also wanted a defensible framework for evaluating propylene-series and bio-based chemistries against the ethylene-series products still used across most facilities.
MMA APPROACH
MMA conducted structured interviews with the manufacturer's formulation chemists and procurement committee members, benchmarked solvent pricing and toxicity compliance data against comparable regional coatings manufacturers, and modeled the total cost of reformulation across a two-year transition scenario. The analysis incorporated both published comparative-effectiveness literature and facility-specific production outcomes data. Findings were validated against multiple comparable facility benchmarks.
KEY FINDINGS
  1. Regulatory compliance costs under the fragmented ethylene-series supply base exceeded the incremental cost of standardized propylene-series products across the manufacturer's own facility-level data (client-reported, unverified by MMA).
  2. Consolidating from three suppliers to two preferred vendors was projected to reduce annual solvent spend meaningfully while preserving formulation flexibility across most product lines (client-reported, unverified by MMA).
  3. Standardized propylene-series adoption correlated with measurably fewer regulatory compliance flags per production cycle compared with the prior fragmented ethylene-series approach used across facilities.
  4. Formulation chemists trained through manufacturer-sponsored programs showed measurably higher confidence transitioning production lines independently than staff relying on informal peer instruction alone.
RECOMMENDED STRATEGY
Phase 1: Phase 1 (Months 1-3): Complete a facility-wide solvent utilization and compliance audit across all three existing vendor relationships to establish a baseline. Phase 2: Phase 2 (Months 4-6): Negotiate consolidated preferred-supplier agreements with two manufacturers, incorporating standardized propylene-series products into all facility-level production formulations. Phase 3: Phase 3 (Months 7-12): Implement manufacturer-sponsored technical support across all remaining facilities to standardize reformulation validation and ongoing documentation practices.
OUTCOME
The manufacturer adopted a two-vendor preferred formulary within seven months of the engagement's conclusion, incorporating standardized propylene-series products across all facilities. Leadership reported improved compliance predictability and stronger negotiating position heading into the following procurement cycle, along with measurably fewer regulatory compliance flags (client-reported, unverified by MMA).

Frequently Asked Questions

Foundational context covering the market sizes, CAGR, scope, country, region and competition that inform every finding below. This section is provided to cover basics and most often pre-purchase conversations, answered from the MMA Primary Research Dataset.

What is the current size of the Glycol Ethers Market?

placeholder

How large will the Glycol Ethers Market be by 2036?

placeholder

What is the CAGR for the Glycol Ethers Market 2026 to 2036?

placeholder

Which segment is growing fastest?

placeholder

Who are the major companies in the Glycol Ethers Market?

placeholder

Which country is growing fastest?

placeholder

Report Segmentation Architecture

The full report scope spans multiple orthogonal segmentation dimensions, with cross-tabulated demand data provided for each dimension pair. Coverage extends further to regional breakdowns, trend trajectories, and the competitive detail needed to support segment-level decision-making.

By Product Type

  • Propylene Glycol Ethers (P-Series)
  • Ethylene Glycol Ethers (E-Series)
  • Bio-Based and Green Glycol Ethers
  • Aromatic Glycol Ether Blends
  • Butyl Glycol Ethers
  • Specialty Glycol Ether Blends

By End-Use Industry

  • Paints and Coatings
  • Industrial and Household Cleaning
  • Cosmetics and Personal Care
  • Printing Inks
  • Electronics Manufacturing

By Commercial Dimension

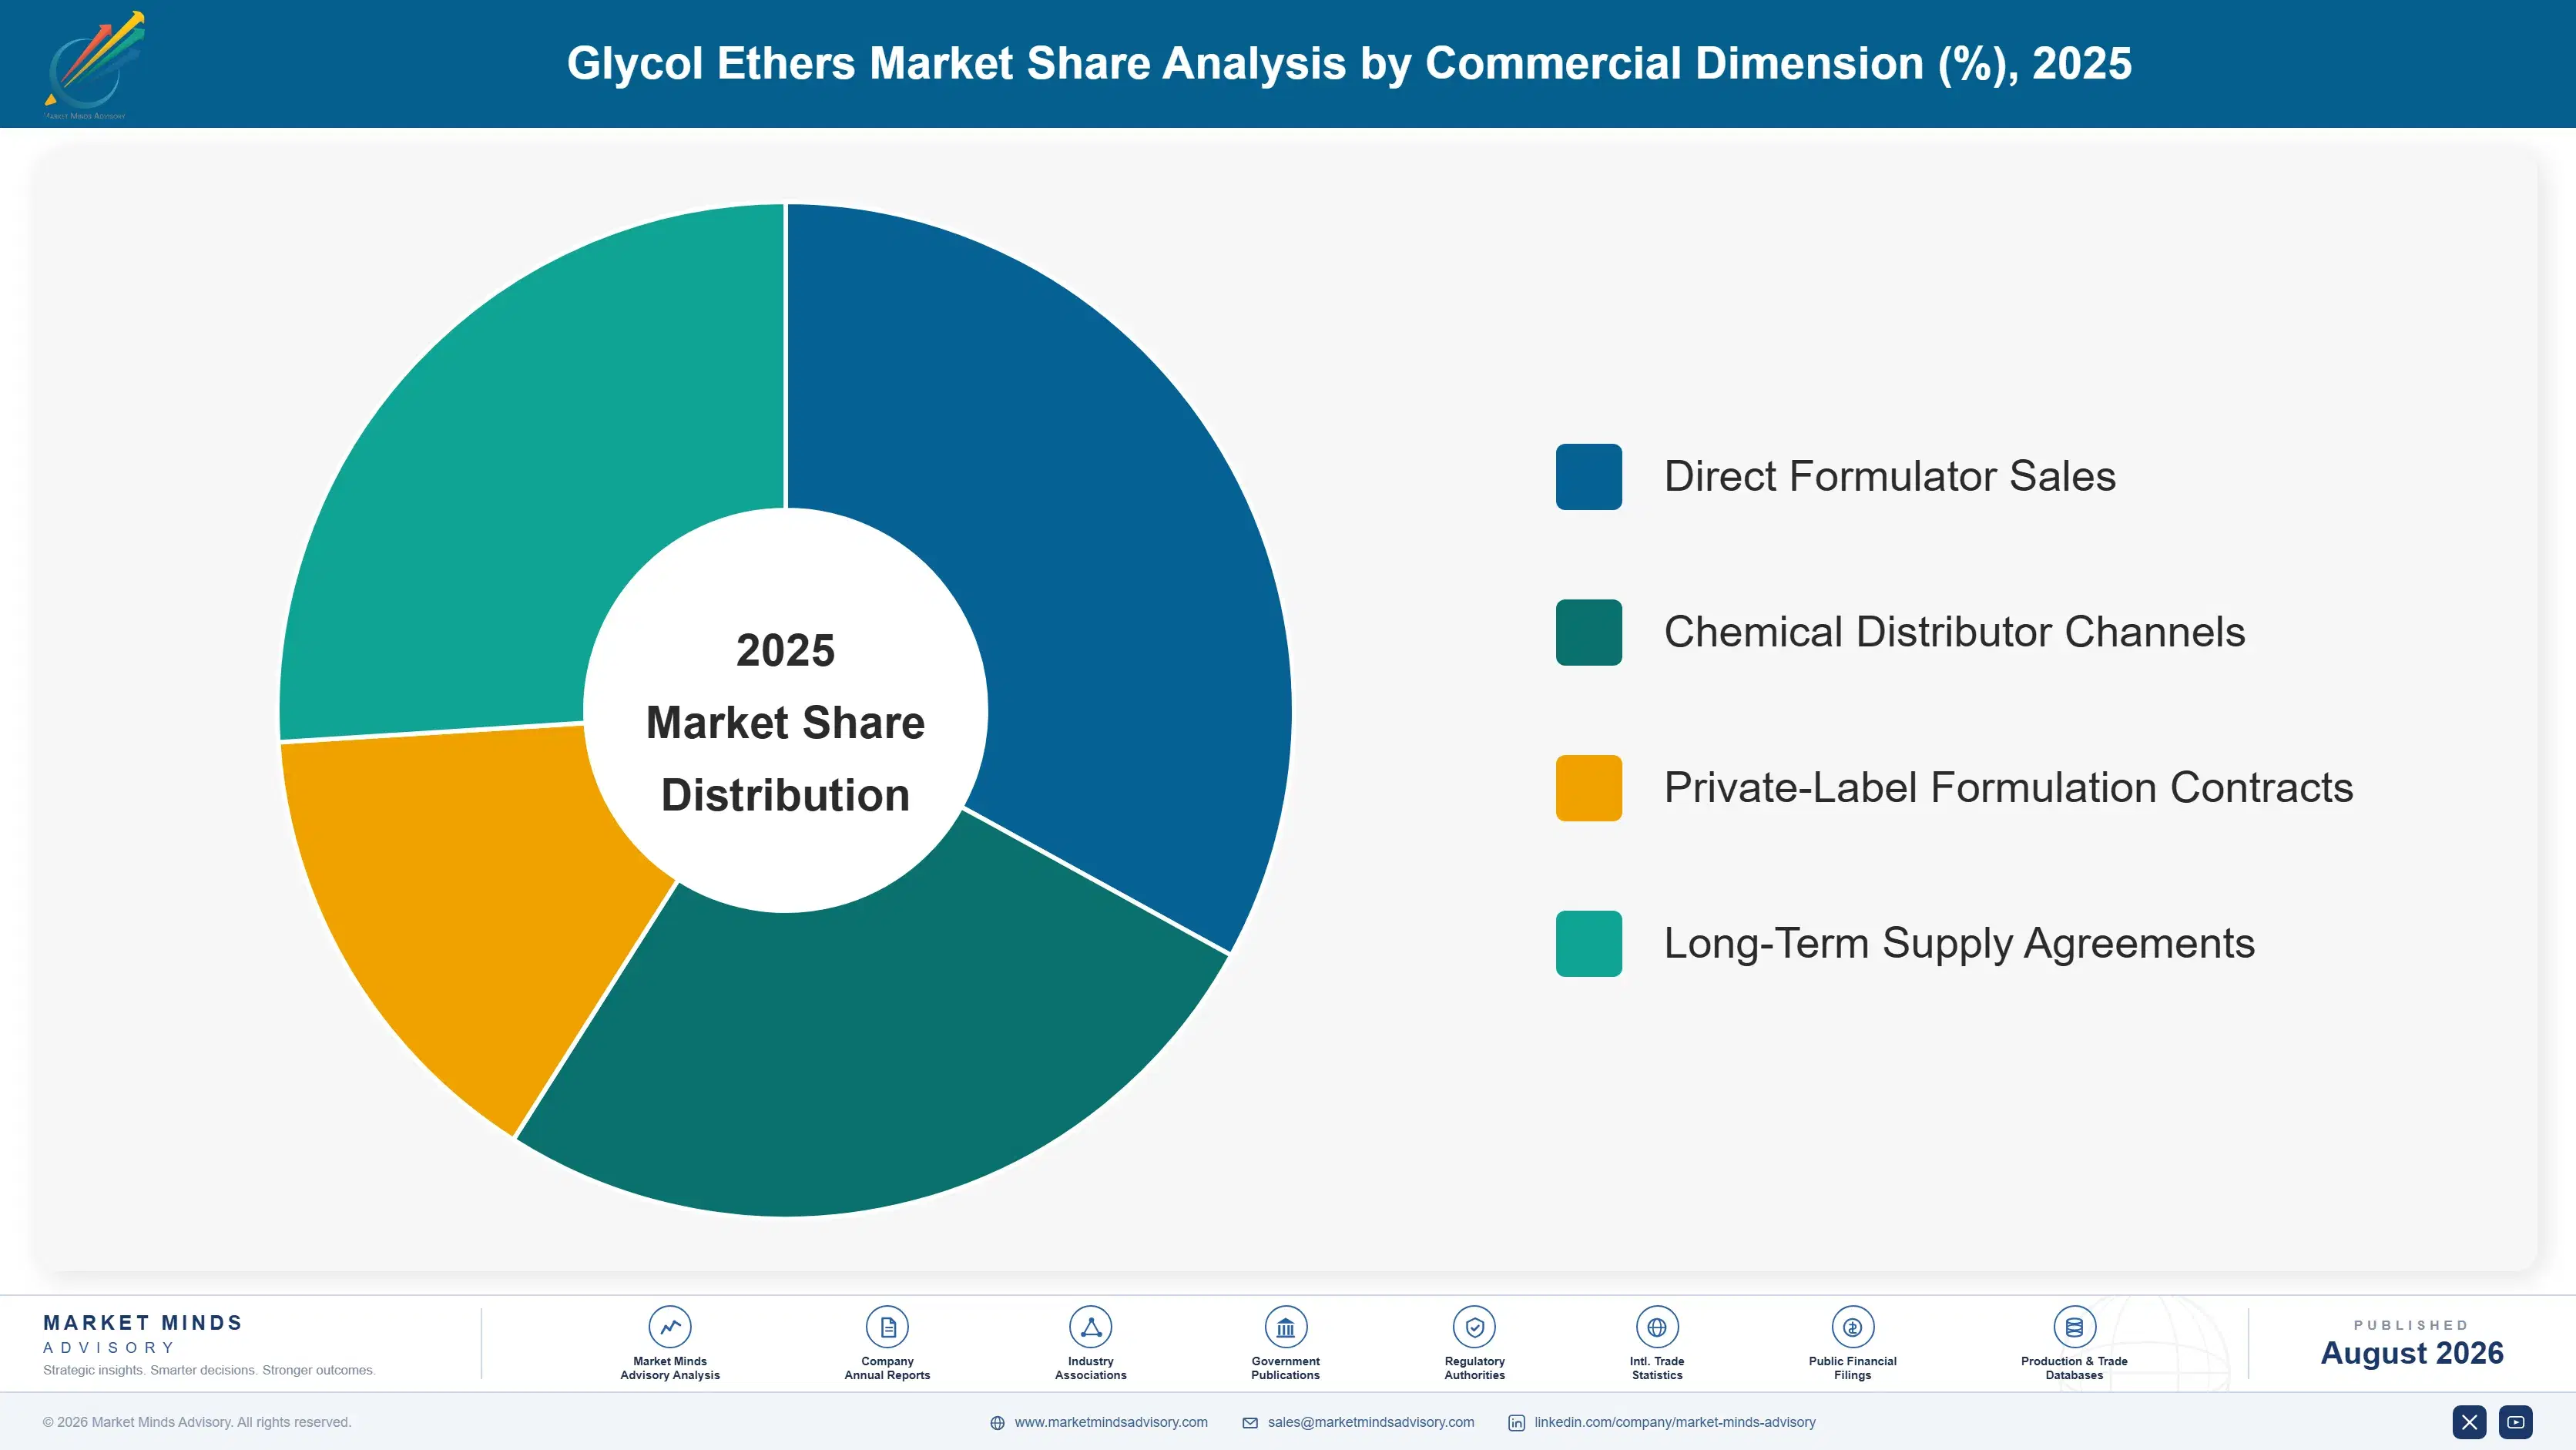
  • Direct Formulator Sales
  • Chemical Distributor Channels
  • Private-Label Formulation Contracts
  • Long-Term Supply Agreements

By Region

  • North America
  • Western Europe
  • East Asia
  • South Asia and Pacific
  • Latin America
  • Middle East and Africa
  • Eastern Europe

Scope, Methodology, and Coverage

Every figure in this report is reproducible from documented input assumptions. The scope below maps the historical period, the forecast horizon, the segmentation dimensions, and the countries covered, alongside the underlying primary and qualitative methodology.
Historical Period
2020 to 2025
Forecast Period
2026 to 2036
Base Year
2025 (USD billions; MMA Primary Research Dataset, August 2026)
Market Definition
This market covers glycol ether solvents used as coalescing agents, cleaning solvents, and processing aids in coatings, cleaning products, and industrial formulations, including both ethylene-series and propylene-series products. It excludes glycol ether acetates sold as standalone specialty esters and unrelated polyether polyol chemistries.
Quantitative Units
USD billions (current prices); metric tonnes where applicable
Segmentation Dimensions
By Product Type; By End-Use Industry; By Commercial Dimension; By Region
Regions Covered
North America, Western Europe, East Asia, South Asia and Pacific, Latin America, Middle East and Africa, Eastern Europe
Countries Covered
USA, China, Germany, France, UK, Japan, South Korea, India, Australia, Canada, Brazil, Mexico, Indonesia, Vietnam, Thailand, Malaysia, UAE, Saudi Arabia, South Africa, Nigeria, Turkey, Poland, Netherlands, Italy, Spain, Sweden, Switzerland, Argentina, Colombia, Singapore, and additional markets relevant to this sector
Key Companies Profiled
Dow Inc., LyondellBasell Industries N.V., Eastman Chemical Company, Shell plc, BASF SE, INEOS Group Holdings S.A., Sasol Limited, Ashland Inc., Clariant AG, LOTTE Chemical Corporation, PTT Global Chemical Public Company Limited, China Petroleum & Chemical Corporation, Nippon Nyukazai Co. Ltd., Kishida Chemical Co. Ltd., Manali Petrochemicals Limited, Oxiteno S.A., Indorama Ventures Public Company Limited, Chang Chun Petrochemical Co. Ltd., Jiangsu Sopo Chemical Co. Ltd., Sanjiang Fine Chemicals Co. Ltd.
Quantitative Methodology
Primary survey, n=3,800 respondents, Q4 2025, six countries; demand-side model with trade association cross-validation
Qualitative Methodology
47 expert interviews, Q4 2025; applied to validate demand model assumptions, identify emerging dynamics, and assess competitive positioning
Report Format
PDF and XLSX data workbook (Word format preview document)
Publisher
Market Minds Advisory
Report Code
MMA-2026-CHM-101
Published
August 2026
Contact
sales@marketmindsadvisory.com | www.marketmindsadvisory.com

Purchase the full Glycol Ethers Market Report (2026 to 2036).

placeholder
placeholder
placeholder
placeholder
placeholder
placeholder
placeholder

Built For The People Who Decide

From boardroom strategy to bench-side execution, this report is read cover-to-cover by leaders shaping the next decade of their industry, turning demand scenarios, market dynamics and valuation benchmarks into decisions.
CXOs/ Presidents/ VPs/ Managers
M&A and Corporate Development
Strategy Teams and R&D Heads
Procurement and Product Directors
Regulatory and Compliance Leaders
Investor Relations and Equity Analysts