Market Minds Advisory
Glue Machine Market

Glue Machine Market: Melt-on-Demand Economics, Adhesive Consumption Savings and the Aftermarket That Funds the Business

Nobody buys a glue machine because they want a glue machine. They buy it because a supplier proved that a different applicator would cut adhesive consumption enough to pay for the equipment inside two years.

Lead Analyst

Bilal Shaikh

Published

September 2026

Make Smarter Decisions with Customized Research Insights

Request a free sample report and evaluate market opportunities, growth trends, and competitive dynamics relevant to your business needs.

2025 MARKET VALUE$3.8BMarket Size 2025
2036 FORECAST VALUE$7.4BBase Case , 2026 to 2036
CAGR 2026 TO 20366.2 %Bull 7.4% / Bear 5.0%
INCREMENTAL OPPORTUNITY$3.3BNet 10- year value creation
EXPANSION MULTIPLE1.82x2036 value over 2026 base
Strategic Levers
M&A Pipeline
Regional Outlook
Country Rankings
Competitive Intelligence
Segmental Deep-dive
Call-Us : 91 93563 13602

Executive Snapshot and Market Trajectory

The machine is never the purchase. Adhesive consumed over an applicator's working life costs several times the equipment itself, so every serious sale in this market is an argument about grams per unit rather than about the capital price on the quotation. Capital price barely enters it.
Tank-free melt-on-demand systems compound at 9.3%, exactly 1.50 times the market, by melting adhesive only as the line calls for it. That removes the charring, the blocked nozzles and roughly half the energy that a heated tank consumes holding polymer molten through a night shift nobody is running. East Asia holds 30% of demand on packaging and nonwoven hygiene assembly volume. Chinese and Indian hygiene converting capacity keeps adding lines.
Five suppliers hold 52% of the market, and the aftermarket explains most of that position. Nozzles, modules, hoses and filters recur for the life of an installation, and a converter who has standardised on one applicator platform rarely reopens the question. Roughly 78% of sites run one platform across the whole plant. That recurring stream is far more defensible than any equipment sale. Adhesive suppliers sit alongside the equipment makers, specifying and being specified.
Market Definition
The market covers equipment that meters, heats and applies industrial adhesives, including hot melt tank melters and applicators, tank-free melt-on-demand systems, cold and water-based glue dispensing, two-component reactive dispensing, precision jetting systems and integrated robotic dispensing cells, together with the applicator aftermarket. Adhesives themselves are excluded, as are the production machines into which dispensing equipment is integrated.
Base Year Value
$3.8B in 2025 (MMA Primary Research Dataset, August 2026)
Forecast Period
2026 to 2036, eleven discrete annual values
CAGR
6.2% base case. Bull 7.4%. Bear 5.0%.
Fastest Growth Segment
Tank-Free Melt-on-Demand Systems: 9.3% CAGR
Fastest Growth Country
India: 9.2% CAGR
Fastest Growth Region
South Asia and Pacific: 8.4% CAGR
Largest Region
East Asia: 30% of 2025 global value
Market Leaders
Nordson Corporation, Graco, Robatech, Valco Melton, ITW Dynatec. Source: MMA Analysis based on company annual reports.
Primary Survey
n=3,800 procurement and R&D decision-makers, Q4 2025, six countries
Methodology
Demand-side build-up, cross-validated against public data, 47 expert interviews

Glue Machine Market Forecast Scenarios

glue-machine-market-size-forecast-scenario-1787307249188
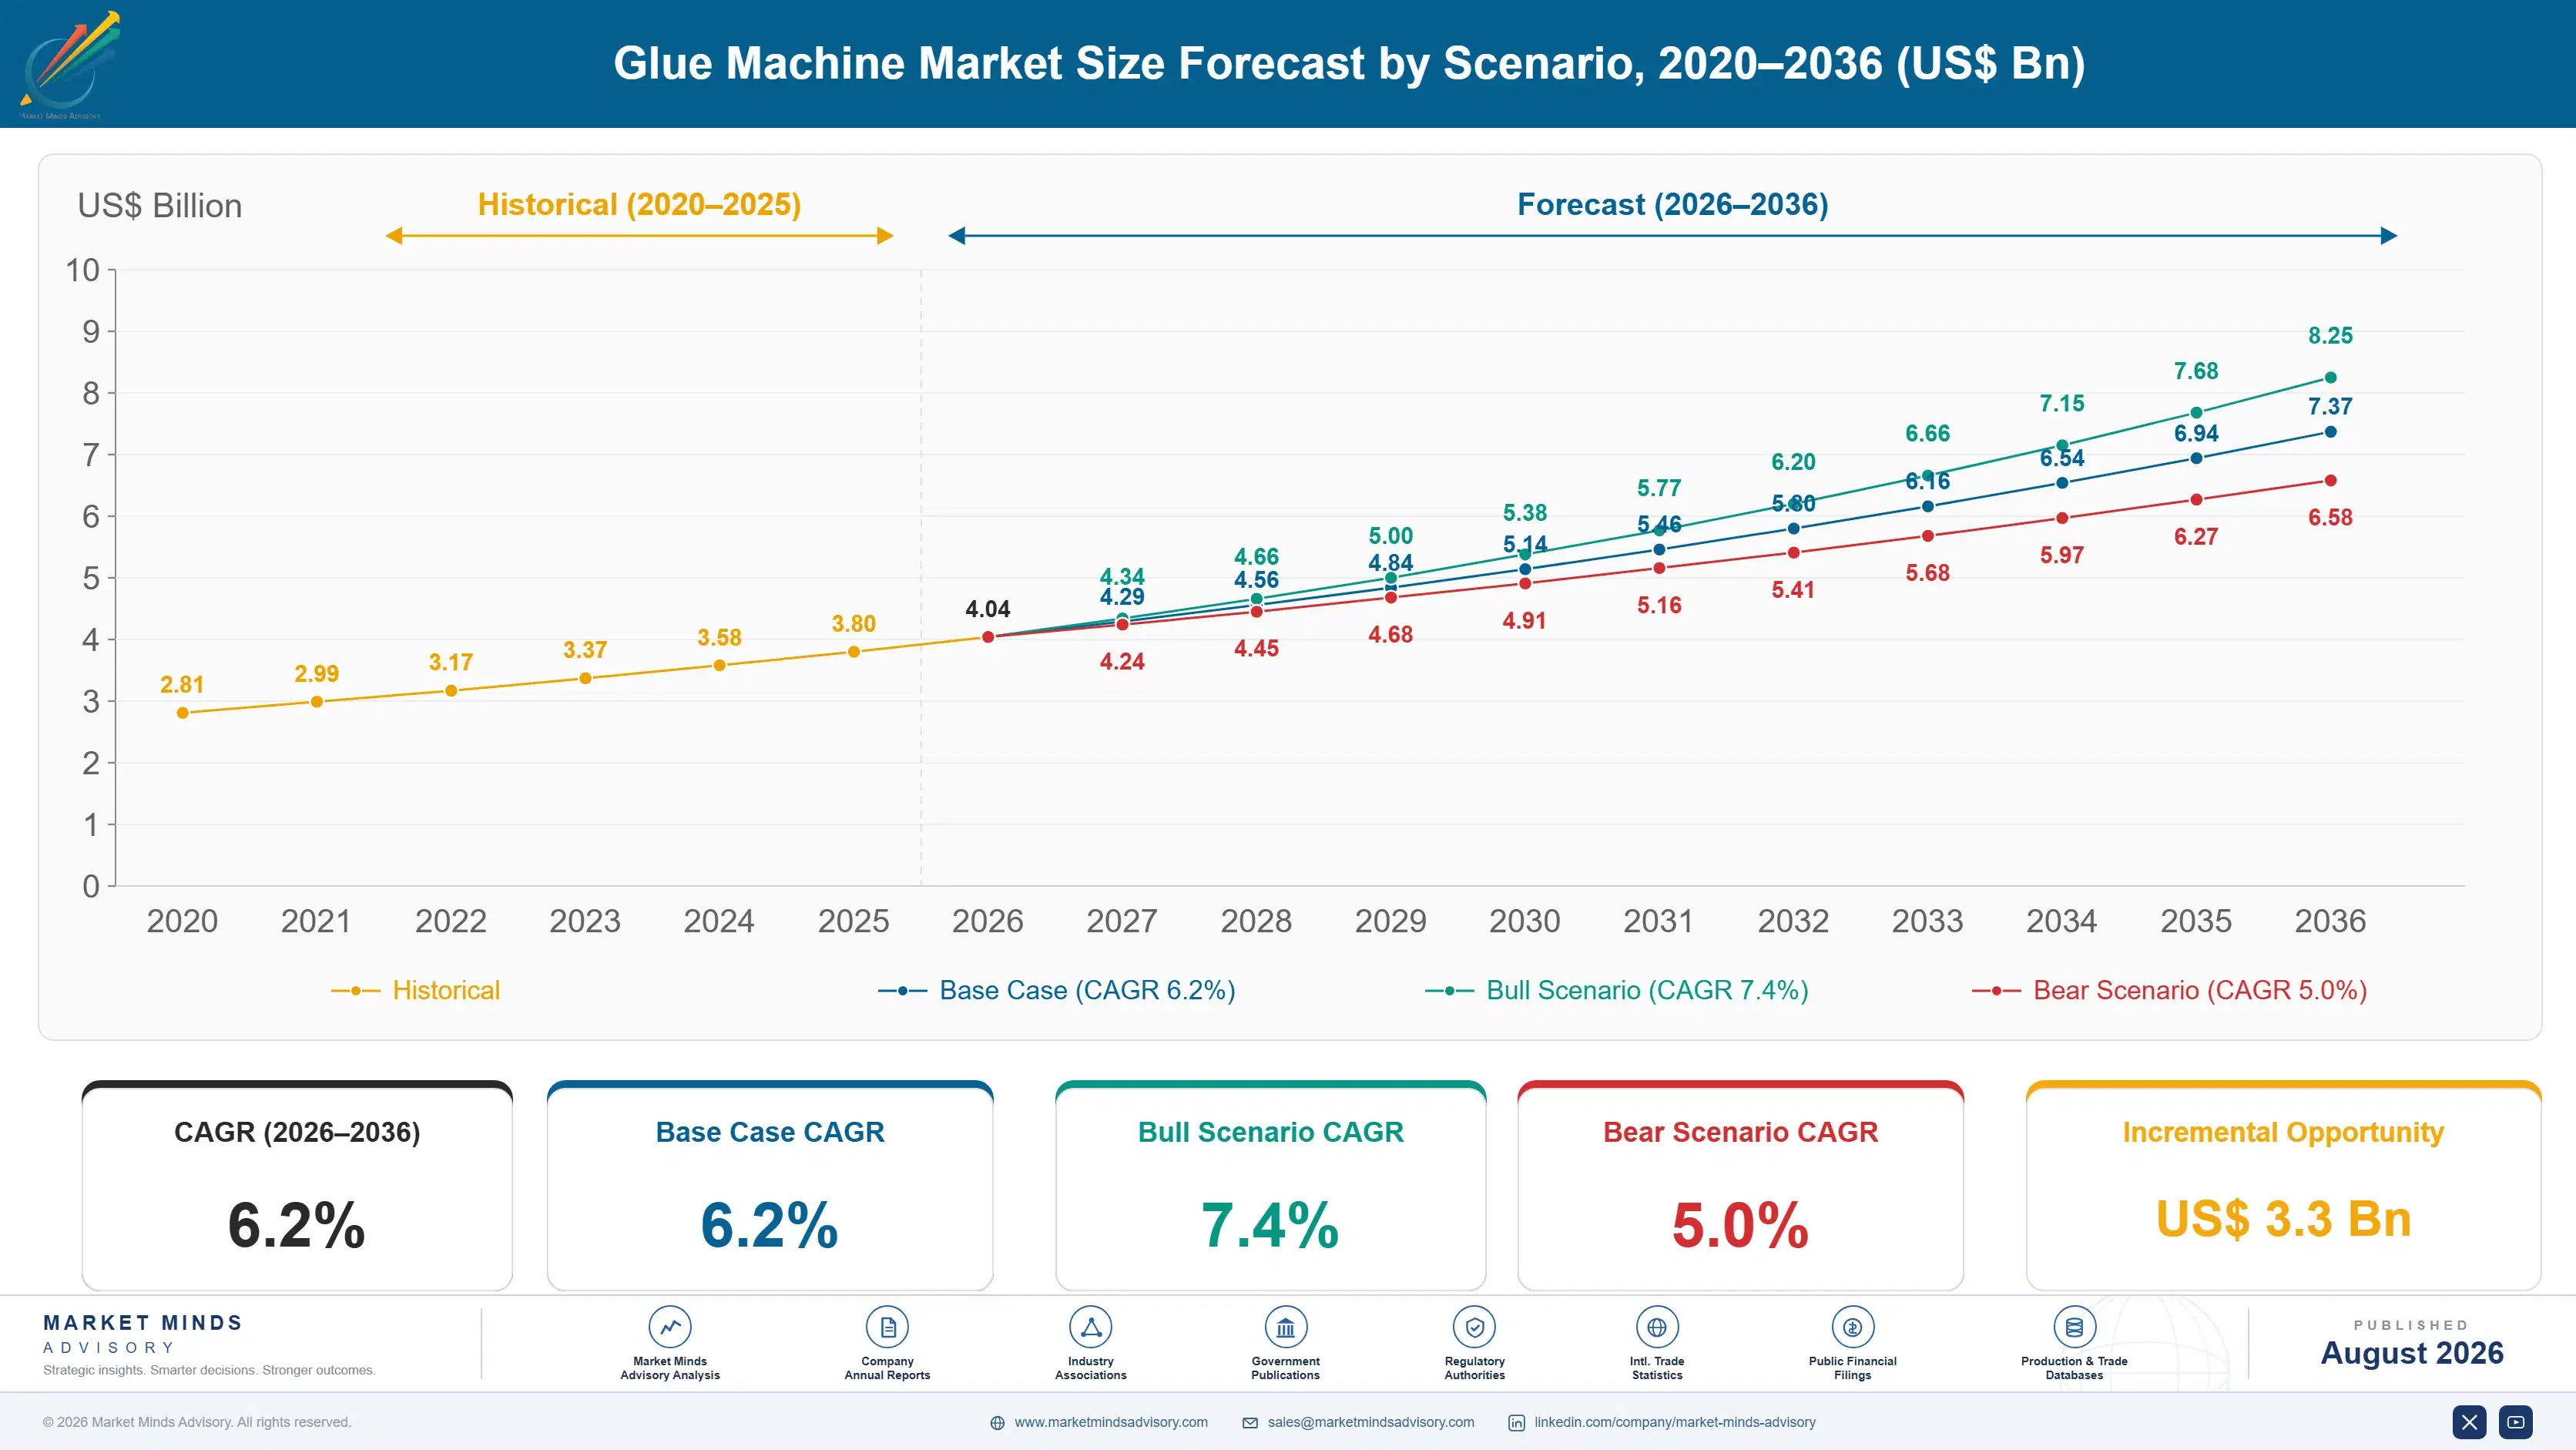
Growth ran at an implied 5.0% across 2020 to 2025, and the composition changed markedly inside that period. Capital equipment orders stalled through 2020 and much of 2021 while aftermarket consumption held up, then energy costs across Europe from 2022 made melt-on-demand conversion economics compelling in a way that a decade of engineering argument had not managed.
The base case at 6.2% rests on three mechanisms. Energy and adhesive cost pressure keeps pushing installed tank melters toward melt-on-demand replacement well before their mechanical end of life. Electric vehicle assembly is adopting two-component structural bonding in place of welding and mechanical fastening at real scale. And nonwoven hygiene converters keep raising line speeds, which demands applicator precision that older equipment cannot deliver at any setting. Replacement is running ahead of failure for once.
The bull case at 7.4% depends on structural adhesive bonding spreading further through vehicle body assembly, which would pull two-component dispensing volume up sharply from a comparatively small base. The bear case at 5.0% assumes a capital spending pause across packaging and converting, where buyers defer equipment replacement and run existing applicators harder while continuing to buy aftermarket parts.

Selling Equipment by Arguing About Grams

A hot melt applicator is a modest piece of equipment: a melter, a pump, some heated hose and a set of dispensing modules. The adhesive that passes through it over a working life costs roughly 6.4 times what the machine did. That ratio governs every commercial conversation in this market, and it is why the sales engineer arrives with a consumption study rather than a specification sheet.
TOP FIVE CONCENTRATION52%Combined share held by the five largest global equipment suppliers
AFTERMARKET REVENUE SHARE44% of supplier revenueRecurring parts and consumables against original equipment sales
ADHESIVE TO EQUIPMENT RATIO6.4 timesLifetime adhesive spend against original applicator purchase price
MELT-ON-DEMAND ENERGY SAVING48% reductionEnergy cut against a conventional heated tank melter system
TYPICAL PAYBACK PERIOD19 monthsReturn on applicator upgrade funded by adhesive consumption savings
INSTALLED BASE AGE11 years medianMedian age of hot melt equipment currently running in production
Conventional tank melters hold adhesive molten in a reservoir, which works well enough and wastes a great deal. Polymer degrades with time at temperature, forming char that blocks nozzles and forces line stoppages. Energy goes into keeping a tank hot through breaks, changeovers and shifts nobody is running. Melt-on-demand systems melt only what the line calls for, cutting energy roughly 48% and removing the char problem at its source.
The aftermarket is where suppliers actually make their money, at 44% of revenue. Nozzles wear, modules need rebuilding, hoses fail and filters clog, and all of it recurs for the life of an installation. Roughly 78% of sites run a single applicator platform, which makes that recurring stream defensible in a way the original equipment sale never is.
"Every plant manager I meet can tell you the price of their adhesive to two decimal places and has no idea what their applicator cost. That is exactly the right way round, and the suppliers who understand it sell equipment by talking about everything except the equipment."
Director, Industrial Process Equipment and Converting Systems Practice · MMA Ind

Market Trends

Melt-on-Demand Displaces Tank Melters on Energy and Char

Tank melters hold adhesive molten continuously, degrading polymer into char that blocks nozzles and stops lines. Melt-on-demand systems melt only what the applicator calls for, cutting energy consumption roughly 48% and eliminating the residence time that creates char in the first place. European industrial energy costs since 2022 turned a long-standing engineering argument into a straightforward financial one, and payback now runs near nineteen months. The segment compounds at 9.3% against a market at 6.2%, and conversions are happening well before installed equipment reaches mechanical end of life. That is unusual for capital equipment.
Market Impact: Hygiene assembly at 21% of demand
Structural Bonding in Vehicle Assembly Pulls Two-Component Dispensing

Electric vehicle body and battery assembly uses adhesive where welding and mechanical fastening once served, joining mixed materials that cannot be welded together and bonding battery modules where thermal management matters as much as structure. Two-component reactive systems require precise ratio control, mixing at the nozzle and tightly managed pot life, which is a different engineering discipline from hot melt entirely. The segment grows at 8.1%. Volumes remain modest against packaging applications, but the equipment carries far higher unit values and much longer qualification cycles. A qualified position lasts the platform's life.
Market Impact: Payback averaging 19 months per lin

Market Opportunities and Growth Drivers

Nonwoven Hygiene Line Speeds Outrun Older Applicator Capability

Diaper and feminine hygiene converting lines now run at speeds where elastic strand coating and construction adhesive application demand pattern precision that older applicators cannot hold at any setting. Missed or excess adhesive at those speeds shows up immediately as product defects and machine contamination. Hygiene converters across China, India and Southeast Asia have been adding capacity steadily, and each new line specifies current-generation applicators. Roughly 21% of hot melt equipment demand now comes from nonwoven hygiene assembly, and that share continues to rise. Refurbished equipment is rarely specified now.
Market Impact: Median installed age at 11 years

Adhesive Cost Pressure Funds Equipment Replacement Directly

Adhesive consumed across an applicator's life costs roughly 6.4 times the original equipment purchase, so a few percentage points of consumption reduction fund a replacement machine outright. Polymer price movement since 2022 sharpened that arithmetic considerably. Suppliers arrive with measured consumption studies rather than specification sheets, and capital approval happens on an operating cost line rather than a capital budget. Typical payback runs near nineteen months, which is comfortably inside the threshold most manufacturing sites apply to discretionary equipment spending. Application engineering capability rather than product specification is what makes that argument possible for a supplier to run credibly.
Market Impact: Copies targeting 44% revenue base

Market Restraints and Challenges

Installed Platforms Resist Replacement Long Past Economic Life

Median installed equipment age runs eleven years, and much of it is considerably older than that. The root cause is that a working applicator produces acceptable product, so replacement competes for capital against machinery that has actually failed. Maintenance teams know the platform, spares are stocked and operators are trained on it. Suppliers mitigate by funding the case from adhesive savings rather than capital budgets, and by offering retrofit modules that upgrade dispensing performance without replacing the melter, which lowers the decision threshold considerably. Familiarity is a genuine competitive asset.
Market Impact: Energy consumption cut 48% per line

Aftermarket Parts Face Copies From Unauthorised Suppliers

Nozzles, modules and filters generate 44% of supplier revenue, which makes them an obvious target for unauthorised copies sold at steep discounts. The root cause is that many wear parts are mechanically simple and unprotected once the original patents expire. Copies frequently underperform on pattern consistency, though the failure shows up as adhesive waste rather than as an obvious defect. Suppliers mitigate through service agreements bundling parts with performance guarantees, and by tying newer modules to platform features copies cannot replicate. Legal enforcement has proved largely ineffective. Design protection works where litigation does not.
Market Impact: Reactive dispensing compounding at
3 additional market trends, 4 additional growth drivers, and 2 additional restraints and challenges are covered in the full report. Contact sales@marketmindsadvisory.com to access the complete intelligence.

Segment CAGR and Growth Architecture

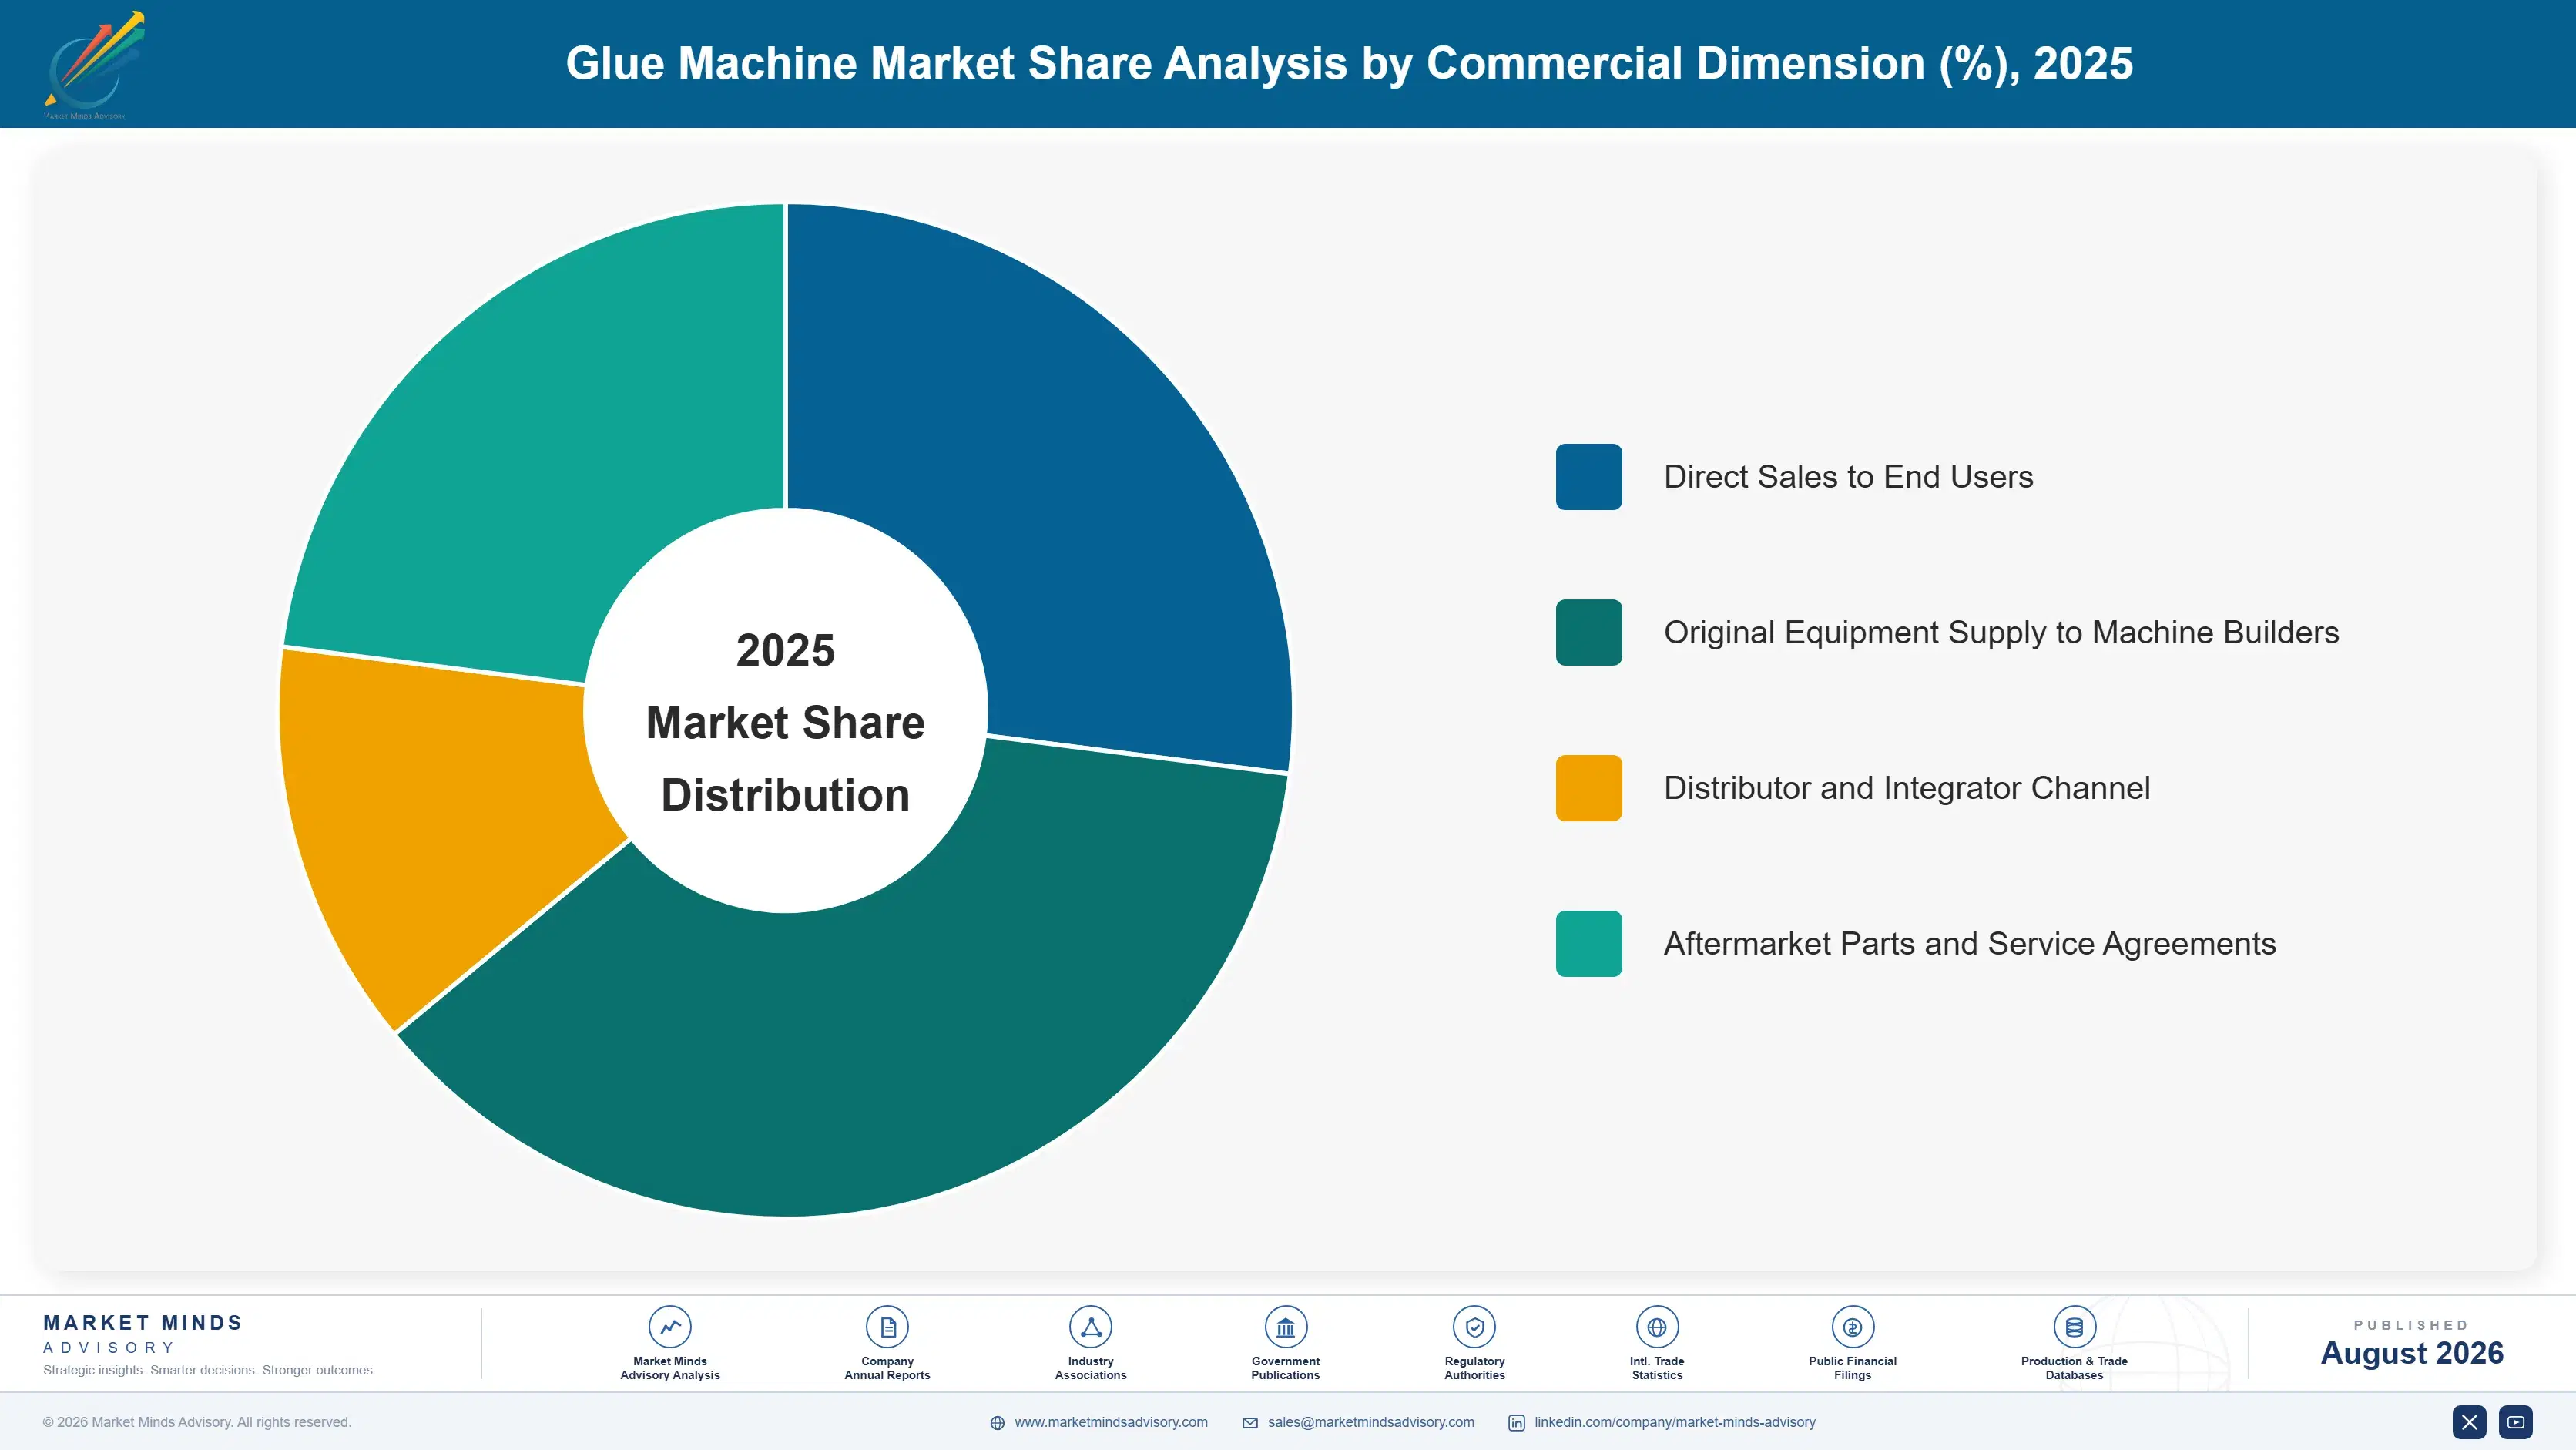
Segmentation follows dispensing system type, because that determines the adhesive chemistry the equipment can handle, the precision it delivers and the engineering discipline required to support it. A hot melt applicator and a two-component reactive dispenser share a purpose and essentially no technology, and no customer evaluates them against each other. Chemistry decides the engineering discipline.
glue-machine-market-market-share-analysis-1787307249734

Tank-Free Melt-on-Demand Systems

Melt-on-demand compounds at 9.3%, exactly 1.50 times the market rate, on an argument that is now financial rather than technical. A conventional tank holds adhesive molten through breaks, changeovers and idle shifts, degrading polymer into char that blocks nozzles and stops lines. Melting only what the applicator calls for cuts energy roughly 48% and removes the residence time that creates char at all. European energy costs since 2022 made the payback obvious where a decade of engineering argument had not, and it now runs near nineteen months. Conversions are happening well ahead of mechanical end of life, which is unusual for capital equipment of this kind and unusually good for suppliers.
CAGR 9.3%

Two-Component and Reactive Adhesive Dispensing

Two-component dispensing grows at 8.1% on vehicle assembly adopting structural bonding where welding and mechanical fastening previously served. Mixed-material bodies cannot be welded, and battery module assembly needs joints that manage heat as well as load. The engineering is demanding: ratio control must hold within tight tolerance, mixing happens at the nozzle, and pot life governs everything downstream of it. Qualification cycles run long because a structural joint failure is a safety matter rather than a quality one. Unit equipment values run far above hot melt equivalents and the support requirement is heavier, which keeps the supplier field narrow and the pricing considerably firmer than in packaging applications. Packaging-focused competitors rarely participate.
CAGR 8.1%
Full segment breakdown across 6 segments available in the complete report.

Regional Architecture and Country Demand Map

Demand follows converting and assembly capacity rather than consumption of the finished goods, since the equipment is installed where product is made. Packaging and nonwoven converting dominate the volume, while vehicle and electronics assembly drive the higher-value reactive and precision segments. Two quite different buying logics operate inside one market.

East Asia

East Asia holds 30% of global demand, the largest regional share, built on converting capacity rather than on any single application. Chinese packaging converting, nonwoven hygiene assembly and electronics manufacturing each generate substantial applicator demand, and hygiene capacity in particular has been added at pace over the past decade. Chinese electric vehicle assembly has adopted structural bonding earlier and more extensively than most Western programmes, pulling two-component dispensing volume with it. Japanese demand concentrates in precision jetting for electronics, where Musashi Engineering holds a strong domestic position. Korean demand follows display and battery manufacturing. Regional growth of 7.2% reflects continued converting capacity addition rather than replacement of existing installed equipment.
Share: 30% | CAGR: 7.2% (2026 to 2036)

North America

North America accounts for 25% of demand and grows at 5.8%. Corrugated and folding carton converting provides the volume base, and case sealing applications alone account for a large installed applicator population. Nonwoven hygiene manufacturing is substantial and technically advanced. Vehicle assembly has adopted structural bonding more slowly than Chinese programmes but is accelerating, particularly around battery module assembly in the southeastern manufacturing corridor. The distinguishing regional feature is aftermarket intensity: service agreements bundling parts with performance guarantees are more established here than elsewhere, which supports the recurring revenue that makes up 44% of supplier income across the industry. Vehicle programmes are the segment to watch here. Battery module bonding volumes are only now reaching real scale.
Share: 25% | CAGR: 5.8% (2026 to 2036)
Regional intelligence for 5 additional markets available in the complete report: Western Europe, South Asia and Pacific, Latin America, Middle East and Africa, Eastern Europe. Contact sales@marketmindsadvisory.com.
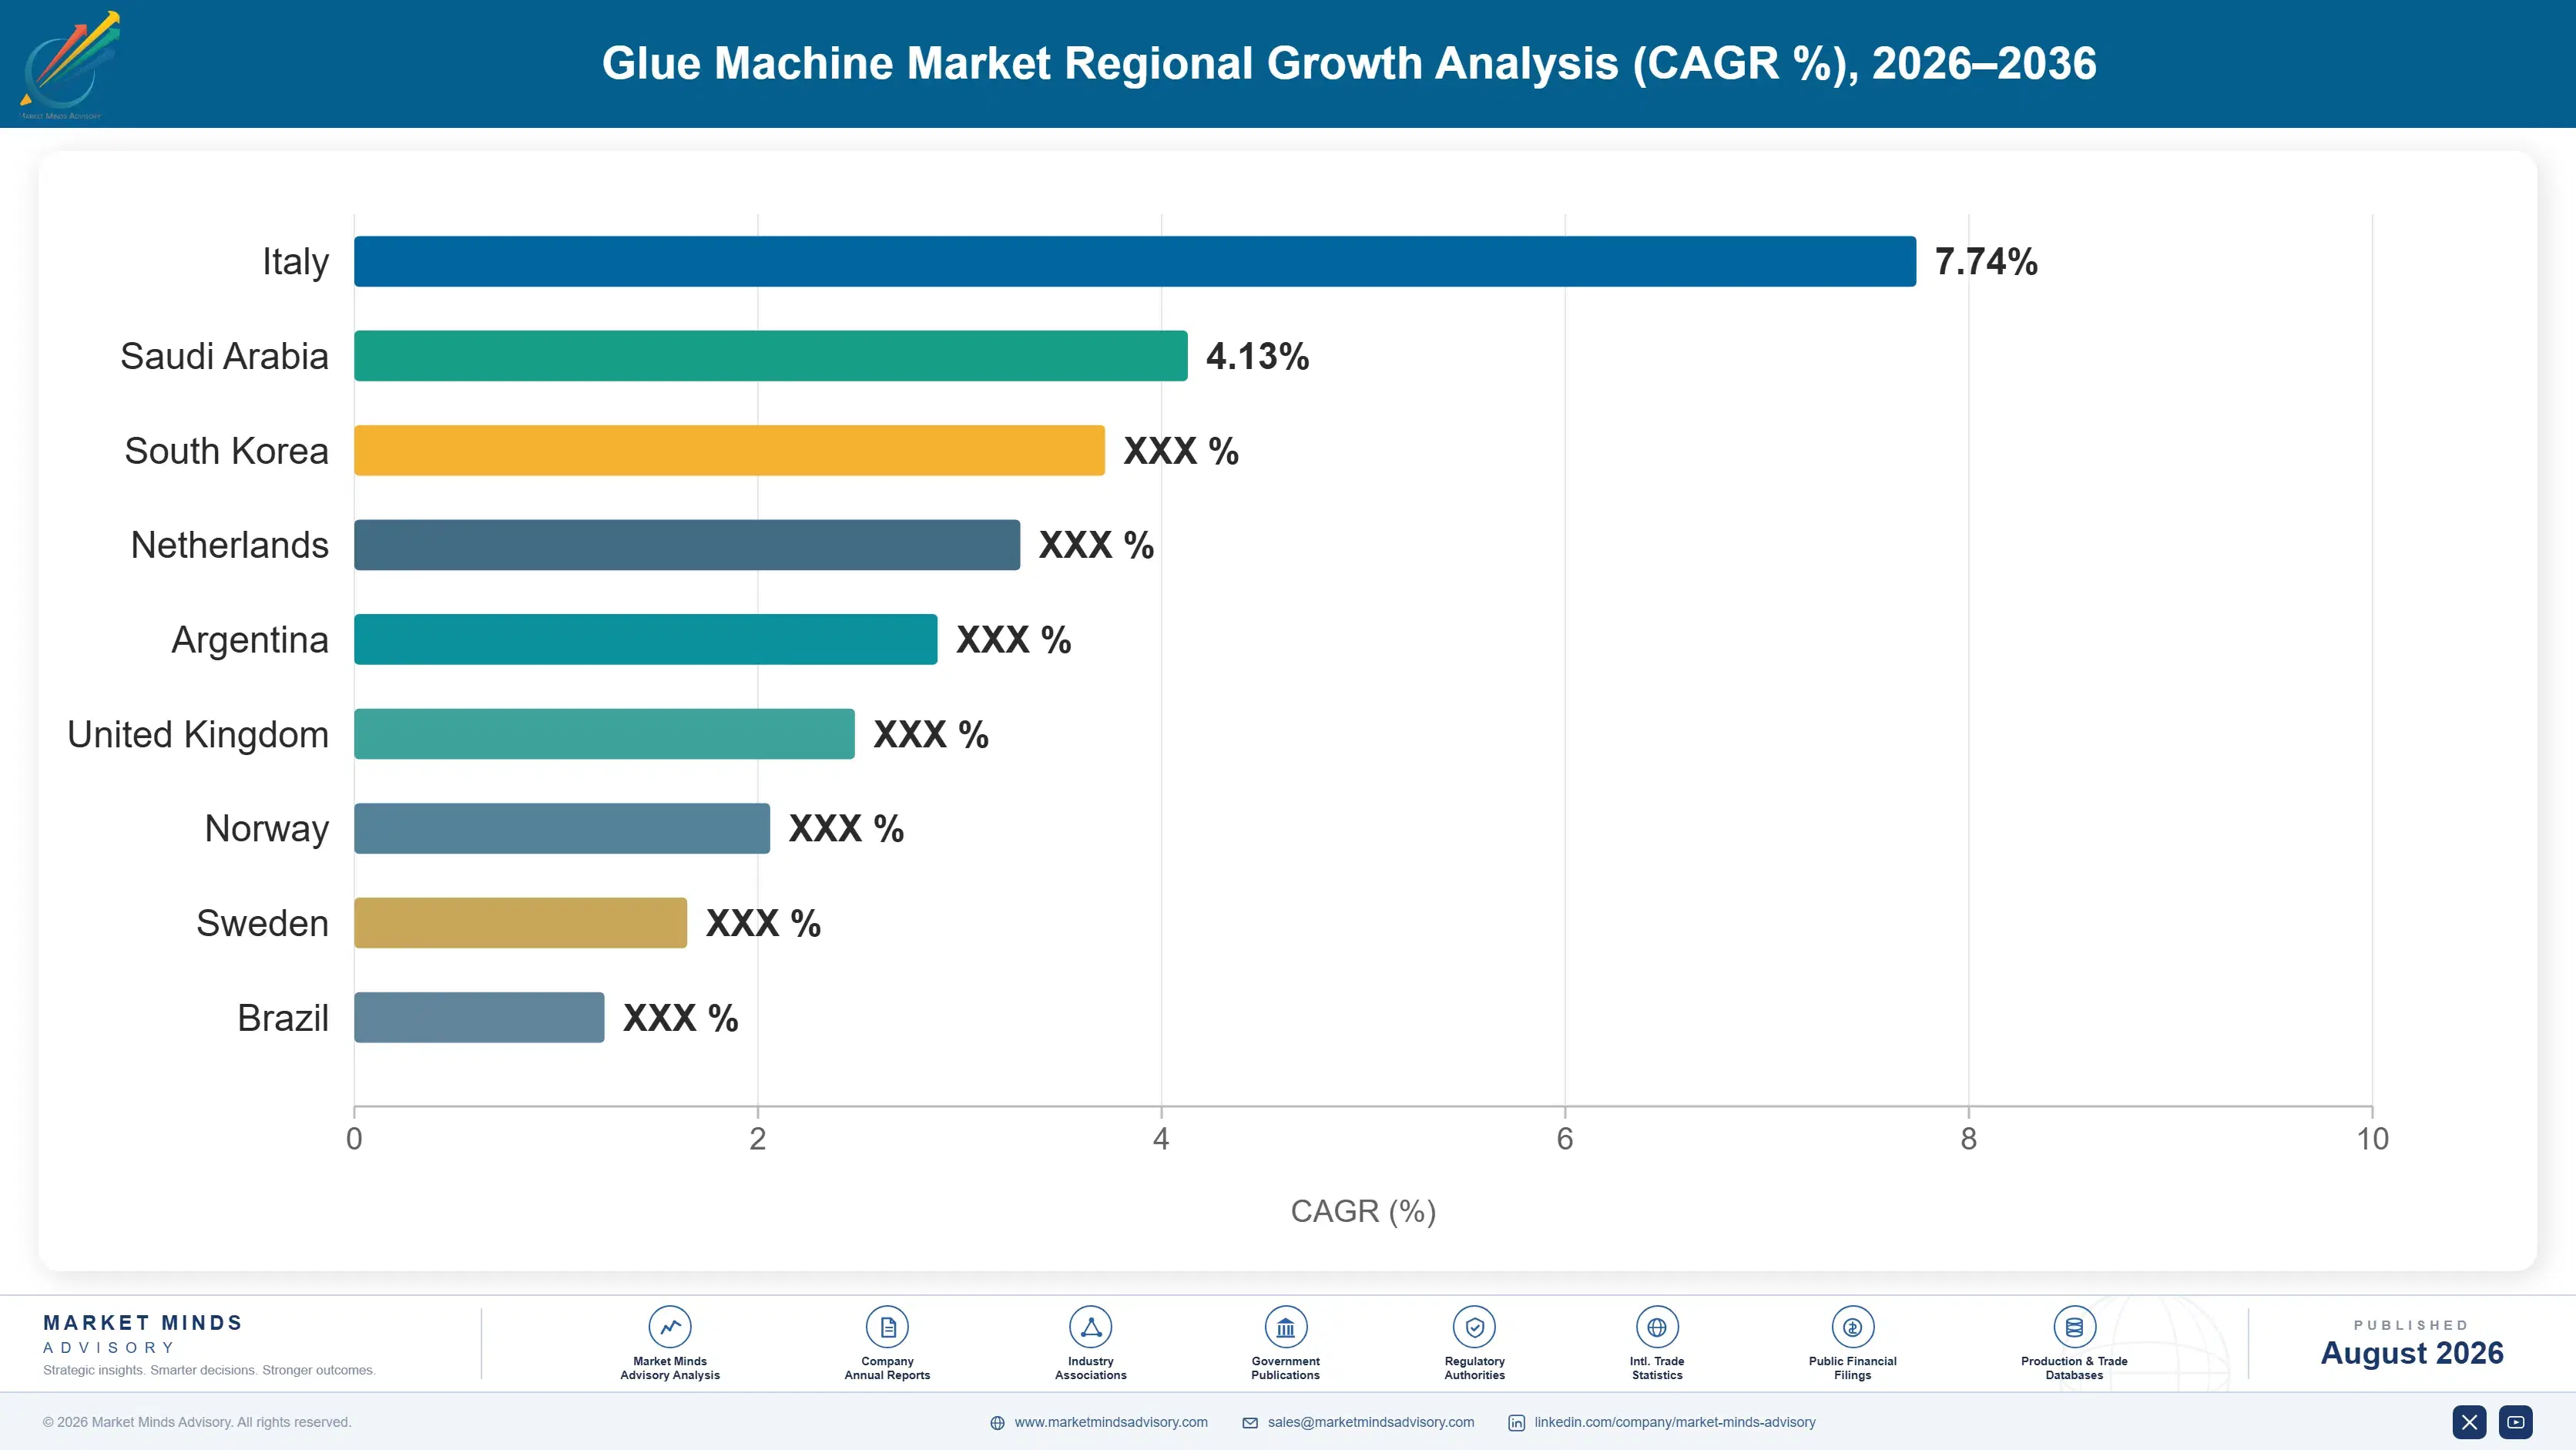
glue-machine-market-country-cagr-analysis-1787307250253

Where the Money Actually Comes From

Original equipment sales in this market are close to a loss leader for the relationship they open. What follows matters far more: recurring wear parts, service agreements and the platform standardisation that keeps a site buying from one supplier for a decade. Four positions carry the economics worth having. None of them is about the machine.

Fund Equipment Sales From Adhesive Consumption Studies

Adhesive costs roughly 6.4 times the applicator across a working life, so a consumption reduction of a few percentage points pays for replacement equipment outright. Suppliers arriving with measured before-and-after studies move the approval from a capital budget to an operating cost line, where thresholds are far lower and payback near nineteen months clears easily. This requires application engineers capable of running the measurement credibly on a customer's own line. Competitors quoting equipment specifications compete on price against a machine the customer does not really want to buy. Measurement capability is the whole advantage.
Market Impact: Consumption studies delivering a 19

Defend the Aftermarket With Bundled Service Guarantees

Wear parts and consumables generate 44% of supplier revenue and attract unauthorised copies sold at steep discounts, whose underperformance shows up as adhesive waste rather than obvious defects. Bundling parts into service agreements with pattern consistency and uptime guarantees makes the copy comparison impossible to run, because the customer is buying an outcome rather than a component. Sites on such agreements consume roughly 30% more parts revenue annually than those buying transactionally, and they almost never switch platform while the agreement runs. Switching platform mid-agreement is almost unheard of. The guarantee travels with the parts.
Market Impact: Agreements lifting parts revenue by

Convert Installed Tanks Before Mechanical End of Life

Median installed equipment age is eleven years and much is older, but melt-on-demand economics now justify replacement long before anything fails. Cutting energy roughly 48% and removing char-driven line stoppages gives a payback near nineteen months on equipment that still works perfectly well. Suppliers that map their own installed base by age, energy tariff and line utilisation can target conversions systematically rather than waiting for failures. Retrofit modules that upgrade dispensing without replacing the melter lower the threshold further for customers unwilling to commit to full replacement. Waiting for failure concedes the opportunity.
Market Impact: Conversions cutting energy by 48% o

Build Reactive Dispensing Capability for Vehicle Assembly

Two-component structural bonding grows at 8.1% as vehicle programmes replace welds with adhesive joints in mixed-material bodies and battery modules. Ratio control, nozzle mixing and pot life management are a genuinely different engineering discipline from hot melt, and qualification cycles run long because a structural joint failure is a safety matter. That difficulty is the attraction: unit equipment values run several times hot melt equivalents, the supplier field stays narrow, and a qualified position on a vehicle programme lasts the platform's production life. Few packaging suppliers can follow them there, which keeps competitive pressure unusually light.
Market Impact: Reactive systems compounding at 8.1

Who Controls the Margin Pool

Five suppliers hold 52% of the market measured on dispensing equipment and aftermarket revenue, the basis applied consistently through this section. Concentration is high for industrial equipment, and the aftermarket explains it: 78% of sites standardise on a single applicator platform, and the wear parts that follow are worth more than the machines. Nordson leads clearly. Machines are almost incidental to the economics.
Competition runs on three dimensions. Application engineering capability decides who can run a credible consumption study on a customer's line, which is how equipment actually gets approved. Service network density decides whether a sophisticated system is a sensible purchase at a given location at all. And original equipment channel access through packaging machinery builders places applicators into machines before the end user is ever consulted.

Two pressures are shifting position. Unauthorised aftermarket copies erode the recurring revenue that funds the industry's service model, particularly in Asia. Against that, reactive dispensing for vehicle assembly rewards suppliers with process engineering depth that packaging-focused competitors lack entirely. Rankings will move toward whoever combines installed base conversion discipline with credible reactive dispensing capability. Very few hold both today.
glue-machine-market-company-positioning-matrix-1787307250774

Competitive Moat and Risk Dimensions

NORDSON CORPORATION

Moat: Installed base and aftermarket depth

Nordson holds the largest installed applicator population in the industry, and the wear parts, modules and service that population consumes generate recurring revenue no competitor can match in scale. Application engineering resources across most major markets let the company run credible consumption studies on customer lines, which is the mechanism through which equipment sales are actually approved.
NORDSON CORPORATION

Risk: Aftermarket copy erosion

The scale of the installed base that makes Nordson's aftermarket valuable also makes it the primary target for unauthorised parts suppliers, particularly across Asian markets where enforcement is weaker. Copies underperform on pattern consistency, but the resulting adhesive waste is invisible to a purchasing manager comparing part prices. Defending that revenue requires service bundling rather than legal action.
GRACO

Moat: Fluid handling engineering breadth

Graco's core capability in precise fluid metering and pumping transfers directly into two-component reactive dispensing, where ratio control accuracy determines whether a structural joint performs. That engineering depth positions the company well in vehicle assembly applications growing at 8.1%, and its distribution reach into industrial and construction markets provides channels beyond packaging converting.
GRACO

Risk: Hot melt aftermarket position

The company's installed hot melt population is smaller than the market leader's, which limits the recurring parts revenue that funds application engineering coverage in packaging converting. Competing for melt-on-demand conversions requires access to installed equipment the company does not own, so growth there depends on displacing incumbents rather than upgrading its own base.

Players Tracked

Prominent Players

Nordson Corporation
Graco
Robatech
Valco Melton
ITW Dynatec

Other Key Players

Baumer hhs
Focke Meler
Hardo Maschinenbau
Buhnen
Sulzer
Atlas Copco
Durr Systems
Musashi Engineering
ViscoTec
Vermes Microdispensing
Fisnar
Dymax
Sames
Preo
Glue Machinery Corporation

Recent Developments

MARCH 2025

European energy costs accelerate melt-on-demand conversion programmes

Converting sites across Western Europe accelerated replacement of conventional tank melters with melt-on-demand systems, citing energy consumption reductions near 48% and elimination of char-related line stoppages. This reflects operating cost pressure rather than any corporate transaction, and conversions are running well ahead of mechanical end of life.
Signal: Equipment replacement is being driven by a
JULY 2025

Battery module assembly expands two-component dispensing qualification

Electric vehicle manufacturers extended structural adhesive bonding into further battery module and body assembly operations, requiring two-component dispensing systems qualified to structural joint standards. These were engineering programme decisions rather than commercial transactions, and qualification cycles run considerably longer than packaging equipment sales. Supplier qualification is narrowing accordingly.
Signal: A safety-critical joint changes the qualif
NOVEMBER 2025

Service agreements expand to counter unauthorised aftermarket parts

Several equipment suppliers broadened service agreements bundling wear parts with pattern consistency and uptime guarantees, responding to unauthorised copies undercutting original parts pricing. These were commercial programme changes rather than acquisitions, targeting the recurring revenue that funds application engineering coverage. A guarantee makes price comparison impossible.
Signal: Selling an outcome rather than a component

What Sits Inside an Applicator

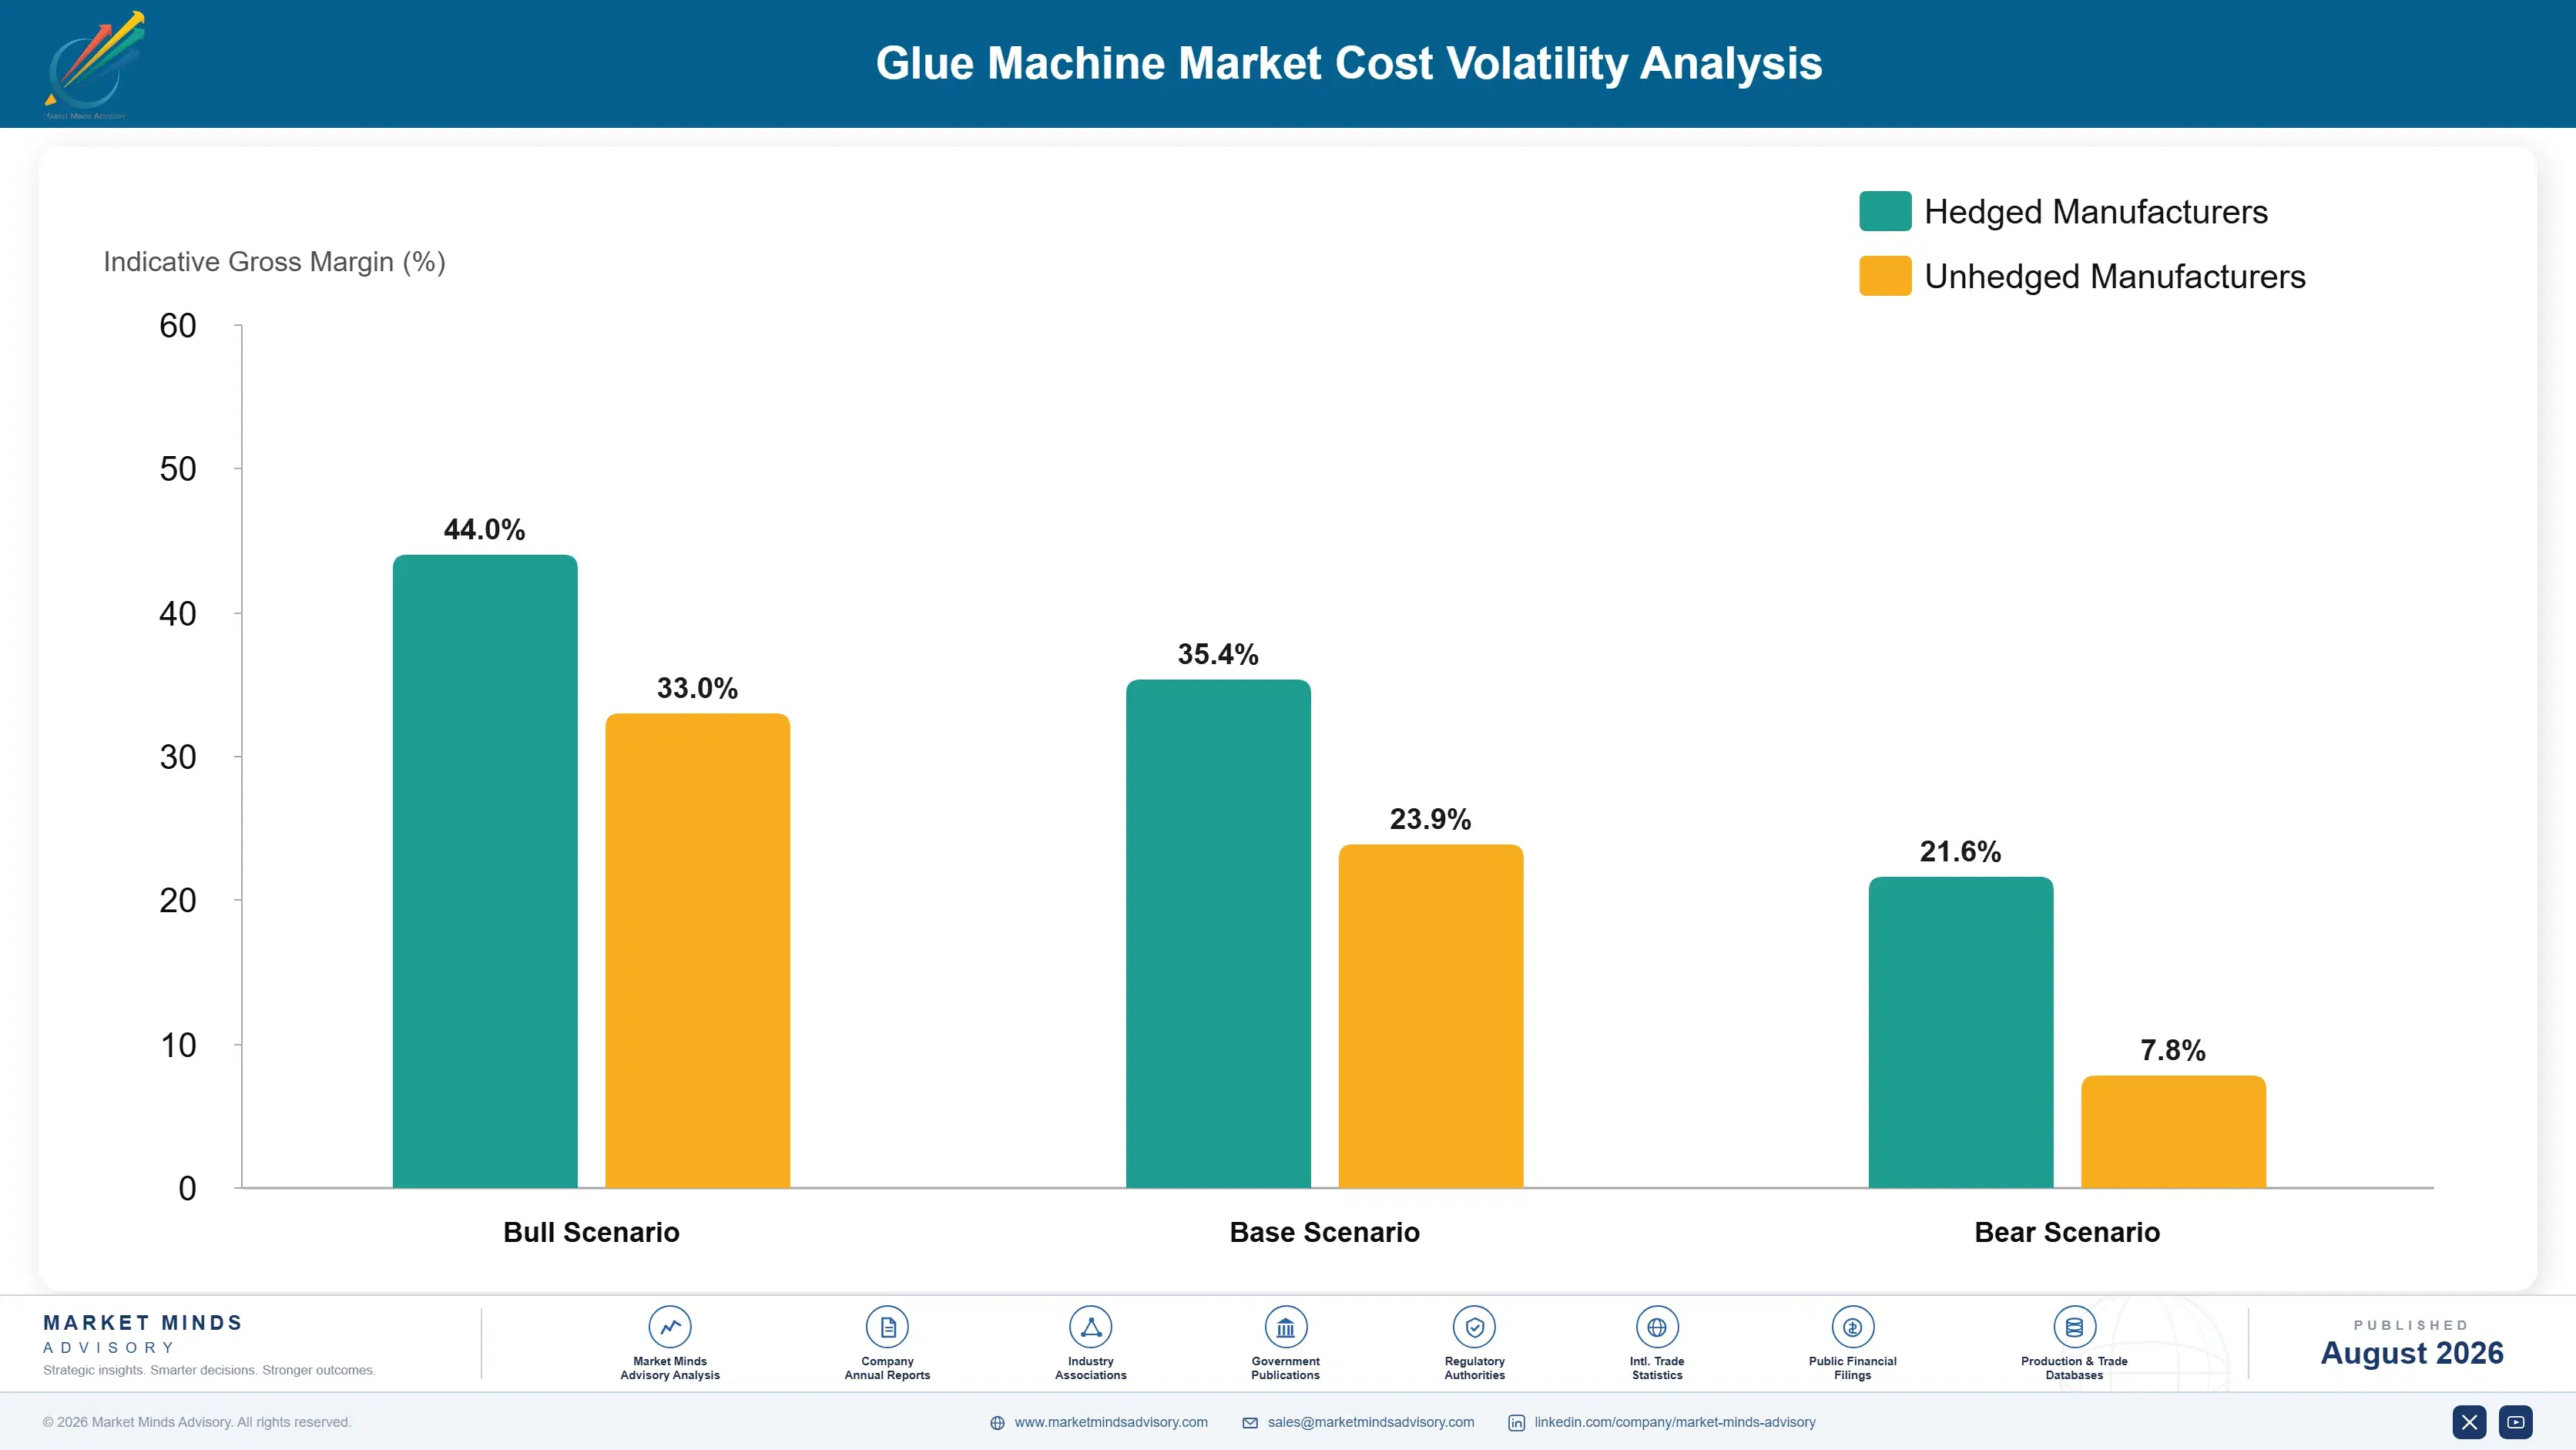
Machined components, heaters, pumps and control electronics account for roughly 46% of cost of goods, sourced from industrial supply chains across Europe, North America and East Asia. Precision-machined dispensing modules and nozzles carry disproportionate cost relative to their size, since tolerances determine pattern quality. Assembly labour and testing run around 18%, with application engineering and service capability funded largely outside cost of goods entirely.
Semiconductor and control component availability disrupted equipment build schedules through 2021 and 2022, extending lead times across the industry and pushing customers toward retrofit and repair rather than replacement. Company annual reports covering industrial dispensing segments disclose the resulting order backlog and margin effects. Industrial energy costs documented in International Energy Agency reporting simultaneously raised the operating cost case that now drives melt-on-demand conversion demand.

The competitive disadvantage falls on suppliers without service depth. Equipment cost differences between suppliers are modest, but a sophisticated melt-on-demand or reactive system without local engineering support is genuinely a worse purchase than a simpler machine. Suppliers with thin service networks are therefore pushed toward the commodity tank melter tier, where margins are lowest and unauthorised aftermarket copies bite hardest.
glue-machine-market-cost-volatility-analysis-1787307250969

Dual-source control electronics and long-lead components

Control components caused most of the 2021 and 2022 build disruption, and qualifying a second source costs one engineering cycle against months of extended lead time later. Suppliers that had done so shipped through the shortage while competitors quoted delivery dates a year out. Standardising control architecture across product families reduces the number of distinct components requiring dual qualification.

Fund service network density from aftermarket revenue

Application engineering and field service are the competitive assets in this market, and the aftermarket at 44% of revenue is what pays for them. Treating parts margin as the funding mechanism for engineering coverage rather than as a profit centre in isolation is what allows a supplier to sell sophisticated systems in geographies competitors cannot support.

Design wear parts for platform-specific interfaces

Unauthorised copies target mechanically simple parts whose patents have expired. Newer modules designed around platform-specific mounting, sensing or control interfaces cannot be copied without replicating the platform itself. This protects aftermarket revenue by design rather than by enforcement, which is the only approach that works reliably in markets where enforcement is weak. Design protects better than litigation.

Portfolio Architecture for Margin Defence

The portfolio separates on engineering content rather than on end market. Conventional tank melters are mechanically simple, widely copied and sold largely on price into applications where any equipment works. Melt-on-demand and precision systems require control sophistication and application engineering support. Reactive dispensing requires process engineering that most packaging-focused suppliers have never needed to build at all. Engineering content draws the whole ladder.
The tension is that the commodity tier carries the installed base, and the installed base carries the aftermarket that funds everything else. A supplier that abandons tank melters to chase sophisticated systems gives up the parts revenue paying for its application engineers. Successful suppliers run the simple tier for installed population and treat the aftermarket, not the machine, as the actual product. The machine is a means to a parts relationship rather than the product itself.

High-value pools sit where a process requirement rather than a purchasing preference sets the specification. Reactive dispensing for structural joints, precision jetting for electronics and high-speed nonwoven applicators all qualify, and each is chosen by an engineer who will be held responsible if the joint fails. Purchasing preference never enters those decisions at all.

Volume / Commodity-Adjacent Tier

Conventional hot melt tank melters, standard applicators and cold glue systems for case sealing, carton closing and general converting. Mechanically simple, widely available and sold largely on delivered price into applications where almost any equipment performs adequately.
Gross Margin: 26-36%

Premium / Certified Tier

Melt-on-demand systems, high-speed nonwoven applicators and precision jetting equipment requiring control sophistication and application engineering support. Sold on measured adhesive and energy savings rather than on capital price comparison against alternatives.
Gross Margin: 42-54%

Sustainability / Regulatory / Next-Generation Tier

Two-component reactive dispensing for structural and battery assembly, plus integrated robotic dispensing cells. The wide margin range reflects sharply differing system complexity and the long qualification cycles that safety-critical joints require of every supplier.
Gross Margin: 46-68%
glue-machine-market-portfolio-architecture-1787307251461

High-value Sub-segments and Strategic Watch-out

Melt-on-Demand Conversion Systems

Compounding at 9.3% on energy savings near 48% and elimination of char-driven line stoppages entirely. Conversions run ahead of mechanical end of life, which is unusual for capital equipment and lets suppliers target their own installed base systematically by tariff and utilisation. Waiting for failure concedes it.
Gross Margin: 44-54%

Two-Component Structural Dispensing

Growing at 8.1% as vehicle programmes replace welds with adhesive joints in mixed-material bodies and battery modules. Safety-critical qualification keeps the supplier field narrow, and a position on a vehicle platform lasts that platform's entire production life. Ratio control and pot life management are a different discipline entirely.
Gross Margin: 50-68%

Conventional Tank Melter Applicators

The volume core at 4.6%, mechanically simple and exposed to price competition and unauthorised parts copies alike. Run to hold installed population and the aftermarket stream that funds application engineering, rather than for the equipment margin itself. Abandoning it costs the parts stream that funds application engineering coverage everywhere else.
Gross Margin: 26-36%

Aftermarket Wear Parts and Modules

The watch-out. At 44% of supplier revenue this stream funds the entire service model, and unauthorised copies attack it directly wherever patents have expired. Service bundling and platform-specific interfaces are the only defences that have worked consistently. Enforcement alone has never worked anywhere in this industry.
Gross Margin: 48-66%

Why Platforms Outlive Machines

The recurring economics here are unusually clean. An applicator installed today consumes wear parts, modules and service for a decade or more, and 78% of sites standardise on a single platform across the plant so those purchases concentrate with one supplier. Aftermarket revenue at 44% of the industry total is not a service afterthought; it is the reason the equipment business is worth being in at all. Platform standardisation concentrates all of it.
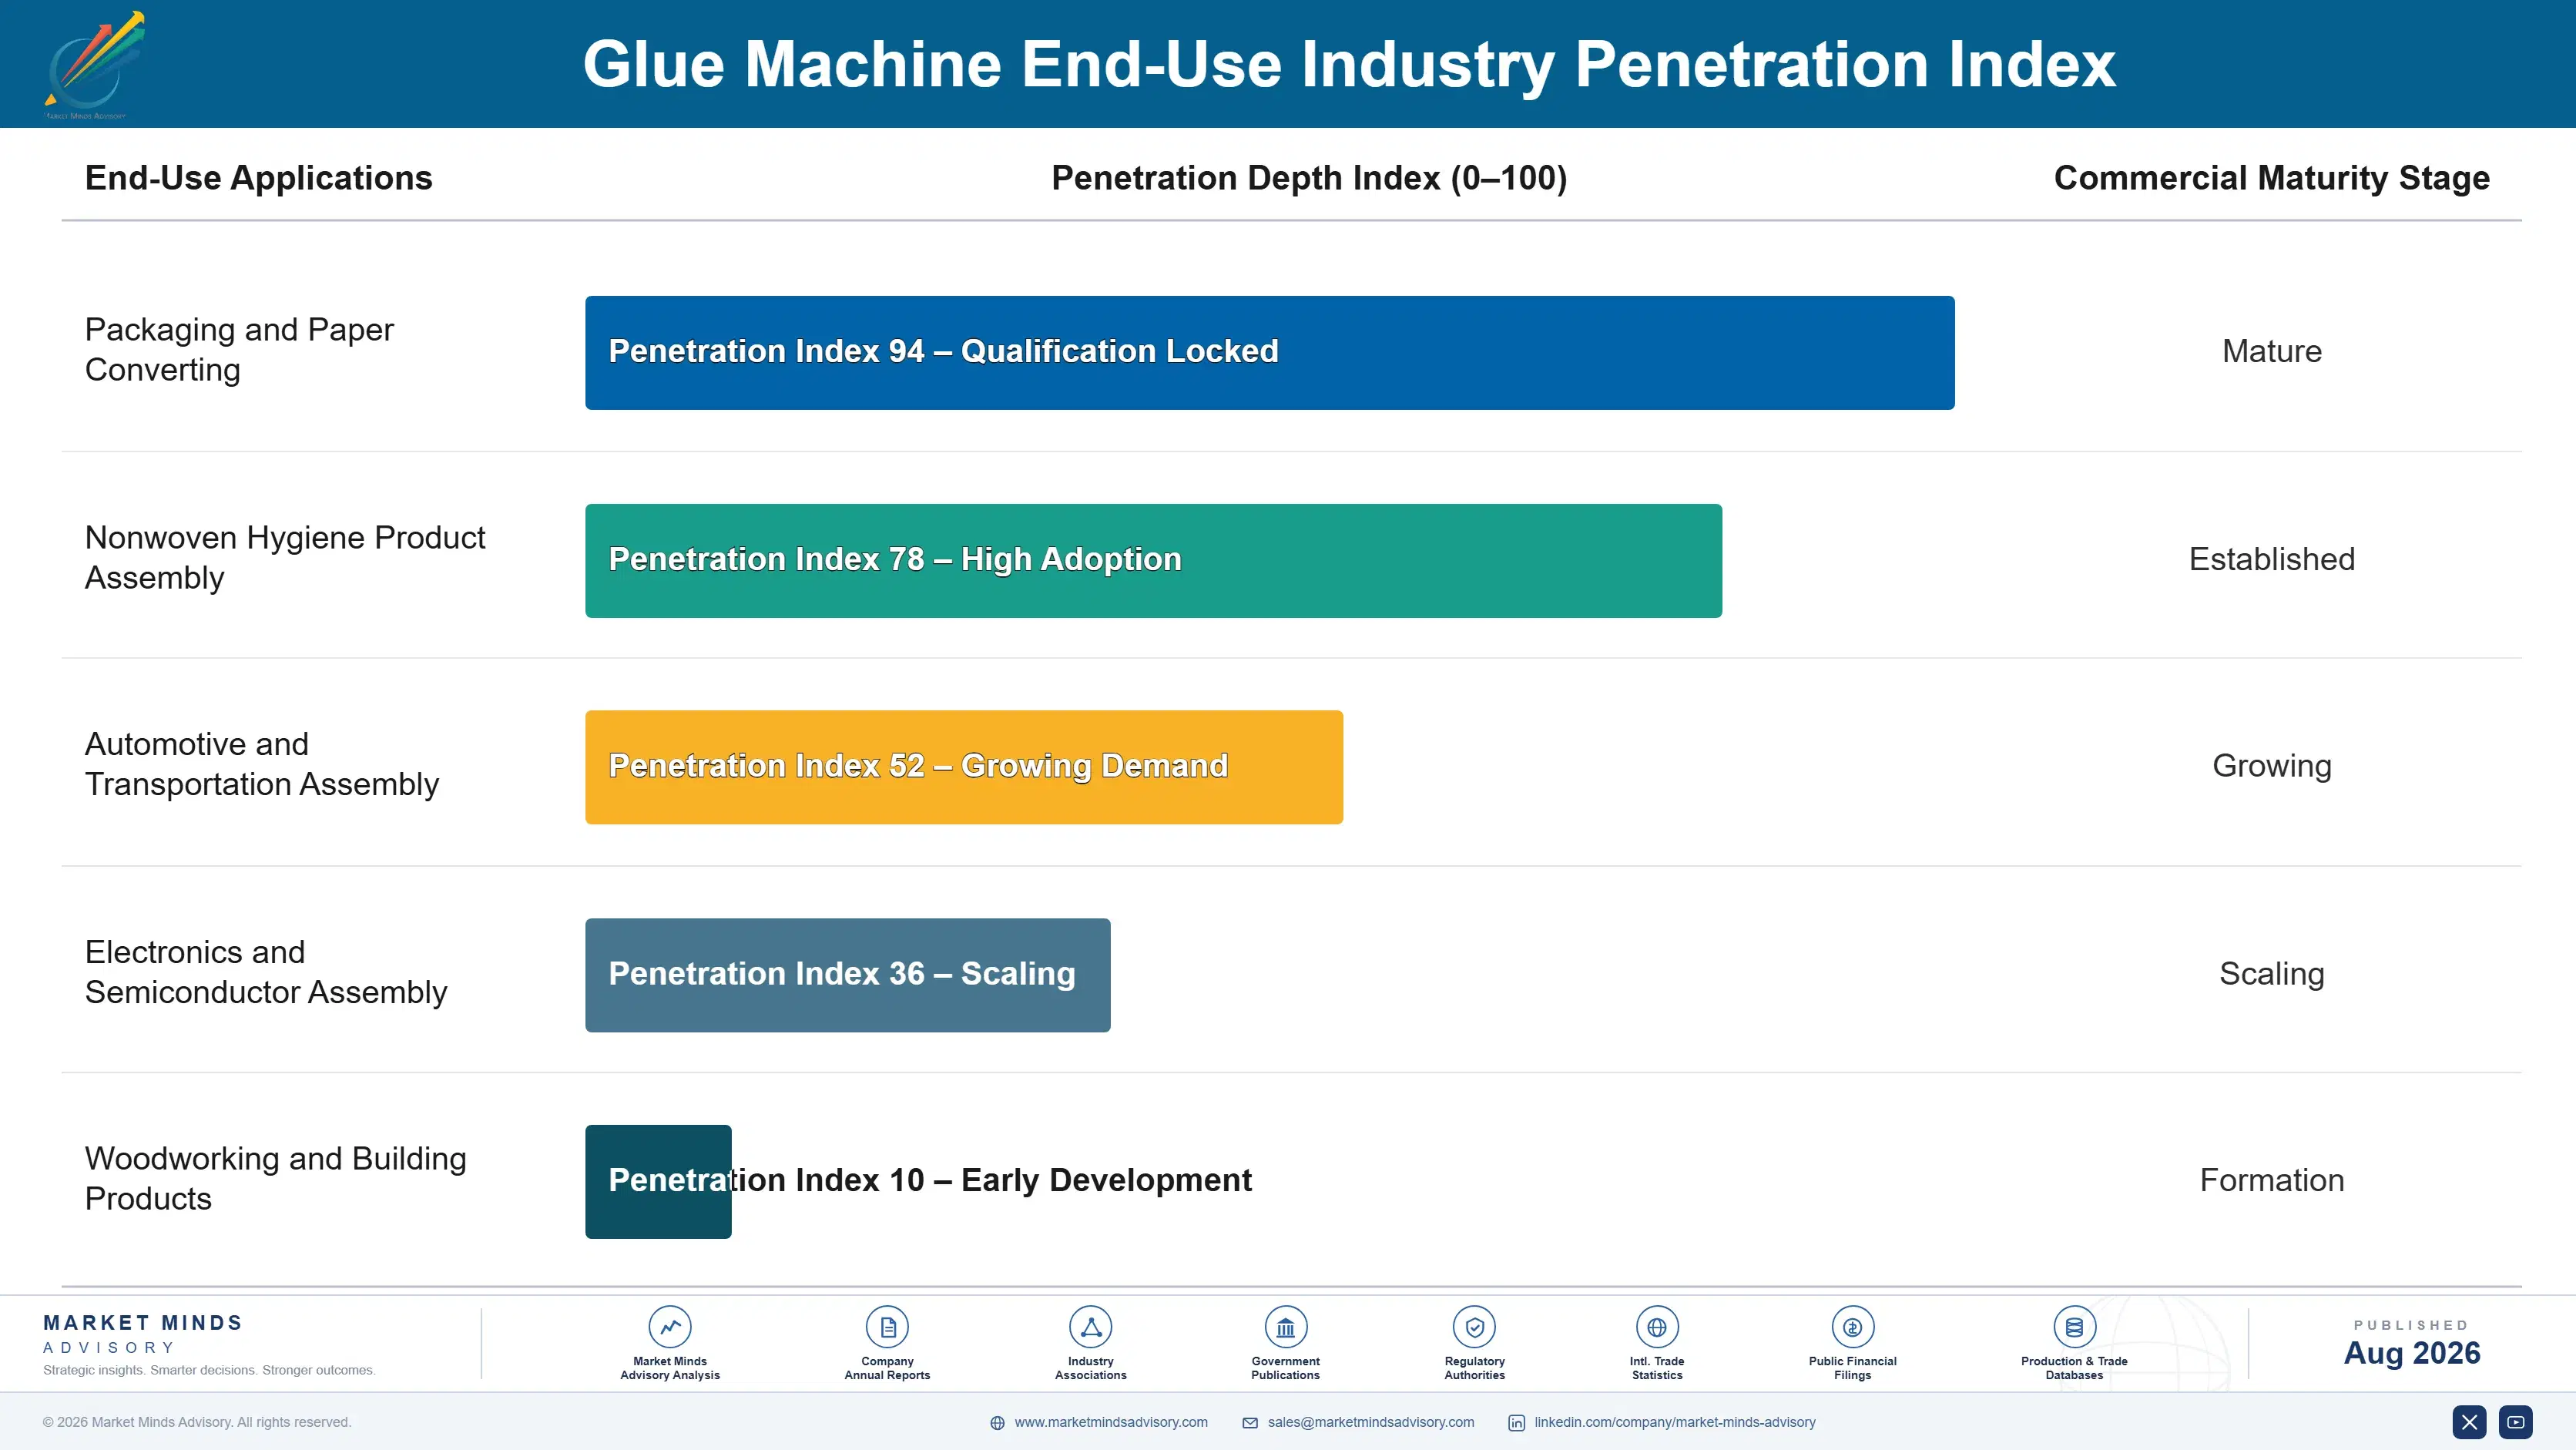
Adoption depth varies sharply by application. Nonwoven hygiene converters buy deepest, running applicators at line speeds where pattern precision determines product quality directly. Vehicle assembly buys deeply on long qualification cycles for structural joints. Packaging converters buy adequately and switch on price where the application is undemanding. Woodworking and general assembly sit shallowest, frequently running equipment well past any sensible economic life. Application demand rather than company size sets the depth.

The specifying population has changed. Applicator selection used to sit with maintenance engineering choosing something familiar and repairable. Increasingly it sits with operations leadership evaluating adhesive consumption and energy cost, and that participant responds to a measured study rather than to a machine specification. That is a completely different sales conversation.
glue-machine-market-end-use-penetration-index-1787307251960

Where Applicator Suppliers Win

These are among the four positions where our research anticipates prominent divergence between winners and laggards over the coming forecast period. Each is grounded in the demand model, the regulatory perimeter, and the announced capacity pipeline.
01 / CONSUMPTION STUDY SELLING

Sell the adhesive savings and the machine sells itself

Adhesive consumed across an applicator's working life costs roughly 6.4 times the equipment itself, so even a few percentage points of consumption reduction pays for a replacement machine outright. Suppliers arriving with measured studies from the customer's own line move approval off the capital budget onto an operating cost line, where a nineteen month payback clears easily. Competitors quoting equipment specifications end up competing on price alone for a machine that the customer never particularly wanted to buy in the first place.
02 / AFTERMARKET REVENUE DEFENCE

The parts stream is the business, and copies are attacking it

Wear parts and consumables generate 44% of all supplier revenue, and they fund the application engineering coverage that makes equipment sales possible in the first place. Unauthorised copies undercut original parts heavily, and their underperformance appears as gradual adhesive waste rather than as any visible defect that a purchasing manager would ever notice. Bundling those parts into service agreements carrying pattern consistency and uptime guarantees defeats the comparison entirely, because the customer is then purchasing an outcome instead of a component.
03 / INSTALLED BASE CONVERSION

Target your own eleven-year-old equipment before someone else does

Melt-on-demand systems cut energy consumption roughly 48% and remove char-driven line stoppages altogether, which gives a payback near nineteen months on equipment that still works perfectly well today. A median installed age of eleven years means the conversion opportunity is enormous and still largely unaddressed right across the industry. Suppliers that map their own installed base by equipment age, local energy tariff and line utilisation can pursue conversions systematically rather than waiting for a competitor to make the argument first.
04 / STRUCTURAL JOINT QUALIFICATION

Reactive dispensing rewards process engineering packaging suppliers lack

Two-component structural bonding compounds at 8.1% as vehicle programmes replace welds and mechanical fasteners with adhesive joints across mixed-material bodies and battery modules. Ratio control, mixing at the nozzle and pot life management together form a genuinely different engineering discipline from conventional hot melt dispensing. Qualification cycles run long because a structural joint failure is a safety matter rather than a quality one, and that difficulty keeps the supplier field narrow while securing positions lasting a platform's entire production life.

Engagement Snapshot From the Field

A live engagement with an industry participant carrying material or product regulatory and market exposure ahead of a defining policy shift, showing how our research translates into a defensible multi-year portfolio strategy.
MARKET MINDS ADVISORY · CLIENT ENGAGEMENT SUMMARY
Glue Machine Producer Strategic Portfolio Review and Transition Roadmap 2026·Investment Scenario on Glue Machine Exposure Evaluation 2025-26
CLIENT PROFILE
A hygiene products manufacturer operating twenty-three converting lines across nine plants in Europe, Asia and Latin America, with roughly USD 1.4 billion in revenue (client-reported, unverified by MMA). Adhesive spend ran near USD 62 million annually (client-reported, unverified by MMA), against an installed applicator base whose median age exceeded twelve years and which had been purchased plant by plant with no group standard.
STRATEGIC CHALLENGE
Adhesive cost had risen sharply and engineering proposed a group tender to consolidate polymer purchasing. A smaller group within operations argued that consumption per unit varied by more than 30% between plants running identical products, and that the variation pointed at application equipment rather than at the price paid for adhesive itself.
MMA APPROACH
MMA measured adhesive consumption per finished unit across all twenty-three lines, normalised for product specification and line speed, then correlated the variation against applicator generation, melter type and maintenance regime. Equipment supplier service coverage was mapped against each plant location, and conversion economics were modelled using local energy tariffs rather than a group average.
KEY FINDINGS
  1. Consumption per unit varied 34% between the best and worst performing lines running identical product specifications, and applicator generation explained most of that spread rather than adhesive grade or operator practice.
  2. Six lines ran conventional tank melters at plants with high energy tariffs, where melt-on-demand conversion showed payback under fourteen months on energy savings alone before any adhesive reduction was counted.
  3. Two Asian plants had accumulated a majority of unauthorised wear parts through local purchasing, and those lines showed the poorest pattern consistency and highest adhesive consumption in the entire group.
  4. No plant had a service agreement covering pattern verification, so applicator performance degraded gradually between breakdowns with nobody measuring the consumption consequence.
CLIENT PROFILE
A hygiene products manufacturer operating twenty-three converting lines across nine plants in Europe, Asia and Latin America, with roughly USD 1.4 billion in revenue (client-reported, unverified by MMA). Adhesive spend ran near USD 62 million annually (client-reported, unverified by MMA), against an installed applicator base whose median age exceeded twelve years and which had been purchased plant by plant with no group standard.
STRATEGIC CHALLENGE
Adhesive cost had risen sharply and engineering proposed a group tender to consolidate polymer purchasing. A smaller group within operations argued that consumption per unit varied by more than 30% between plants running identical products, and that the variation pointed at application equipment rather than at the price paid for adhesive itself.
MMA APPROACH
MMA measured adhesive consumption per finished unit across all twenty-three lines, normalised for product specification and line speed, then correlated the variation against applicator generation, melter type and maintenance regime. Equipment supplier service coverage was mapped against each plant location, and conversion economics were modelled using local energy tariffs rather than a group average.
KEY FINDINGS
  1. Consumption per unit varied 34% between the best and worst performing lines running identical product specifications, and applicator generation explained most of that spread rather than adhesive grade or operator practice.
  2. Six lines ran conventional tank melters at plants with high energy tariffs, where melt-on-demand conversion showed payback under fourteen months on energy savings alone before any adhesive reduction was counted.
  3. Two Asian plants had accumulated a majority of unauthorised wear parts through local purchasing, and those lines showed the poorest pattern consistency and highest adhesive consumption in the entire group.
  4. No plant had a service agreement covering pattern verification, so applicator performance degraded gradually between breakdowns with nobody measuring the consumption consequence.
RECOMMENDED STRATEGY
Phase 1: Phase 1 (months 1 to 6): Convert the six high-tariff tank melter lines to melt-on-demand and restore original wear parts across the two affected Asian plants. Phase 2: Phase 2 (months 6 to 18): Establish a group applicator platform standard and service agreements covering pattern verification at every plant. Phase 3: Phase 3 (months 18 to 30): Renegotiate group adhesive supply from the reduced consumption baseline rather than from historic purchase volumes.
OUTCOME
Adhesive consumption per finished unit fell by roughly 11% across the group within eighteen months (client-reported, unverified by MMA), worth approximately USD 6.8 million annually against equipment spend near USD 4 million. Energy consumption on converted lines fell by close to half, and the adhesive tender was renegotiated from the lower baseline (client-reported, unverified by MMA).

Frequently Asked Questions

Foundational context covering the market sizes, CAGR, scope, country, region and competition that inform every finding below. This section is provided to cover basics and most often pre-purchase conversations, answered from the MMA Primary Research Dataset.

What is the current size of the Glue Machine Market?

The global market was worth USD 3.8 billion in 2025, reaching USD 4.04 billion in 2026. East Asia holds the largest regional share at 30% of demand.

How large will the Glue Machine Market be by 2036?

MMA forecasts USD 7.36 billion by 2036, an expansion multiple of 1.82 times the 2026 base. That represents roughly USD 3.32 billion of incremental value.

What is the CAGR for the Glue Machine Market 2026 to 2036?

The base case compounds at 6.2% annually, with a bull case of 7.4% and a bear case of 5.0%. Historical growth from 2020 to 2025 also ran at 5.0%.

Which segment is growing fastest?

Tank-free melt-on-demand systems compound at 9.3%, exactly 1.50 times the market rate. They cut energy consumption roughly 48% and eliminate the char that blocks nozzles and stops lines.

Who are the major companies in the Glue Machine Market?

Nordson Corporation, Graco, Robatech, Valco Melton and ITW Dynatec hold a combined 52% of the market. Aftermarket parts and service rather than equipment sales underpin those positions.

Which country is growing fastest?

India compounds at 9.2%, ahead of every other national market. Rapidly expanding nonwoven hygiene converting capacity specifies current-generation applicators on every single new line built.

Report Segmentation Architecture

The full report scope spans multiple orthogonal segmentation dimensions, with cross-tabulated demand data provided for each dimension pair. Coverage extends further to regional breakdowns, trend trajectories, and the competitive detail needed to support segment-level decision-making.

By Dispensing System Type

  • Hot Melt Tank Melters and Applicators
  • Tank-Free Melt-on-Demand Systems
  • Cold Glue and Water-Based Dispensing Systems
  • Two-Component and Reactive Adhesive Dispensing
  • Precision Micro-Dispensing and Jetting Systems
  • Integrated Robotic Dispensing Cells

By End-Use Industry

  • Packaging and Paper Converting
  • Nonwoven Hygiene Product Assembly
  • Automotive and Transportation Assembly
  • Electronics and Semiconductor Assembly
  • Woodworking and Building Products

By Commercial Dimension

  • Direct Sales to End Users
  • Original Equipment Supply to Machine Builders
  • Distributor and Integrator Channel
  • Aftermarket Parts and Service Agreements

By Region

  • North America
  • Western Europe
  • East Asia
  • South Asia and Pacific
  • Latin America
  • Middle East and Africa
  • Eastern Europe

Scope, Methodology, and Coverage

Every figure in this report is reproducible from documented input assumptions. The scope below maps the historical period, the forecast horizon, the segmentation dimensions, and the countries covered, alongside the underlying primary and qualitative methodology.
Historical Period
2020 to 2025
Forecast Period
2026 to 2036
Base Year
2025 (USD billions; MMA Primary Research Dataset, August 2026)
Market Definition
The market covers equipment that meters, heats and applies industrial adhesives in manufacturing and converting operations, spanning hot melt tank melters and applicators, tank-free melt-on-demand systems, cold and water-based dispensing, two-component reactive dispensing, precision jetting systems and integrated robotic dispensing cells, together with the associated aftermarket in wear parts, modules and service. Adhesive formulations, sealants and the host production machinery into which dispensing equipment integrates are excluded. Sizing is measured at supplier revenue in current prices.
Quantitative Units
USD billions (current prices); installed applicator units and adhesive consumption per finished unit where applicable
Segmentation Dimensions
By Dispensing System Type; By End-Use Industry; By Commercial Dimension; By Region
Regions Covered
North America, Western Europe, East Asia, South Asia and Pacific, Latin America, Middle East and Africa, Eastern Europe
Countries Covered
USA, China, Germany, France, UK, Japan, South Korea, India, Australia, Canada, Brazil, Mexico, Indonesia, Vietnam, Thailand, Malaysia, UAE, Saudi Arabia, South Africa, Nigeria, Turkey, Poland, Netherlands, Italy, Spain, Sweden, Switzerland, Argentina, Colombia, Singapore, and additional markets relevant to this sector
Key Companies Profiled
Nordson Corporation, Graco, Robatech, Valco Melton, ITW Dynatec, Baumer hhs, Focke Meler, Hardo Maschinenbau, Buhnen, Sulzer, Atlas Copco, Durr Systems, Musashi Engineering, ViscoTec, Vermes Microdispensing, Fisnar, Dymax, Sames, Preo, Glue Machinery Corporation
Quantitative Methodology
Primary survey, n=3,800 respondents, Q4 2025, six countries; demand-side model with trade association cross-validation
Qualitative Methodology
47 expert interviews, Q4 2025; applied to validate demand model assumptions, identify emerging dynamics, and assess competitive positioning
Report Format
PDF and XLSX data workbook (Word format preview document)
Publisher
Market Minds Advisory
Report Code
MMA-2026-CON-647
Published
August 2026
Contact
sales@marketmindsadvisory.com | www.marketmindsadvisory.com

Purchase the full Glue Machine Market Report (2026 to 2036).

The full report sizes industrial adhesive dispensing equipment across six system types, three commercial dimensions and seven regions, with annual forecasts to 2036 under base, bull and bear scenarios. Melt-on-demand conversion economics are modelled by regional energy tariff and line utilisation, identifying where installed tank melters are already uneconomic to keep running. Aftermarket revenue is separated from original equipment across the supplier set, with unauthorised parts penetration estimated by region. Reactive dispensing qualification requirements for structural and battery assembly are set out in engineering detail. Twenty suppliers are profiled on a consistent equipment and aftermarket revenue basis.
Melt-on-demand conversion economics modelled by regional energy tariff
Aftermarket revenue separated from original equipment by supplier
Unauthorised wear parts penetration estimated across seven regions
Adhesive consumption benchmarks by application and applicator generation
Reactive dispensing qualification requirements for structural joints
Installed base age profile mapped by industry and region

Built For The People Who Decide

From boardroom strategy to bench-side execution, this report is read cover-to-cover by leaders shaping the next decade of their industry, turning demand scenarios, market dynamics and valuation benchmarks into decisions.
CXOs/ Presidents/ VPs/ Managers
M&A and Corporate Development
Strategy Teams and R&D Heads
Procurement and Product Directors
Regulatory and Compliance Leaders
Investor Relations and Equity Analysts