Market Minds Advisory
Wireless Power Transmission Market

Wireless Power Transmission Market: Wireless Power Transmission: Distance Physics, Cable Tolerance and the Applications That Genuinely Need It

Efficiency falls sharply with distance and with misalignment, so the durable applications are the ones where a cable was genuinely intolerable rather than merely inconvenient for somebody to plug in.

Lead Analyst

Published

September 2026

Make Smarter Decisions with Customized Research Insights

Request a free sample report and evaluate market opportunities, growth trends, and competitive dynamics relevant to your business needs.

2025 MARKET VALUE$8.6BMarket Size 2025
2036 FORECAST VALUE$28.2BBase Case , 2026 to 2036
CAGR 2026 TO 203611.4 %Bull 12.6% / Bear 10.2%
INCREMENTAL OPPORTUNITY$18.6BNet 10- year value creation
EXPANSION MULTIPLE2.94x2036 value over 2026 base
Strategic Levers
M&A Pipeline
Regional Outlook
Country Rankings
Competitive Intelligence
Segmental Deep-dive
Call-Us : 91 93563 13602

Executive Snapshot and Market Trajectory.

Around 81% of units ship into phones, earbuds and wearables, where the transfer distance is a few millimetres and the physics is manageable. Everything that promises power at any longer range remains a demonstration or a genuine niche, and that has been true for fifteen years now.
The applications that grow are those where a cable was actually intolerable rather than inconvenient. Automated fleet and robotic charging grows at 17.1%, half again the market rate of 11.4%, because nobody is present to plug anything in. Medical implant powering follows at 14.8% for the same reason. East Asia takes 46% of value because that is where consumer devices are built. Industrial sensing at 13.4% rests on the same argument entirely.
Concentration sits at roughly 38% across the top five on measured component and system revenue, dominated by semiconductor suppliers serving the consumer market. The persistent obstacle is efficiency: transfer loses around 11% against a wired connection, and alignment tolerance near 8 millimetres means the loss rises quickly whenever anything moves. Regulators set radiated emission limits that constrain far-field designs further, which keeps most long-range work confined to demonstrations.
Market Definition
This market covers systems and components transferring electrical power without a conductive connection, spanning consumer device inductive charging, automated fleet and robotic charging, medical implant and wearable power, industrial sensor and battery-free powering, passenger vehicle wireless charging, and long-range beamed power systems. Revenue is measured as transmitter and receiver component, module and system value at supplier level. Conventional wired charging equipment, batteries and energy storage, data-only wireless communication, and grid transmission and distribution infrastructure are excluded.
Base Year Value
$8.6B in 2025 (MMA Primary Research Dataset, September 2026)
Forecast Period
2026 to 2036, eleven discrete annual values
CAGR
11.4% base case. Bull 12.6%. Bear 10.2%.
Fastest Growth Segment
Automated Fleet and Robotic Charging: 17.1% CAGR
Fastest Growth Country
India: 15.2% CAGR
Fastest Growth Region
South Asia and Pacific: 13.4% CAGR
Largest Region
East Asia: 46% of 2025 global value
Market Leaders
Renesas, Texas Instruments, NXP Semiconductors, STMicroelectronics and WiTricity lead on measured wireless power component and system revenue. Source: MMA Primary Research Dataset, July 2026.
Primary Survey
n=3,800 procurement and R&D decision-makers, Q4 2025, six countries
Methodology
Demand-side build-up, cross-validated against public data, 47 expert interviews

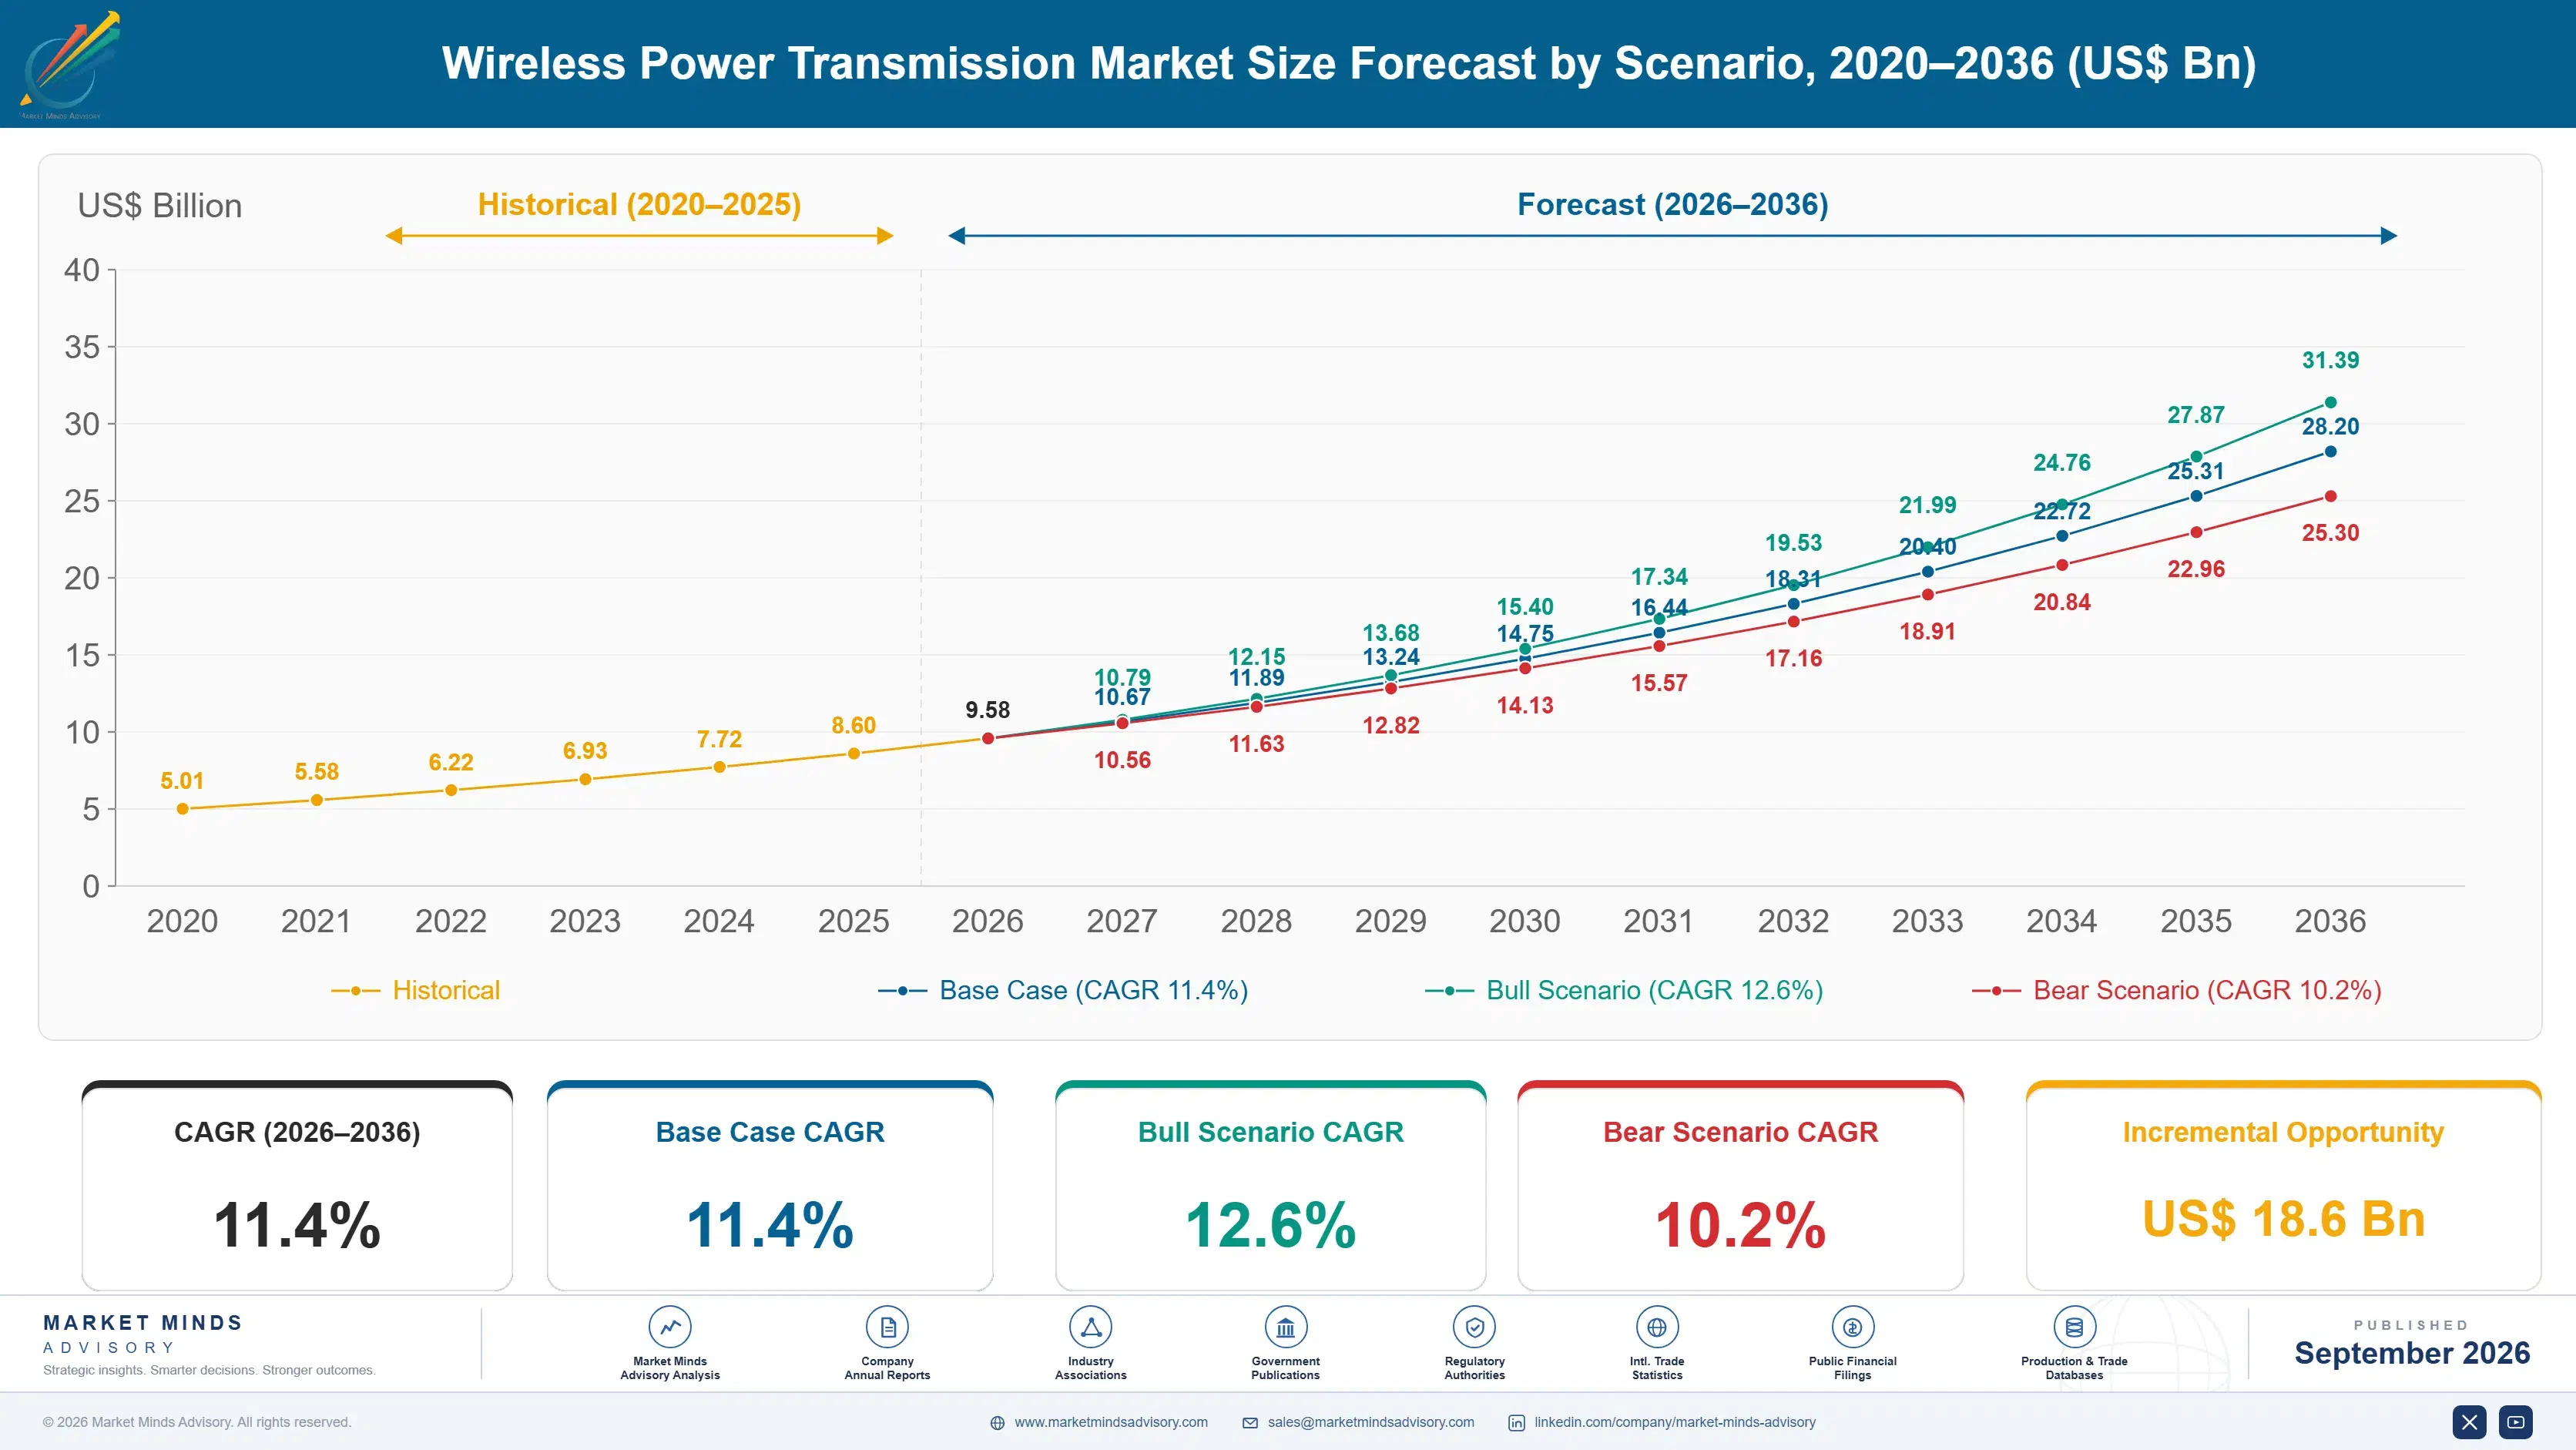
Wireless Power Transmission Market Forecast Scenarios

global-wireless-power-transmission-market-size-forecast-scenario-1788425287567
Growth ran at 10.4% from 2020 to 2025 and almost all of it came from consumer devices adding receiver coils as a standard feature rather than an option. Earbuds and wearables extended the installed base considerably, since a sealed device with no port needs an alternative. Vehicle charging attracted continued investment and produced very little deployment throughout the period, a pattern repeated elsewhere too.
The base case at 11.4% rests on three mechanisms, none of which involves consumers wanting fewer cables. Automated fleets and robots have no operator available to connect anything, which makes charging without intervention an operating requirement rather than a convenience. Implanted and body-worn medical devices cannot practically use a connector at all. Third, battery-free industrial sensing removes the replacement labour that has always limited large sensor deployments, at power levels measured in milliwatts.
The bull case at 12.6% assumes automated logistics and robotics deployment proceeds at announced rates, since each machine needs charging that nobody is present to perform. The bear case at 10.2% is that consumer receiver attachment saturates, which it is close to doing in premium devices, leaving growth dependent on industrial applications that are real and considerably smaller than the consumer base.

Distance Is Still the Whole Problem

Coupling efficiency falls with the square of separation and degrades further with misalignment, which is not a manufacturing problem anybody will solve. That single fact explains why this market looks the way it does. Around 81% of units go into phones, earbuds and wearables where the gap is a few millimetres, and everything promising power across a room has spent a decade demonstrating rather than shipping.
TOP FIVE CONCENTRATION38%Moderately concentrated among semiconductor suppliers serving consumer devices
CONSUMER SHARE OF VOLUME81%Units shipping into phones, earbuds and wearable devices
TRANSFER EFFICIENCY LOSS11%Energy lost against an equivalent conventional wired connection
ALIGNMENT TOLERANCE8 millimetresLateral offset before efficiency degrades unacceptably in practice
FLEET CHARGING PAYBACK3.1 yearsPeriod before automated charging recovers its installed cost
AVERAGE RECEIVER COSTUSD 1.20Component cost added to a consumer device for reception
The applications that stick share a characteristic worth stating plainly: the cable was not merely annoying, it was impossible or unsafe. An implanted device cannot have a connector through the skin. A sealed sensor in a rotating machine cannot be reached. An autonomous robot has nobody to plug it in. In each case wireless power is not a convenience improvement, and buyers accept the 11% efficiency loss because there is no alternative to compare it against.
Passenger vehicle charging is the clearest example of the opposite. The pad adds cost, loses energy, requires alignment within about 8 millimetres for reasonable efficiency, and solves a problem drivers do not appear to have, since they demonstrably will plug in a cable. Fleet applications with no driver present work commercially and pay back in around 3.1 years.
"The honest test is whether somebody was going to be standing there anyway. If a human is present, they will plug in the cable and the wireless option loses on cost and efficiency. If nobody is present, or nobody can reach it, wireless power has no competition at all."
Director, Power Electronics and Energy Systems Practice · MMA Energy Practice · September 2026

Market Trends

Automation Removes the Person Who Would Plug It In

Warehouse robots, automated guided vehicles, inspection drones and fixed-route buses all operate without anybody available to connect a charger, which turns wireless charging from a convenience into an operating requirement. Opportunity charging at stops or dwell points removes the need for large batteries as well, since a vehicle topping up frequently carries less energy and less weight. Fleet applications grow at 17.1%, faster than anything else here, and pay back in around 3.1 years on labour and battery savings together rather than on any energy argument. Deployment tracks automation programmes rather than any wireless power roadmap.
Market Impact: Adds USD 1.20 per device
Battery-Free Sensing Removes the Replacement Problem

Large industrial sensor deployments are limited by battery replacement labour rather than by hardware cost, because sending a technician to a hundred sensors annually costs more than the sensors did. Far-field radio frequency power at milliwatt levels removes that entirely for low-duty-cycle sensing, and the power required is small enough that distance becomes workable. Adoption concentrates where sensors are physically difficult to reach, inside machinery, within sealed structures or across large asset populations. It is a maintenance economics argument rather than a power one. Deployment scales with asset population rather than with sensing sophistication anywhere.
Market Impact: Segment grows at 14.8% yearly

Market Opportunities and Growth Drivers

Sealed Consumer Devices Have Nowhere to Put a Connector

Earbuds, hearing aids, smartwatches and increasingly other wearables are built without ports because sealing against water and dust matters more than charging convenience, which leaves inductive transfer as the only option rather than a preferred one. Receiver content costs around USD 1.20 and is now standard rather than optional in most premium devices. That has driven 81% of unit volume into consumer applications. Attachment is approaching saturation in premium products, though mid-range adoption continues to expand the base. Volume therefore tracks device shipments over which component suppliers have no influence at all, which makes forecasting straightforward and pricing weak.
Market Impact: Loses 11% against wired charging

Medical Implants Cannot Use a Percutaneous Connection

A wire passing through skin creates an infection route that no clinical team accepts for a permanent device, which makes transcutaneous power transfer the only workable approach for implanted pumps, stimulators and monitoring systems. Power levels are modest and distances are short, so efficiency is manageable. Regulatory approval binds the specific coil geometry and power profile to the device, which takes years and then protects the supplier position for the product life. Medical implant power grows at 14.8% on device pipelines rather than on any technology development. Thermal limits rather than efficiency set the design ceiling.
Market Impact: Consumed 10 years of investment

Market Restraints and Challenges

Efficiency Loss Is Physics Rather Than Engineering

Transfer loses around 11% against a wired connection at short range and considerably more as separation and misalignment increase, with practical tolerance near 8 millimetres before degradation becomes unacceptable. The root cause is electromagnetic coupling behaviour that improved component design refines rather than overcomes. Commercially this means wireless power costs energy in every application, and buyers accept it only where the alternative is impossible. Suppliers mitigate through better coil geometry, adaptive tuning and positioning aids, none of which changes the underlying relationship. Buyers who model this properly reach the same conclusion every time.
Market Impact: Fastest segment at 17.1% growth

People Will Simply Plug In the Cable

Passenger vehicle charging, laptop charging and similar applications compete against a person who is already present and entirely willing to connect a plug, which is cheaper, faster and more efficient. The root cause is that convenience improvements have to exceed a very low effort baseline. Commercially this has consumed substantial investment in vehicle charging for very little deployment. Suppliers mitigate by concentrating on unattended applications, and those that continued pursuing attended ones have generally spent a decade proving the point. The applications that work were never competing against a willing person.
Market Impact: Removes annual visits to 100 sensors
3 additional market trends, 4 additional growth drivers, and 2 additional restraints and challenges are covered in the full report. Contact sales@marketmindsadvisory.com to access the complete intelligence.

Segment CAGR and Growth Architecture

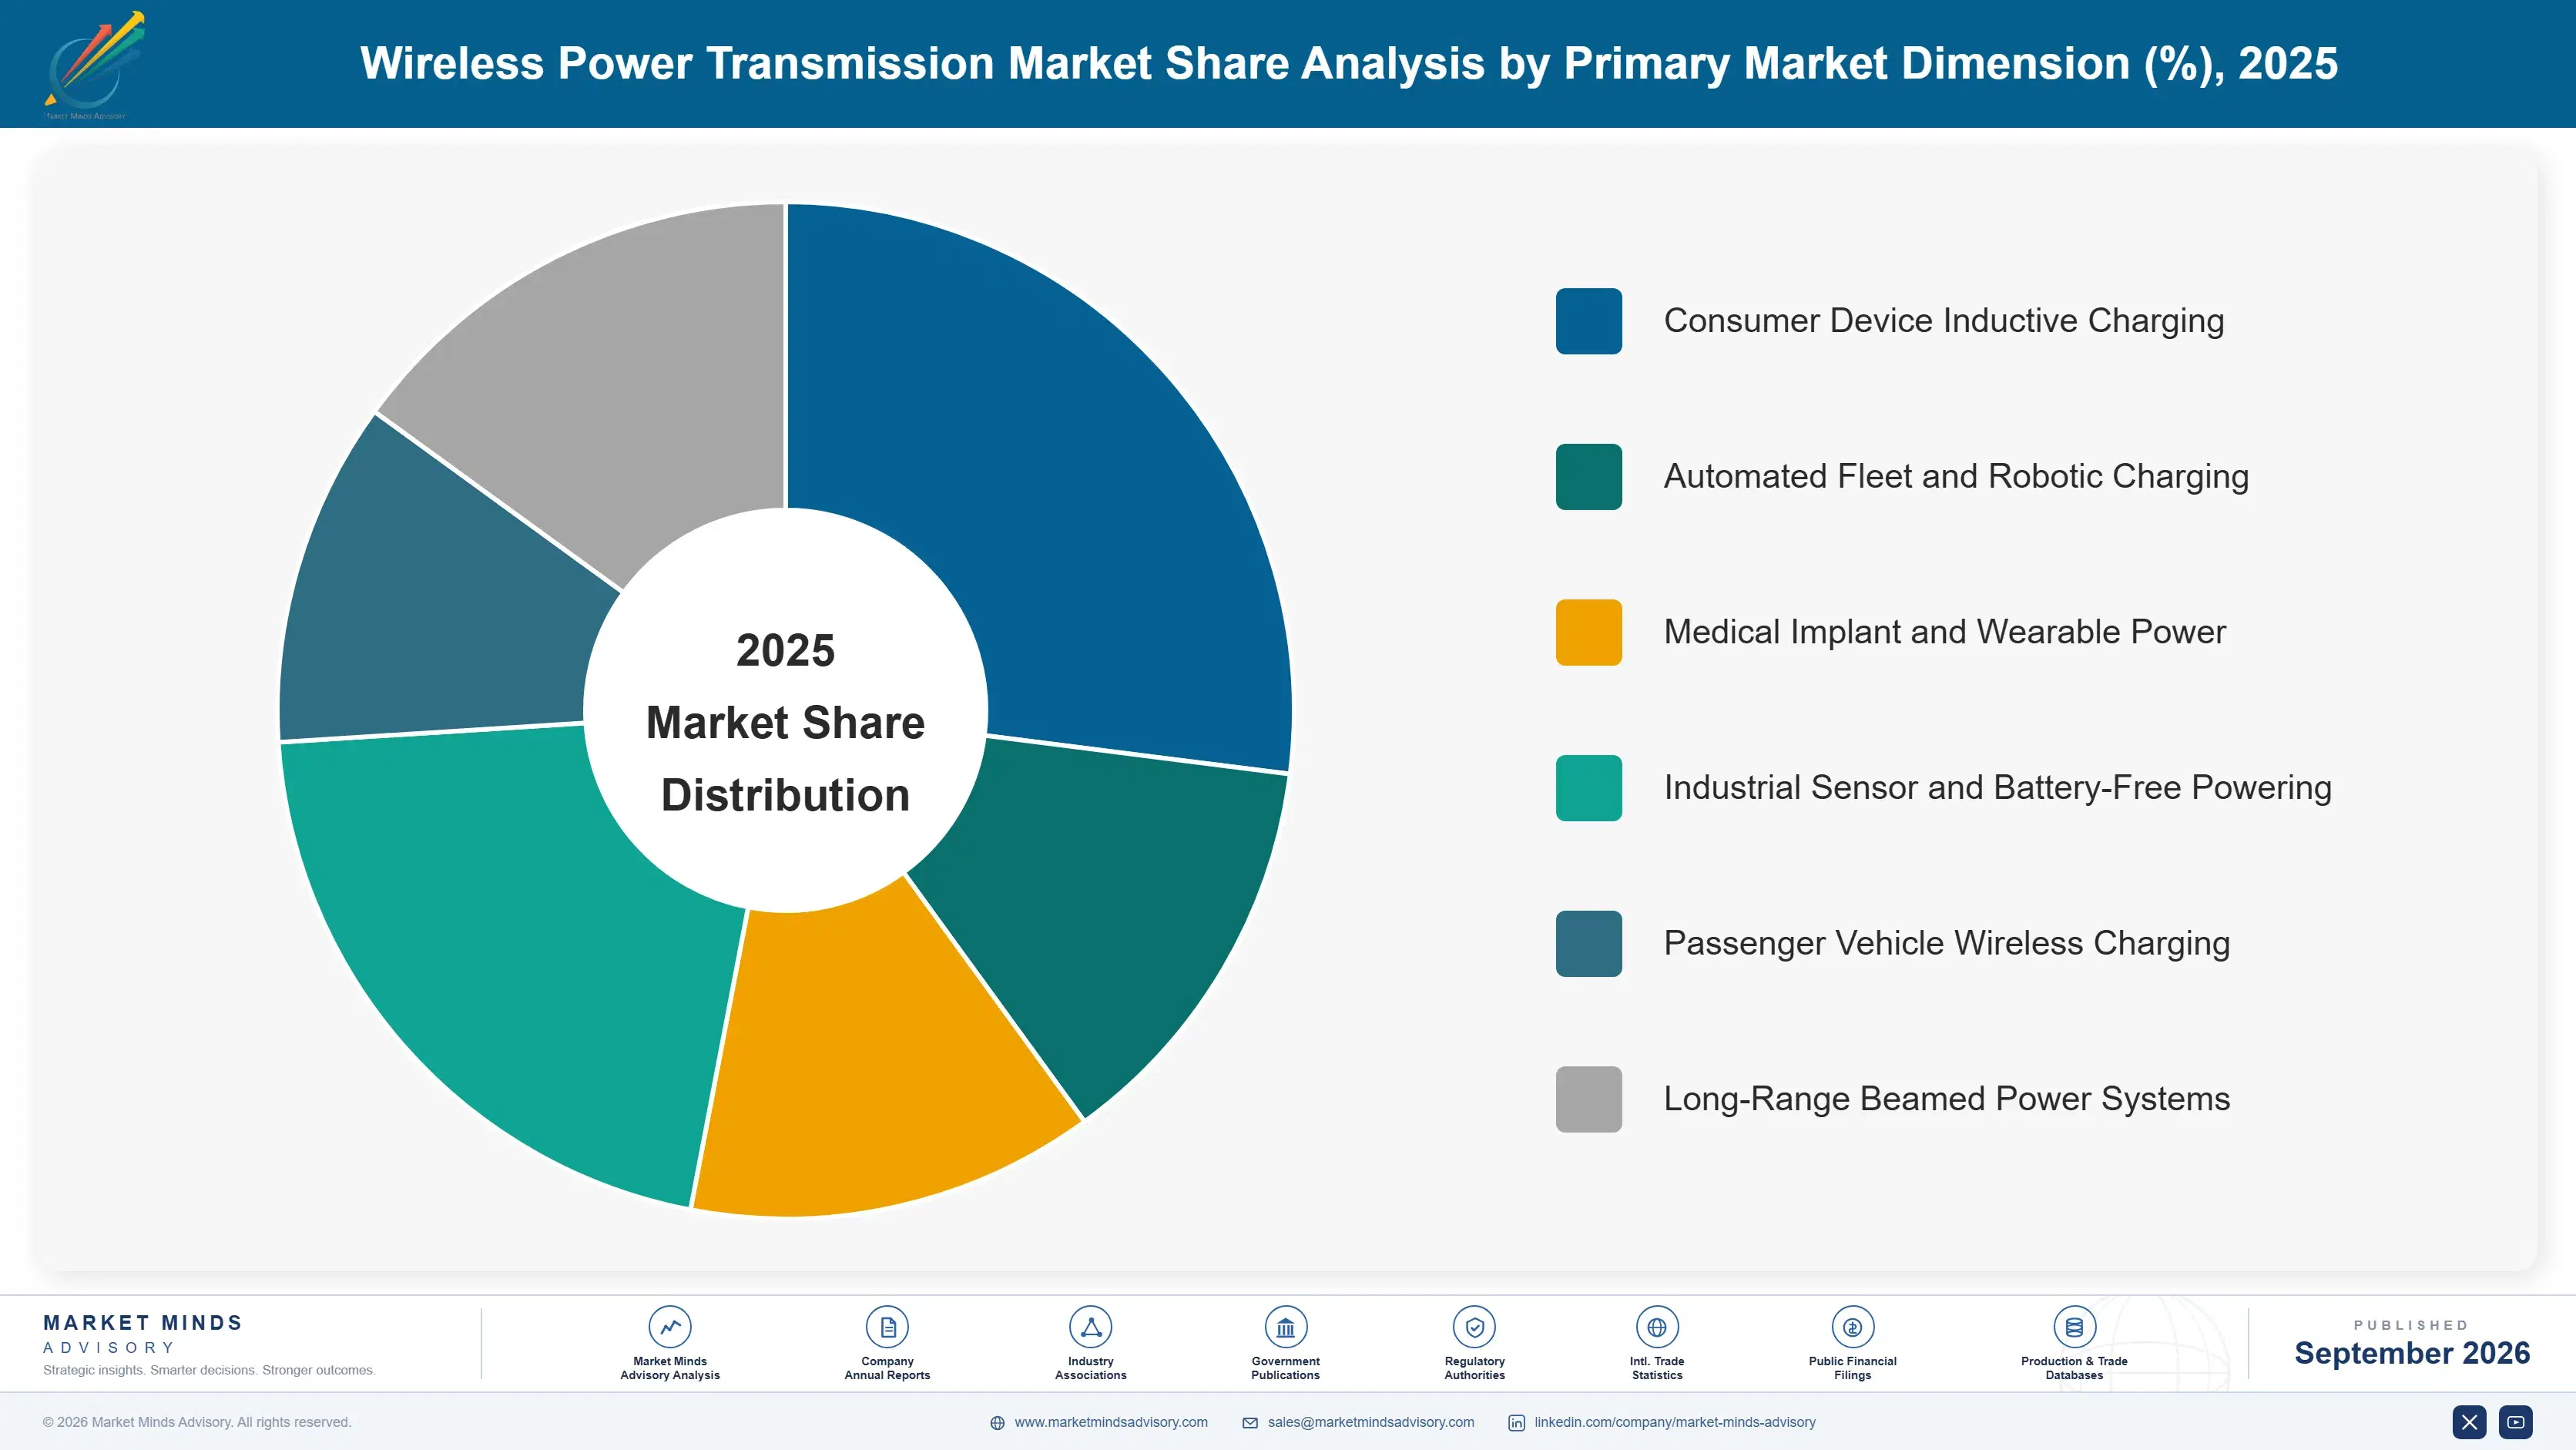
Segmentation follows the application context, because that determines whether a cable was an option at all. Where somebody is present and able to connect one, wireless power competes on convenience and loses on cost and efficiency; where nobody is present or nothing can be reached, it has no competition whatever and the economics look entirely different.
global-wireless-power-transmission-market-market-share-analysis-1788425288107

Automated Fleet and Robotic Charging

Automated charging is the fastest part of this market at 17.1%, half again the market rate of 11.4%, and it succeeds because there is no operator available to connect anything. Warehouse robots, automated guided vehicles and fixed-route buses charge at dwell points without intervention, which removes labour and allows smaller batteries since topping up happens frequently. Payback runs around 3.1 years on battery reduction and utilisation rather than on energy, which the 11% transfer loss rules out entirely. Deployment concentrates where fleets already operate autonomously, and it grows with automation rather than with any interest in wireless power itself. Fleet size rather than site count determines the eventual installed value here, and expansion follows the customer's own automation programme.
CAGR 17.1%

Medical Implant and Wearable Power

Implanted device powering grows at 14.8% because a connector through skin creates an infection route no clinical team will accept, which leaves transcutaneous transfer as the only workable method for pumps, stimulators and monitoring implants. Power levels are modest and separation is small, so efficiency is manageable within the body's constraints. Regulatory approval binds coil geometry, frequency and power profile to the specific device, which takes years to obtain and then protects the supplier for the product's entire life. Demand follows device pipelines rather than anything happening in wireless power technology, and thermal limits rather than efficiency set the design ceiling. Volume is small against consumer applications and pricing bears no relation to it.
CAGR 14.8%
Full segment breakdown across 6 segments available in the complete report.

Regional Architecture and Country Demand Map

Value follows where devices are manufactured rather than where they are used, because most of this market is component content inside products assembled elsewhere. Industrial and medical applications distribute differently but represent a small share of units. Regional growth therefore tracks manufacturing location more closely than end demand.

East Asia

East Asia holds 46%, well above the regional band, because 81% of units go into consumer devices and almost all of those devices are assembled here. Chinese handset, earbud and wearable manufacture absorbs the largest component volumes anywhere, and domestic suppliers have taken substantial share in receiver and transmitter silicon. Korean and Japanese manufacturers hold positions in both device assembly and component supply, with Japanese firms particularly strong in industrial and automotive power transfer. Regional growth at 12.4% runs ahead of the market on continuing device volume and on warehouse automation expanding quickly across the region. Taiwanese and Chinese module assemblers also produce transmitter hardware for charging pads and accessories sold worldwide, which adds value well beyond receiver silicon.
Share: 46% | CAGR: 12.4% (2026 to 2036)

North America

American demand is weighted toward applications rather than device assembly, since consumer manufacturing largely left the region decades ago. Medical implant powering is concentrated here alongside the device industry it serves, and it commands prices no consumer application approaches. Warehouse automation and robotics deployment is extensive and growing, which is where fleet charging demand originates. Defence and space programmes fund long-range beamed power work at specifications no commercial buyer requires. Component specification frequently happens here even where the silicon ships to assembly operations elsewhere entirely. Fleet charging suppliers headquartered here sell into logistics operations that measure payback in labour hours rather than energy, which suits the technology's real economics. Industrial sensing adoption follows asset inaccessibility rather than plant size.
Share: 22% | CAGR: 10.6% (2026 to 2036)
Regional intelligence for 5 additional markets available in the complete report: Western Europe, South Asia and Pacific, Latin America, Middle East and Africa, Eastern Europe. Contact sales@marketmindsadvisory.com.
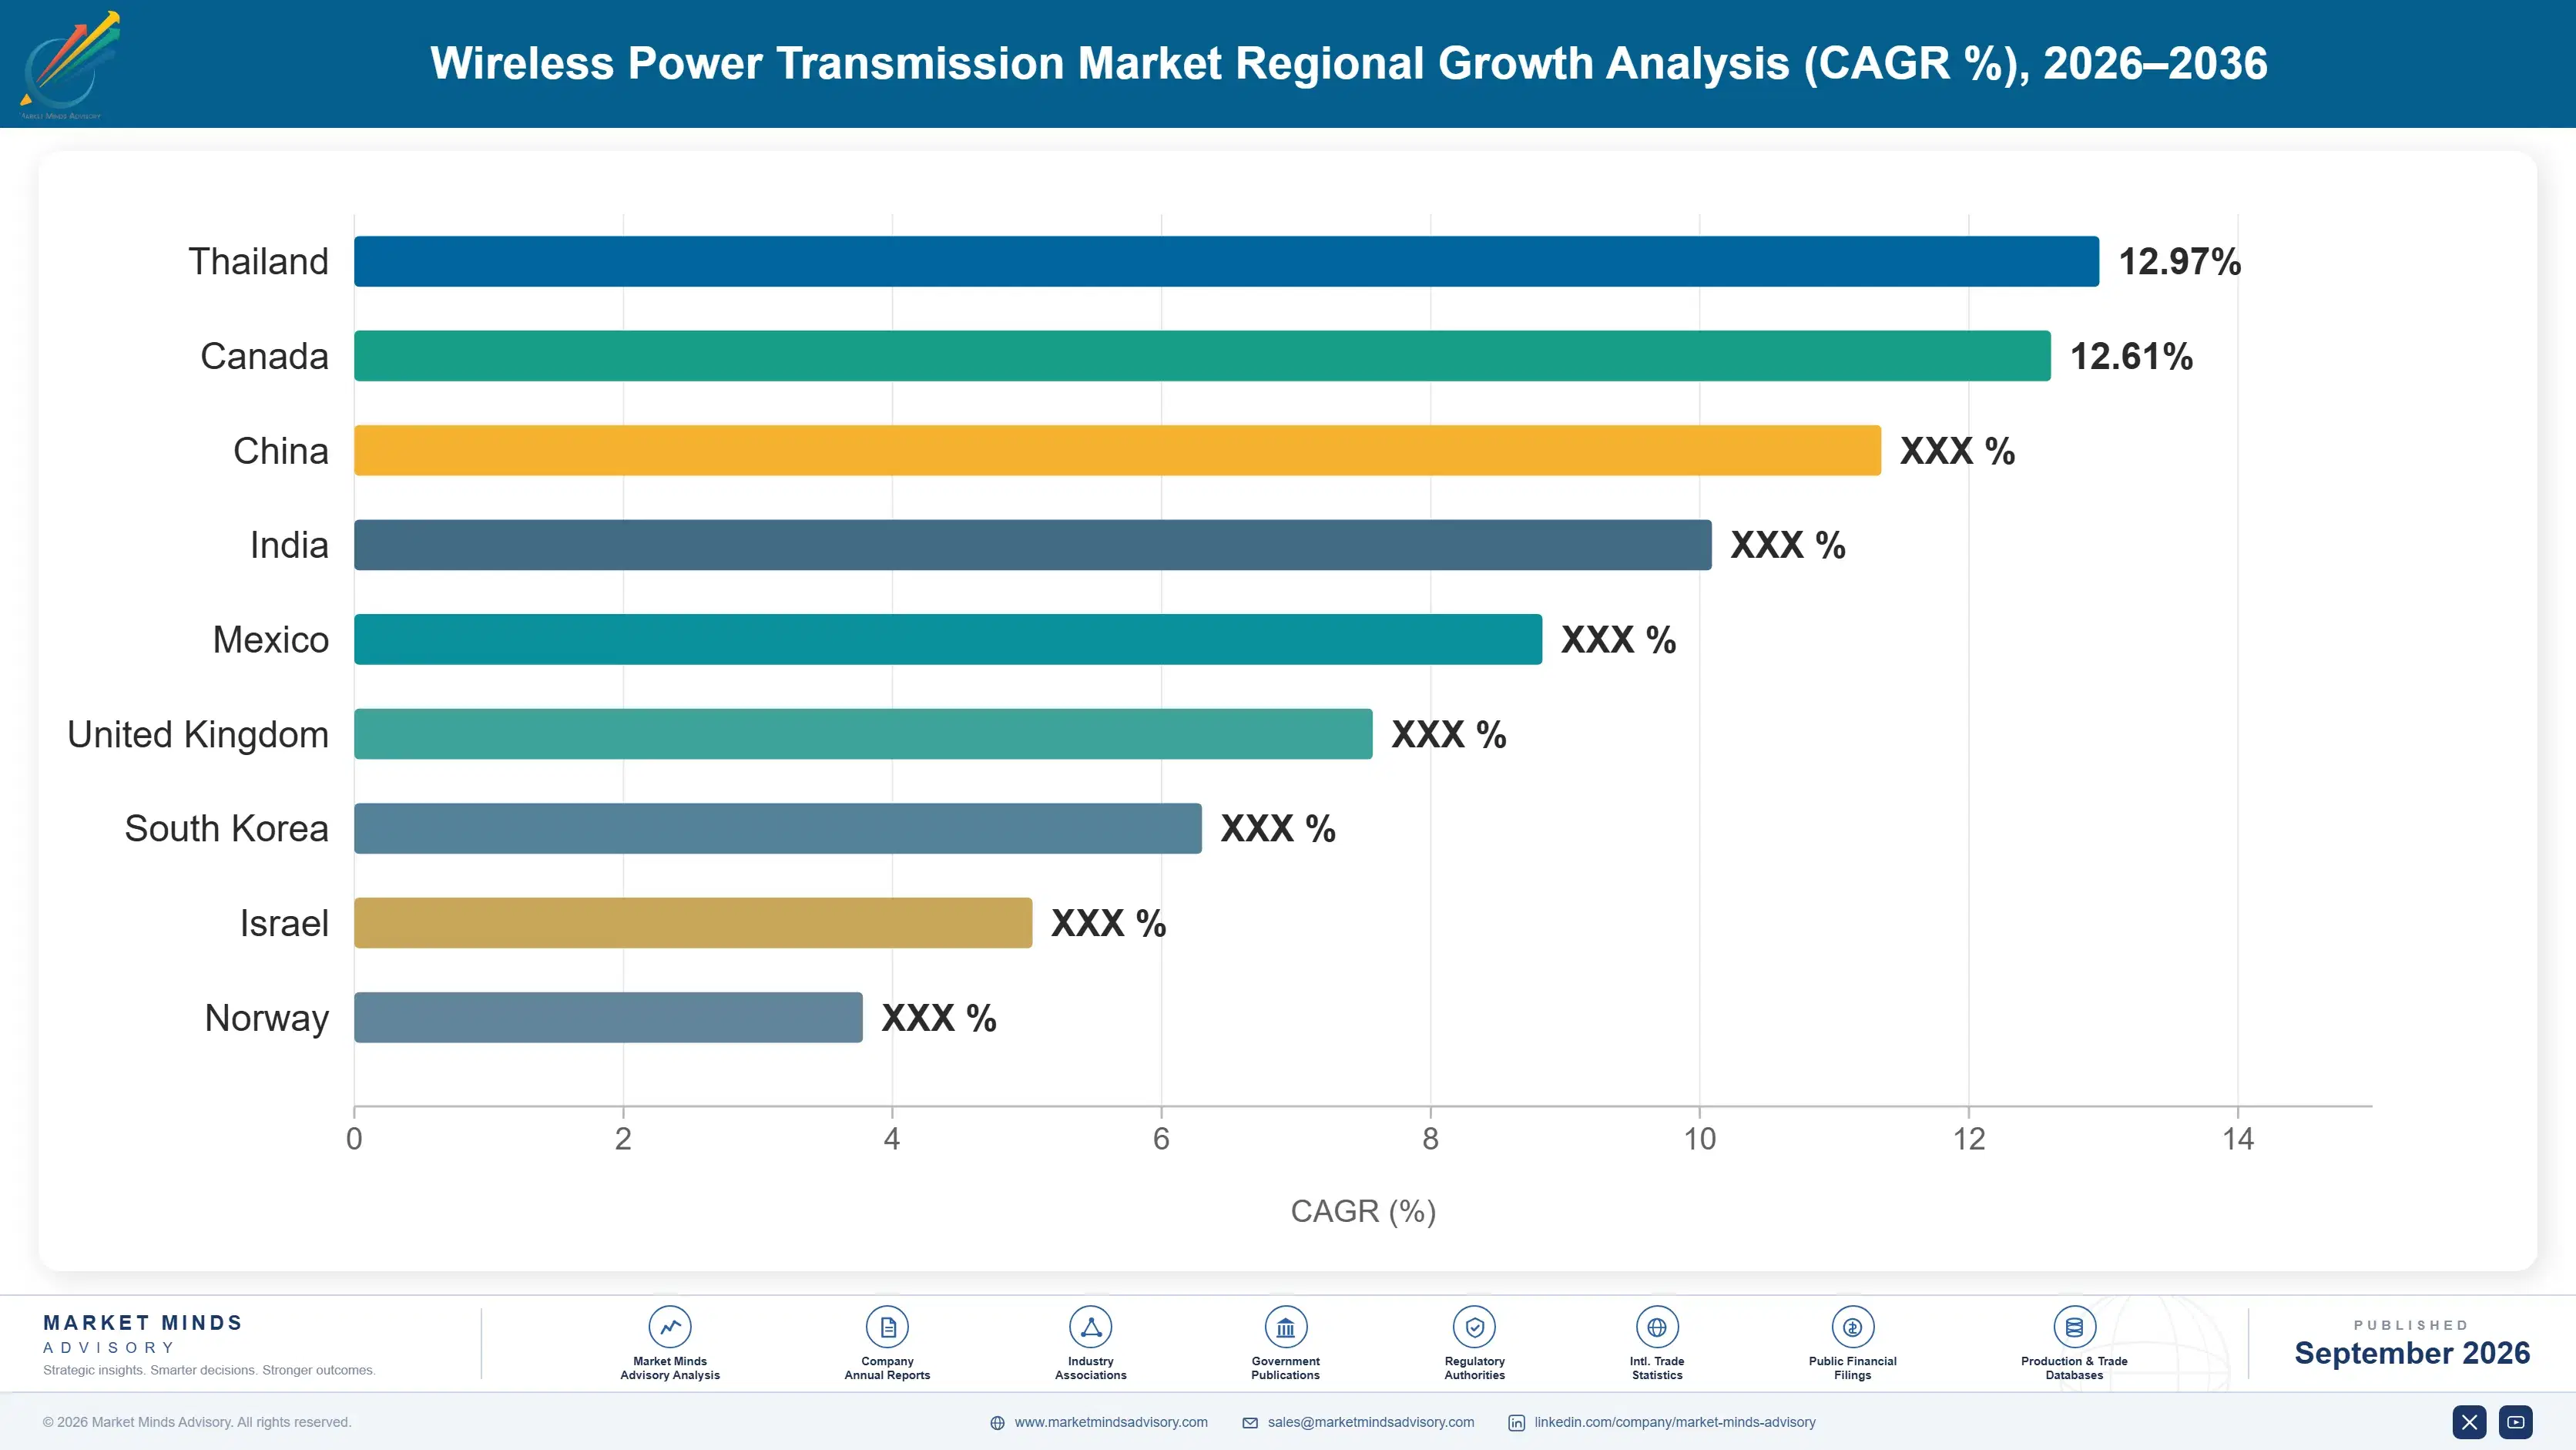
global-wireless-power-transmission-market-country-cagr-analysis-1788425288653

Where Wireless Power Actually Pays

Consumer receiver content is close to saturation in premium devices and costs a little over a dollar, so growth has to come from applications where no cable is possible. Those are smaller, better priced and considerably more durable than the volume business that built this industry. Suppliers built for volume are poorly organised for what comes next.

Target Applications With Nobody There to Connect

Wireless power loses on cost and efficiency wherever a person is present and willing to plug in, and wins absolutely wherever nobody is available or nothing can be reached. Automated fleets, robots, implanted devices and sealed sensors all fall into the second category, and those segments grow at 17.1%, 14.8% and 13.4% respectively. Suppliers concentrating there achieve gross margins around 26 percentage points above consumer component supply. The distinction is commercially decisive and the industry has spent a decade blurring it in its own marketing. That is a positioning decision rather than a technology one.
Market Impact: Holds roughly 26 points more gross margin overall

Sell Battery Reduction Not Energy Savings

Wireless transfer loses around 11% of energy, so any argument resting on efficiency fails immediately with a buyer who checks. Opportunity charging at frequent dwell points lets a fleet vehicle carry a considerably smaller battery, which reduces purchase cost, weight and charging downtime together and recovers installed cost in about 3.1 years. That is a fleet economics case a transport manager can verify. Suppliers leading with energy or convenience arguments are making the one claim their own physics contradicts. Fleet buyers verify these numbers against their own operating data, and the ones who do buy.
Market Impact: Recovers the full installed cost within 3.1 years

Pursue Regulatory Approval as a Position Not a Cost

Medical implant powering binds coil geometry, frequency and thermal profile into a device approval that takes years to obtain and then holds for the product's entire commercial life, typically a decade or more. Suppliers treating approval support as a service rather than an obligation capture positions competitors cannot contest afterwards at any price. It requires clinical and regulatory capability that component suppliers rarely build. Those who did hold the highest margins available anywhere in this market and face almost no competitive pressure. Approval typically runs 3 to 5 years and then protects the position for a decade.
Market Impact: Holds supplier positions across 10 year product lifecycles

Solve Alignment Rather Than Extending Range

Practical tolerance near 8 millimetres is what limits real deployments far more than absolute distance does, because vehicles park imprecisely, robots dock approximately and sealed assets shift over time. Adaptive tuning, coil arrays and mechanical guidance widen usable tolerance considerably without changing the underlying coupling physics at all. Buyers evaluate whether a system works reliably in their actual conditions rather than what it achieves on a bench. Suppliers competing on demonstrated range are answering a question that no deployment engineer has ever asked. Deployment reliability rather than specification sheets converts pilots into orders.
Market Impact: Practical tolerance is currently limited to 8 millimetres

Who Controls the Margin Pool

Concentration sits near 38% across the top five on measured component and system revenue, and the leaders are semiconductor suppliers whose position derives from consumer device silicon rather than from anything specific to wireless power. The gap between them and specialist system companies is one of manufacturing scale and design win access rather than capability, since several smaller firms hold better technology in industrial and vehicle applications and cannot reach the volume that makes component supply profitable.
Competition runs on three dimensions. Design win position in consumer devices is first by volume, decided on cost, thermal behaviour and integration. Second is regulatory and approval support in medical applications, where a position once earned lasts a product generation. Third is deployment engineering in industrial and fleet applications, where alignment tolerance and reliability in actual operating conditions decide whether a pilot converts.

Two pressures are reshaping positions. Consumer receiver attachment is approaching saturation in premium devices, which removes the growth that has carried the largest suppliers. Meanwhile specialist firms in fleet and industrial charging are building deployment capability that semiconductor suppliers do not have. Rankings will move toward participants with industrial and medical positions rather than those dependent on consumer component volume.
global-wireless-power-transmission-market-company-positioning-matrix-1788425289180

Competitive Moat and Risk Dimensions

RENESAS

Moat: Consumer and industrial silicon breadth

Renesas holds broad positions in wireless power silicon spanning consumer, industrial and automotive applications, which spreads exposure across cycles that do not move together. Its integration of power management, microcontroller and transfer capability lets device designers source a complete solution rather than assembling one. Long design win histories with major device manufacturers renew across product generations with limited competitive exposure.
RENESAS

Risk: Consumer attachment saturation

A substantial share of volume depends on consumer receiver content that is approaching saturation in premium devices, which removes the growth that has driven this business for a decade. Industrial and medical applications carry better margins and far smaller volumes, so they cannot replace the revenue directly.
WITRICITY

Moat: Resonant transfer intellectual property

WiTricity holds foundational intellectual property in magnetic resonance transfer that underpins much of the vehicle and industrial charging work across the industry, and it licenses that position rather than competing solely on product. Standards participation gives it influence over how interoperability develops. Its engineering depth in alignment tolerance and larger air gaps addresses the constraint that actually limits real deployments.
WITRICITY

Risk: Vehicle charging deployment dependence

The company's position rests substantially on passenger vehicle wireless charging, which has attracted a decade of investment and produced very little commercial deployment because drivers will connect a cable. Fleet applications work commercially and represent a much smaller market. Licensing revenue also depends on adoption by manufacturers whose commitment to the technology has repeatedly been announced and then quietly deferred.

Players Tracked

Prominent Players

Renesas
Texas Instruments
NXP Semiconductors
STMicroelectronics
WiTricity

Other Key Players

Infineon Technologies
ROHM
Analog Devices
Nuvolta Technologies
Powermat
Energous
Powercast
Wi-Charge
Ossia
InductEV
Electreon
IPT Technology
Daihen
Mojo Mobility
Semtech

Recent Developments

MARCH 2025

Warehouse automation operators expand opportunity charging at dwell points

Logistics operators running automated guided vehicle fleets extended wireless charging at picking and staging positions rather than at dedicated charging stations, allowing continuous operation without scheduled charging downtime. The deployments used existing vehicle platforms with retrofitted receivers rather than new machines. Downtime rather than energy consumption drove the decision.
Signal: Removing charging downtime rather than saving energy is what makes automated fleet charging pay for itself.
AUGUST 2025

Passenger vehicle wireless charging programmes deferred again by manufacturers

Several vehicle manufacturers postponed planned wireless charging options, citing cost, packaging and limited customer demand relative to conventional connectors. The deferrals affected optional equipment rather than any core electric vehicle programme or platform commitment. Suppliers had positioned the option as a convenience feature against a connector nobody objects to.
Signal: A decade of announced vehicle programmes has produced deferrals rather than deployment, and the pattern keeps repeating.
NOVEMBER 2025

Battery-free industrial sensors reach volume deployment on dispersed assets

Industrial operators deployed radio frequency powered sensors across large asset populations where battery replacement labour had previously made monitoring uneconomic. The applications involved low duty cycle measurement at milliwatt power levels rather than continuous high-rate sensing. Battery replacement labour had been the binding constraint rather than sensor cost.
Signal: Maintenance economics rather than power capability is what makes battery-free sensing commercially viable across large asset populations.

What Wireless Power Hardware Costs

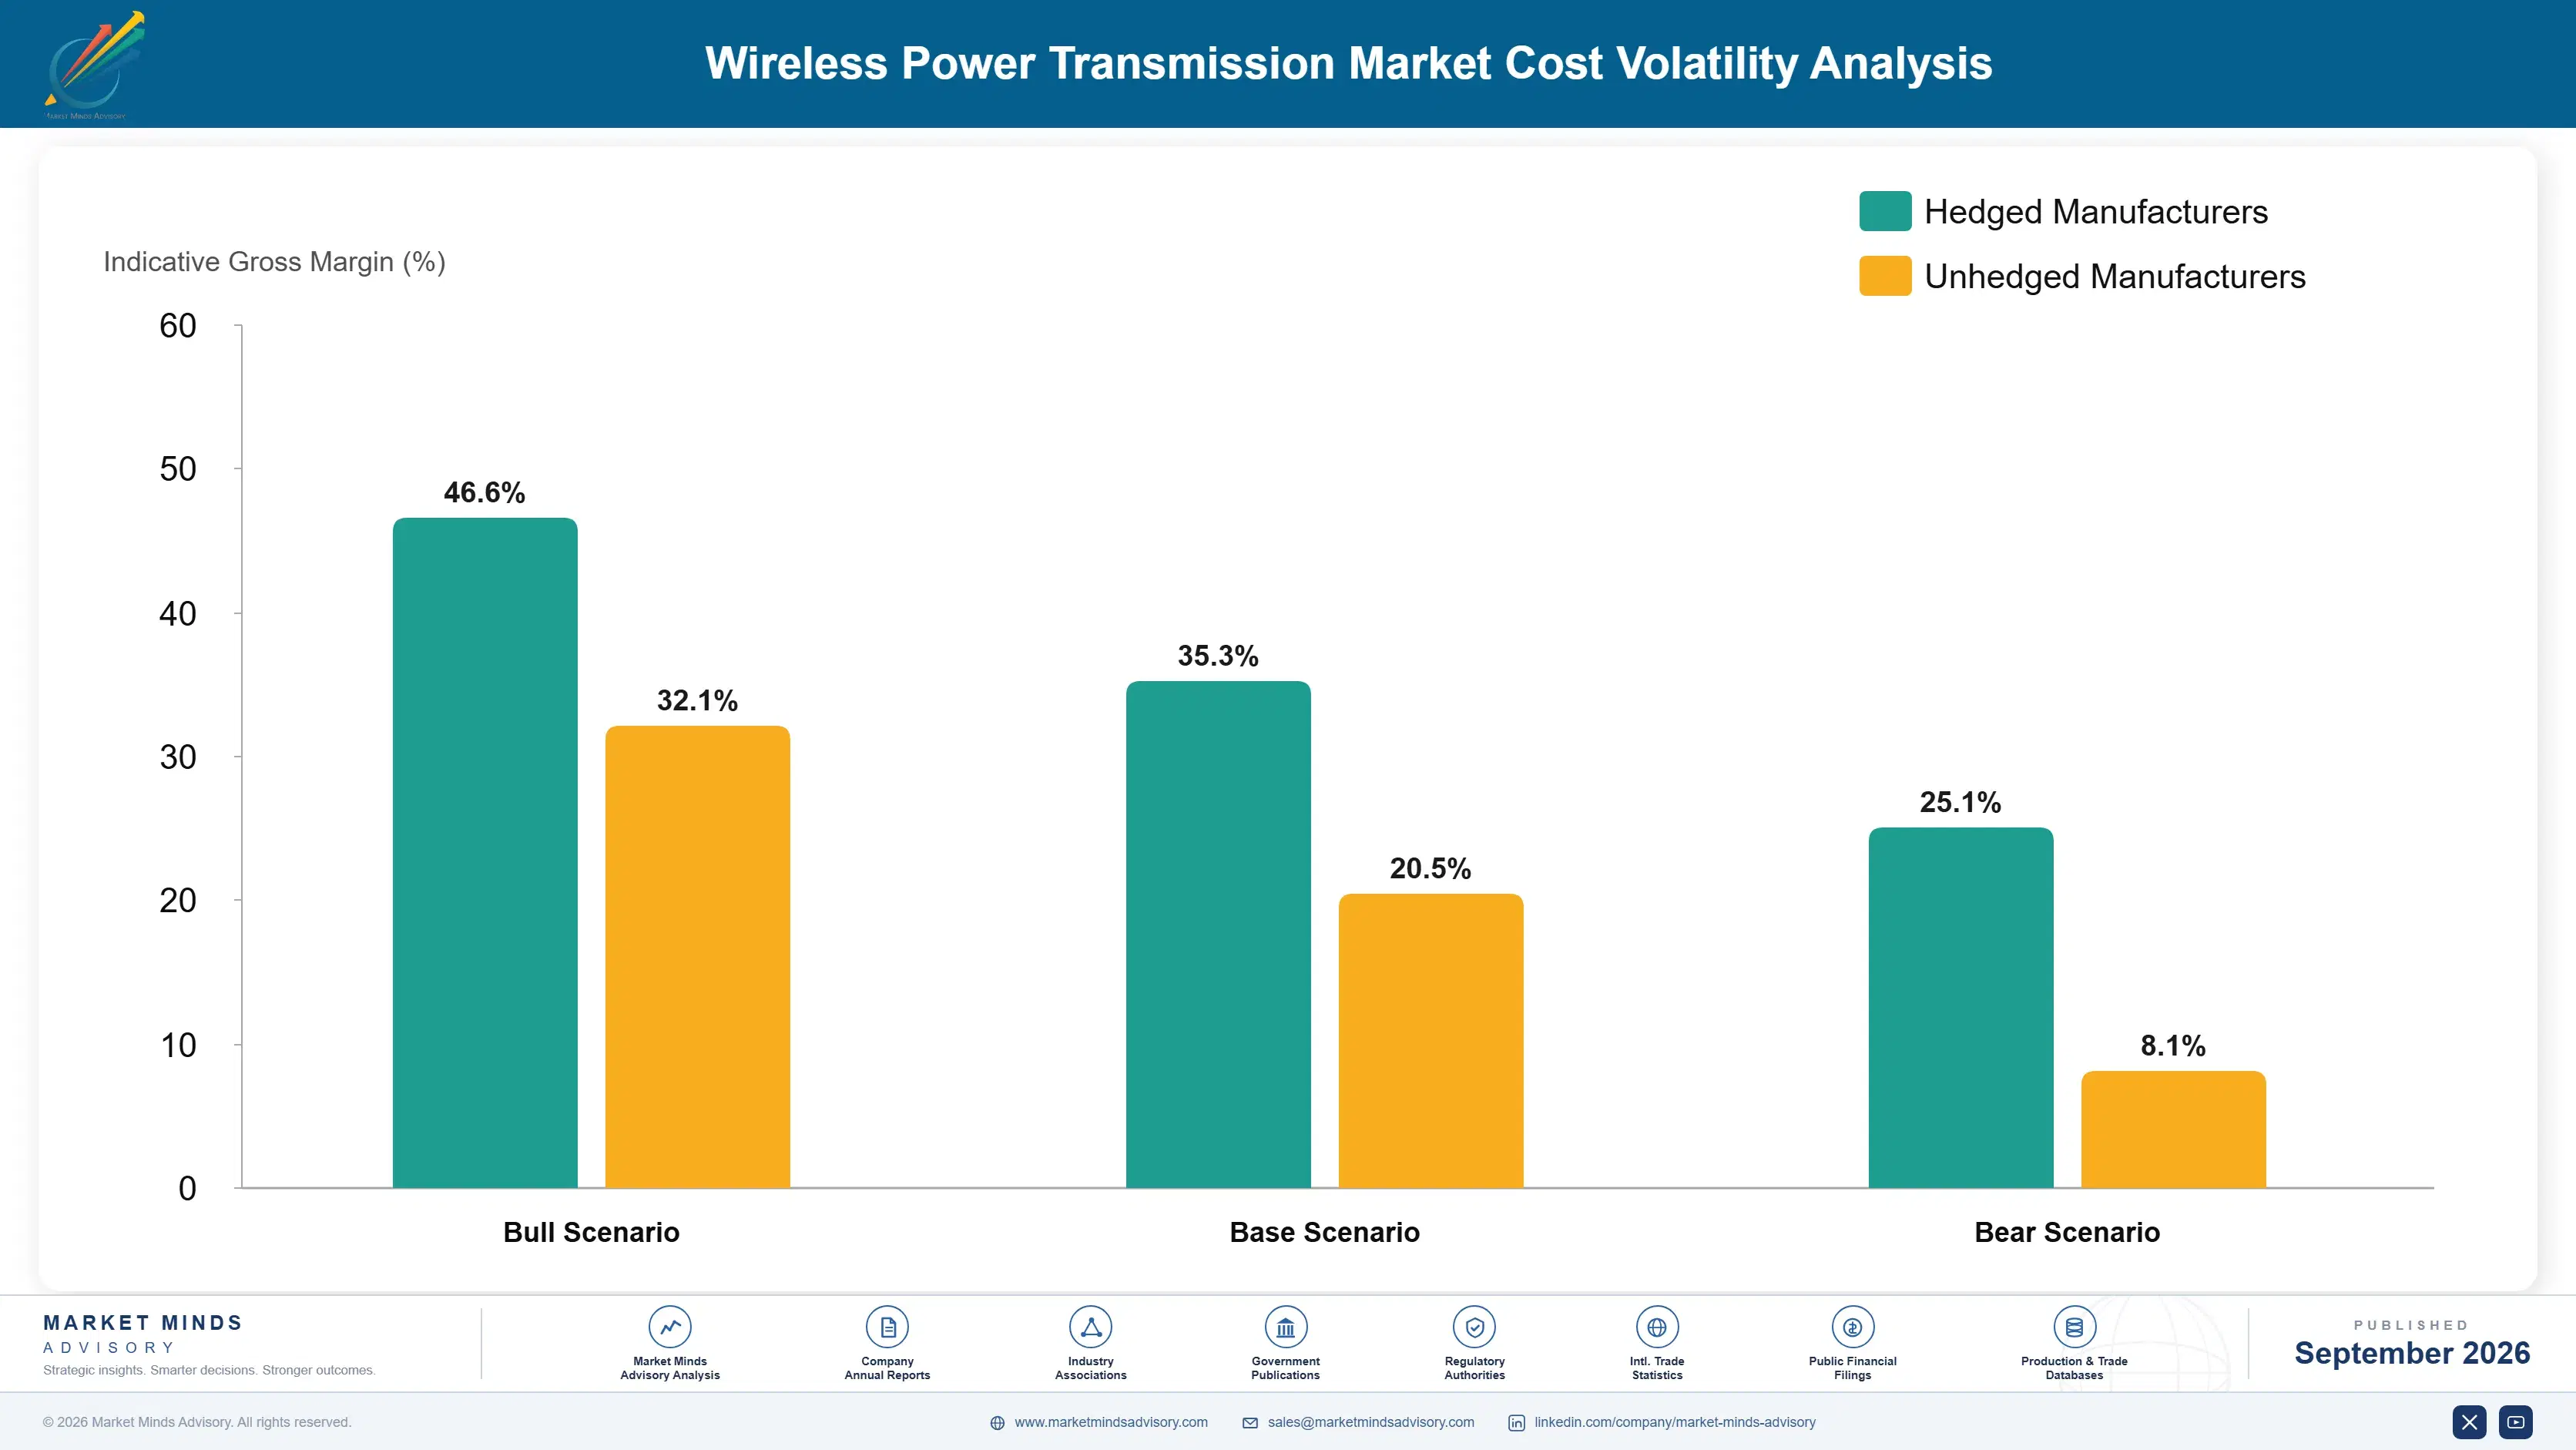
Cost structure differs sharply between consumer components and industrial systems. Consumer receiver content is dominated by silicon and coil assembly at roughly 61% of a cost that totals around USD 1.20 per device, with magnetics, shielding and test making up the balance. Industrial and fleet systems carry power electronics, larger coil assemblies, thermal management and installation, where installation labour alone frequently exceeds the hardware cost at a given site.
Magnetic materials have been the sharpest input pressure. Ferrite shielding and coil substrate materials come from a concentrated supplier base, and demand from both wireless power and adjacent power electronics applications tightened availability through 2024 and 2025. Texas Instruments and Renesas both referenced component and materials cost conditions in recent annual reporting. Consumer suppliers absorbed most of it, since device makers negotiate annual price reductions as a condition of continued supply.

Exposure varies by application rather than by scale. Consumer component suppliers face annual price reduction commitments against materials costs they do not control, which compresses margin from both directions simultaneously. Industrial and fleet suppliers carry installation labour that scales with site count rather than revenue. Medical suppliers carry regulatory and quality system cost that is fixed and substantial.
global-wireless-power-transmission-market-cost-volatility-analysis-1788425289374

Qualify alternative magnetic material sources early

Ferrite and coil substrate supply is concentrated among few producers who also serve adjacent power electronics demand, which leaves wireless power suppliers as secondary customers whenever availability tightens. Qualifying alternatives during design costs validation effort and removes an exposure that surfaces at exactly the wrong moment. It has to happen before a shortage rather than during one.

Standardise industrial installation into a repeatable process

Installation labour frequently exceeds hardware cost at industrial and fleet sites, and every deployment tends to be engineered individually because conditions differ. A standardised installation method with defined alignment procedures and prepared mounting cuts that effort by roughly 40%. It also improves the alignment tolerance achieved in practice, which is what determines whether a deployment performs as the proposal promised.

Price consumer supply against materials indexation

Device makers negotiate annual price reductions while magnetic materials cost moves independently, which leaves component suppliers absorbing both directions at once. Indexation against published materials pricing shifts that exposure to customers considerably better placed to absorb it. Buyers resist strongly, which is why it only becomes achievable during a shortage when supply assurance matters more than price does.

Portfolio Architecture for Margin Defence

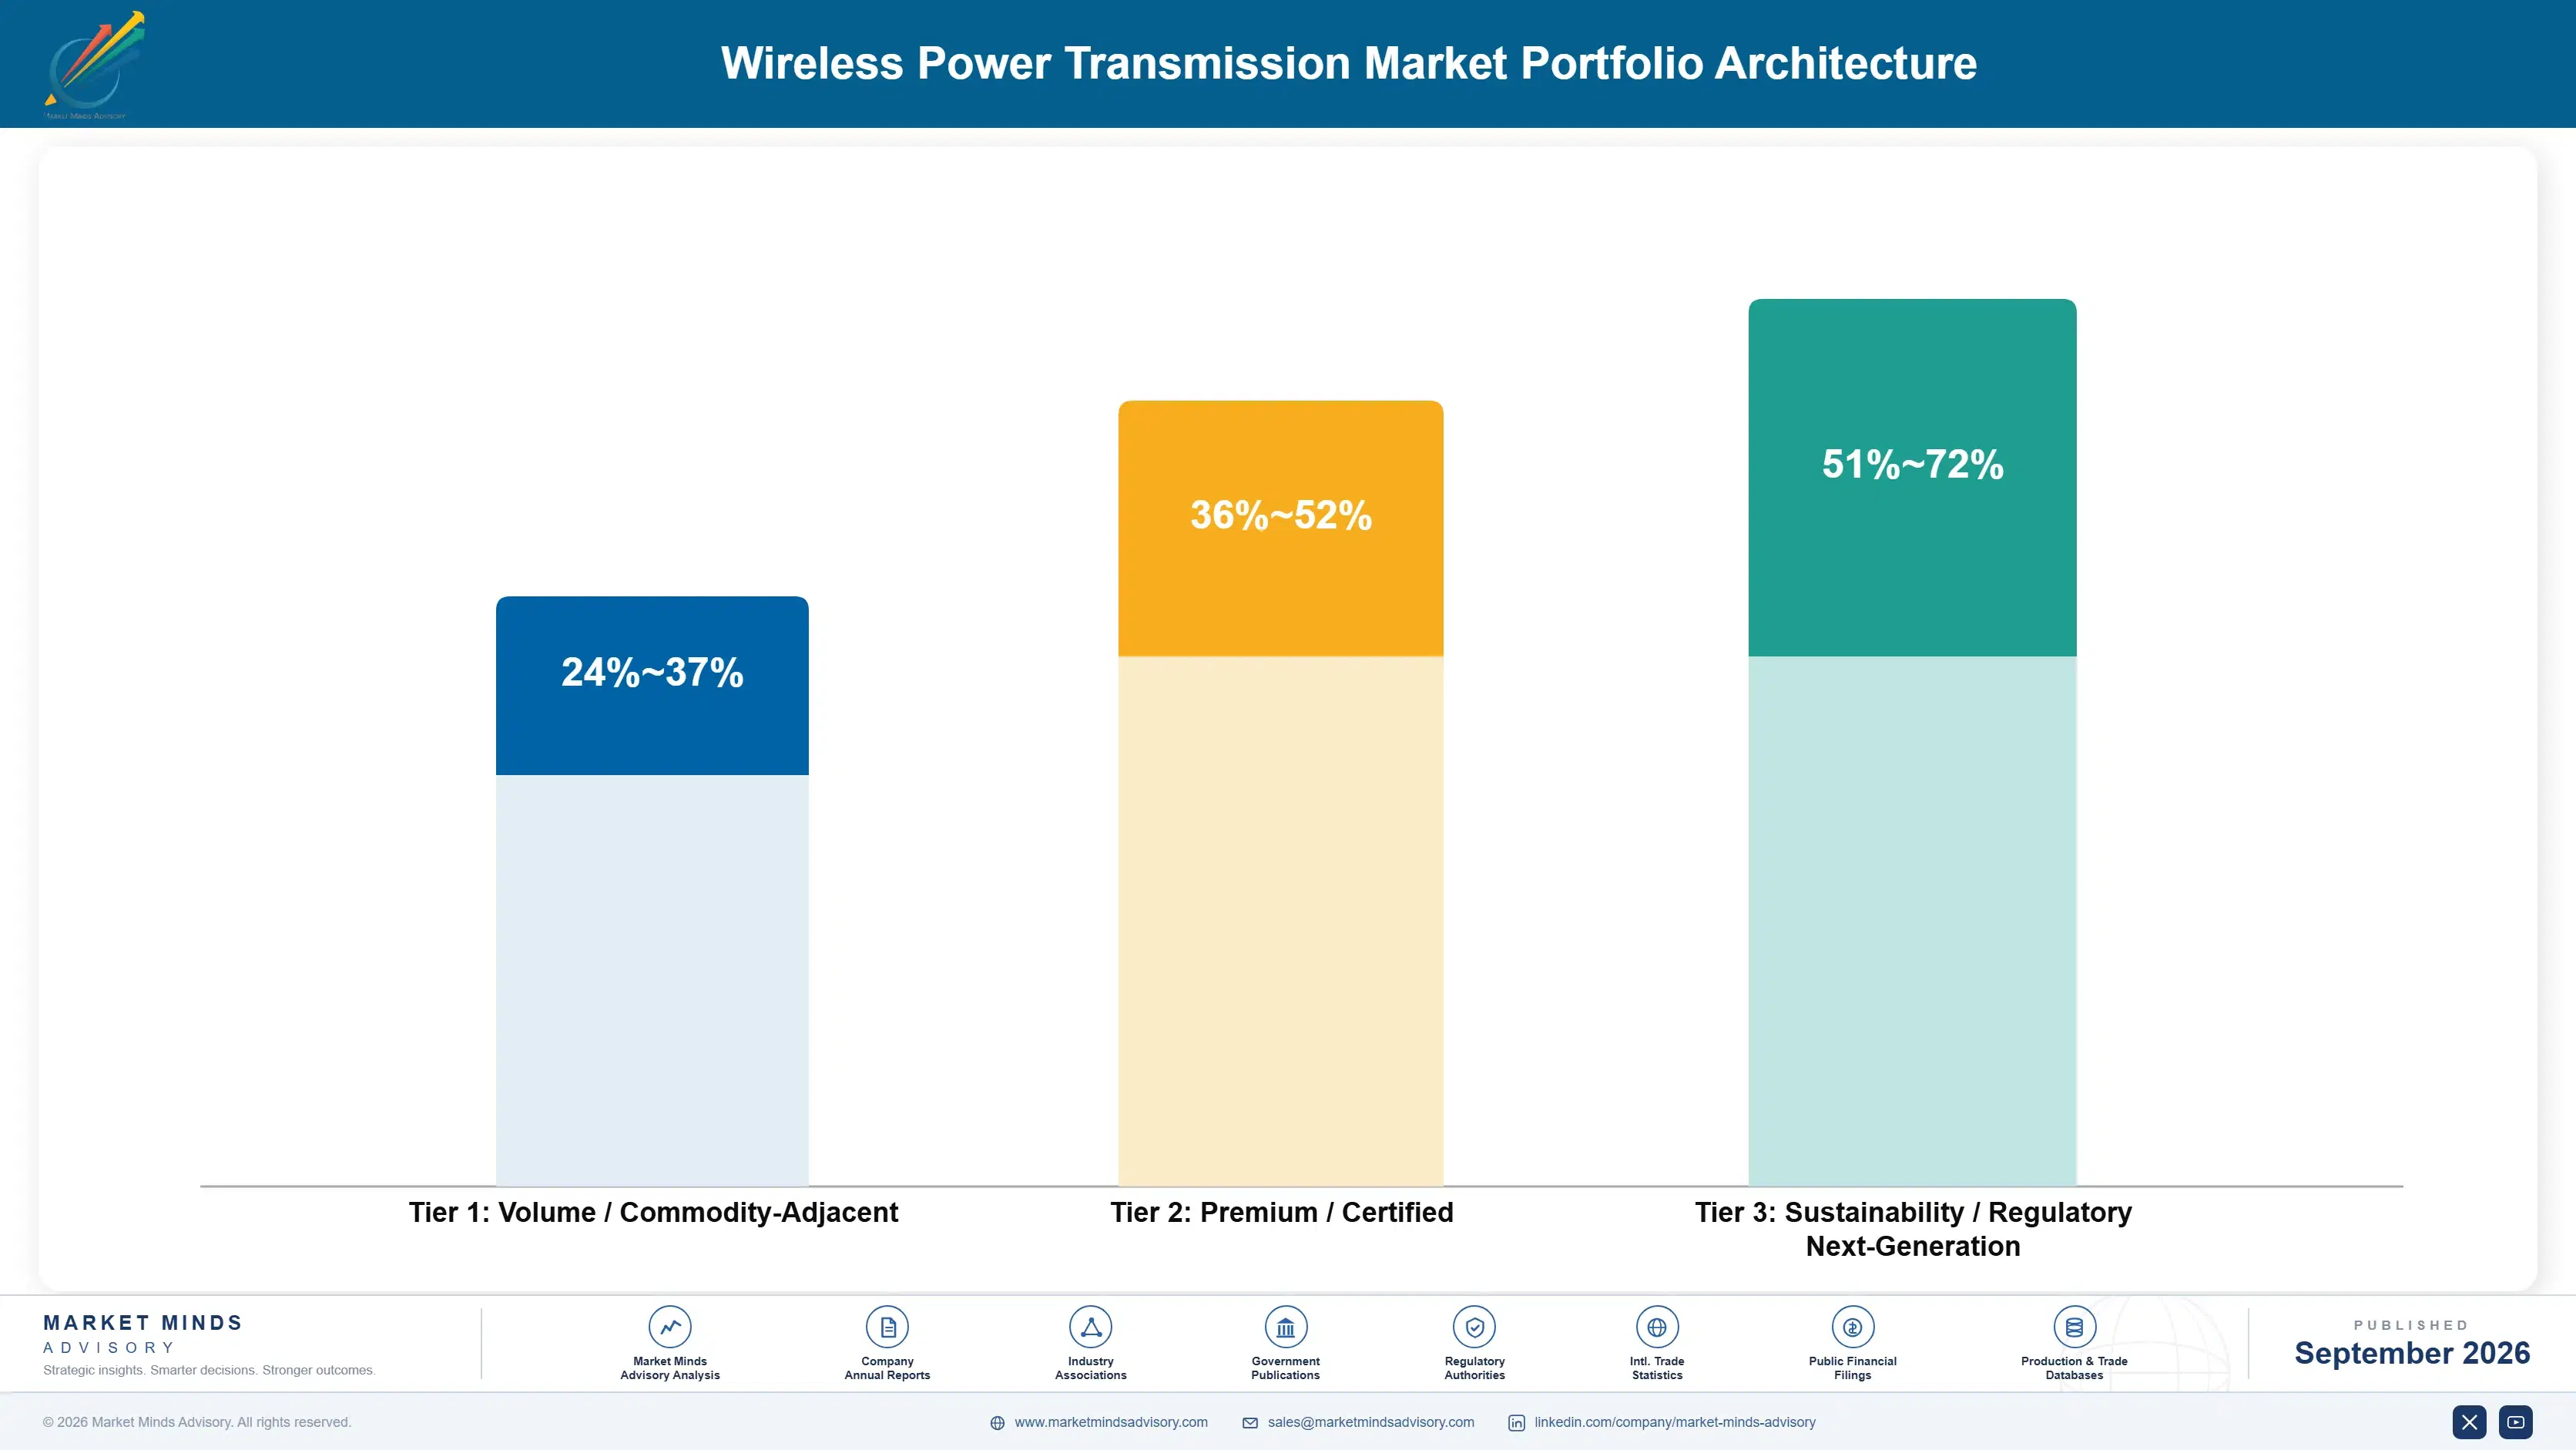
Margin architecture separates on whether a cable was ever an option. Consumer receiver components sell at around USD 1.20 into devices negotiating annual price reductions, earning thin semiconductor margins on very large volumes. Industrial and fleet systems earn considerably more because the buyer has no alternative method and evaluates against labour saved rather than against a cable. Medical implant powering earns most of all, protected by device approvals that take years and then hold.
The volume tension is between consumer scale and industrial margin. Consumer receivers ship in hundreds of millions, fund silicon development and are approaching attachment saturation in the premium devices that drove the growth. Industrial, fleet and medical applications ship in thousands, price at multiples and require deployment or regulatory capability that semiconductor organisations rarely hold. Very few suppliers do both well, and those weighted entirely to consumer volume are watching their growth engine reach its limit.

High-value revenue concentrates in medical implant powering and in automated fleet charging. Both share the property that no wired alternative exists for the buyer, which removes the comparison that defeats wireless power everywhere else. Consumer receiver supply occupies the volume position and faces the price pressure that always accompanies it.

Volume / Commodity-Adjacent

Consumer receiver and transmitter components sold into phones, earbuds and wearables. The wide range separates suppliers with integrated power management portfolios from those selling discrete transfer silicon. Annual price reduction commitments are standard and materials cost moves independently of them.
Gross Margin: 24-37%

Premium / Certified

Industrial sensing, fleet charging and robotic docking systems sold with deployment engineering. Margin depends heavily on installation efficiency, which frequently costs more than the hardware at a given site. Alignment performance in real conditions decides whether pilots convert to deployment.
Gross Margin: 36-52%

Sustainability / Regulatory / Next-Generation

Medical implant powering and specialised beamed power systems for defence and space. The widest range in the portfolio, reflecting regulatory content and programme specificity. Highest margin and the most protected, since approvals bind a supplier to a device for its life.
Gross Margin: 51-72%
global-wireless-power-transmission-market-portfolio-architecture-1788425289878

High-value Sub-segments and Strategic Watch-out

Medical Implant Powering

High value with strong growth, protected by device approvals binding coil geometry and power profile to a specific product for a decade or more. The margin range reflects regulatory content by device class. Competition after approval is effectively absent, which is rare anywhere in component supply.
Gross Margin: 58-72%

Automated Fleet Charging

High value with the fastest growth here, sold where no operator is present to connect anything and payback runs near 3.1 years on battery and labour savings. The range reflects installation content by site. It grows with automation deployment rather than with interest in wireless power.
Gross Margin: 42-56%

Consumer Receiver Components

The volume core at 81% of units and the weakest position commercially, priced near USD 1.20 with annual reduction commitments attached. It funds the silicon development that industrial and medical products build upon. Attachment is approaching saturation in the premium devices that drove all the growth.
Gross Margin: 23-36%

Passenger Vehicle Charging

The strategic watch-out, carried at zero because a decade of investment has produced deferrals rather than deployment. Drivers plug in a cable, which costs less and loses no energy doing it. Suppliers still building business cases around consumer vehicle adoption are repeating an experiment that has already run.
Gross Margin: 0-0%

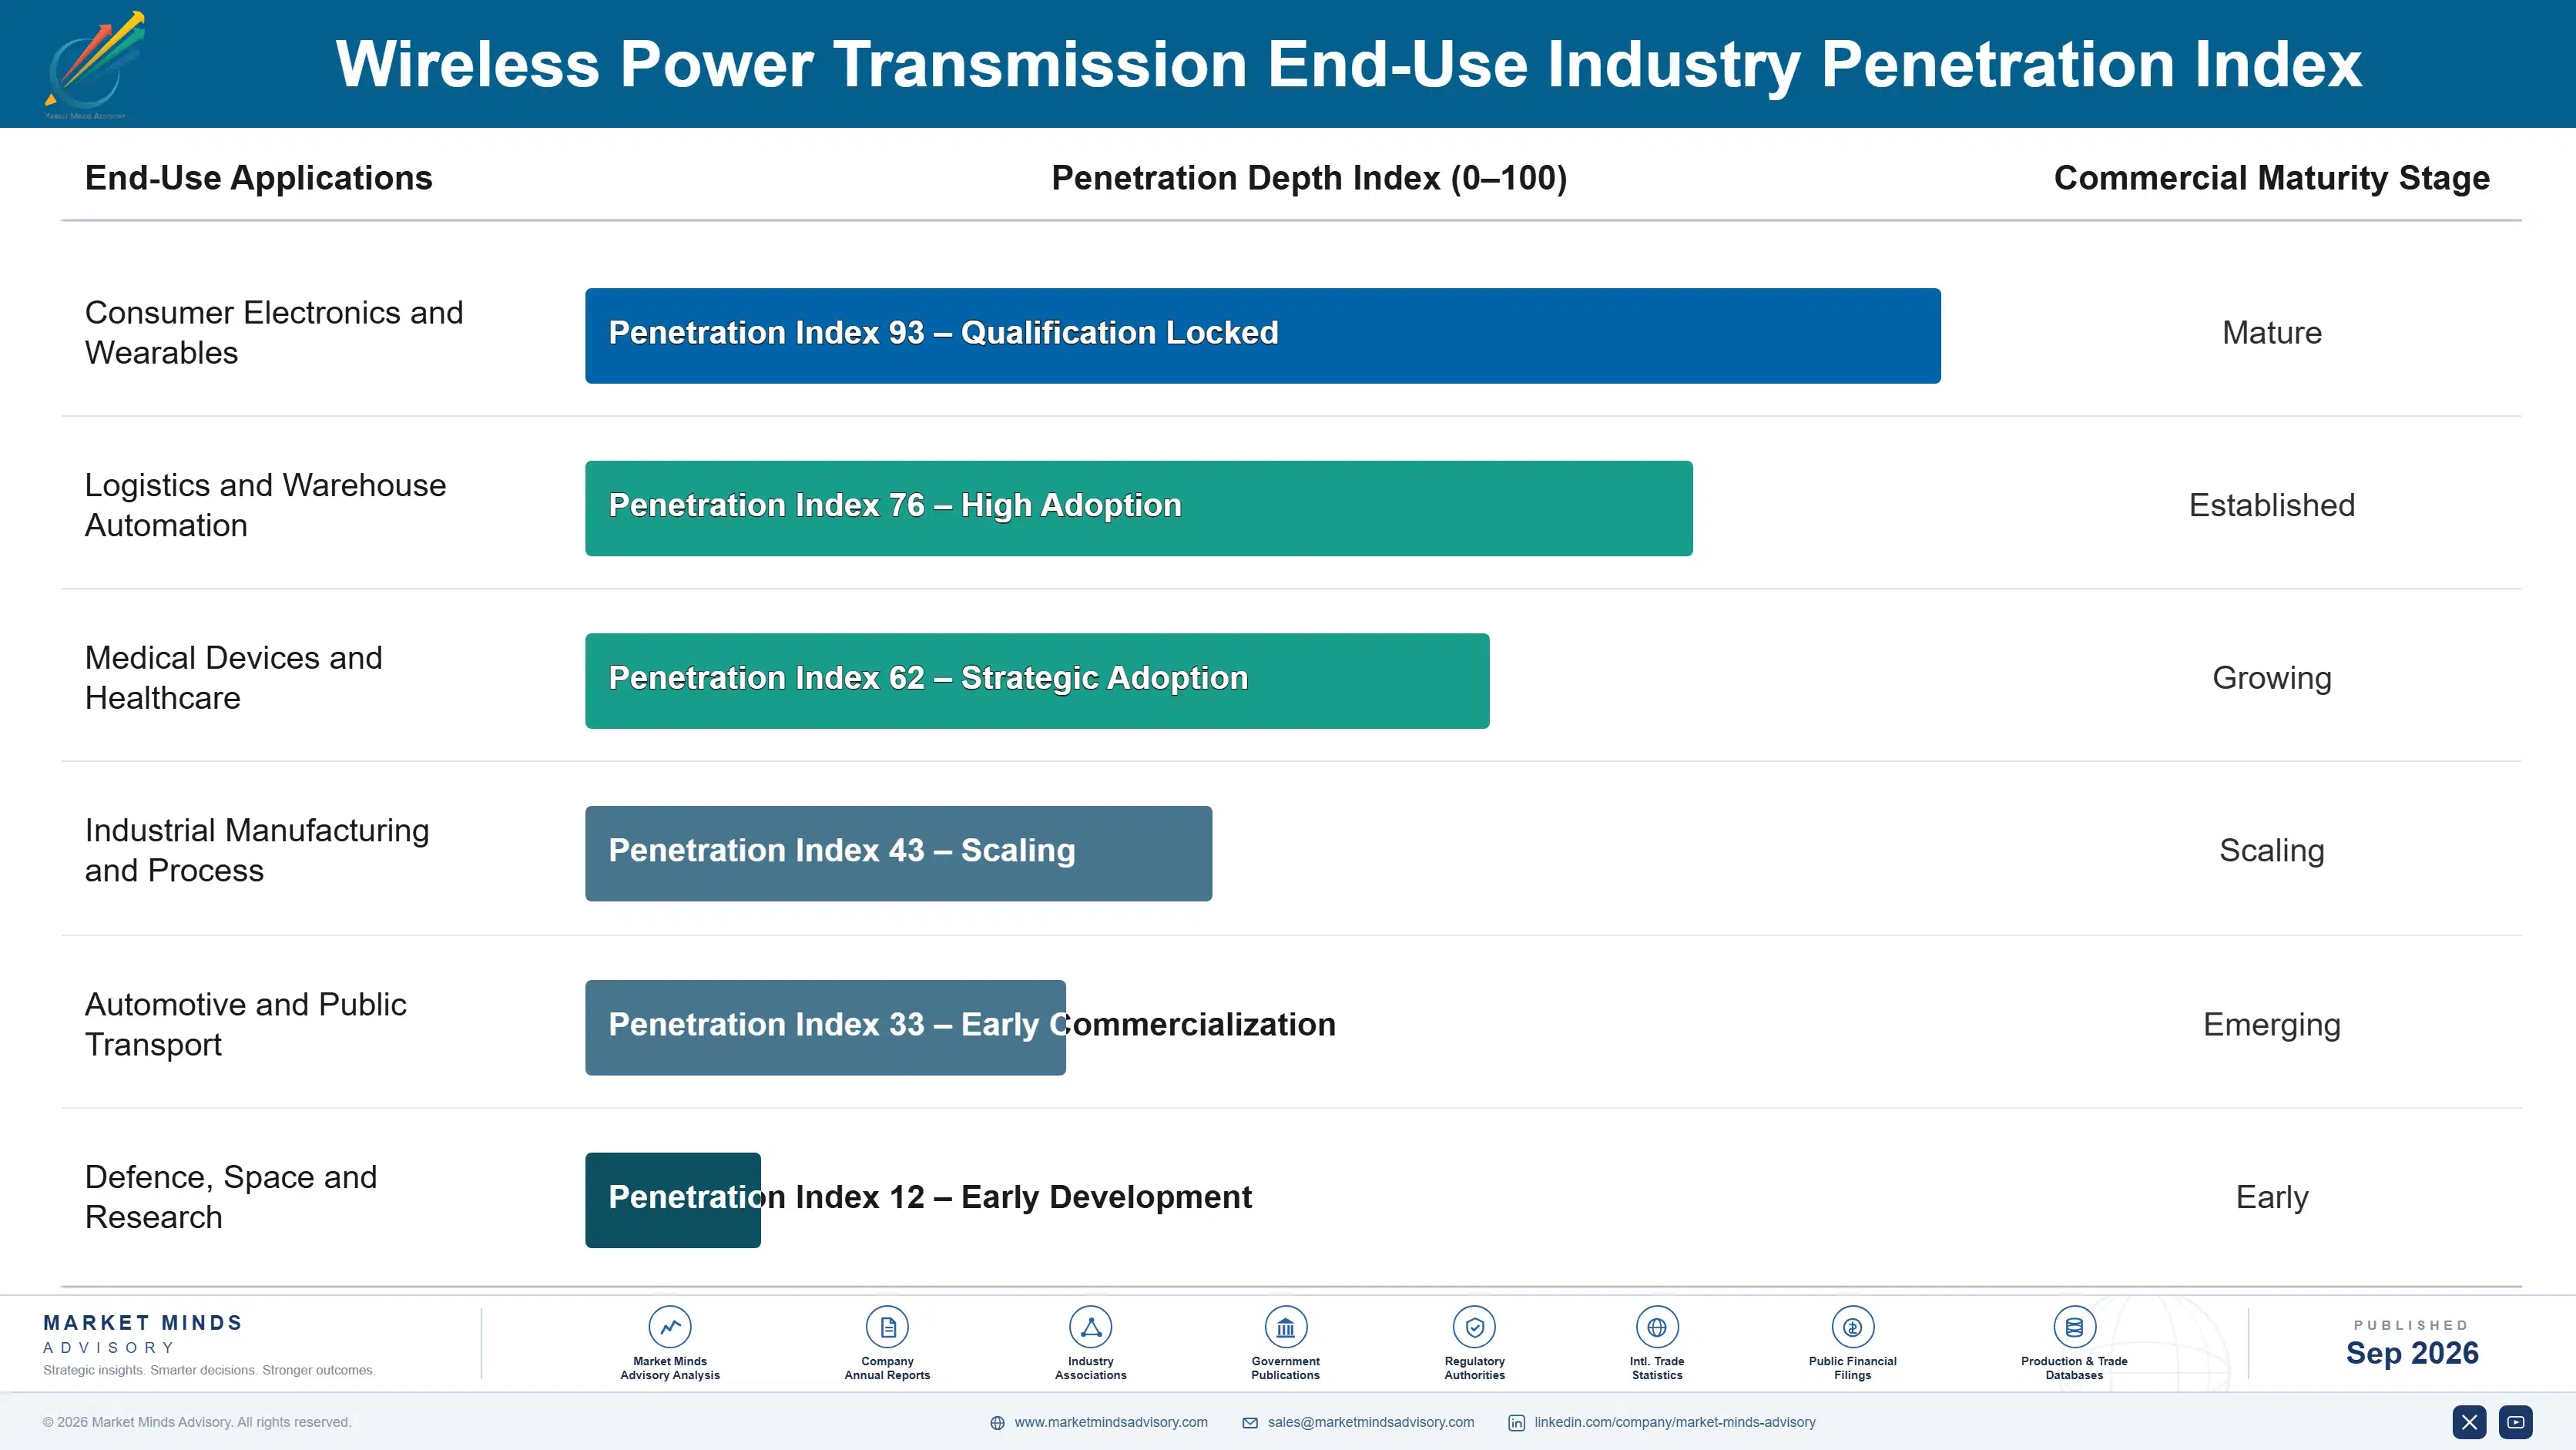
How This Demand Repeats

Recurrence follows the product it sits inside. Consumer receiver content ships with every device and recurs with device volumes the supplier does not influence, refreshing whenever a design generation changes. Medical implant powering recurs for the approved product's entire life, which can run a decade, and cannot be changed without requalification. Fleet and industrial systems are installed once per site and generate service revenue afterwards, with expansion following the customer's own automation programme.
Adoption depth varies sharply by application. Consumer devices use it every day and nobody thinks about it, which is exactly right for the technology. Warehouse operators integrate it into vehicle scheduling once installed and expand it as fleets grow. Medical device manufacturers design around it completely, since no alternative exists. Industrial sensing users deploy where assets are unreachable and nowhere else. Passenger vehicle owners have shown they will use a cable, which no amount of installed capability changes.

The buyer differs completely by application rather than having shifted over time. Consumer receiver content is specified by device design engineers against cost, thermal and packaging constraints. Fleet charging is bought by logistics operations against labour and utilisation arithmetic. Medical powering is specified by device developers years before approval.
global-wireless-power-transmission-market-end-use-penetration-index-1788425290375

Where This Technology Earns

These are among the four positions where our research anticipates prominent divergence between winners and laggards over the coming forecast period. Each is grounded in the demand model, the regulatory perimeter, and the announced capacity pipeline.
01 / UNATTENDED APPLICATION FOCUS

Sell where nobody is present to plug anything in

Wireless power loses on cost and efficiency wherever a person is standing there willing to connect a cable, and wins absolutely wherever nobody is available or nothing can physically be reached. Automated fleets, implanted devices and sealed sensors all sit in the second category, growing at 17.1%, 14.8% and 13.4% respectively, and suppliers concentrating there hold gross margins around 26 percentage points above consumer component supply. The industry has spent a decade blurring that distinction in its own marketing materials.
02 / BATTERY ECONOMICS ARGUMENT

Sell smaller batteries, never energy or convenience

Transfer loses roughly 11% of energy against a wired connection, which means any efficiency argument fails the moment a buyer checks it independently. Opportunity charging at frequent dwell points lets a fleet vehicle carry a considerably smaller battery, cutting purchase cost, weight and downtime together and recovering installed cost in about 3.1 years. That is fleet arithmetic that any operations manager can verify independently, and suppliers who lead with convenience are making precisely the claim their own physics contradicts every time.
03 / APPROVAL POSITION BUILDING

Treat medical certification as the competitive moat

Implant powering binds coil geometry, frequency and thermal profile into a device approval taking years to obtain, which then holds for that product's entire commercial life of a decade or more with essentially no competitive exposure afterwards at all. Suppliers treating approval support as a service rather than a regulatory obligation capture positions nobody can contest at any price. It requires clinical and regulatory capability that component suppliers rarely build, and those who did hold the best margins available in this market.
04 / ALIGNMENT OVER RANGE

Widen the tolerance, stop extending the distance

Practical alignment tolerance near 8 millimetres limits real deployments far more than absolute transfer distance does, because vehicles park imprecisely, robots dock approximately and installed assets shift over time in service. Adaptive tuning, coil arrays and mechanical guidance widen usable tolerance substantially without touching the coupling physics. Buyers evaluate reliability in their own operating conditions rather than bench performance, and suppliers competing on demonstrated range are answering a question no deployment engineer working today has ever actually asked them to answer.

Engagement Snapshot From the Field

A live engagement with an industry participant carrying material or product regulatory and market exposure ahead of a defining policy shift, showing how our research translates into a defensible multi-year portfolio strategy.
MARKET MINDS ADVISORY · CLIENT ENGAGEMENT SUMMARY
Wireless Power Transmission Producer Strategic Portfolio Review and Transition Roadmap 2026·Investment Scenario on Wireless Power Transmission Exposure Evaluation 2025-26
CLIENT PROFILE
An automated logistics operator running roughly 2,400 automated guided vehicles across nine distribution centres (client-reported, unverified by MMA), with vehicles removed from operation for scheduled contact charging at dedicated stations. Charging downtime accounted for approximately 14% of available fleet hours across the network, and battery replacement was running ahead of forecast. Charging stations occupied floor space that picking operations needed.
STRATEGIC CHALLENGE
A proposal to install wireless charging across all nine sites carried an estimated capital cost of USD 31 million (client-reported, unverified by MMA), justified on an energy efficiency argument that the engineering team had correctly identified as false given transfer losses. Nobody had modelled the battery sizing and downtime effects that would actually determine whether the investment made sense.
MMA APPROACH
MMA modelled fleet economics against dwell point charging rather than against energy consumption, which the proposal had used as its basis. We examined vehicle duty cycles at each site, interviewed 12 operations staff, four suppliers and the battery manufacturer. Options were assessed on downtime recovered and battery capacity reduction rather than on energy or any convenience argument.
KEY FINDINGS
  1. Wireless transfer would increase energy consumption by roughly 11%, and the proposal's efficiency justification was arithmetically wrong rather than merely optimistic about the outcome.
  2. Charging at picking positions would remove approximately 12 of the 14 percentage points of downtime, since vehicles already dwell there during every operating cycle.
  3. Battery capacity could fall by around 40% with frequent top-up charging, cutting vehicle purchase cost and extending battery life through shallower discharge cycles.
  4. Alignment at picking positions was already accurate to within 6 millimetres because vehicles dock there precisely, which removed the tolerance problem entirely at those locations.
CLIENT PROFILE
An automated logistics operator running roughly 2,400 automated guided vehicles across nine distribution centres (client-reported, unverified by MMA), with vehicles removed from operation for scheduled contact charging at dedicated stations. Charging downtime accounted for approximately 14% of available fleet hours across the network, and battery replacement was running ahead of forecast. Charging stations occupied floor space that picking operations needed.
STRATEGIC CHALLENGE
A proposal to install wireless charging across all nine sites carried an estimated capital cost of USD 31 million (client-reported, unverified by MMA), justified on an energy efficiency argument that the engineering team had correctly identified as false given transfer losses. Nobody had modelled the battery sizing and downtime effects that would actually determine whether the investment made sense.
MMA APPROACH
MMA modelled fleet economics against dwell point charging rather than against energy consumption, which the proposal had used as its basis. We examined vehicle duty cycles at each site, interviewed 12 operations staff, four suppliers and the battery manufacturer. Options were assessed on downtime recovered and battery capacity reduction rather than on energy or any convenience argument.
KEY FINDINGS
  1. Wireless transfer would increase energy consumption by roughly 11%, and the proposal's efficiency justification was arithmetically wrong rather than merely optimistic about the outcome.
  2. Charging at picking positions would remove approximately 12 of the 14 percentage points of downtime, since vehicles already dwell there during every operating cycle.
  3. Battery capacity could fall by around 40% with frequent top-up charging, cutting vehicle purchase cost and extending battery life through shallower discharge cycles.
  4. Alignment at picking positions was already accurate to within 6 millimetres because vehicles dock there precisely, which removed the tolerance problem entirely at those locations.
RECOMMENDED STRATEGY
Phase 1: Install wireless charging at picking positions rather than dedicated stations, since vehicles already dwell there and dock with adequate precision anyway. Phase 2: Rebuild the business case on downtime recovery and battery reduction, abandoning entirely the energy efficiency argument the transfer losses contradict. Phase 3: Deploy at three sites first and specify reduced battery capacity on the next vehicle order, rather than committing all nine sites before the effect is measured.
OUTCOME
Fleet availability improved by roughly 11 percentage points at the three pilot sites and the next vehicle order specified 38% smaller batteries (client-reported, unverified by MMA). Capital cost for the three sites reached USD 8 million, and the remaining six were approved on measured results rather than on the original projection.

Frequently Asked Questions

Foundational context covering the market sizes, CAGR, scope, country, region and competition that inform every finding below. This section is provided to cover basics and most often pre-purchase conversations, answered from the MMA Primary Research Dataset.

What is the current size of the Wireless Power Transmission Market?

The market was worth USD 8.6 billion in 2025 and reaches USD 9.58 billion in 2026. Around 81% of units ship into consumer phones, earbuds and wearable devices.

How large will the Wireless Power Transmission Market be by 2036?

MMA forecasts USD 28.20 billion by 2036, an expansion of 2.94 times over the forecast period. That represents USD 18.62 billion of incremental annual revenue against 2026.

What is the CAGR for the Wireless Power Transmission Market 2026 to 2036?

The base case is 11.4% compound annual growth, with a bull case at 12.6% and a bear case at 10.2%. The pace of automation and robotics deployment separates the scenarios.

Which segment is growing fastest?

Automated fleet and robotic charging grows at 17.1%, half again the market rate of 11.4%. There is no operator present to connect a charger, which makes wireless transfer an operating requirement.

Who are the major companies in the Wireless Power Transmission Market?

Renesas, Texas Instruments, NXP Semiconductors, STMicroelectronics and WiTricity lead on measured component and system revenue. Together they hold roughly 38%, concentrated in consumer device silicon.

Which country is growing fastest?

India grows fastest at 15.2%, on electronics assembly established under domestic manufacturing incentives that brought receiver component demand into the country alongside expanding industrial sensing.

Report Segmentation Architecture

The full report scope spans multiple orthogonal segmentation dimensions, with cross-tabulated demand data provided for each dimension pair. Coverage extends further to regional breakdowns, trend trajectories, and the competitive detail needed to support segment-level decision-making.

By Primary Market Dimension

  • Consumer Device Inductive Charging
  • Automated Fleet and Robotic Charging
  • Medical Implant and Wearable Power
  • Industrial Sensor and Battery-Free Powering
  • Passenger Vehicle Wireless Charging
  • Long-Range Beamed Power Systems

By End-Use Industry

  • Consumer Electronics and Wearables
  • Logistics and Warehouse Automation
  • Medical Devices and Healthcare
  • Industrial Manufacturing and Process
  • Automotive and Public Transport
  • Defence, Space and Research

By Commercial Dimension

  • Component Design Win Supply
  • Industrial System Integration
  • Medical Device Development Partnerships
  • Fleet Operator Direct Purchase
  • Licensing and Standards Programmes
  • Distribution and Module Channels

By Region

  • East Asia
  • North America
  • Western Europe
  • South Asia and Pacific
  • Latin America
  • Middle East and Africa
  • Eastern Europe

Scope, Methodology, and Coverage

Every figure in this report is reproducible from documented input assumptions. The scope below maps the historical period, the forecast horizon, the segmentation dimensions, and the countries covered, alongside the underlying primary and qualitative methodology.
Historical Period
2020 to 2025
Forecast Period
2026 to 2036
Base Year
2025 (USD billions; MMA Primary Research Dataset, September 2026)
Market Definition
This market covers systems, modules and components that transfer electrical power without a conductive connection, spanning consumer device inductive charging, automated fleet and robotic charging, medical implant and wearable power, industrial sensor and battery-free powering, passenger vehicle wireless charging, and long-range beamed power systems. Revenue is measured as transmitter and receiver component, module and complete system value at supplier level, including attributable installation and integration. Conventional wired charging equipment and connectors, batteries and energy storage devices, data-only wireless communication, near field communication used for data alone, and grid transmission and distribution infrastructure are excluded.
Quantitative Units
USD billions, component, module and system revenue at supplier level
Segmentation Dimensions
Application context, end-use industry, commercial model, region
Regions Covered
East Asia, North America, Western Europe, South Asia and Pacific, Latin America, Middle East and Africa, Eastern Europe
Countries Covered
China, Japan, South Korea, Taiwan, Singapore, India, Vietnam, Malaysia, Australia, United States, Canada, Mexico, Brazil, Chile, Germany, Switzerland, Ireland, Netherlands, Sweden, Norway, United Kingdom, France, Poland, Czechia, Hungary, United Arab Emirates, Saudi Arabia, Israel, South Africa
Key Companies Profiled
Renesas, Texas Instruments, NXP Semiconductors, STMicroelectronics, WiTricity, Infineon Technologies, ROHM, Analog Devices, Nuvolta Technologies, Powermat, Energous, Powercast, Wi-Charge, Ossia, InductEV, Electreon, IPT Technology, Daihen, Mojo Mobility, Semtech
Quantitative Methodology
Primary survey, n=3,800 respondents, Q4 2025, six countries; demand-side model with trade association cross-validation
Qualitative Methodology
47 expert interviews, Q4 2025; applied to validate demand model assumptions, identify emerging dynamics, and assess competitive positioning
Report Format
PDF and XLSX data workbook (Word format preview document)
Publisher
Market Minds Advisory
Report Code
MMA-2026-ENE-591
Published
September 2026
Contact
sales@marketmindsadvisory.com | www.marketmindsadvisory.com

Purchase the full Wireless Power Transmission Market Report (2026 to 2036).

The full MMA report separates the applications where wireless power has no competition from those where it loses to a cable somebody was going to plug in anyway. It sizes the market to 2036 across six application contexts, seven regions and 29 countries, with segment growth rates and regional demand mechanisms set out in full. Competitive analysis covers 20 suppliers assessed on measured component and system revenue, including moat and risk assessment for the two leaders. The report quantifies cost structure, transfer efficiency economics and margin architecture across three portfolio tiers. It closes with four strategic verdicts and an anonymised logistics operator engagement.
Six application contexts sized to 2036
Seven regions with demand mechanism analysis
Twenty suppliers on consistent revenue basis
Transfer efficiency and payback period benchmarks
Margin architecture across three portfolio tiers
Anonymised automated fleet charging strategy engagement

Built For The People Who Decide

From boardroom strategy to bench-side execution, this report is read cover-to-cover by leaders shaping the next decade of their industry, turning demand scenarios, market dynamics and valuation benchmarks into decisions.
CXOs/ Presidents/ VPs/ Managers
M&A and Corporate Development
Strategy Teams and R&D Heads
Procurement and Product Directors
Regulatory and Compliance Leaders
Investor Relations and Equity Analysts