Market Minds Advisory
Global Tapes Market

Global Tapes Market: Adhesive Tapes: Bonding Replacing Fasteners, Debonding on Demand, and Solvent Lines Nobody Will Rebuild

A tape that bonds a battery module permanently is worth a great deal until somebody has to take the pack apart for recycling. Debonding on command is now a design requirement rather than a curiosity.

Lead Analyst

Bilal Shaikh

Published

September 2026

Make Smarter Decisions with Customized Research Insights

Request a free sample report and evaluate market opportunities, growth trends, and competitive dynamics relevant to your business needs.

2025 MARKET VALUE$71.6BMarket Size 2025
2036 FORECAST VALUE$133.1BBase Case , 2026 to 2036
CAGR 2026 TO 20365.8 %Bull 7.0% / Bear 4.6%
INCREMENTAL OPPORTUNITY$57.4BNet 10- year value creation
EXPANSION MULTIPLE1.76x2036 value over 2026 base
Strategic Levers
M&A Pipeline
Regional Outlook
Country Rankings
Competitive Intelligence
Segmental Deep-dive
Call-Us : 91 93563 13602

Executive Snapshot and Market Trajectory.

Tape stopped being a consumable and became a structural fastener somewhere in the course of the last two decades. A double-sided acrylic foam bond now holds vehicle trim, building facades, and battery modules together in places a screw used to sit, and nobody counts it as adhesive any more.
Commercial advantage belongs to suppliers whose bonds can be broken deliberately, because everything now assembled with tape eventually has to come apart for repair or recycling and permanent adhesion has become a liability. Debondable and reworkable tapes grow fastest at 15.6%, roughly 2.69 times the market. East Asia holds 34% of value, above the standard band, on electronics and vehicle assembly concentrated there.
Concentration sits at roughly 38% for the top five, held by adhesive formulation and coating capability rather than by any barrier to slitting a roll. Around 41% of volume now goes into permanent assembly rather than packaging or repair. Solvent coating lines face emissions capital that most operators will simply not spend. Capacity retires rather than converts, which quietly tightens supply of specialised adhesives that nothing else can currently match at all anywhere.
Market Definition
The market comprises pressure-sensitive adhesive tapes supplied for packaging, assembly, protection, and electrical applications, covering carton sealing tapes, double-sided assembly tapes, masking and protective tapes, electrical and thermal management tapes, medical and skin-contact tapes, and debondable or reworkable tapes. Value is measured at manufacturer level on converted product. Adhesive raw materials and carrier films sold separately, liquid adhesives and sealants, labels, application equipment, and hook-and-loop or mechanical fastening systems fall outside scope.
Base Year Value
$71.6B in 2025 (MMA Primary Research Dataset, August 2026)
Forecast Period
2026 to 2036, eleven discrete annual values
CAGR
5.8% base case. Bull 7.0%. Bear 4.6%.
Fastest Growth Segment
Debondable and Reworkable Tapes: 15.6% CAGR
Fastest Growth Country
India: 9.2% CAGR
Fastest Growth Region
South Asia and Pacific: 8.0% CAGR
Largest Region
East Asia: 34% of 2025 global value
Market Leaders
3M, tesa, Nitto Denko, Avery Dennison, and Lintec lead on adhesive tape supply revenue. Source: company annual reports and MMA Analysis, July 2026.
Primary Survey
n=3,800 procurement and R&D decision-makers, Q4 2025, six countries
Methodology
Demand-side build-up, cross-validated against public data, 47 expert interviews

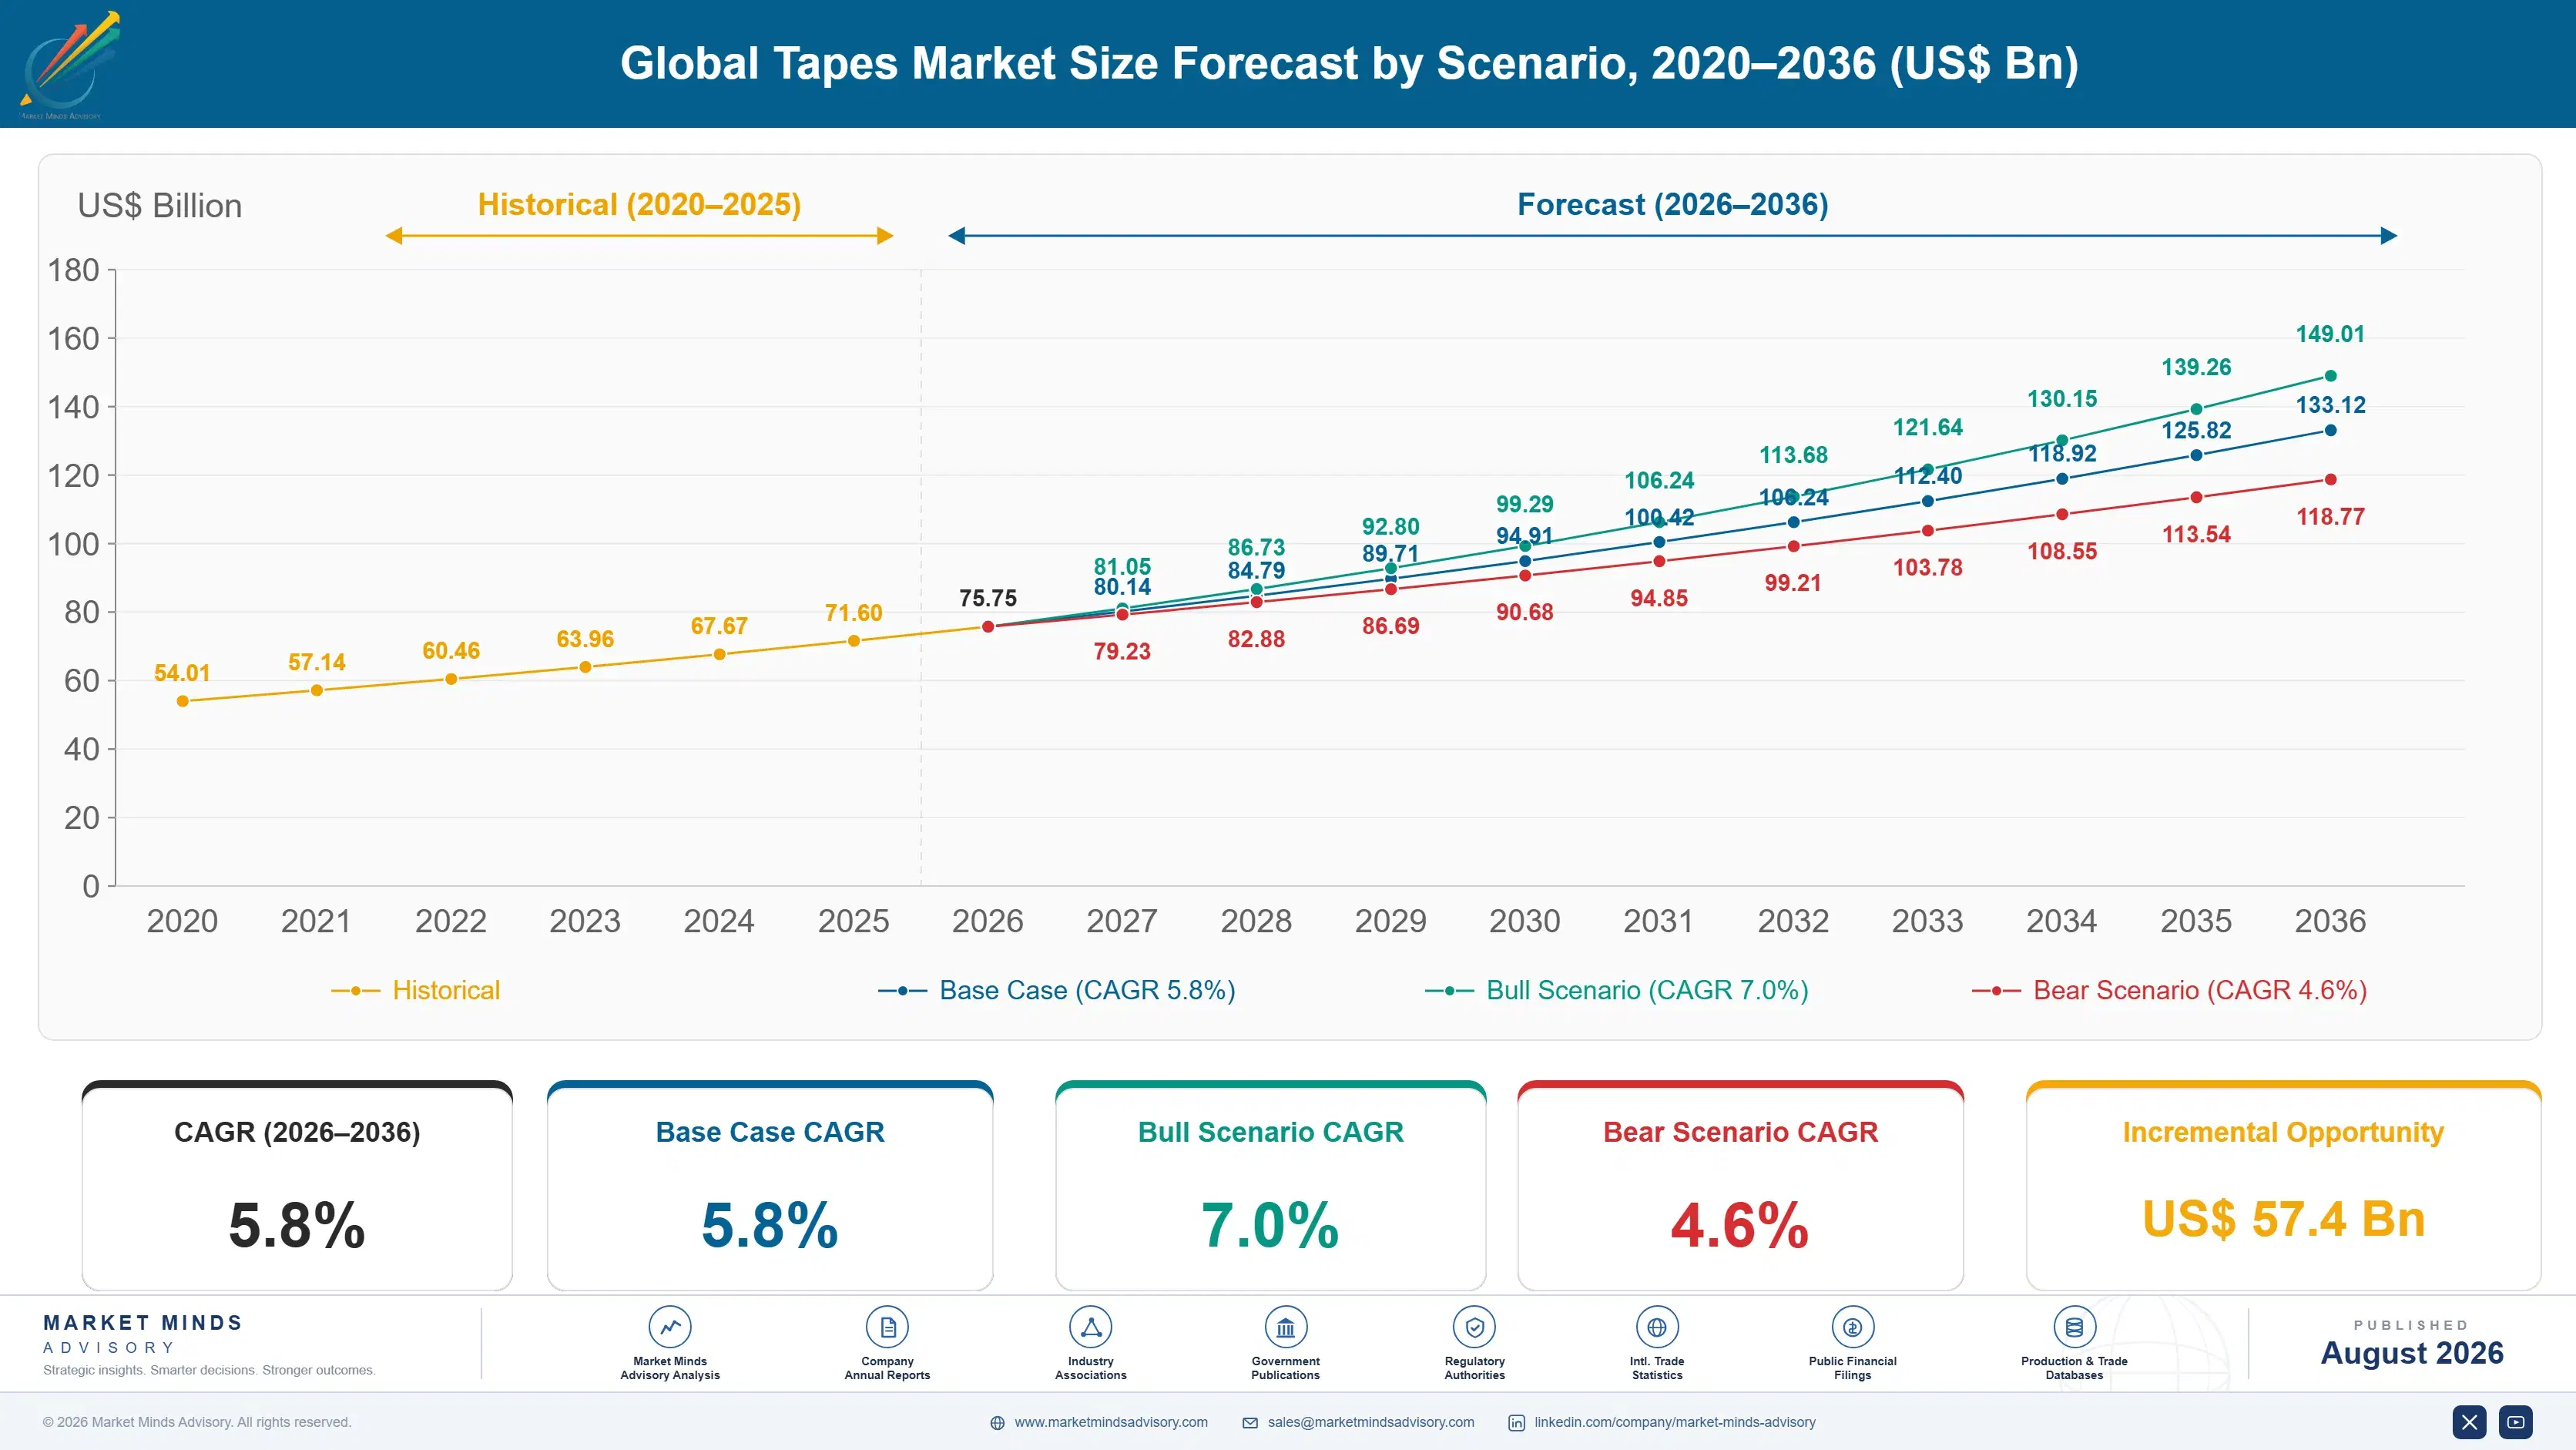
Global Tapes Market Forecast Scenarios

global-tapes-market-2025-2035-size-forecast-scenario-1787553590112
Between 2020 and 2025 tape kept quietly replacing mechanical fastening in applications engineers would once have bolted or welded. Vehicle lightweighting, thinner electronics, and facade systems all pushed bonded assembly further, and the adhesive stopped being an afterthought in the design. Emissions rules meanwhile made solvent coating capacity expensive to maintain. The 4.8% historical rate combines flat packaging tape volumes with genuine expansion in assembly applications underneath.
The 5.8% base case rests on three mechanisms. Bonded assembly keeps displacing fasteners across vehicles, electronics, and construction as weight, thickness, and appearance requirements tighten. Repairability and recycling rules increasingly require that bonded products come apart again, which only debondable systems answer. And thermal management tape demand grows with battery and semiconductor power density regardless of what happens elsewhere. None of the three depends on packaging tape volumes recovering at all.
The 7.0% bull case assumes battery repairability requirements arrive broadly while electronics assembly volumes hold. The 4.6% bear case reflects vehicle and electronics production weakness, packaging tape volumes declining as parcel formats change, and solvent line closures constraining supply of specialised products faster than water-based alternatives can be qualified to replace them. Coating capacity sits under both cases as a quiet constraint.

The Fastener Nobody Calls a Fastener

Assembly is now 41% of tape volume and it changed what this industry sells. An acrylic foam tape reaching around 1.4 megapascals in shear replaces rivets on a vehicle body panel, mounts a facade element, or holds a battery module in place, and the design engineer treats it as a joint rather than a consumable. Qualification runs roughly 26 months, which makes those positions genuinely durable once won.
TOP-FIVE CONCENTRATION38%Combined share of tape supply held by leading manufacturers
ASSEMBLY APPLICATION SHARE41%Portion of volume entering permanent bonded assembly rather than packaging
BOND STRENGTH ACHIEVED1.4 megapascalsTypical shear performance from acrylic foam assembly tape systems
SOLVENT LINE ABATEMENT COSTUSD 14 millionTypical capital to bring one coating line within emission limits
QUALIFICATION CYCLE LENGTH26 monthsTypical approval period before a tape reaches series production
DEBONDABLE ADOPTION RATE11%Share of assembly tape volume using deliberate release mechanisms
The awkward consequence is that everything bonded eventually has to be unbonded. Repairability rules, battery recycling requirements, and electronics servicing all assume a product can be taken apart, and a permanent acrylic bond assumes precisely the opposite. Debondable systems using heat, current, or a pull-tab release answer that and currently reach 11% of assembly volume. That gap is where the interesting engineering sits.
Underneath both sits a manufacturing problem nobody discusses publicly. Solvent-based coating produces adhesive properties water-based systems still struggle to match on several specialised products, and bringing one solvent line within emission limits costs around 14 million dollars. Many operators will not spend it, which means capacity retires rather than converts and specialised supply quietly tightens.
"Engineers specify a tape as a structural joint and then procurement tenders it against carton sealing rolls because both are called tape. Those two products share a coating line and almost nothing else, and the confusion costs suppliers real money every year."
Practice Director, Adhesives and Bonded Assembly Systems · MMA Adhesives and Bonding Systems Practice · August 2026

Market Trends

Repairability Rules Turn Permanent Bonds Into Liabilities

Battery recycling requirements, right-to-repair legislation, and electronics servicing rules all assume a bonded product can be taken apart again, which a permanent acrylic bond was specifically engineered to prevent. Debondable systems release on heat, electrical current, or a deliberate pull-tab and currently reach 11% of assembly volume. Adoption is limited by cost and by validation rather than by any conceptual difficulty. Designers who bonded everything permanently five years ago are now redesigning those joints under regulatory pressure. Rebuilding a joint that was designed to be irreversible is considerably harder than designing it that way first.
Market Impact: Assembly carries 41% of volume
Solvent Coating Capacity Retires Rather Than Converts

Bringing a solvent coating line within emission limits costs roughly 14 million dollars, and many operators facing that decision close the line instead. Water-based and hot-melt systems cover most applications and still fall short on several specialised adhesives where solvent coating delivers properties nothing else matches. Capacity therefore leaves the market rather than converting, and supply of those specialised products tightens without anybody announcing it. Buyers discover the constraint when they try to increase volume. Customers typically receive twelve months of notice, which is not long enough to qualify an alternative through a full validation programme.
Market Impact: East Asia holds 34% of value

Market Opportunities and Growth Drivers

Bonded Assembly Keeps Replacing Mechanical Fastening

An acrylic foam tape reaching around 1.4 megapascals in shear distributes load across a whole joint rather than concentrating it at a fastener, which allows thinner materials, dissimilar substrates, and surfaces without visible fixings. Vehicle lightweighting, thin electronics, and facade systems all push that substitution forward continuously. Assembly already carries 41% of volume. Qualification running roughly 26 months makes each conversion slow to win and correspondingly slow for a competitor to take away afterwards. Distributing load across a whole joint rather than concentrating it at a fastener also removes the stress raisers that thin panels cannot tolerate at all.
Market Impact: Assembly is 41% of volume

Battery and Semiconductor Power Density Pulls Thermal Tapes

Rising power density in electric vehicle packs, data centre hardware, and power electronics creates heat that has to move somewhere, and thermally conductive tapes both bond and conduct in a single layer where a separate pad and adhesive once sat. Electrical insulation requirements complicate the formulation considerably. Demand tracks battery and semiconductor build rates rather than any general industrial cycle, which makes it usefully independent of packaging and construction volumes. Filler loading raises thermal conductivity and reduces adhesion at the same time, which is the formulation problem, and suppliers who solve it hold qualified positions for years afterwards.
Market Impact: Qualification runs 26 months long

Market Restraints and Challenges

Procurement Tenders Assembly Tape Against Packaging Rolls

A structural bonding tape and a carton sealing roll share a name, a coating line, and essentially nothing else, yet procurement functions routinely tender them together against a price per square metre. The root cause is category management rather than any technical confusion among engineers. Suppliers mitigate by separating the two commercially, by engaging design engineering during product development rather than at tender, and by refusing to quote assembly products into packaging tenders at all. Engineering frequently intervenes weeks later to preserve a qualified specification procurement had already quietly tendered away.
Market Impact: Debondable adoption reaches 11%

Qualification Length Blocks Entry and Protects Incumbents

Approval for a series production assembly application runs around 26 months through substrate testing, environmental ageing, and process validation before a single roll ships commercially. The root cause is that a failed bond on a moving vehicle or a battery pack is a safety event rather than a quality complaint. Challengers mitigate by targeting new programmes rather than replacements, by qualifying during a customer's own redesign cycle, and by accepting that switching an established joint almost never happens. Switching an established joint on a vehicle in production almost never happens for commercial reasons alone.
Market Impact: Abatement costs USD 14 million
4 additional market trends, 3 additional growth drivers, and 2 additional restraints and challenges are covered in the full report. Contact sales@marketmindsadvisory.com to access the complete intelligence.

Segment CAGR and Growth Architecture

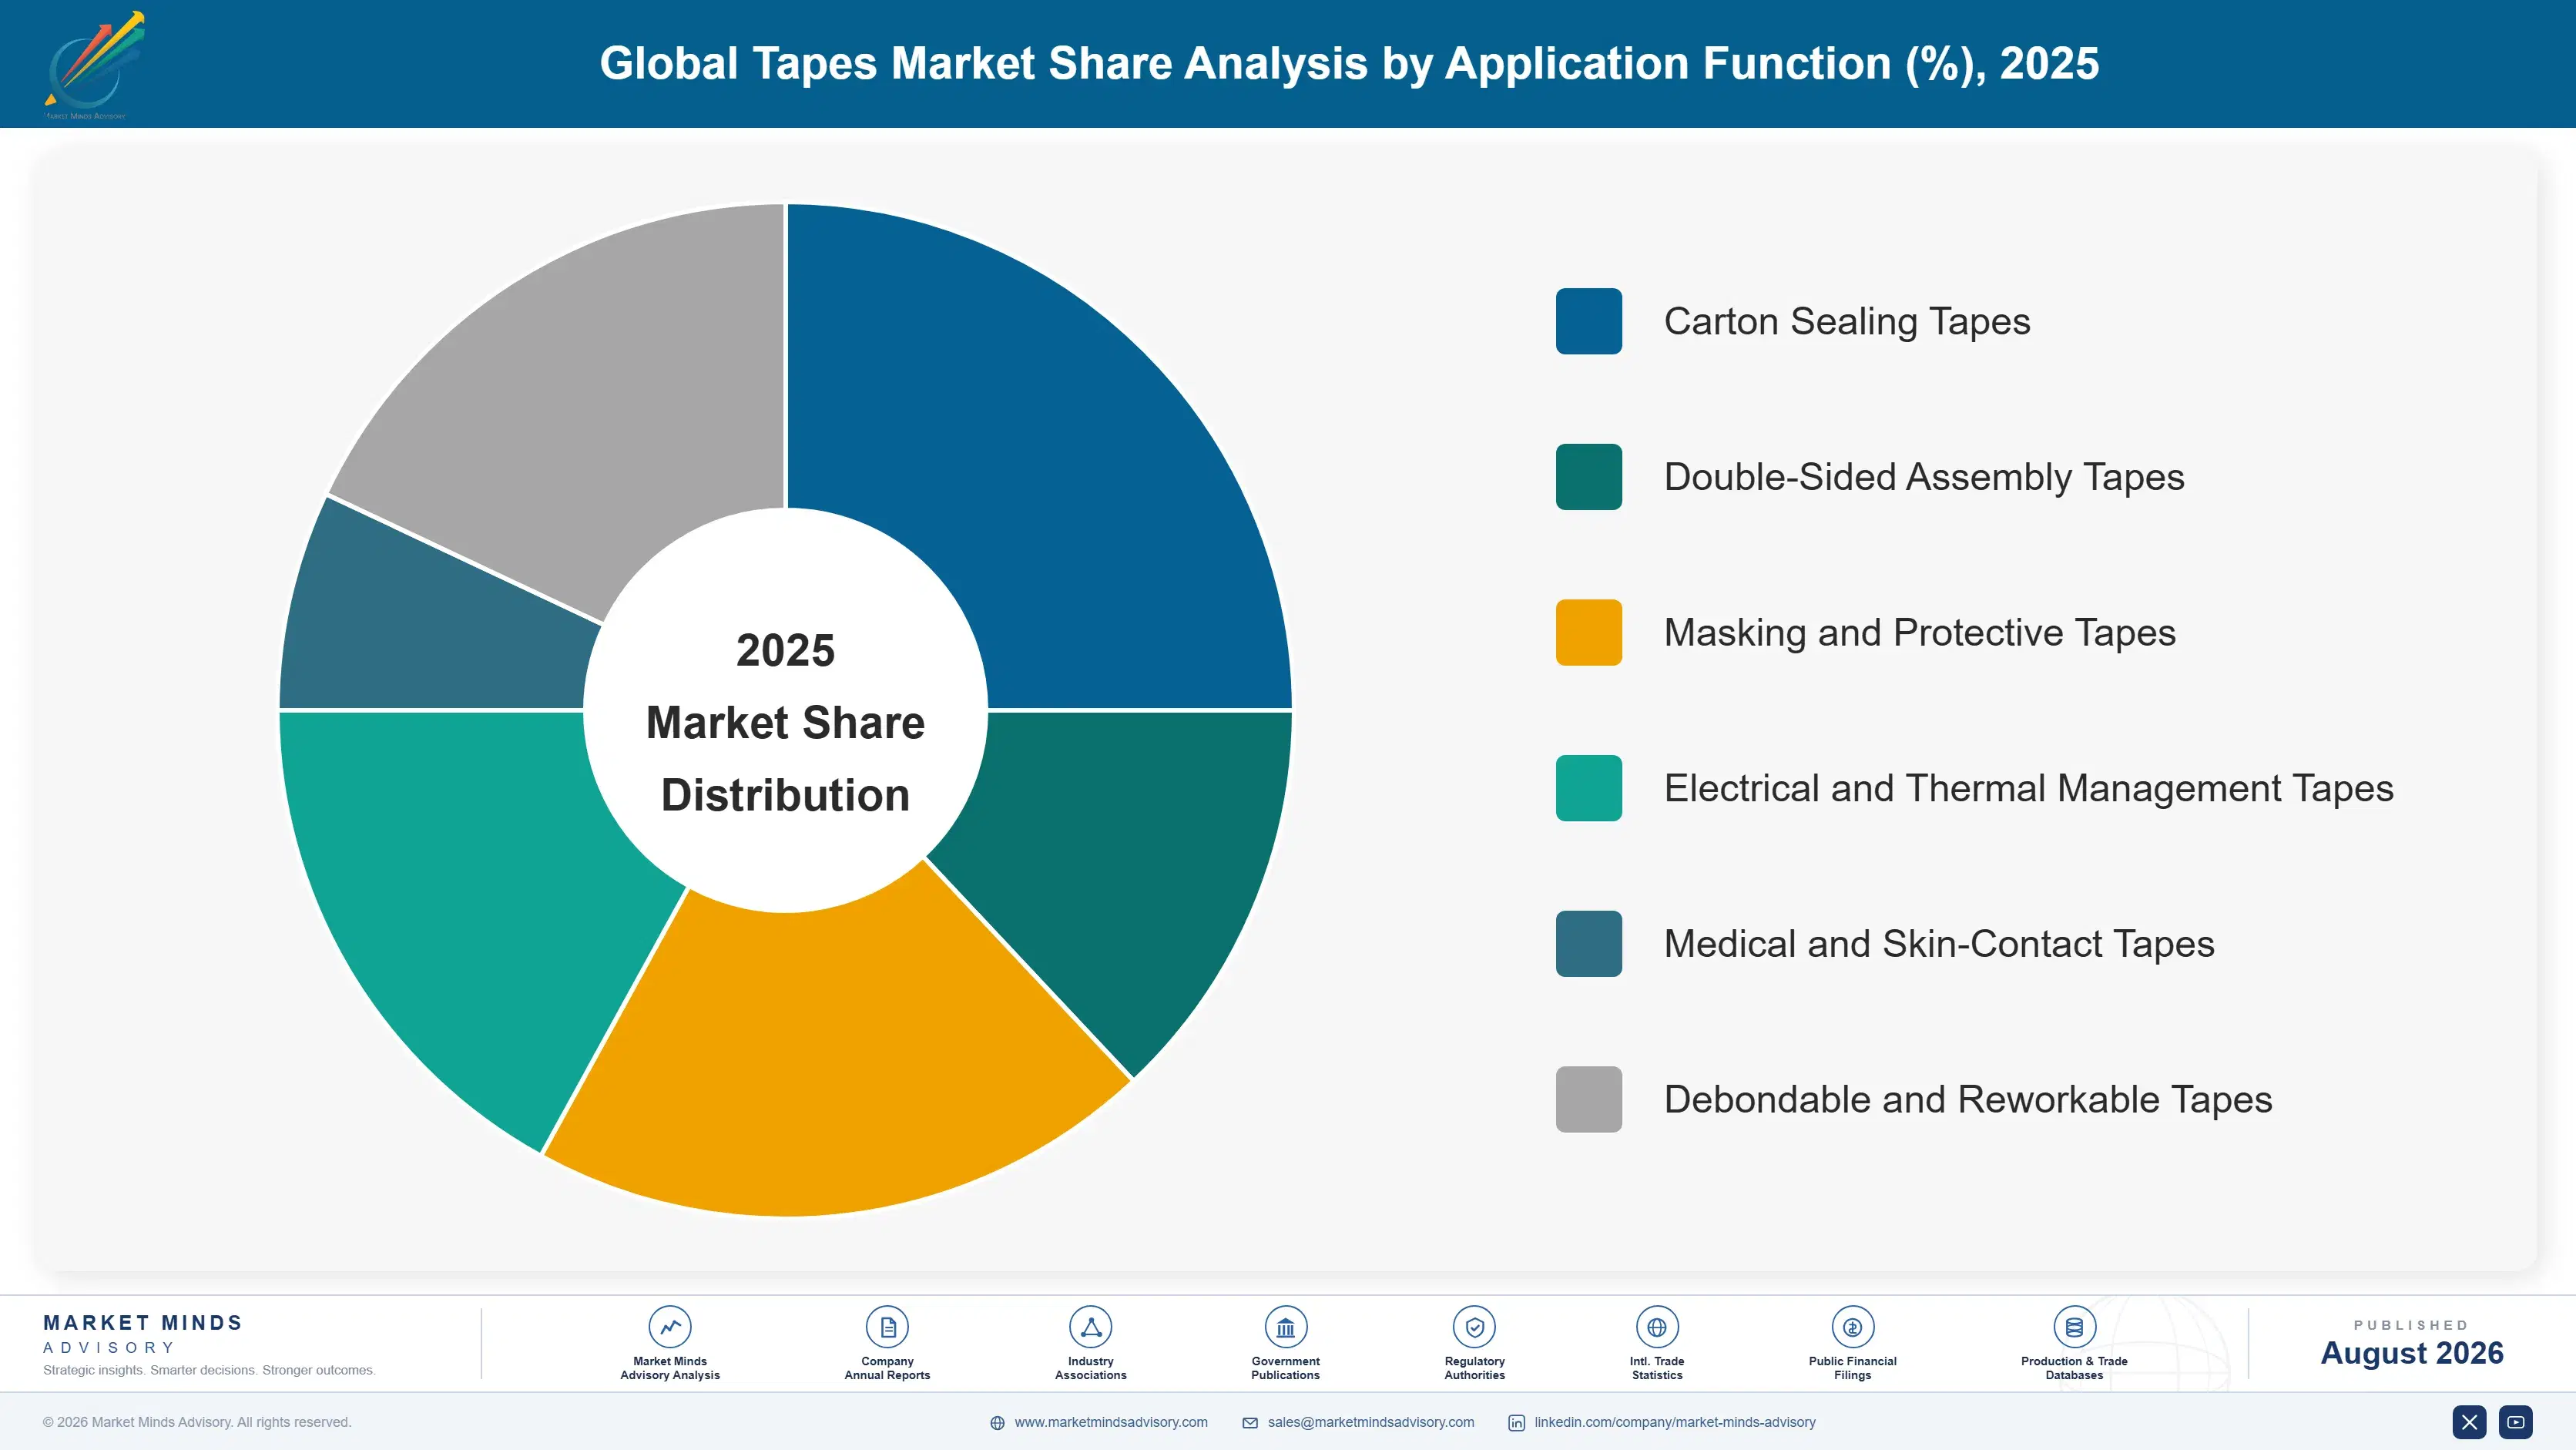
Segmentation follows application function, because carrier, adhesive chemistry, and performance requirement differ enough between uses that products share little beyond a coating line. Six functions cover commercial supply, and the divide between packaging consumables bought on price and engineered bonds qualified into a product matters more commercially than any distinction between adhesive chemistries. Chemistry matters less than function.
global-tapes-market-2025-2035-market-share-analysis-1787553590649

Debondable and Reworkable Tapes

The fastest function at 15.6%, roughly 2.69 times the market, releasing deliberately on heat, electrical current, or a pull-tab so a bonded assembly can be opened for repair, servicing, or recycling. Battery pack disassembly, electronics servicing, and display bonding drive most current demand. The engineering problem is holding full strength through the product's working life and then releasing reliably on command, which is a harder requirement than either property alone. Adoption reaches 11% of assembly volume and validation rather than cost is now the main obstacle. Vehicle programmes still in design are where these conversions are winnable, since redesigning a bonded joint already in production means repeating validation nobody wants to fund twice over.
CAGR 15.6%

Electrical and Thermal Management Tapes

Second fastest at 9.4%, combining bonding with thermal conduction or electrical insulation in a single layer where a separate pad, film, and adhesive previously sat. Electric vehicle battery packs, data centre hardware, and power electronics all generate heat that must move while remaining electrically isolated, which are contradictory requirements a filled adhesive has to reconcile. Filler loading raises conductivity and reduces adhesion simultaneously. Demand follows battery and semiconductor build rates rather than any general industrial cycle, which makes it independent of most other segments. Electrical isolation and thermal conduction pull in opposite directions within the same filled layer, and reconciling them is what separates suppliers who can serve battery packs from those who cannot.
CAGR 9.4%
Full segment breakdown across 6 segments available in the complete report.

Regional Architecture and Country Demand Map

Regional shares follow electronics and vehicle assembly rather than consumption, since assembly tapes are qualified into products built in specific plants. East Asia sits above the standard band for the reason stated below, and every other region falls inside its range. Consumption figures mislead badly here.

North America

Vehicle assembly, aerospace, and construction drive most assembly tape demand, with acrylic foam bonding well established across body panel, trim, and facade applications. 3M holds an unusually strong domestic position built on formulation depth and long-established engineering relationships. Right-to-repair legislation at state level is beginning to create debondable requirements that had not existed before. Packaging tape volume is large and competes purely on price. Growth of 5.6% depends on assembly conversion continuing rather than on any packaging recovery. Debondable requirements are arriving state by state rather than federally, which fragments the pressure and leaves manufacturers uncertain which programmes genuinely need release mechanisms and which do not. That uncertainty is slowing conversion considerably.
Share: 22% | CAGR: 5.6% (2026 to 2036)

Western Europe

Repairability and battery recycling regulation is the most advanced anywhere, which turns debondable bonding from an engineering preference into a design requirement across electronics and electric vehicle applications. tesa holds a strong regional position with genuine assembly formulation depth. Solvent coating emission limits are also tightest here, and several lines have closed rather than absorbed abatement capital. Facade and construction bonding is well established. Growth of 4.4% is the slowest anywhere, reflecting weak vehicle and electronics production despite advanced specification requirements. Solvent line closures here have already removed specialised grades from the market, and customers who depended on them discovered the position only when a twelve month discontinuation notice arrived unannounced.
Share: 21% | CAGR: 4.4% (2026 to 2036)
Regional intelligence for 5 additional markets available in the complete report: East Asia, South Asia and Pacific, Latin America, Middle East and Africa, Eastern Europe. Contact sales@marketmindsadvisory.com.
global-tapes-market-2025-2035-country-cagr-analysis-1787553591165

Four Moves Worth Real Capital

Advantage here comes from bonds that break on command, from reaching design engineering before procurement gets involved, and from capacity decisions competitors are quietly avoiding. Four moves justify capital across the forecast period, and the first answers a requirement regulation created rather than any customer request. Coating capacity on its own answers none of them.

Engineer bonds that release on deliberate command

Battery recycling rules, right-to-repair legislation, and servicing requirements all assume a bonded product comes apart again, which permanent acrylic adhesion was designed to prevent. Debondable systems grow at 15.6% against a market rate of 5.8% and reach only 11% of assembly volume, held back by validation rather than by any conceptual difficulty. Holding full strength for a decade and then releasing reliably is a harder specification than either property alone, and very few suppliers have solved it. Vehicle programmes still in design are where this work is winnable, since redesigning a production joint means repeating validation.
Market Impact: Serves the 89% of bonds that remain permanent

Reach design engineering before procurement does

A structural bonding tape and a carton sealing roll share a name and a coating line and nothing else, yet procurement routinely tenders them together on price per square metre. Qualification runs around 26 months and happens with design engineers during product development, years before any purchase order exists. Suppliers engaged at that stage are specified into a joint. Those arriving at tender are quoting against a decision somebody else made and cannot now revisit. Declining to quote assembly products into packaging tenders is commercially uncomfortable and it is the only position that holds the qualification.
Market Impact: Wins a qualification cycle running 26 full months

Decide the solvent line question deliberately

Bringing one solvent coating line within emission limits costs roughly 14 million dollars, and operators mostly close rather than convert, which means specialised adhesive capacity is leaving the market quietly. Suppliers who invest hold supply positions on products water-based systems cannot match, and buyers discover that constraint only when they try to grow volume. Choosing deliberately rather than deferring is the point, since capacity that retires does not come back afterwards. Customers typically receive twelve months of discontinuation notice, which is not enough time to qualify an alternative through a full validation programme anywhere.
Market Impact: Weighs a USD 14 million line abatement decision

Build thermal capability against battery build rates

Electric vehicle packs, data centre hardware, and power electronics all generate heat that must move while staying electrically isolated, and filled adhesives reconcile those contradictory requirements in a single layer. Thermal and electrical tapes grow at 9.4% on build rates independent of packaging or construction cycles. Filler loading raises conductivity and cuts adhesion at the same time, which is the formulation problem, and suppliers who solve it hold positions qualification then protects for years. Display bonding and semiconductor packaging demand similar precision at thicknesses general industrial suppliers have never attempted to coat at all.
Market Impact: Enters a segment currently growing 9.4% each year

Who Controls the Margin Pool

Concentration sits at roughly 38% for the top five on tape supply revenue, held by adhesive formulation and coating capability rather than by any difficulty in slitting and packing a roll. 3M holds the broadest formulation depth across every application family. tesa is strong in European automotive and electronics assembly, Nitto Denko leads Asian electronics applications, Avery Dennison brings material science depth, and Lintec holds specialised display and semiconductor positions.
Competition runs on three dimensions. Adhesive formulation capability is the first, since a filled thermal adhesive or a debondable system is genuinely hard to develop. Design engineering access is the second, because qualification happens years before purchase. Coating capacity is the third, and solvent line decisions are quietly reshaping who can supply what. None of the three is solved by more coating width.

Pressure is building from two directions. Regional manufacturers supply packaging and general industrial tape at prices international suppliers cannot approach anywhere. Repairability regulation is making permanent bonding a liability in applications that were settled a few years ago. Rankings will shift toward suppliers holding debondable capability and design engineering access rather than toward whoever coats most cheaply. Coating capacity has stopped being a defensible position at all.
global-tapes-market-2025-2035-company-positioning-matrix-1787553591682

Competitive Moat and Risk Dimensions

3M

Moat: Formulation depth across application families

3M develops adhesive chemistry across acrylic, silicone, rubber, and specialised filled systems, which lets it answer a bonding problem rather than offer a product from a catalogue. That depth reaches design engineers during development, where qualification decisions are actually made. Coating capability across solvent, water-based, and hot-melt routes lets it choose the process a property requires.
3M

Risk: Permanent bonding legacy position

Decades of specifying permanent acrylic foam bonds into vehicles, electronics, and buildings created an installed position that repairability regulation is now working directly against. Debondable systems require rebuilding joints the company originally designed to be irreversible. Competitors without that legacy can propose release mechanisms without appearing to contradict their own earlier engineering advice to the same customers.
TESA

Moat: European automotive assembly engineering

tesa works inside European vehicle and electronics development programmes on bonding solutions rather than supplying to a specification, which places it in the design conversation where qualifications begin. That access is built over model cycles rather than won in a tender. Proximity to the regulation shaping those requirements also gives early sight of what customers need next.
TESA

Risk: European production volume exposure

Strength in European vehicle and electronics assembly ties results to production volumes that have weakened and show limited signs of recovering to earlier levels. Asian assembly carries the growth and competitive positions there are held by suppliers with equally deep local engineering relationships. Building comparable design access in another region takes model cycles rather than commercial effort alone.

Players Tracked

Prominent Players

3M
tesa
Nitto Denko
Avery Dennison
Lintec

Other Key Players

Shurtape Technologies
Intertape Polymer Group
Scapa Group
Berry Global
Saint-Gobain
Henkel
Sika
Achem Technology
Yongguan Adhesive
Toyochem
DIC Corporation
Rogers Corporation
Parafix
Advance Tapes
Ajit Industries

Recent Developments

MARCH 2025

Battery pack redesign specifies debondable module bonding

A vehicle manufacturer redesigned a battery pack around debondable module bonding after recycling assessments showed the existing permanent adhesive made cell recovery uneconomic at end of life. Bond strength through the service life was required to remain entirely unchanged throughout. The additional cost was accepted without argument.
Signal: End-of-life economics are now entering bonding specifications during the original design phase rather than afterwards entirely
JULY 2025

Manufacturer closes solvent coating line rather than abate

A tape manufacturer closed a solvent coating line rather than fund the emissions abatement capital required to keep it operating, transferring what products it could to water-based systems and discontinuing several specialised grades outright. Customers were given twelve months of notice. No alternative existed for two grades.
Signal: Specialised adhesive capacity is retiring rather than converting, and buyers generally learn of it only afterwards
NOVEMBER 2025

Procurement tender bundles assembly and packaging tape

A manufacturer tendered structural assembly tape alongside carton sealing rolls in a single category exercise priced per square metre, and the incumbent assembly supplier declined to participate. Engineering intervened to preserve the qualified bonding specification several weeks later. The original bonding specification eventually survived the process intact.
Signal: Category management still routinely bundles products that share a name and nothing else technically at all

What the Coating Line Costs

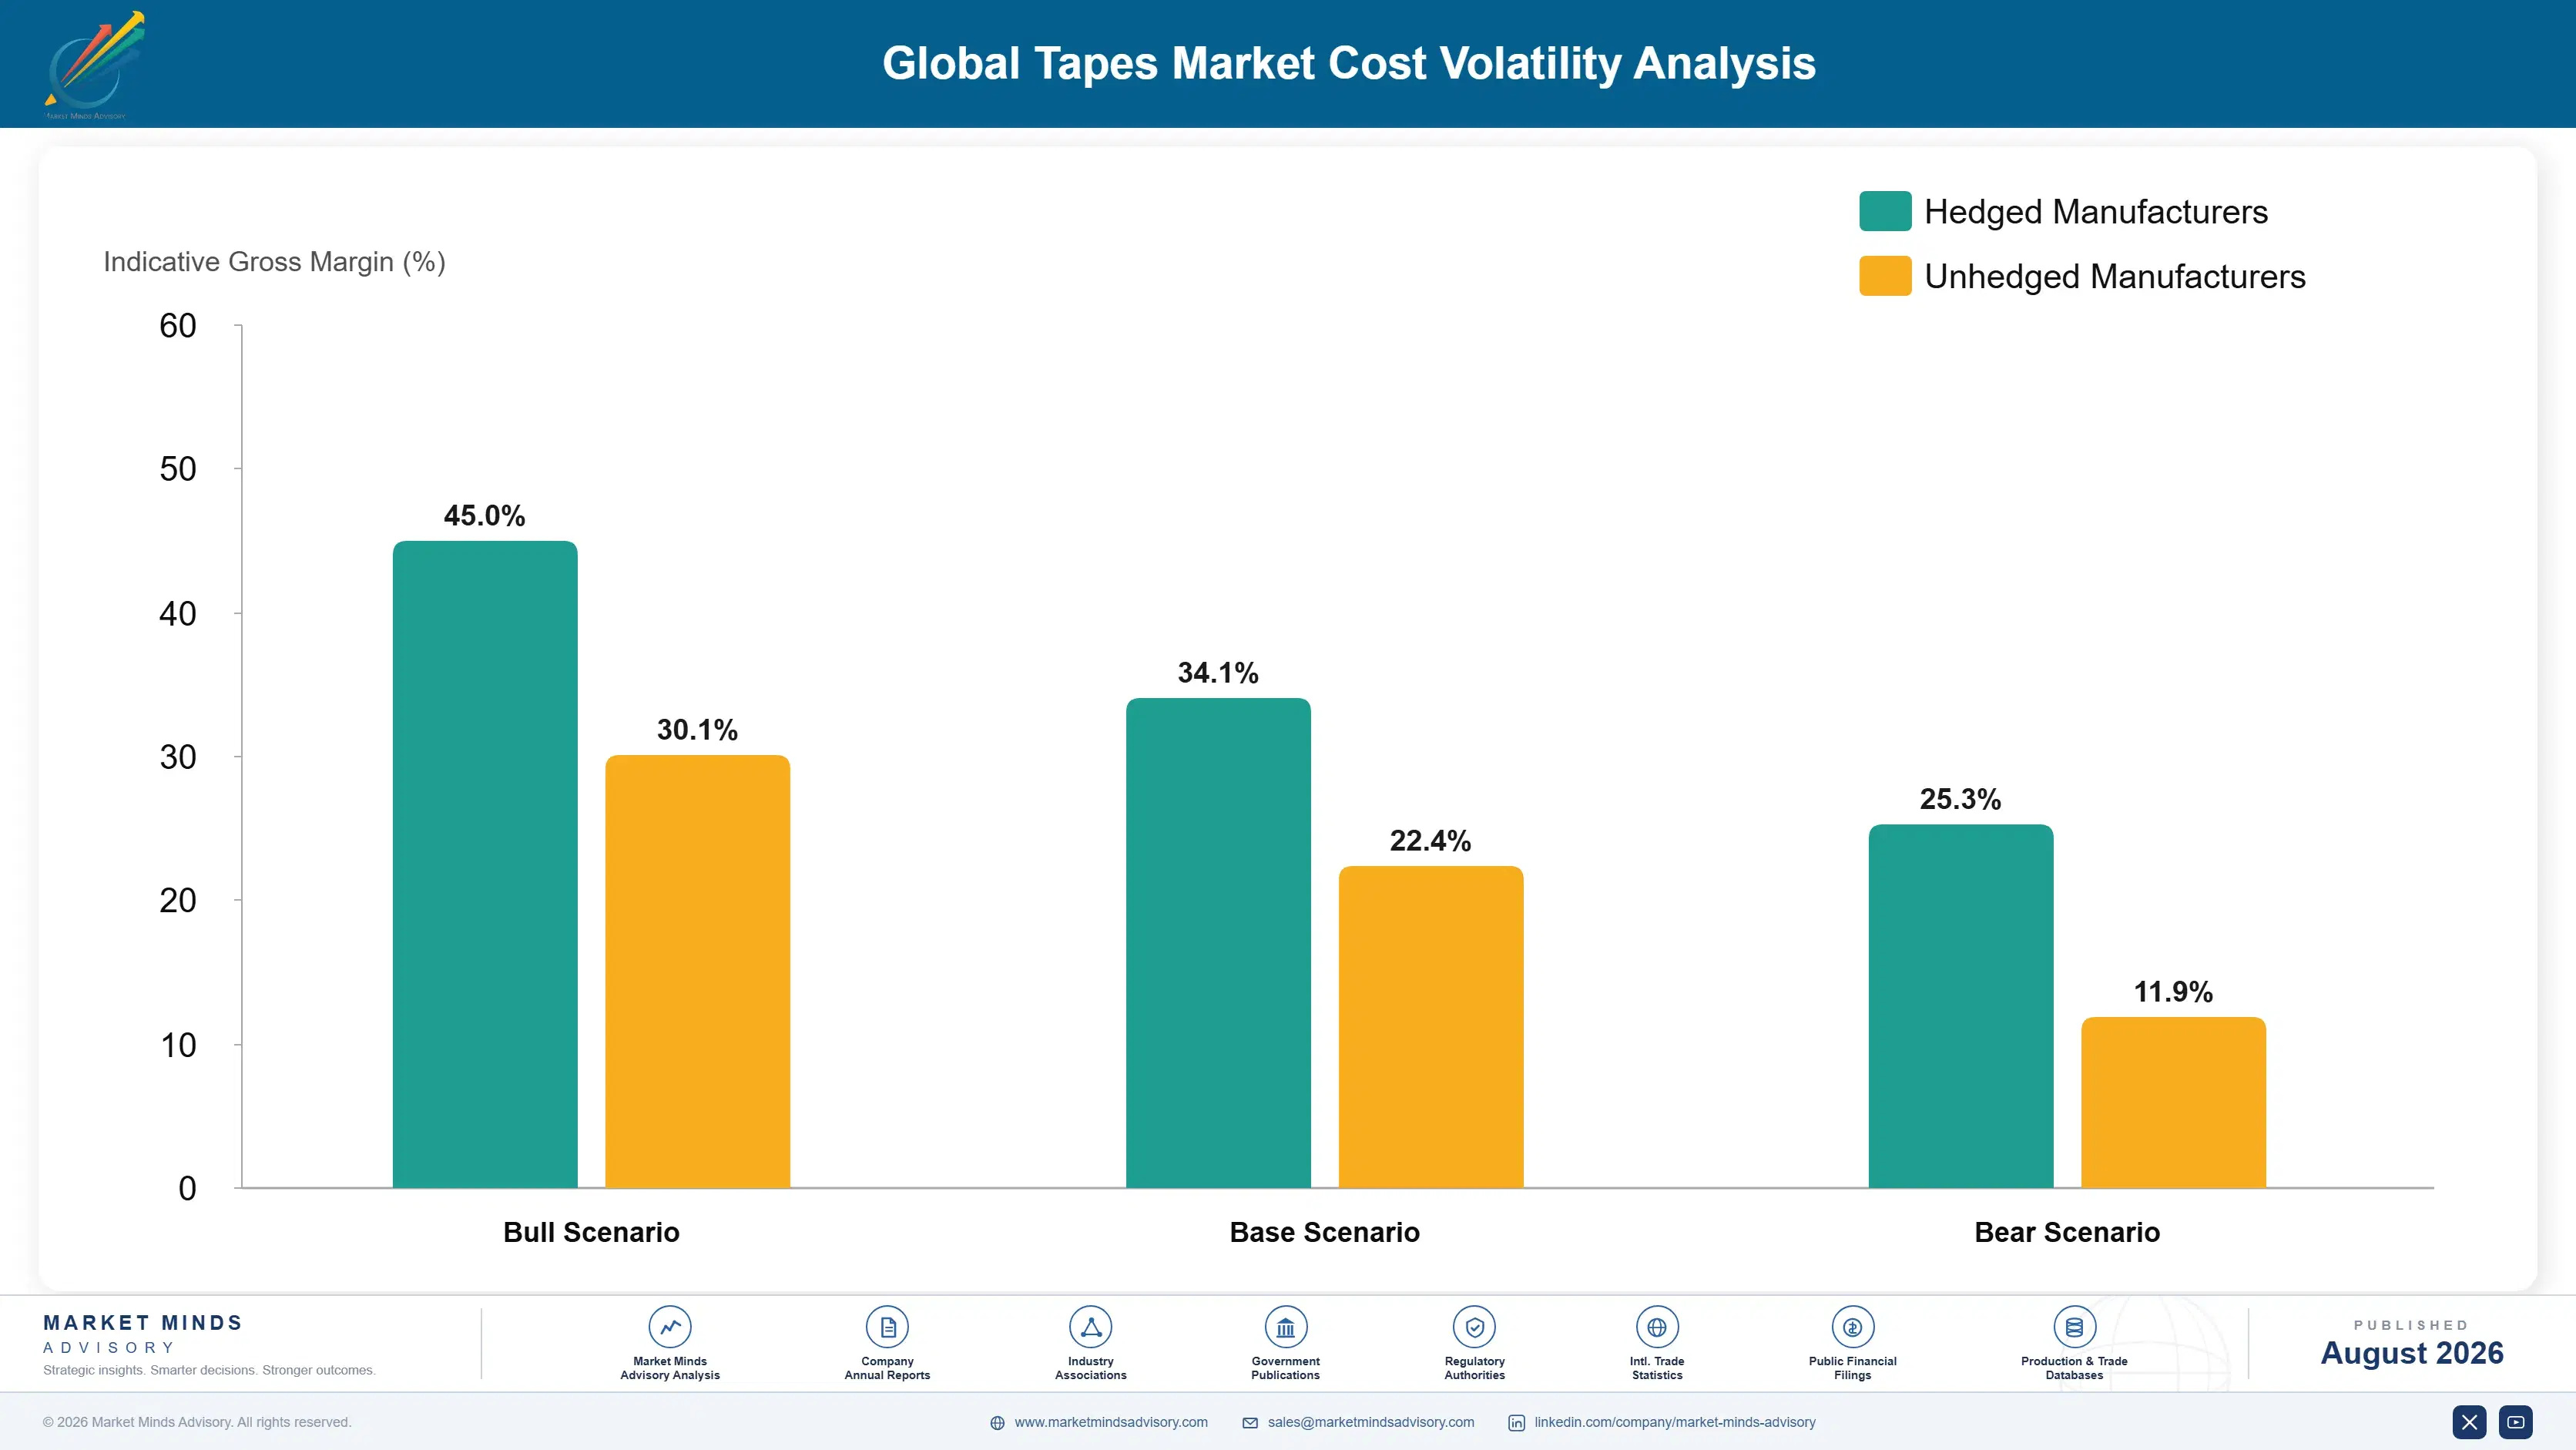
Adhesive raw materials dominate at roughly 39% of manufacturing cost, spanning acrylic monomers, synthetic rubber, silicone, tackifiers, and thermally conductive fillers. Carrier films, foams, and release liners take a further 24%. Coating and curing energy absorbs 13%, rising sharply on solvent lines where drying and recovery both consume power. Emissions abatement and solvent recovery carry most of the remainder on lines that still operate.
Acrylic monomer and synthetic rubber pricing moved sharply through 2021 and 2022 on petrochemical feedstock costs, and manufacturers on annual industrial customer agreements absorbed most of it. 3M and tesa both discussed raw material cost pressure and pricing actions in their reporting for those years. Silicone availability tightened separately, which affected medical, electronics, and release liner supply considerably more than general industrial tape. Manufacturers on solvent lines carried recovery costs alongside the monomer movement.

Exposure divides on coating process and application mix rather than on scale. Solvent line operators carry recovery, abatement, and energy costs that water-based coating avoids entirely. Application mix matters more still: qualified assembly and thermal products carry margins that absorb input movement comfortably, while packaging tape competing against regional manufacturers has essentially no cushion when monomer prices move against it.
global-tapes-market-2025-2035-cost-volatility-analysis-1787553591876

Index industrial agreements to monomer references

Adhesive raw materials at 39% of manufacturing cost move on petrochemical feedstock prices that no tape manufacturer influences, yet annual industrial customer agreements routinely fix pricing across that exposure. Indexation to published monomer references removes the mismatch. Customers carrying identical exposure through every alternative supplier accept it far more readily than commercial teams usually anticipate they will.

Qualify water-based routes before lines close

Solvent capacity is retiring rather than converting across the industry, and a manufacturer discovering that mid-programme has no route to supply. Qualifying water-based or hot-melt alternatives for products where performance permits should happen before a line closes rather than afterwards. Some specialised adhesives will never transfer, and knowing which ones those are is worth establishing deliberately.

Separate packaging and assembly commercial terms

Packaging tape has no margin cushion when monomer prices move while qualified assembly products absorb the same movement comfortably, yet bundled agreements average the two into a single price position. Separating them commercially lets each be priced against its own cost reality. It also stops assembly margin quietly subsidising a packaging business competing against regional manufacturers.

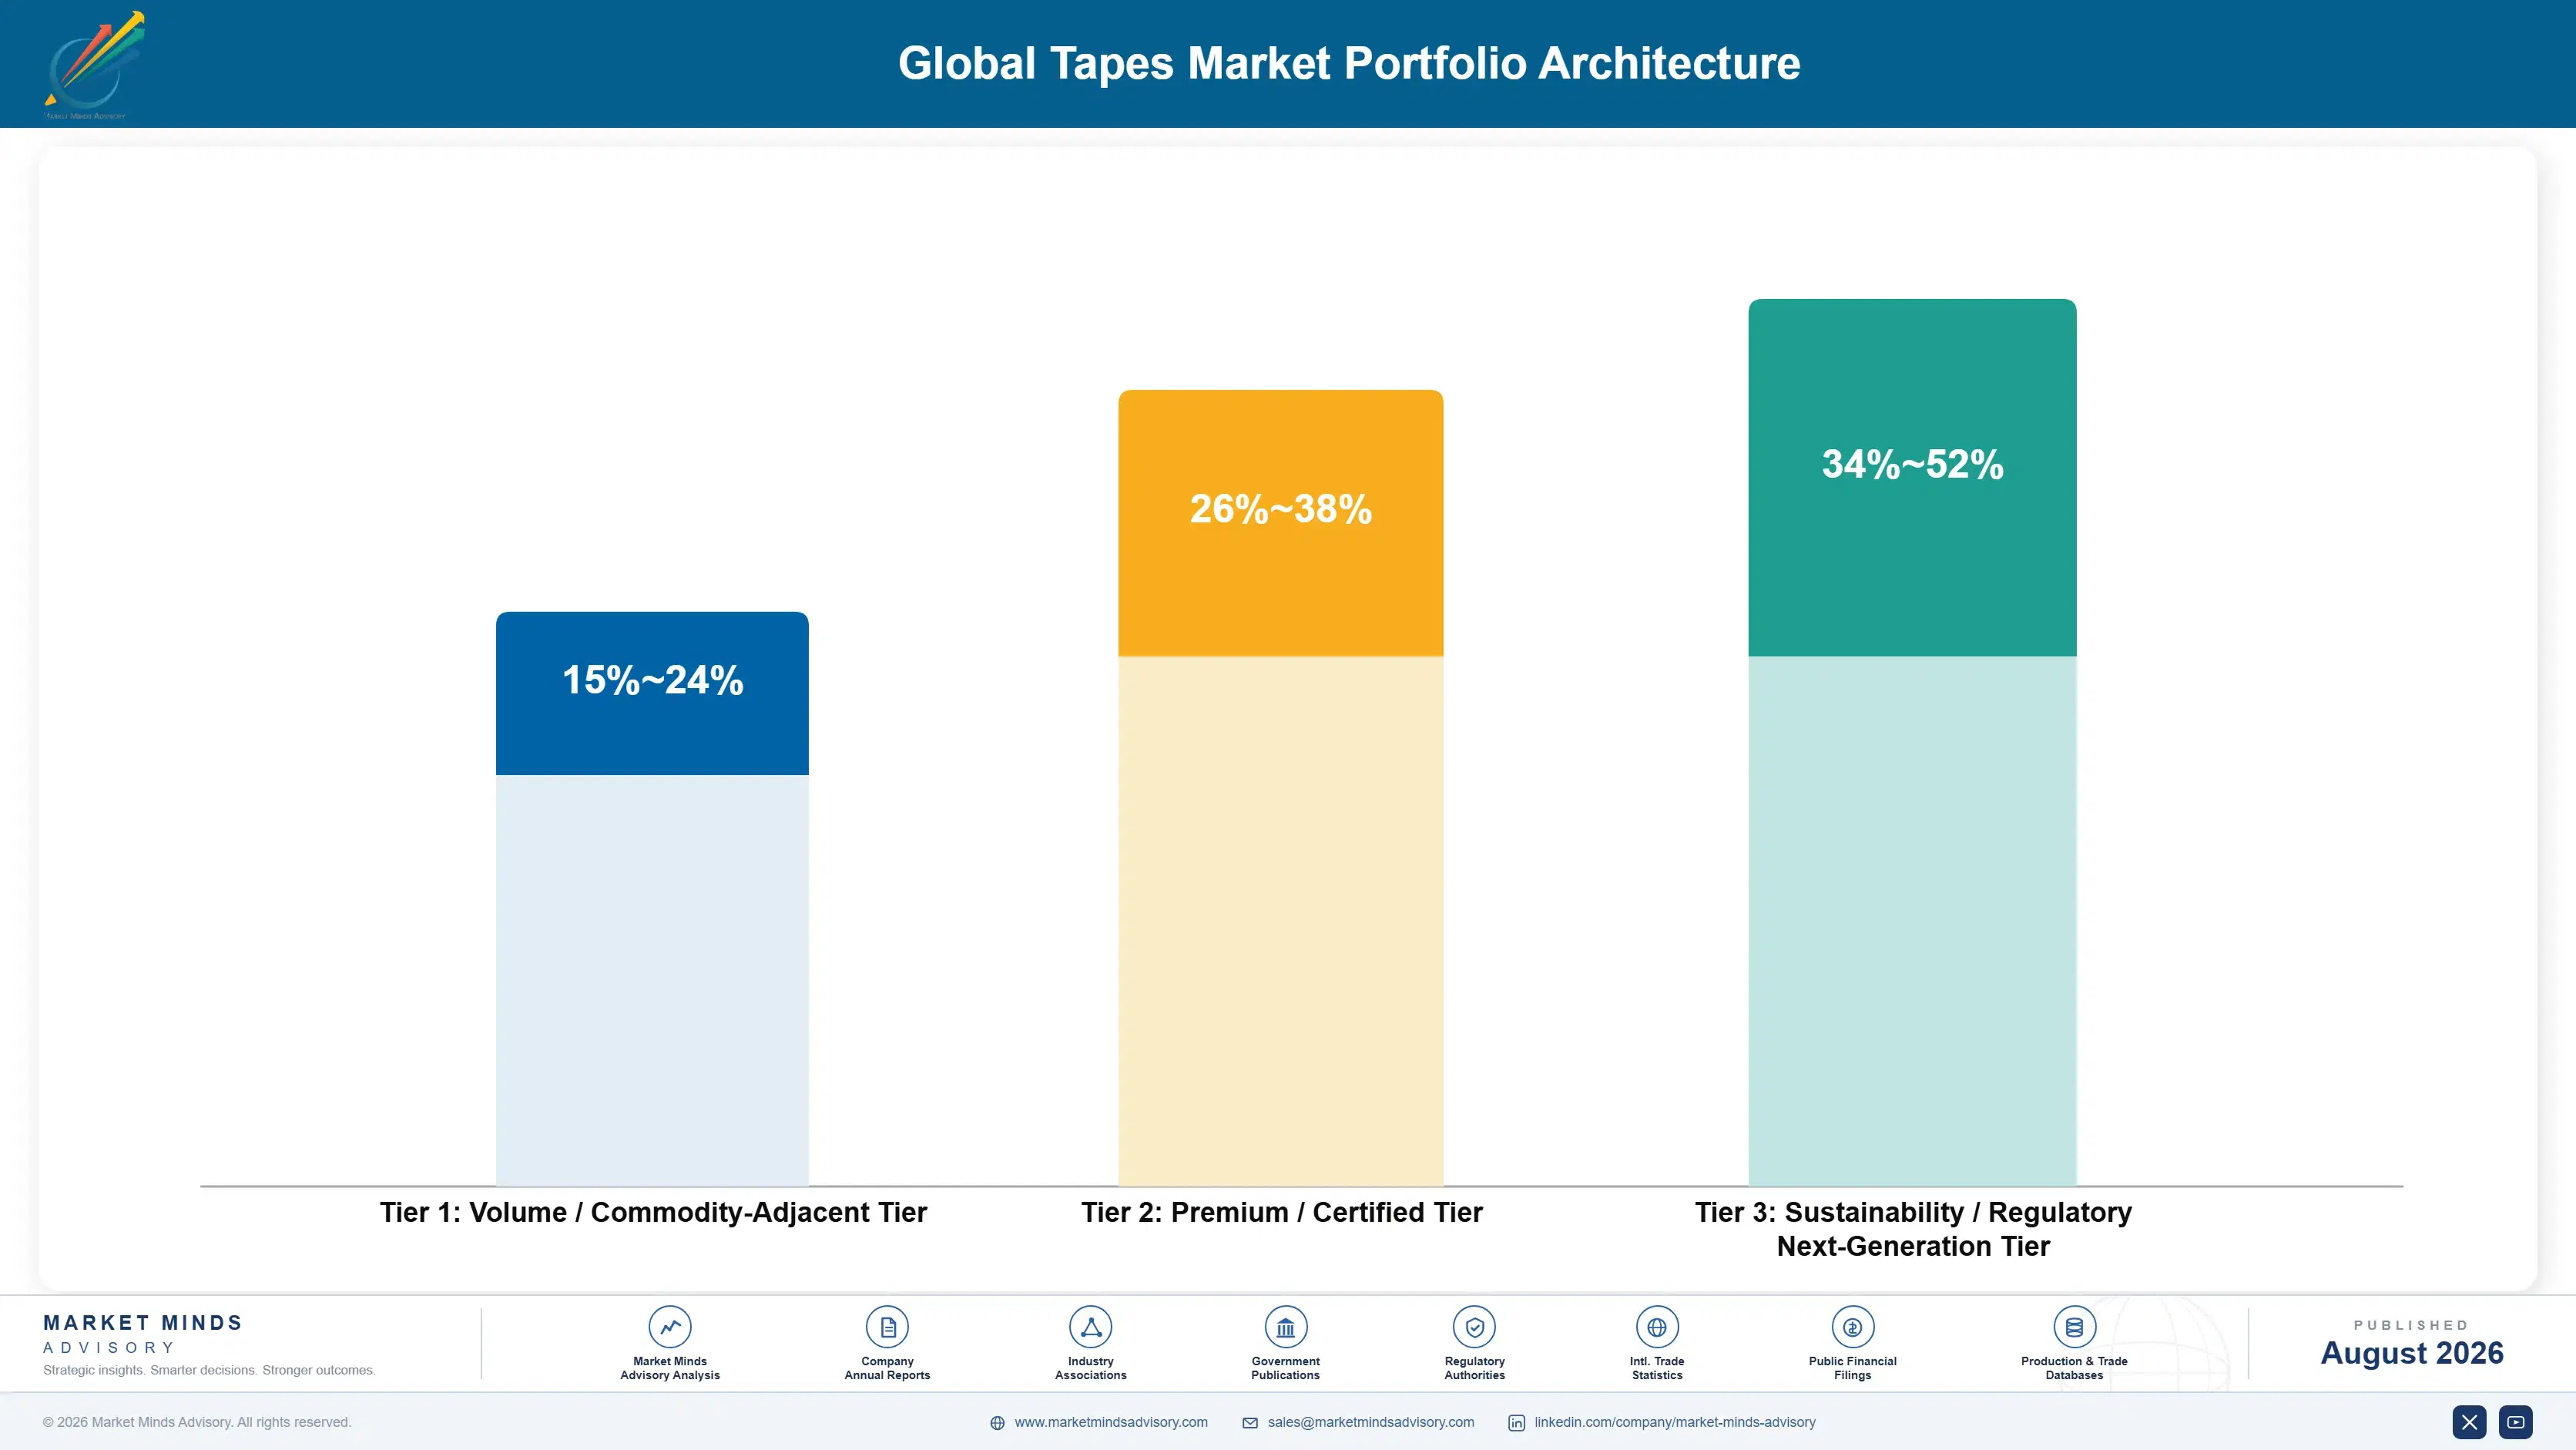
Portfolio Architecture for Margin Defence

Margin architecture separates products that were qualified from products that were purchased. Carton sealing and general industrial tape competes on price per square metre against regional manufacturers and earns very little regardless of volume. Masking and protective grades earn more on performance consistency. Qualified assembly, thermal, and medical products earn most, because a 26-month approval and a safety consequence make substitution close to unthinkable.
The volume and premium tension shows in how a supplier handles category tendering. Procurement functions bundle assembly and packaging tape because both are called tape, and a supplier accepting that framing prices an engineered joint against a commodity roll. Declining to quote assembly products into packaging tenders is commercially uncomfortable and it is the only position that protects the qualification the customer's own engineers requested. Very few sales organisations hold that line consistently.

High-value pools concentrate in debondable systems that regulation now requires, thermal and electrical products tracking battery build rates, and specialised solvent-coated adhesives whose capacity is retiring across the industry. Each is defended by formulation capability or process investment rather than by coating cost, which regional manufacturers already match on anything undifferentiated. Coating cost defends nothing on anything undifferentiated at all.

Volume / Commodity-Adjacent Tier

Carton sealing, stationery, and general industrial tape sold on price per square metre against regional manufacturers with lower cost bases. Nothing in the product defends a position. Volume is large and returns are correspondingly thin throughout.
Gross Margin: 15%-24%

Premium / Certified Tier

Masking, protective, and surface preparation grades where consistency, clean removal, and substrate compatibility genuinely differ between suppliers. Performance rather than qualification defends this. The range reflects wide variation between industrial and automotive refinish applications.
Gross Margin: 26%-38%

Sustainability / Regulatory / Next-Generation Tier

Debondable systems answering repairability regulation, thermal and electrical management products, and specialised solvent-coated adhesives with retiring capacity. Formulation capability and qualification both defend pricing firmly. The range is wide because these applications differ substantially in maturity.
Gross Margin: 34%-52%
global-tapes-market-2025-2035-portfolio-architecture-1787553592377

High-value Sub-segments and Strategic Watch-out

Debondable Bonding Systems

Growing at 15.6% because repairability and battery recycling rules now assume bonded products come apart, which permanent acrylic adhesion was specifically engineered to prevent from happening at all. Vehicle programmes still in the design phase are where these conversions are genuinely winnable at all now.
Gross Margin: 38%-52%

Thermal and Electrical Management

Growing at 9.4% on battery and semiconductor build rates rather than any general industrial cycle, with filler loading raising conductivity and cutting adhesion as the central formulation problem. Reconciling conduction against electrical isolation in one filled layer separates the suppliers who can serve battery packs from those who cannot.
Gross Margin: 34%-46%

Specialised Solvent-Coated Grades

Capacity is retiring rather than converting as operators decline a 14 million dollar abatement bill, which quietly tightens supply of adhesives that water-based systems still cannot match. Twelve months of discontinuation notice is nowhere near enough time to qualify any alternative grade properly at all.
Gross Margin: 32%-44%

Carton Sealing and General Industrial

The strategic watch-out. Regional manufacturers set pricing on undifferentiated product, monomer swings land straight on margin, and procurement bundles it with engineered assembly products anyway. Suppliers who accept that framing end up pricing an engineered structural joint against what is a plain commodity sealing roll.
Gross Margin: 15%-24%

How a Tape Gets Specified

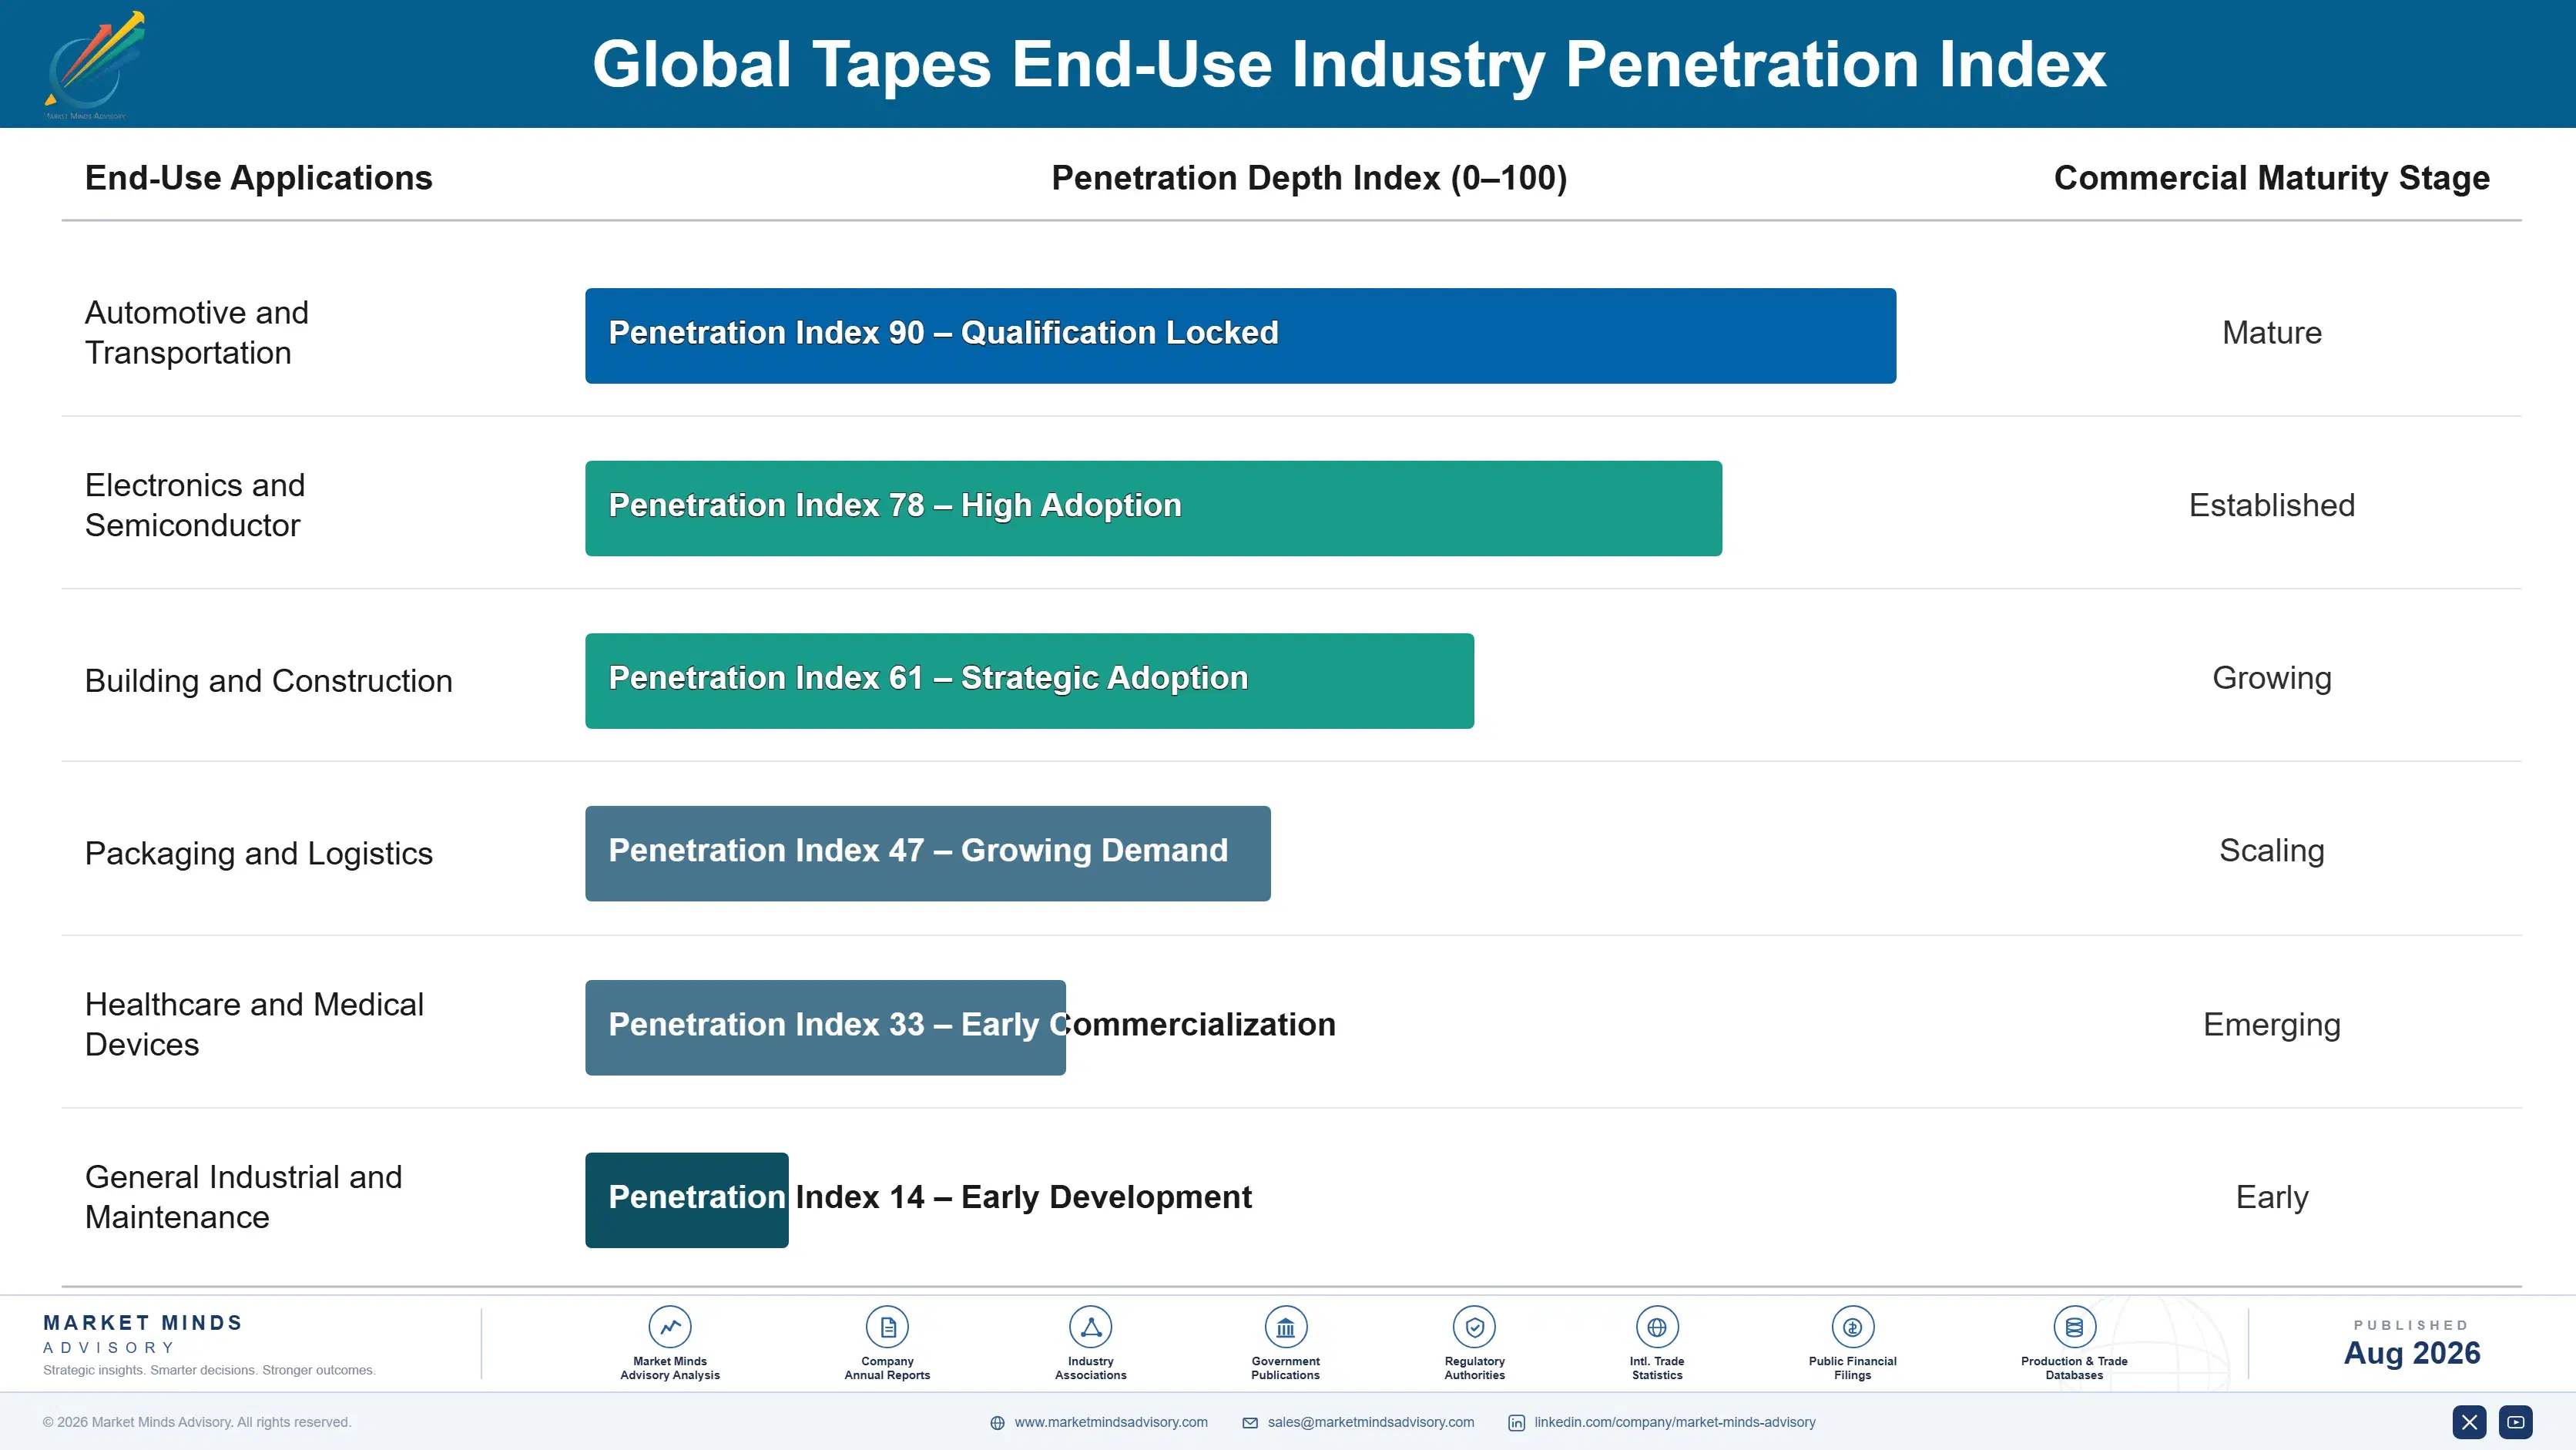
Demand reaches manufacturers through two routes that could hardly be less alike. Assembly and engineered products are qualified by design engineers during product development, over roughly 26 months of substrate testing, environmental ageing, and process validation, years before any purchase order exists. Packaging and general industrial tape is tendered annually by procurement against a price per square metre with several qualified alternatives available. The same supplier frequently serves both without distinguishing between them.
Stickiness follows the qualification entirely. An assembly tape written into a bill of materials holds for the product's production life, because changing it means repeating the validation and accepting a safety consequence. Masking and protective grades hold through process familiarity. Packaging tape holds until the next annual tender closes. Nothing about the product itself holds the packaging half.

The deciding buyer for the growth half of this market is a design engineer who will never meet a salesperson from a packaging category team. Those people evaluate substrate compatibility, ageing behaviour, and now disassembly. Suppliers organised around procurement relationships are competing for the volume that moves annually and missing the work that does not. That gap has cost suppliers work they never knew existed.
global-tapes-market-2025-2035-end-use-penetration-index-1787553592863

What the Regulation Changed

These are among the four positions where our research anticipates prominent divergence between winners and laggards over the coming forecast period. Each is grounded in the demand model, the regulatory perimeter, and the announced capacity pipeline.
01 / DEBONDING CAPABILITY DEVELOPMENT

Build bonds that come apart on command

Battery recycling requirements, right-to-repair legislation, and electronics servicing rules all assume a bonded product can be taken apart again, which permanent acrylic adhesion was specifically engineered to make impossible in the first place. Debondable systems grow at 15.6% against a market rate of 5.8% and still reach only 11% of assembly volume, held back by validation work rather than by any conceptual difficulty at all. Holding full strength for a decade and releasing reliably afterwards is harder than either property alone.
02 / DESIGN ENGINEERING ACCESS

Be in the development room, not the tender

An engineered structural bond and a carton sealing roll share a name, a coating line, and essentially nothing else, yet procurement functions routinely tender them together against a single price per square metre. Qualification for a series assembly application runs roughly 26 months and happens with design engineers during product development, years before any purchase order is ever raised. Suppliers engaged at that stage get specified into the joint, while those arriving at tender quote against a decision already taken.
03 / COATING CAPACITY DECISION

Decide the solvent line before it decides you

Bringing a single solvent coating line within emission limits costs roughly 14 million dollars in capital, and most operators facing that decision have closed the line rather than fund the abatement equipment that is required. Specialised adhesive capacity is therefore leaving the market quietly, and buyers discover the constraint only when they attempt to increase volume on an affected specialised grade. Suppliers who invest deliberately hold supply positions on products water-based systems cannot match, and retired capacity never comes back afterwards.
04 / THERMAL FORMULATION INVESTMENT

Solve conductivity against adhesion, then qualify

Electric vehicle packs, data centre hardware, and power electronics all generate heat that must move while the assembly stays electrically isolated, and filled adhesives reconcile those directly contradictory requirements within one single applied layer of adhesive. Thermal and electrical tapes grow at 9.4% on build rates entirely independent of packaging and construction cycles. Filler loading raises conductivity and reduces adhesion simultaneously, which is the actual formulation problem, and whoever solves it holds a position qualification then protects for years afterwards.

Engagement Snapshot From the Field

A live engagement with an industry participant carrying material or product regulatory and market exposure ahead of a defining policy shift, showing how our research translates into a defensible multi-year portfolio strategy.
MARKET MINDS ADVISORY · CLIENT ENGAGEMENT SUMMARY
Global Tapes Producer Strategic Portfolio Review and Transition Roadmap 2026·Investment Scenario on Global Tapes Exposure Evaluation 2025-26
CLIENT PROFILE
A European tape manufacturer with revenue near EUR 320 million (client-reported, unverified by MMA), producing packaging, masking, and assembly tapes across solvent and water-based coating lines. Debondable development had not begun, one solvent line faced abatement capital, and margins had compressed for four consecutive years running. Design engineering access had never once been built anywhere.
STRATEGIC CHALLENGE
Two automotive customers had asked for debondable battery module bonding the business could not supply, and both awarded the work elsewhere. Procurement functions were bundling assembly tape into packaging tenders the business kept quoting into. The solvent line decision had been deferred three times without resolution. Nobody had modelled what that line actually made.
MMA APPROACH
MMA analysed margin and win rates by application against qualification involvement, modelled solvent line abatement against the products only that line could make, and assessed debondable development requirements against customer redesign timetables. Forty-seven expert interviews with design engineers, procurement teams, battery pack developers, and recyclers established where specifications genuinely originate.
KEY FINDINGS
  1. Every assembly award won at full margin had involved the client's engineers during customer product development, and every one lost had been quoted into a procurement tender instead.
  2. Both debondable enquiries had come from vehicle programmes still in design, which meant the work was winnable and the business had no product to offer at all.
  3. Four specialised grades could only be made on the solvent line facing abatement, and two of them carried the highest margins anywhere in the portfolio.
  4. Assembly products quoted into packaging tenders had been priced per square metre alongside carton sealing rolls, which the client's own sales team had never once challenged.
CLIENT PROFILE
A European tape manufacturer with revenue near EUR 320 million (client-reported, unverified by MMA), producing packaging, masking, and assembly tapes across solvent and water-based coating lines. Debondable development had not begun, one solvent line faced abatement capital, and margins had compressed for four consecutive years running. Design engineering access had never once been built anywhere.
STRATEGIC CHALLENGE
Two automotive customers had asked for debondable battery module bonding the business could not supply, and both awarded the work elsewhere. Procurement functions were bundling assembly tape into packaging tenders the business kept quoting into. The solvent line decision had been deferred three times without resolution. Nobody had modelled what that line actually made.
MMA APPROACH
MMA analysed margin and win rates by application against qualification involvement, modelled solvent line abatement against the products only that line could make, and assessed debondable development requirements against customer redesign timetables. Forty-seven expert interviews with design engineers, procurement teams, battery pack developers, and recyclers established where specifications genuinely originate.
KEY FINDINGS
  1. Every assembly award won at full margin had involved the client's engineers during customer product development, and every one lost had been quoted into a procurement tender instead.
  2. Both debondable enquiries had come from vehicle programmes still in design, which meant the work was winnable and the business had no product to offer at all.
  3. Four specialised grades could only be made on the solvent line facing abatement, and two of them carried the highest margins anywhere in the portfolio.
  4. Assembly products quoted into packaging tenders had been priced per square metre alongside carton sealing rolls, which the client's own sales team had never once challenged.
RECOMMENDED STRATEGY
Phase 1: Phase one: refuse to quote qualified assembly products into packaging category tenders, and escalate to customer engineering when procurement bundles them. Phase 2: Phase two: commit the solvent line abatement capital, since four specialised grades and the portfolio's best margins depend entirely on that capacity. Phase 3: Phase three: begin debondable adhesive development targeting battery module bonding, working alongside vehicle programmes still in their early design phase rather than production.
OUTCOME
The client stopped quoting assembly products into packaging tenders and recovered pricing on two accounts within a year. Solvent line abatement was approved, debondable development began with one vehicle programme, and blended gross margin improved 6.8 percentage points (client-reported, unverified by MMA). A second vehicle programme has opened discussions.

Frequently Asked Questions

Foundational context covering the market sizes, CAGR, scope, country, region and competition that inform every finding below. This section is provided to cover basics and most often pre-purchase conversations, answered from the MMA Primary Research Dataset.

What is the current size of the Global Tapes Market?

The market was valued at USD 71.6 billion in 2025, rising to an estimated USD 75.75 billion in 2026. East Asia holds the largest regional share at 34% of value.

How large will the Global Tapes Market be by 2036?

MMA forecasts USD 133.12 billion by 2036 under the base case, an expansion multiple of 1.76 times the 2026 value. That represents USD 57.37 billion of incremental value.

What is the CAGR for the Global Tapes Market 2026 to 2036?

The base case CAGR is 5.8%, with a bull case of 7.0% and a bear case of 4.6%. The spread reflects uncertainty over assembly conversion and repairability regulation pace.

Which segment is growing fastest?

Debondable and reworkable tapes grow fastest at 15.6%, roughly 2.69 times the market rate. Electrical and thermal management tapes follow at 9.4% on battery demand.

Who are the major companies in the Global Tapes Market?

3M, tesa, Nitto Denko, Avery Dennison, and Lintec lead, holding roughly 38% between them. Adhesive formulation capability rather than coating capacity sustains that concentration rather than any manufacturing scale.

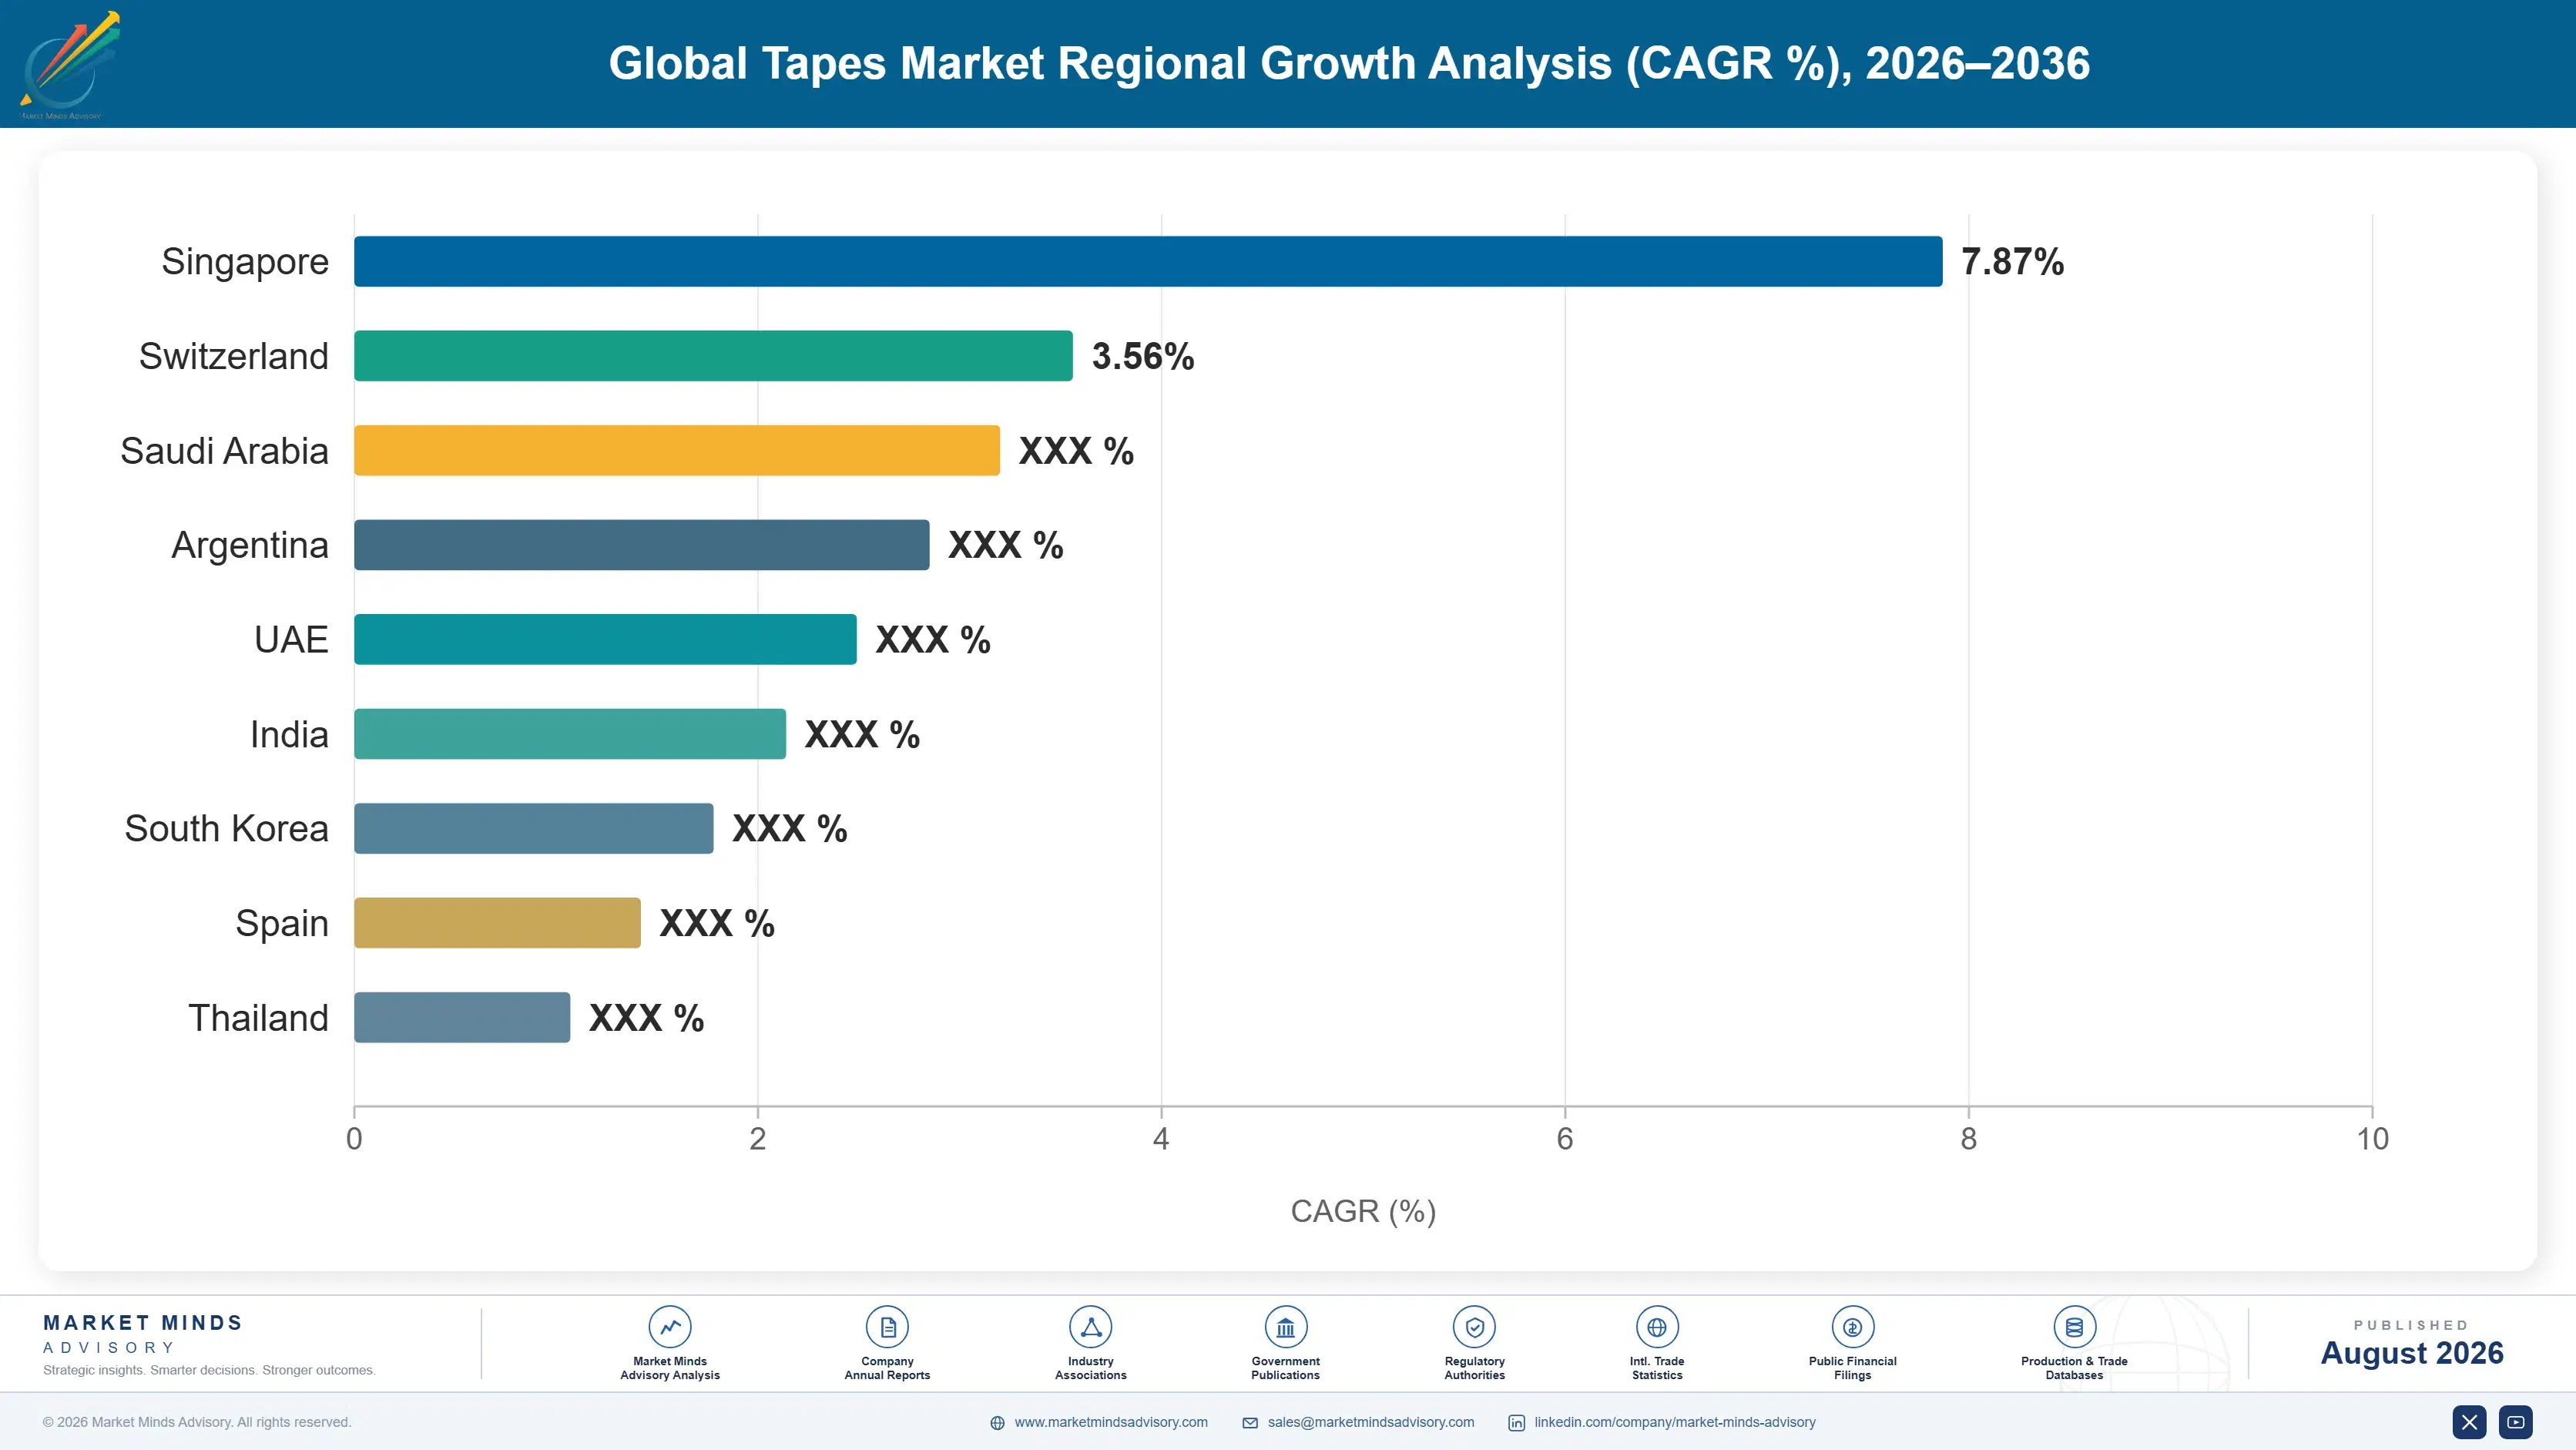
Which country is growing fastest?

India grows fastest at 9.2%, as vehicle assembly, electronics manufacture, and construction all expand simultaneously from a comparatively low starting base across the market. Specification frequently arrives from international customers there.

Report Segmentation Architecture

The full report scope spans multiple orthogonal segmentation dimensions, with cross-tabulated demand data provided for each dimension pair. Coverage extends further to regional breakdowns, trend trajectories, and the competitive detail needed to support segment-level decision-making.

By Application Function

  • Carton Sealing Tapes
  • Double-Sided Assembly Tapes
  • Masking and Protective Tapes
  • Electrical and Thermal Management Tapes
  • Medical and Skin-Contact Tapes
  • Debondable and Reworkable Tapes

By End-Use Industry

  • Automotive and Transportation
  • Electronics and Semiconductor
  • Building and Construction
  • Packaging and Logistics
  • Healthcare and Medical Devices
  • General Industrial and Maintenance

By Sales Model

  • Design-Qualified Programme Supply
  • Annual Procurement Tenders
  • Industrial Distributor Channels
  • Converter and Die-Cutter Supply
  • Retail and Trade Sales

By Region

  • North America
  • Western Europe
  • East Asia
  • South Asia and Pacific
  • Latin America
  • Middle East and Africa
  • Eastern Europe

Scope, Methodology, and Coverage

Every figure in this report is reproducible from documented input assumptions. The scope below maps the historical period, the forecast horizon, the segmentation dimensions, and the countries covered, alongside the underlying primary and qualitative methodology.
Historical Period
2020 to 2025
Forecast Period
2026 to 2036
Base Year
2025 (USD billions; MMA Primary Research Dataset, August 2026)
Market Definition
The market comprises pressure-sensitive adhesive tapes supplied for packaging, assembly, protection, and electrical applications, covering carton sealing tapes, double-sided assembly tapes, masking and protective tapes, electrical and thermal management tapes, medical and skin-contact tapes, and debondable or reworkable tapes. Value is measured at manufacturer level on converted product across automotive, electronics, construction, packaging, and healthcare applications. Adhesive raw materials and carrier films sold separately, liquid adhesives and sealants, labels, application equipment, and mechanical fastening systems fall outside scope.
Quantitative Units
USD billions (current prices); billion square metres of tape produced annually; USD per square metre by application function
Segmentation Dimensions
By Application Function; By End-Use Industry; By Sales Model; By Region
Regions Covered
North America, Western Europe, East Asia, South Asia and Pacific, Latin America, Middle East and Africa, Eastern Europe
Countries Covered
China, Japan, South Korea, Taiwan, India, Vietnam, Thailand, Indonesia, Australia, United States, Canada, Mexico, Germany, France, United Kingdom, Italy, Spain, Netherlands, Belgium, Sweden, Poland, Czechia, Slovakia, Hungary, Brazil, Argentina, Chile, Saudi Arabia, United Arab Emirates, South Africa
Key Companies Profiled
3M, tesa, Nitto Denko, Avery Dennison, Lintec, Shurtape Technologies, Intertape Polymer Group, Scapa Group, Berry Global, Saint-Gobain, Henkel, Sika, Achem Technology, Yongguan Adhesive, Toyochem, DIC Corporation, Rogers Corporation, Parafix, Advance Tapes, Ajit Industries
Quantitative Methodology
Primary survey, n=3,800 respondents, Q4 2025, six countries; demand-side model with trade association cross-validation
Qualitative Methodology
47 expert interviews, Q4 2025; applied to validate demand model assumptions, identify emerging dynamics, and assess competitive positioning
Report Format
PDF and XLSX data workbook (Word format preview document)
Publisher
Market Minds Advisory
Report Code
MMA-2026-CHM-479
Published
August 2026
Contact
sales@marketmindsadvisory.com | www.marketmindsadvisory.com

Purchase the full Global Tapes Market Report (2026 to 2036).

The full report sizes adhesive tape demand across six application functions, six end-use industries, and seven regions with 2026 to 2036 forecasts under base, bull, and bear cases. It separates qualified assembly products from tendered packaging volume, since the two are bought by different people over entirely different timescales and only share a name. Competitive profiles cover twenty manufacturers assessed consistently on tape supply revenue, formulation capability, and design engineering access. Cost analysis traces adhesive raw material, carrier, and coating process exposure by line type. Commercial guidance addresses debonding development, design access, coating capacity decisions, and thermal formulation.
Six application functions sized separately by region
Qualified assembly volume separated from tendered packaging supply
Debondable requirements mapped against repairability regulation timetables
Solvent coating capacity retirement tracked against abatement economics
Thermal adhesive conductivity and adhesion trade-off quantified by loading
Qualification cycle lengths compared across end-use applications

Built For The People Who Decide

From boardroom strategy to bench-side execution, this report is read cover-to-cover by leaders shaping the next decade of their industry, turning demand scenarios, market dynamics and valuation benchmarks into decisions.
CXOs/ Presidents/ VPs/ Managers
M&A and Corporate Development
Strategy Teams and R&D Heads
Procurement and Product Directors
Regulatory and Compliance Leaders
Investor Relations and Equity Analysts