Market Minds Advisory
Global Paraffins Market

Global Paraffins Market: Group One Refinery Retreat, Synthetic Wax Substitution and Grade Economics, 2026 to 2036

Paraffin wax is a by-product of a refining route the industry is deliberately abandoning, and nobody building base oil capacity today has the slightest intention of producing any of it.

Lead Analyst

Bilal Shaikh

Published

September 2026

Make Smarter Decisions with Customized Research Insights

Request a free sample report and evaluate market opportunities, growth trends, and competitive dynamics relevant to your business needs.

2025 MARKET VALUE$5.8BMarket Size 2025
2036 FORECAST VALUE$9.3BBase Case , 2026 to 2036
CAGR 2026 TO 20364.4 %Bull 5.6% / Bear 3.2%
INCREMENTAL OPPORTUNITY$3.3BNet 10- year value creation
EXPANSION MULTIPLE1.54x2036 value over 2026 base
Strategic Levers
M&A Pipeline
Regional Outlook
Country Rankings
Competitive Intelligence
Segmental Deep-dive
Call-Us : 91 93563 13602

Executive Snapshot and Market Trajectory

Supply is shrinking here because of a decision nobody ever made about wax. Paraffin comes out of Group One base oil refining, and refiners have been closing that capacity for two decades in favour of hydrocracked Group Two and Three oils that yield no wax whatsoever.
Fischer-Tropsch and synthetic wax grows at 6.6%, a full 1.50 times the market rate, because it is the only paraffin supply anyone is deliberately adding rather than losing. East Asia holds 32% of global value, slightly above the standard regional band, because Chinese refiners retained Group One capacity long after Western operators exited it, and because Chinese candle manufacture consumes enormous volume for both domestic use and export.
The top five hold 38% of output, though concentration understates how tight qualified supply actually is: only 22% of global base oil capacity still produces wax at all. Candle manufacture takes 37% of volume and is flat, while hot-melt adhesives, packaging coatings and phase change materials all grow. That mix shift matters commercially, because those growing applications specify oil content and congealing point far more tightly than any candle maker ever has.
Market Definition
The market covers paraffins supplied as refined petroleum and synthetic products: fully refined and semi-refined paraffin wax, slack wax, microcrystalline wax, liquid normal paraffins, and Fischer-Tropsch synthetic wax. It excludes petroleum jelly and white oils, polyethylene and polypropylene waxes, natural waxes including beeswax, carnauba and soy, chlorinated paraffins, base oils sold as lubricants, and finished articles such as candles or wax-coated packaging.
Base Year Value
$5.8B in 2025 (MMA Primary Research Dataset, August 2026)
Forecast Period
2026 to 2036, eleven discrete annual values
CAGR
4.4% base case. Bull 5.6%. Bear 3.2%.
Fastest Growth Segment
Fischer-Tropsch and Synthetic Wax: 6.6% CAGR
Fastest Growth Country
India: 7.2% CAGR
Fastest Growth Region
South Asia and Pacific: 6.7% CAGR
Largest Region
East Asia: 32% of 2025 global value
Market Leaders
Sinopec, Sasol, ExxonMobil, Shell, CNPC. Source: MMA Primary Research Dataset, July 2026.
Primary Survey
n=3,800 procurement and R&D decision-makers, Q4 2025, six countries
Methodology
Demand-side build-up, cross-validated against public data, 47 expert interviews

Global Paraffins Market Forecast Scenarios

global-paraffins-market-trends-size-forecast-scenario-1787311660193
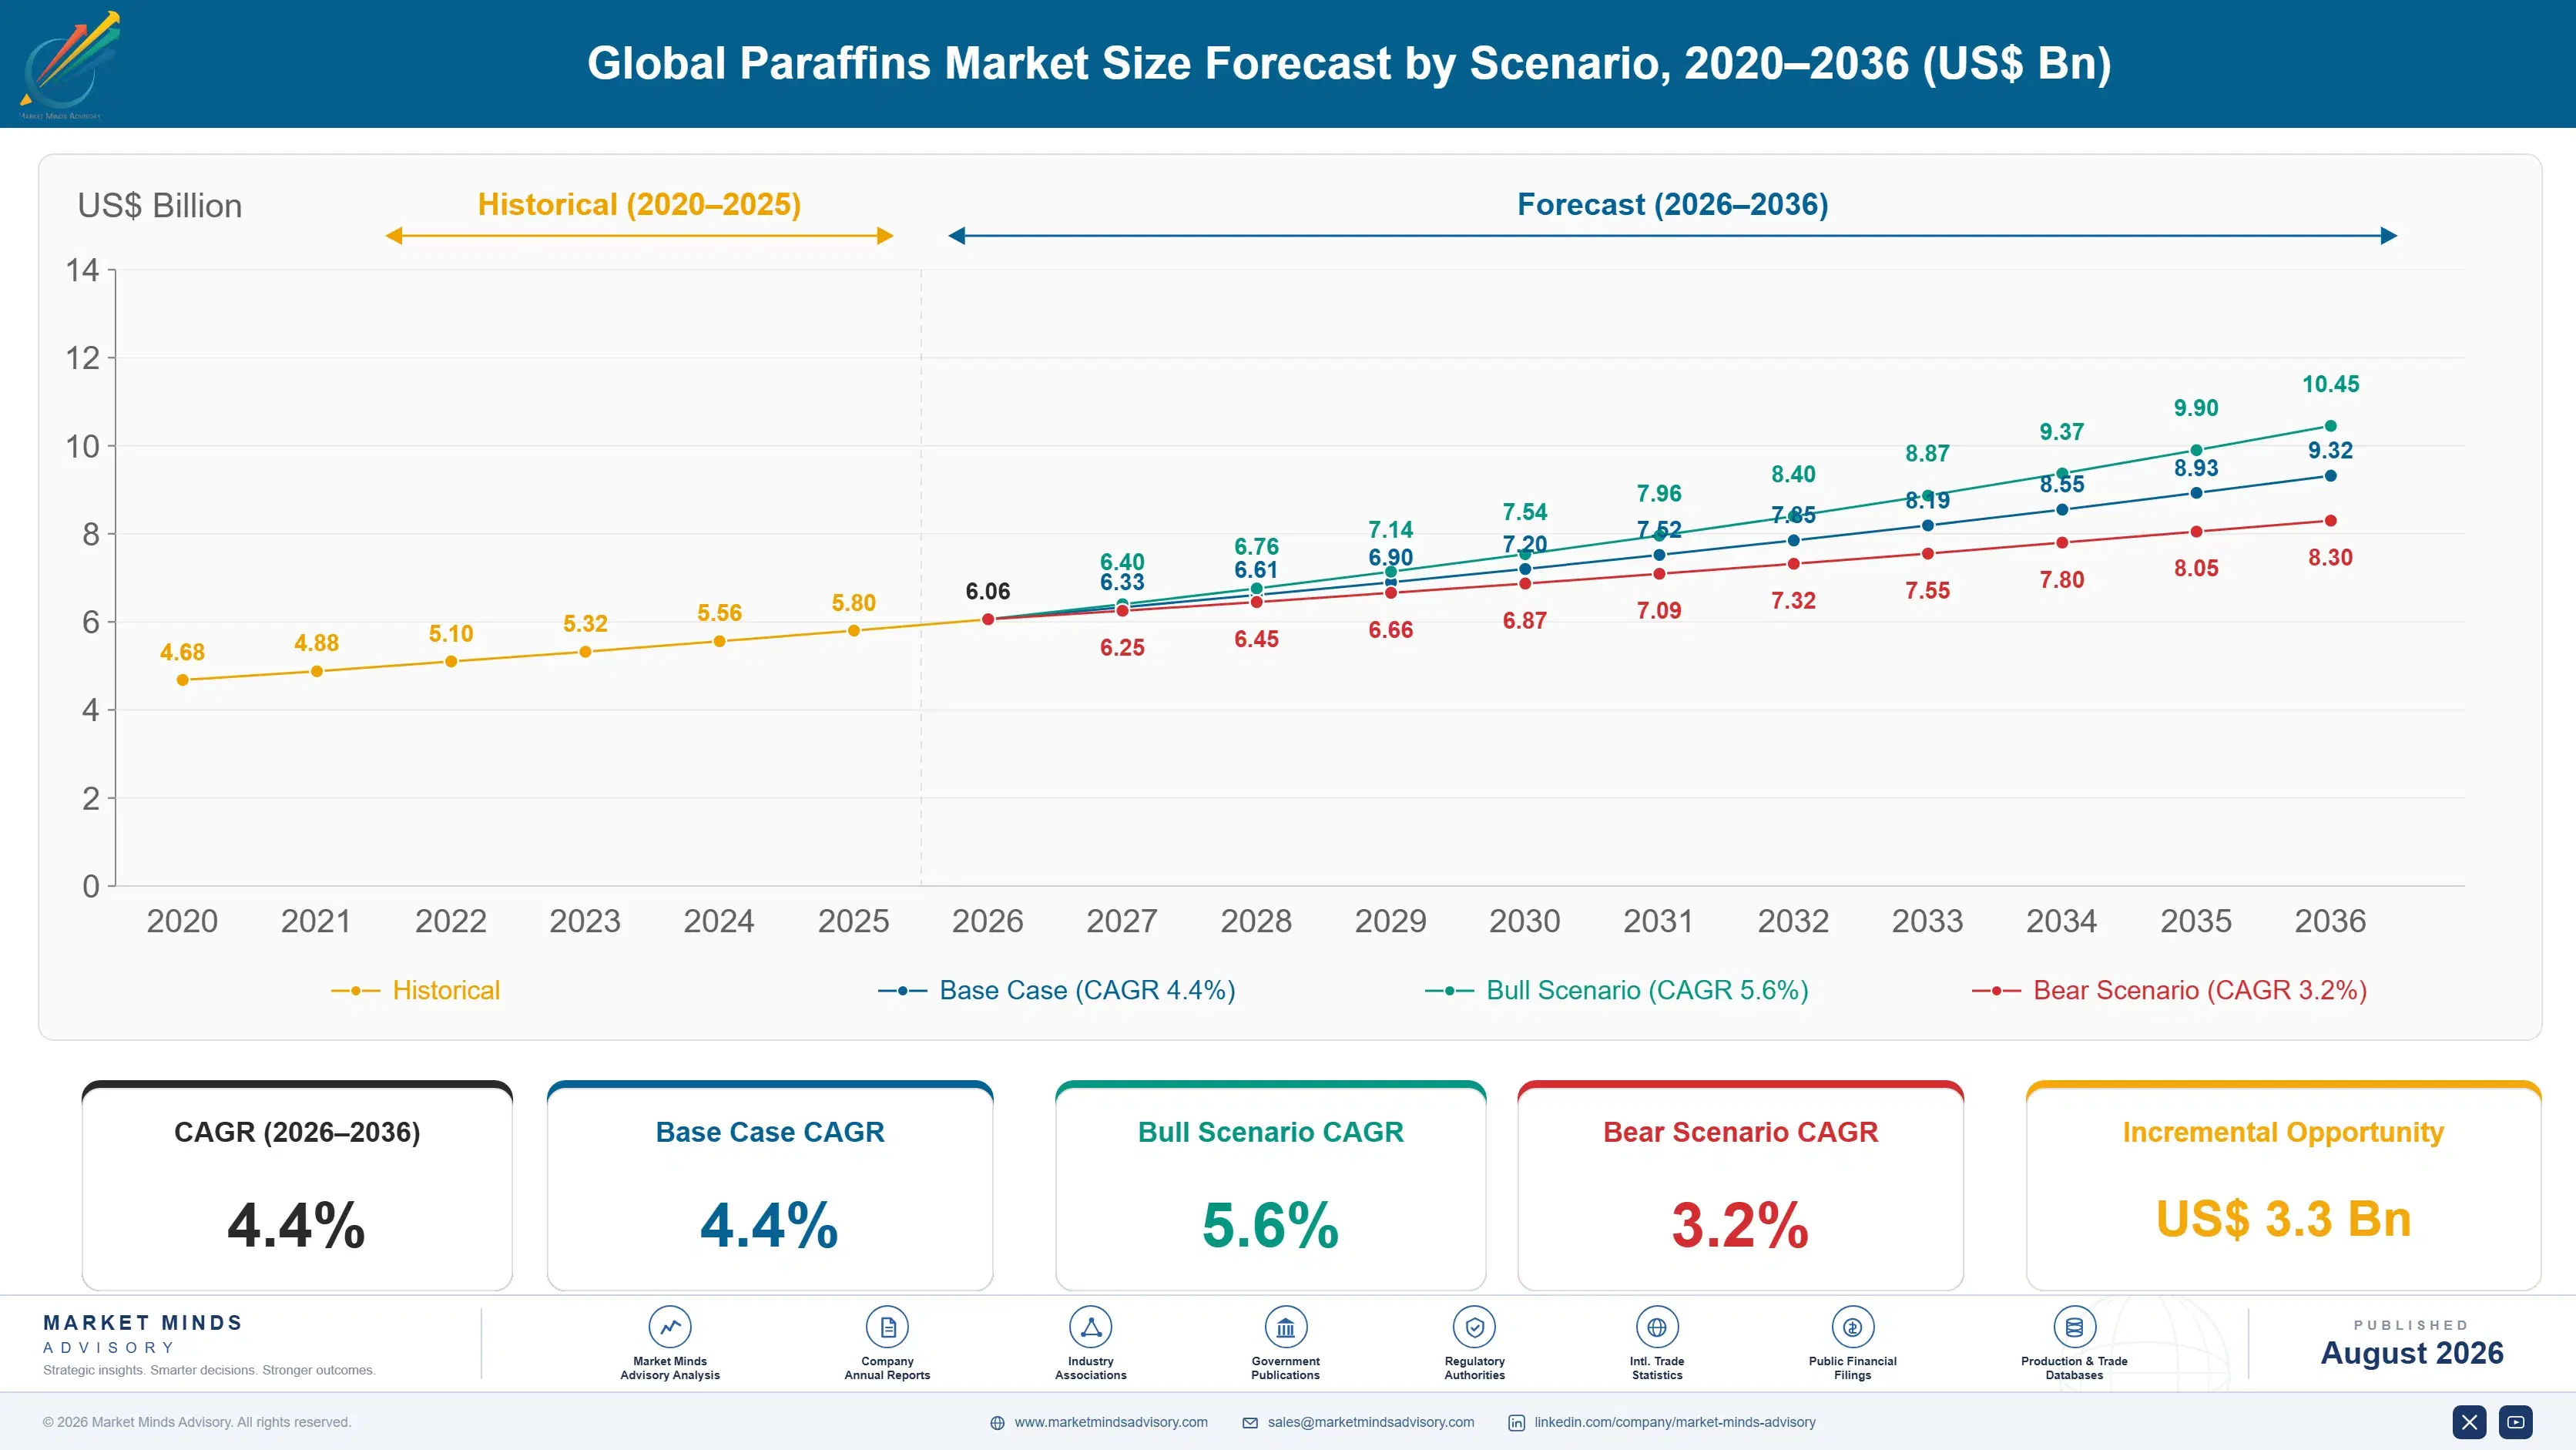
The market compounded at 3.5% between 2020 and 2025 in value terms while volume barely moved at all. Group One refinery closures across Europe and North America removed wax capacity every year, tightening supply into a demand base that was itself flat. Prices rose accordingly, and 2022 saw refined wax pricing reach levels that pushed several adhesive formulators toward polyethylene wax substitutes permanently.
The 4.4% base case rests on three mechanisms. First, continued Group One rationalisation keeps supply tightening faster than demand falls, which supports pricing without any volume growth. Second, application mix shifts toward hot-melt adhesives, corrugated coatings and phase change materials that pay more than candle manufacture does. Third, Fischer-Tropsch capacity additions provide the only genuinely new supply anywhere, and it commands a real premium on consistency and low oil content.
The bull case at 5.6% assumes further unplanned Group One closures alongside phase change material adoption accelerating in building and cold chain applications. The bear case at 3.2% turns on substitution: polyethylene and Fischer-Tropsch alternatives continue displacing petroleum wax in adhesives and coatings, and if candle demand in Asia also softens, tight supply stops translating into higher realised value.

Why By-Product Economics Govern This Market

Paraffin wax is the only major industrial material whose supply is set by decisions taken about something else entirely. It emerges from solvent dewaxing during Group One base oil production, and every refiner choosing hydrocracking over solvent refining removes wax capacity as an incidental consequence.
TOP FIVE CONCENTRATION38%Combined position of the five largest paraffin wax producers
AVERAGE SELLING PRICE$1,340 per tonneTypical realised price across refined and slack grades
TOP PRODUCING COUNTRY SHARE31%Chinese share of global paraffin wax production capacity
GROUP ONE CAPACITY SHARE22%Share of global base oil capacity still producing any wax
FEEDSTOCK COST SHARE46% of COGSSlack wax and crude feedstock share of total production cost
CANDLE DEMAND SHARE37%Portion of global wax volume consumed by candle manufacture
That makes the supply curve unusually rigid. A wax producer cannot respond to price by making more, because output is fixed by the base oil run it accompanies, and nobody builds a Group One refinery to capture wax margin. Only 22% of global base oil capacity still yields wax, down from well over half two decades ago. Prices therefore move on demand and on refinery closure announcements rather than on any production decision a wax marketer controls.
Fischer-Tropsch wax changes that logic, and it is the reason the top of this market behaves differently from the bottom. Synthetic wax is made deliberately, to specification, with oil content and carbon distribution far tighter than petroleum wax achieves. It costs more, but hot-melt adhesive and coating formulators increasingly specify it because batch consistency matters more to them than price does. Petroleum wax keeps the candle business; synthetic wax is taking the technical applications.
"Wax marketers spent thirty years apologising for a by-product nobody wanted. Now they hold a shrinking supply of something that adhesive and packaging formulators cannot easily replace, and most of them still price it as though the refinery were doing them a favour by producing it. The pricing power is real and largely unexercised."
Senior Analyst, Refinery Specialties and Waxes Practice · MMA Chemicals and Mate

Market Trends

Group One Refinery Closures Tighten Supply Every Year

Refiners have been closing solvent-refining Group One capacity in favour of hydrocracked Group Two and Three base oils for two decades, and each closure removes wax output permanently rather than temporarily. Only 22% of global base oil capacity still produces wax, against well over half in the early 2000s. European and North American closures have been heaviest. The commercial consequence is that supply falls on a schedule set by base oil economics, entirely independent of wax demand, which is why wax pricing has decoupled from crude oil movement since roughly 2019.
Market Impact: Grows shipper volumes 11% annually
Technical Applications Displace Candles In Value Terms

Candle manufacture still takes 37% of global volume but contributes a falling share of value, because candle makers buy semi-refined wax on price while hot-melt adhesive, corrugated coating and phase change material buyers specify oil content, congealing point and needle penetration tightly. Those technical grades realise roughly 40% more per tonne. The shift is gradual but entirely one-directional, and it favours producers holding the fractionation and hydrofinishing capability to meet specification rather than those simply selling whatever the dewaxing unit happened to produce that week. Candle buyers will not follow that price.
Market Impact: Absorbs 24% of global wax volume

Market Opportunities and Growth Drivers

Phase Change Materials Enter Building And Cold Chain

Paraffin remains the most economic phase change material for temperature ranges between fifteen and forty degrees Celsius, and both building thermal management and pharmaceutical cold chain packaging have adopted it at scale. Encapsulated paraffin in wallboard, ceiling panels and shipping containers converts a commodity wax into a specified functional material. Cold chain shipper volumes have grown roughly 11% annually since 2021 on biologics and vaccine distribution alone. The grades required carry tight congealing point tolerance, which limits qualified suppliers considerably and supports pricing far above anything candle grade material achieves.
Market Impact: Threatens 24% of wax volume

Hot-Melt Adhesive Demand Rises With Packaging Volume

Corrugated case sealing, carton closing and labelling all consume hot-melt adhesive, and paraffin or synthetic wax is the viscosity modifier in most formulations. E-commerce packaging volume has expanded steadily and pulled hot-melt adhesive consumption along with it across every major market. Formulators require consistent congealing point and very low oil content, because oil migration causes bond failure in service. Roughly 24% of global wax volume now goes to adhesives and coatings combined, and that share rises every year as candle volume flattens across the developed markets that once dominated it.
Market Impact: Holds 78% of capacity outside wax

Market Restraints and Challenges

Polyethylene Wax Substitution Attacks Technical Applications

Polyethylene and polypropylene waxes compete directly in hot-melt adhesives, masterbatch and coatings, and they offer consistency that petroleum wax struggles to match batch to batch. The root cause is petroleum wax variability: composition follows crude slate and refinery run, so a formulator qualifying a grade cannot assume next year's material behaves identically. Commercially this has cost petroleum wax share in exactly the applications paying best. Participants are responding with tighter hydrofinishing, with blended grades that stabilise properties, and by moving Fischer-Tropsch material into the accounts most exposed to substitution pressure.
Market Impact: Leaves 22% of capacity producing wa

Supply Cannot Respond To Price In Any Timeframe

Wax output is fixed by the base oil run producing it, so a wax marketer facing tight supply has no production response available. The root cause is by-product economics: no refiner will run a Group One unit for wax margin when Group Two economics are better overall. Commercially this creates violent price spikes when demand recovers faster than expected, followed by demand destruction as formulators substitute permanently. Participants are addressing it through term contracts with volume commitments, and through Fischer-Tropsch capacity that genuinely responds to wax demand rather than to base oil economics.
Market Impact: Realises 40% more per tonne
2 additional market trends, 4 additional growth drivers, and 3 additional restraints and challenges are covered in the full report. Contact sales@marketmindsadvisory.com to access the complete intelligence.

Segment CAGR and Growth Architecture

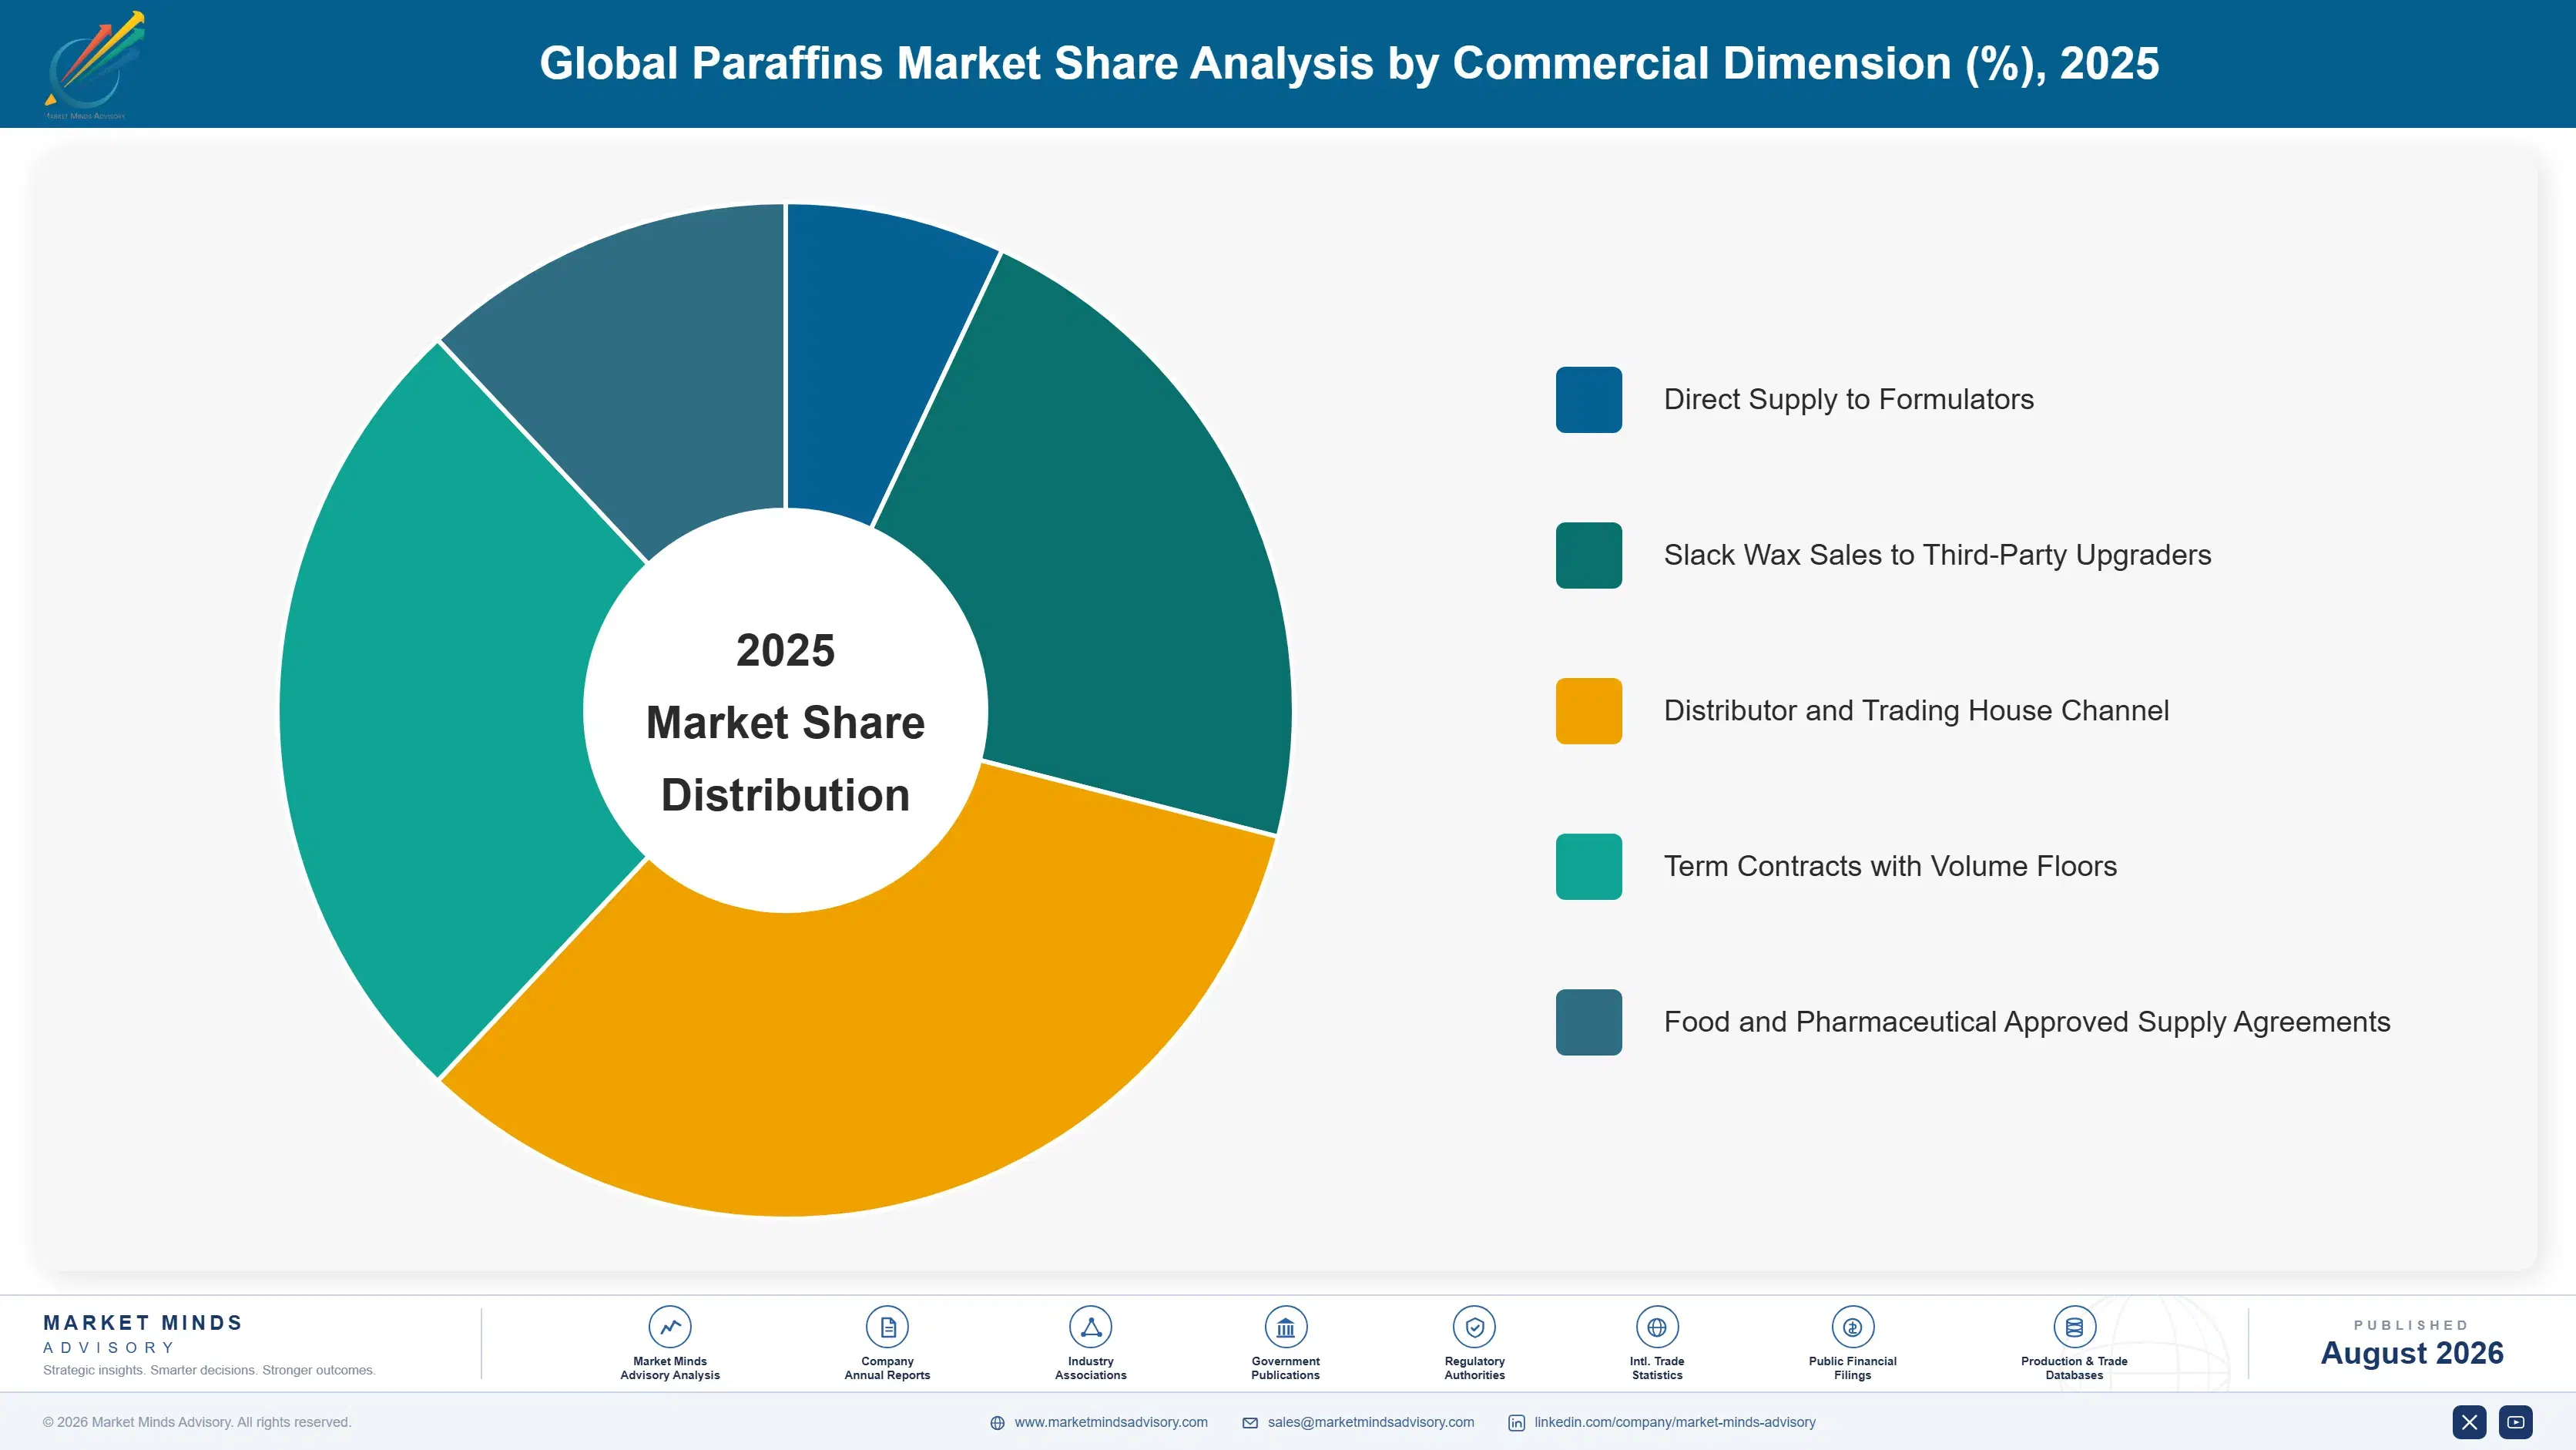
Segmentation follows paraffin product type, meaning the production route and refining depth that determine oil content, carbon distribution and regulatory standing. That single dimension governs which applications a producer can serve at all, what price it realises, and whether its supply responds to demand at all or simply follows a base oil run set elsewhere.
global-paraffins-market-trends-market-share-analysis-1787311661115

Fischer-Tropsch and Synthetic Wax

The fastest segment at 6.6%, a full 1.50 times the market rate, covering wax produced by Fischer-Tropsch synthesis from natural gas or coal rather than recovered from crude refining. It is the only paraffin supply anyone is deliberately adding, and that alone changes its commercial character. Oil content, carbon number distribution and congealing point are all controlled by process rather than inherited from a crude slate, which is exactly what hot-melt adhesive and coating formulators need. Pricing runs roughly 55% above fully refined petroleum wax. Capacity sits with very few producers, and expansion depends on gas or coal monetisation economics rather than on wax demand at all, which is why so little of it exists.
CAGR 6.6%

Fully Refined Paraffin Wax

Growing at 5.2% annually on wax hydrofinished and fractionated to low oil content with a tightly controlled congealing point, supplied into food contact packaging, cosmetics, pharmaceutical applications and higher-specification technical coatings. Regulatory approval for food and pharmaceutical contact use is what genuinely separates this grade commercially, and the hydrofinishing capability required is not universal among wax producers. Realised pricing runs well above semi-refined material and holds up considerably better through periods of demand softness, because buyers here requalify slowly and specification matters more than delivered cost. Supply is tightening faster than demand falls, because Group One closures remove exactly the solvent-refining capacity that fed these grades in the first place.
CAGR 5.2%
Full segment breakdown across 6 segments available in the complete report.

Regional Architecture and Country Demand Map

East Asia leads on both retained Group One capacity and candle manufacturing volume rather than on technical demand alone. South Asia and Pacific grows fastest as Indian packaging and candle output expand together. Western Europe has lost almost its entire production base and now depends on imports.

East Asia

Thirty-two percent of global value sits here. Note: this slightly exceeds the standard regional band because Chinese refiners retained solvent-refining Group One capacity long after Western operators exited it, and Chinese candle manufacture consumes enormous volume for both domestic use and export. Chinese capacity alone covers roughly 31% of world wax output. Japanese producers occupy the technical end, supplying microcrystalline and specialty grades at prices well above commodity levels. Growth of 5.6% reflects packaging and adhesive demand rather than candles, which have flattened. Chinese Group One rationalisation has begun and will tighten regional supply through the forecast period. Korean and Taiwanese demand is smaller and weighted toward the technical grades rather than candles.
Share: 32% | CAGR: 5.6% (2026 to 2036)

North America

Twenty-two percent of global value, and the region has moved from net exporter to net importer as Group One closures accumulated across the Gulf Coast and Midwest. Remaining domestic production is concentrated among specialty refiners who kept solvent dewaxing precisely because wax and specialty base oils justified it. Growth of 3.8% reflects packaging and adhesive demand offsetting flat candle consumption. Phase change material demand for cold chain packaging is the fastest-growing application here, pulled by pharmaceutical distribution. Import dependence on Chinese and Middle Eastern material has become a genuine supply security concern for formulators. Remaining producers price against fuel oil alternatives far more often than the technical market would justify.
Share: 22% | CAGR: 3.8% (2026 to 2036)
Regional intelligence for 5 additional markets available in the complete report: Western Europe, South Asia and Pacific, Latin America, Middle East and Africa, Eastern Europe. Contact sales@marketmindsadvisory.com.
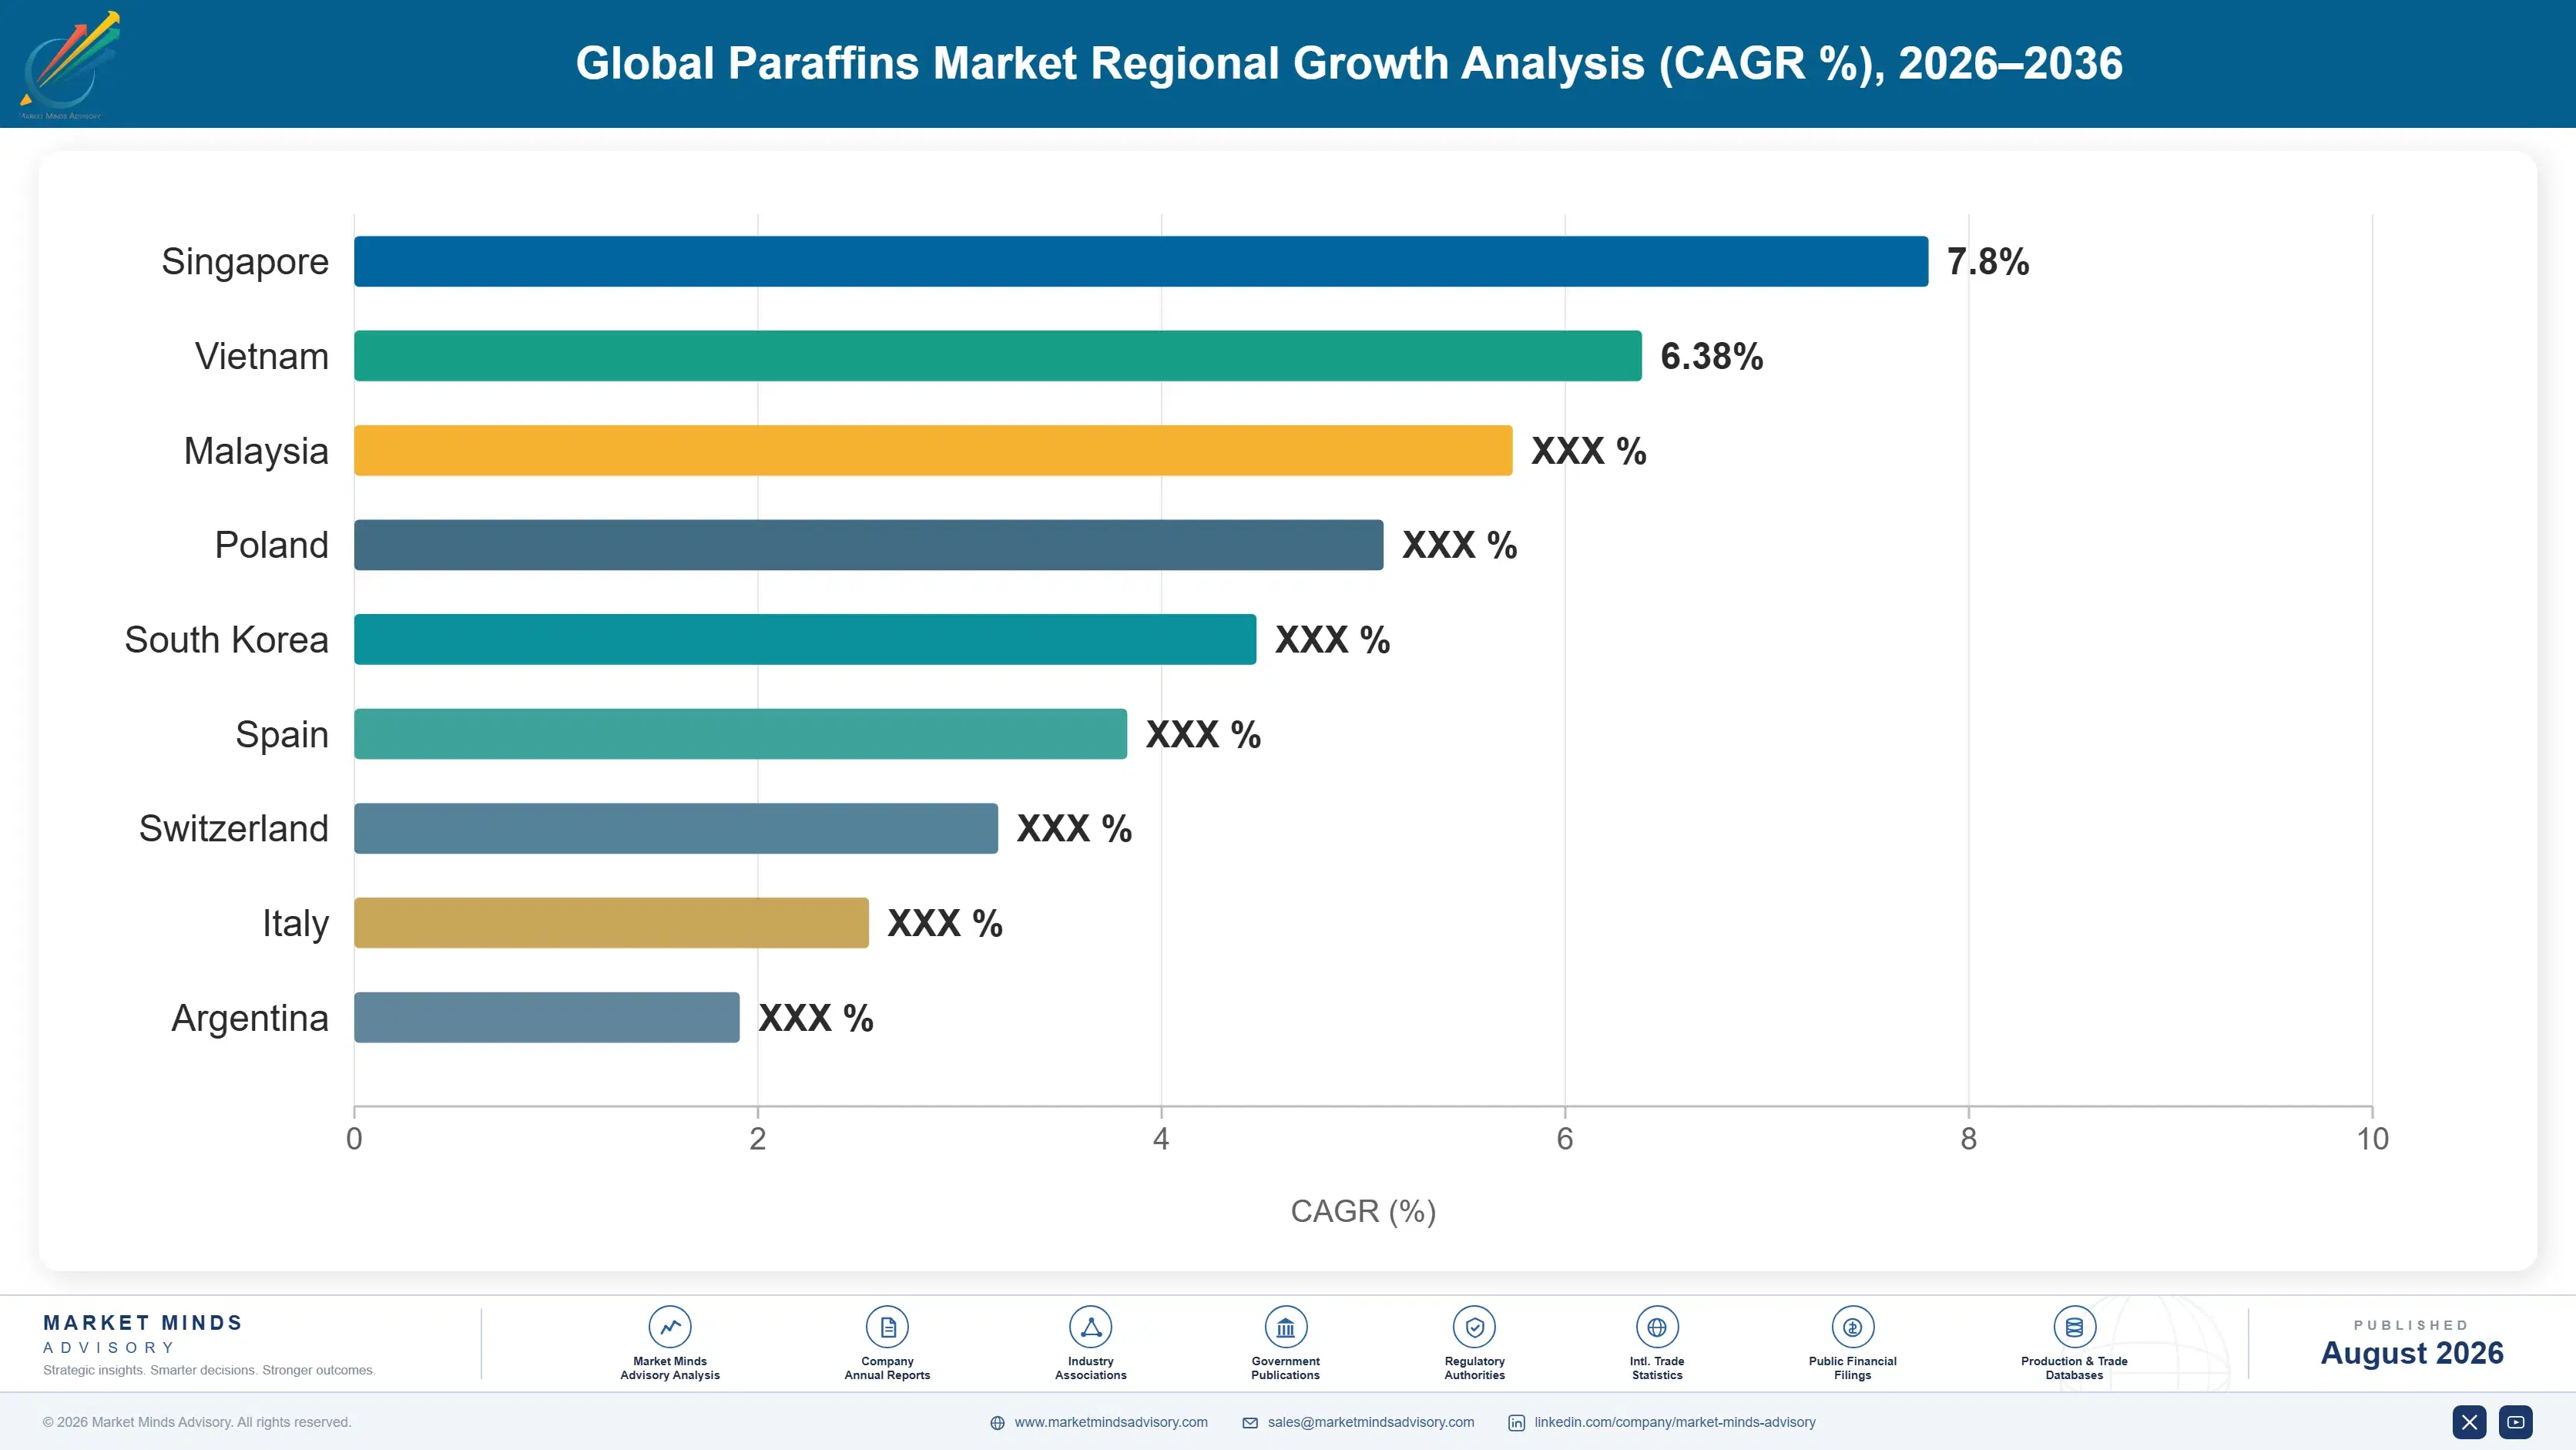
global-paraffins-market-trends-country-cagr-analysis-1787311661961

Where Wax Margin Actually Accumulates

Four commercial moves separate the producers earning genuine specification margins from those merely clearing whatever the dewaxing unit happened to produce. Each depends on holding something a formulator cannot obtain by switching supplier: hydrofinishing depth, food and pharmaceutical approvals, term-contracted supply security, or synthetic wax capacity that actually responds to wax demand rather than to base oil economics.

Hydrofinish And Fractionate To Technical Specification

Semi-refined wax sold to candle makers competes purely on delivered price, while hydrofinished grades holding low oil content and tight congealing point realise roughly 40% more per tonne into adhesives, coatings and food contact packaging. Hydrofinishing and fractionation capability costs $22 million to $45 million on an existing dewaxing site. The constraint is that many wax producers never built it, having treated wax as tonnage to clear rather than a product to specify. That historical decision, taken decades ago in most cases, is precisely what creates the current commercial opening for anyone willing to reverse it.
Market Impact: Realises roughly 40% more per tonne

Secure Food And Pharmaceutical Contact Approvals

Food contact, cosmetic and pharmaceutical grade approvals require documented purity control and site compliance rather than product testing alone, which keeps the qualified supplier list short in exactly the applications paying best. Approval work costs under $3 million across a grade family and takes about eighteen months. Realised pricing runs 25% to 35% above technical grade, and buyers requalify very slowly because their own regulatory filings reference the wax supplier. The cost is close to trivial against the pricing available, and most commodity wax producers have simply never bothered to pursue it at all.
Market Impact: Adds up to 35% over technical grade

Sell Supply Security Through Term Contracts

Formulators who lost supply during the 2022 squeeze now value guaranteed volume above the last few dollars per tonne, and several have said so explicitly in tender documents. Multi-year contracts with volume floors hold realisations 12% to 18% above spot through soft periods while sacrificing upside in spikes. Given that wax supply cannot respond to price in any timeframe, spikes are inevitable and so is the demand destruction that follows them. Term contracting converts that volatility into predictable revenue and, more usefully, keeps formulators from qualifying a substitute that never comes back afterwards.
Market Impact: Holds realisations up to 18% above

Build Fischer-Tropsch Capacity Against Wax Demand

Synthetic wax is the only paraffin supply that can be built in response to wax demand rather than inherited from a base oil run, and it commands roughly 55% above fully refined petroleum wax on consistency alone. Capacity additions depend on gas or coal monetisation economics rather than wax economics, which is why so little exists. Producers holding it capture the technical applications petroleum wax is losing to polyethylene alternatives. The barrier here is capital scale rather than any technology gap, and it keeps the competitive field to very few names worldwide.
Market Impact: Commands roughly 55% above refined

Who Controls the Margin Pool

Concentration is moderate at 38% for the top five, measured on paraffin wax production volume across all participants, though that figure understates how tight qualified supply actually is given only 22% of base oil capacity still yields wax. Sinopec leads on volume from retained Chinese Group One capacity, and the gap to the second tier is widest in specification capability rather than in tonnage.
Competition runs on three dimensions. Hydrofinishing and specification capability decides access to adhesive, coating and food contact applications where pricing is best. Supply security matters almost as much since the 2022 squeeze, and formulators now weight contracted availability heavily in supplier selection. Delivered cost dominates the candle and commodity pool, where semi-refined material competes globally and no producer holds any defensible position whatsoever.

Two pressures are building. Polyethylene and Fischer-Tropsch waxes continue displacing petroleum wax in exactly the technical applications that pay best, and petroleum producers cannot match their batch consistency without hydrofinishing investment many have deferred. Meanwhile Chinese Group One rationalisation has begun, which will tighten the largest supply pool in the market. Rankings shift where retained capacity meets specification capability, since holding one without the other is no longer sufficient.
global-paraffins-market-trends-company-positioning-matrix-1787311662836

Competitive Moat and Risk Dimensions

SINOPEC

Moat: Largest retained Group One capacity

Retention of solvent-refining Group One capacity long after Western operators exited leaves the company holding the single largest wax output position worldwide. That capacity cannot be replicated by anyone, because no refiner would build a Group One unit today, which makes an inherited asset genuinely irreplaceable rather than merely valuable.
SINOPEC

Risk: Domestic rationalisation already underway

The same base oil economics that closed Western Group One capacity now apply in China, and rationalisation of the company's own solvent-refining units has begun. Each closure removes wax output the company cannot replace. Its position rests on delaying a transition the rest of the industry completed years ago rather than on any durable advantage.
SASOL

Moat: Dominant Fischer-Tropsch wax position

Synthetic wax produced from coal and gas gives the company supply that responds to wax demand rather than following a base oil run, plus oil content and carbon distribution control petroleum wax cannot match. Hot-melt adhesive and coating formulators pay materially for that consistency, and very few competitors hold comparable capacity anywhere.
SASOL

Risk: Feedstock and carbon policy exposure

Coal-based Fischer-Tropsch production carries carbon intensity that European and increasingly Asian customers now audit, and carbon pricing would affect the cost base directly. Gas-based capacity is less exposed but smaller. The company's most defensible commercial position sits on the feedstock route facing the greatest long-term regulatory pressure worldwide.

Players Tracked

Prominent Players

Sinopec
Sasol
ExxonMobil
Shell
CNPC

Other Key Players

Nippon Seiro
HF Sinclair
Calumet Specialty Products
Iranol Oil
Lukoil
Petrobras
Indian Oil Corporation
Repsol
Numaligarh Refinery
IGI Wax
Sonneborn
The International Group
Koster Keunen
Blended Waxes
Cepsa

Recent Developments

JANUARY 2025

Calumet expands hydrofinishing capacity for technical wax grades

Additional hydrofinishing and fractionation capacity entered commercial service at an existing site, aimed at hot-melt adhesive and food contact packaging customers who had been unable to source consistent low oil content material as North American Group One refinery closures accumulated steadily across the preceding decade.
Signal: Specification capability rather than raw t
MAY 2025

Sasol concludes multi-year synthetic wax supply agreements

Several multi-year supply agreements covering specified annual Fischer-Tropsch wax volumes were concluded with several European and North American hot-melt adhesive formulators, reflecting how these buyers now value guaranteed availability and batch-to-batch consistency considerably more highly than they value the delivered cost per tonne they pay for it.
Signal: Formulators are now contracting synthetic
SEPTEMBER 2025

Nippon Seiro invests in phase change material wax grades

Dedicated production and blending capability for the company's phase change material grades entered commercial service in Japan, targeting the cold chain packaging and building thermal management customers whose congealing point tolerances run far tighter than any conventional candle or industrial coating grade has ever required.
Signal: Phase change applications are now pulling

What Drives Delivered Wax Cost

Slack wax and crude feedstock account for roughly 46% of cost of goods, though the allocation is genuinely arguable since wax is a by-product and refiners assign cost by convention rather than by cause. Energy for solvent dewaxing and hydrofinishing contributes 19%. Solvent losses add 7%, and freight a further 11% because wax ships in bulk at modest value density.
The 2022 episode was a supply squeeze rather than a cost shock. European Group One closures coincided with post-pandemic packaging demand recovery, and refined wax pricing roughly doubled within nine months. EIA data on base oil and refinery output confirms how much solvent-refining capacity left the system across that period. Several adhesive formulators substituted permanently toward polyethylene wax rather than pay through, which removed demand that has not returned since.

The competitive disadvantage mechanism runs through by-product allocation, not absolute cost. A refiner treating wax as a residue to clear prices it against fuel oil alternatives and accepts whatever the market offers. A specialty refiner treating wax as a product allocates cost properly and invests in hydrofinishing. The second earns 40% more per tonne on the same feedstock, and that difference is a management choice rather than an inherited advantage.
global-paraffins-market-trends-cost-volatility-analysis-1787311663158

Allocate refinery cost to wax as a product

Treating wax as a residue priced against fuel oil alternatives guarantees it will be underinvested and undersold. Producers who allocate solvent dewaxing cost properly and hold wax to a product profit and loss account make hydrofinishing investment cases that residue accounting never permits, and they capture the technical grade premium that follows from it.

Recover and recycle dewaxing solvent streams

Solvent losses in methyl ethyl ketone and toluene dewaxing represent both purchase cost and emission exposure. Improved recovery cost roughly $9 million per unit and cuts solvent cost of goods by around three percentage points, with payback under four years and further benefit wherever volatile organic compound limits are being tightened under local environmental regulation.

Contract slack wax supply from third-party refiners

Producers holding hydrofinishing capability but declining Group One feedstock can buy slack wax from refiners who lack downstream capability, converting someone else's residue into technical grade product. Multi-year arrangements typically cost eight to twelve percent above spot slack wax and they secure exactly the throughput that fixed cost recovery on a hydrofinishing unit genuinely requires.

Portfolio Architecture for Margin Defence

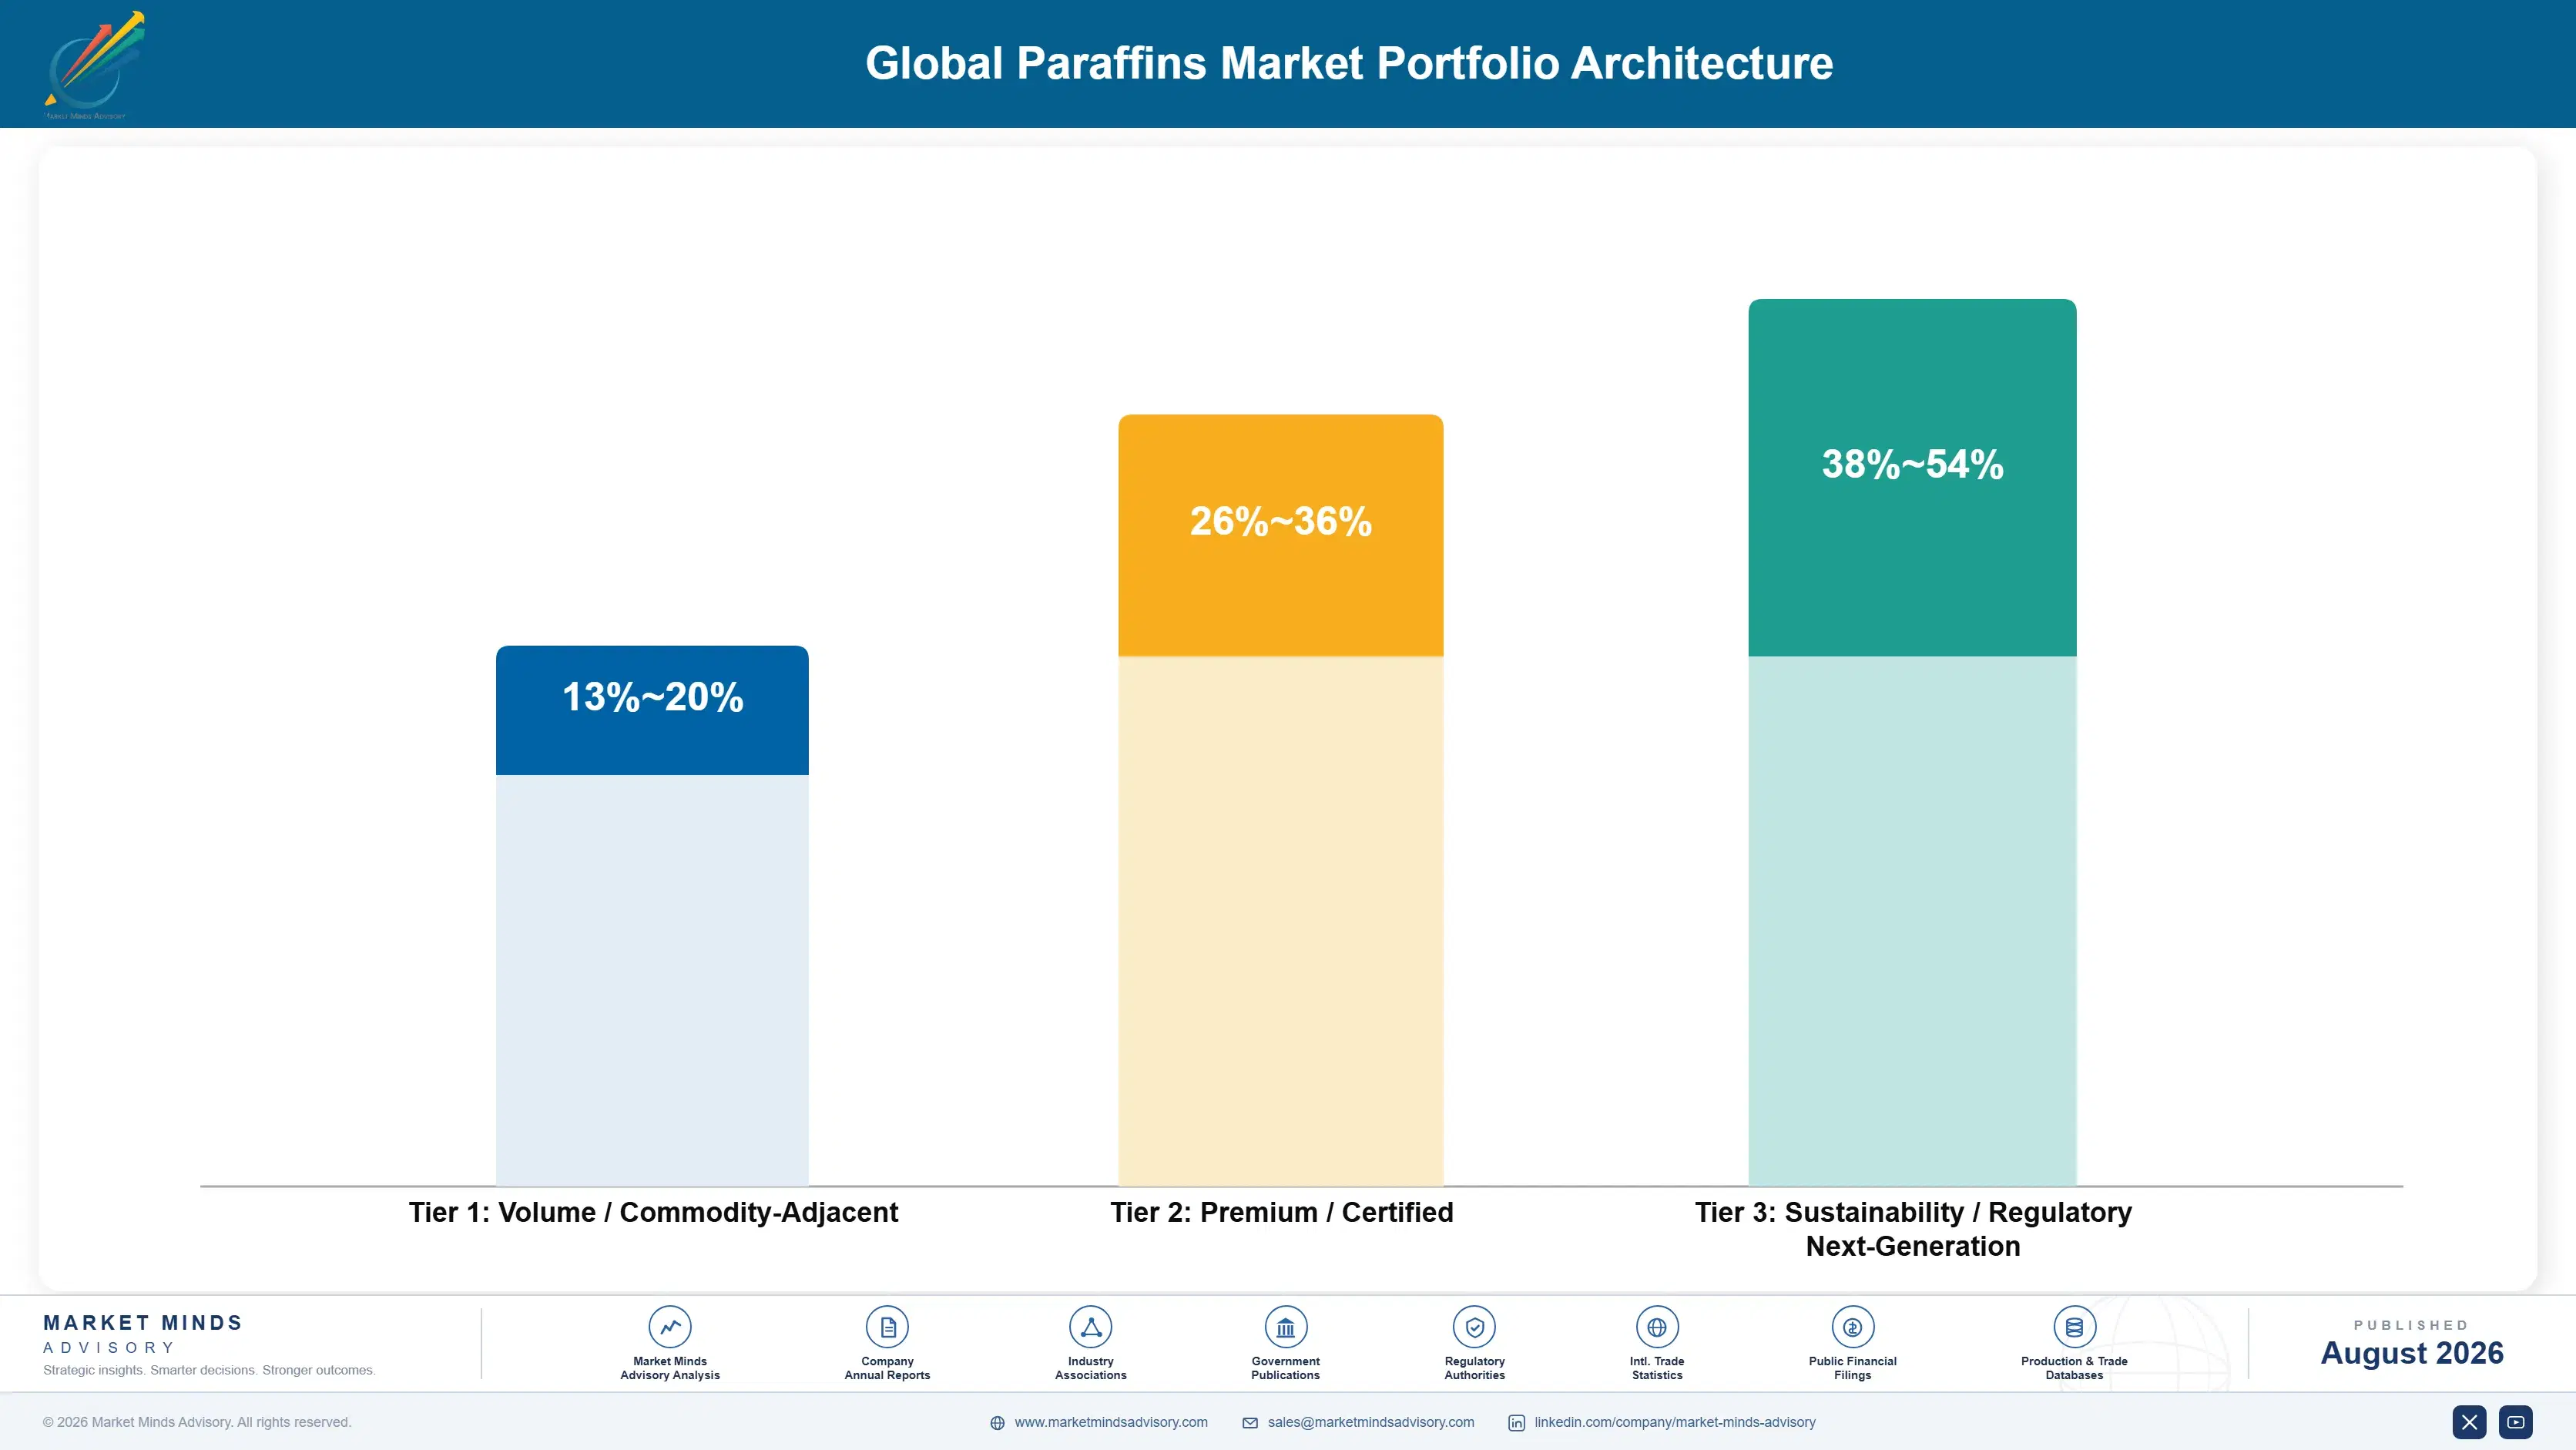
Margin architecture tracks refining depth and regulatory standing almost exactly. Slack wax and semi-refined grades sold into candle manufacture and general industrial use run at gross margins in the mid teens, competing globally on delivered cost. Fully refined and synthetic grades earn two to three times that.
The volume-versus-premium tension is unusual because volume is not really optional. Wax arrives as a by-product whether the marketer wants it or not, and the candle pool is what absorbs the tonnage that technical applications cannot use. A producer holding only technical grades still has slack wax to place. That physical reality means nobody exits the commodity pool; the question is only how much of the output gets upgraded before it leaves the site.

Value concentrates where regulatory approval or batch consistency excludes ordinary suppliers. Food contact and pharmaceutical grades sit at the top, because the buyer's own regulatory filing names the wax supplier and requalification means refiling. Fischer-Tropsch material sits alongside on consistency logic. Candle grade sits at the other extreme, where a congealing point and an oil content figure tell the buyer everything and pricing compresses toward freight parity.

Volume / Commodity-Adjacent

Slack wax and semi-refined paraffin supplied into candle manufacture, particle board and general industrial use. Specifications are loose, supply is global, and buyers move on delivered cost alone. This tonnage exists because it arrives as a by-product rather than because anyone chose to make it.
Gross Margin: 13-20%

Premium / Certified

Fully refined and microcrystalline grades supplied into hot-melt adhesives, corrugated coatings and technical applications requiring low oil content. Hydrofinishing capability and specification consistency hold the pricing. Range reflects the spread between coating and adhesive requirements across different formulator types.
Gross Margin: 26-36%

Sustainability / Regulatory / Next-Generation

Food contact, pharmaceutical and cosmetic approved grades plus Fischer-Tropsch synthetic wax and phase change material formulations. Regulatory approval and process-controlled consistency, rather than the underlying hydrocarbon, justify the pricing achieved here.
Gross Margin: 38-54%
global-paraffins-market-trends-portfolio-architecture-1787311663990

High-value Sub-segments and Strategic Watch-out

Fischer-Tropsch Synthetic Wax

High value on genuinely high growth at 6.6% annually, and the only paraffin supply that anyone builds deliberately rather than simply inherits. Process-controlled oil content and carbon distribution win the technical applications petroleum wax has been steadily losing to polyethylene alternatives, and pricing reflects that scarcity.
Gross Margin: 42-54%

Food And Pharmaceutical Grades

Excellent margins on steady underlying growth, protected because the buyer's own regulatory filing names the wax supplier and any change means refiling entirely. Approval work costs under $3 million across a grade family, yet most commodity wax producers have simply never undertaken it at all.
Gross Margin: 40-52%

Candle And Semi-Refined Grade

The pool that absorbs the by-product tonnage nobody actually chose to make, earning gross margins in the mid teens and offering no defensible position to anyone. Volume is flat globally: growing across Asia and falling through developed markets at roughly the same rate each year.
Gross Margin: 13-20%

Phase Change Material Grades

The strategic watch-out sitting in this portfolio. Congealing point tolerances here are tight enough to limit qualified suppliers, and pricing reflects that, but adoption here depends on building code and cold chain regulation that could move considerably faster or a good deal slower than current forecasts assume.
Gross Margin: 34-46%

How This Demand Actually Repeats

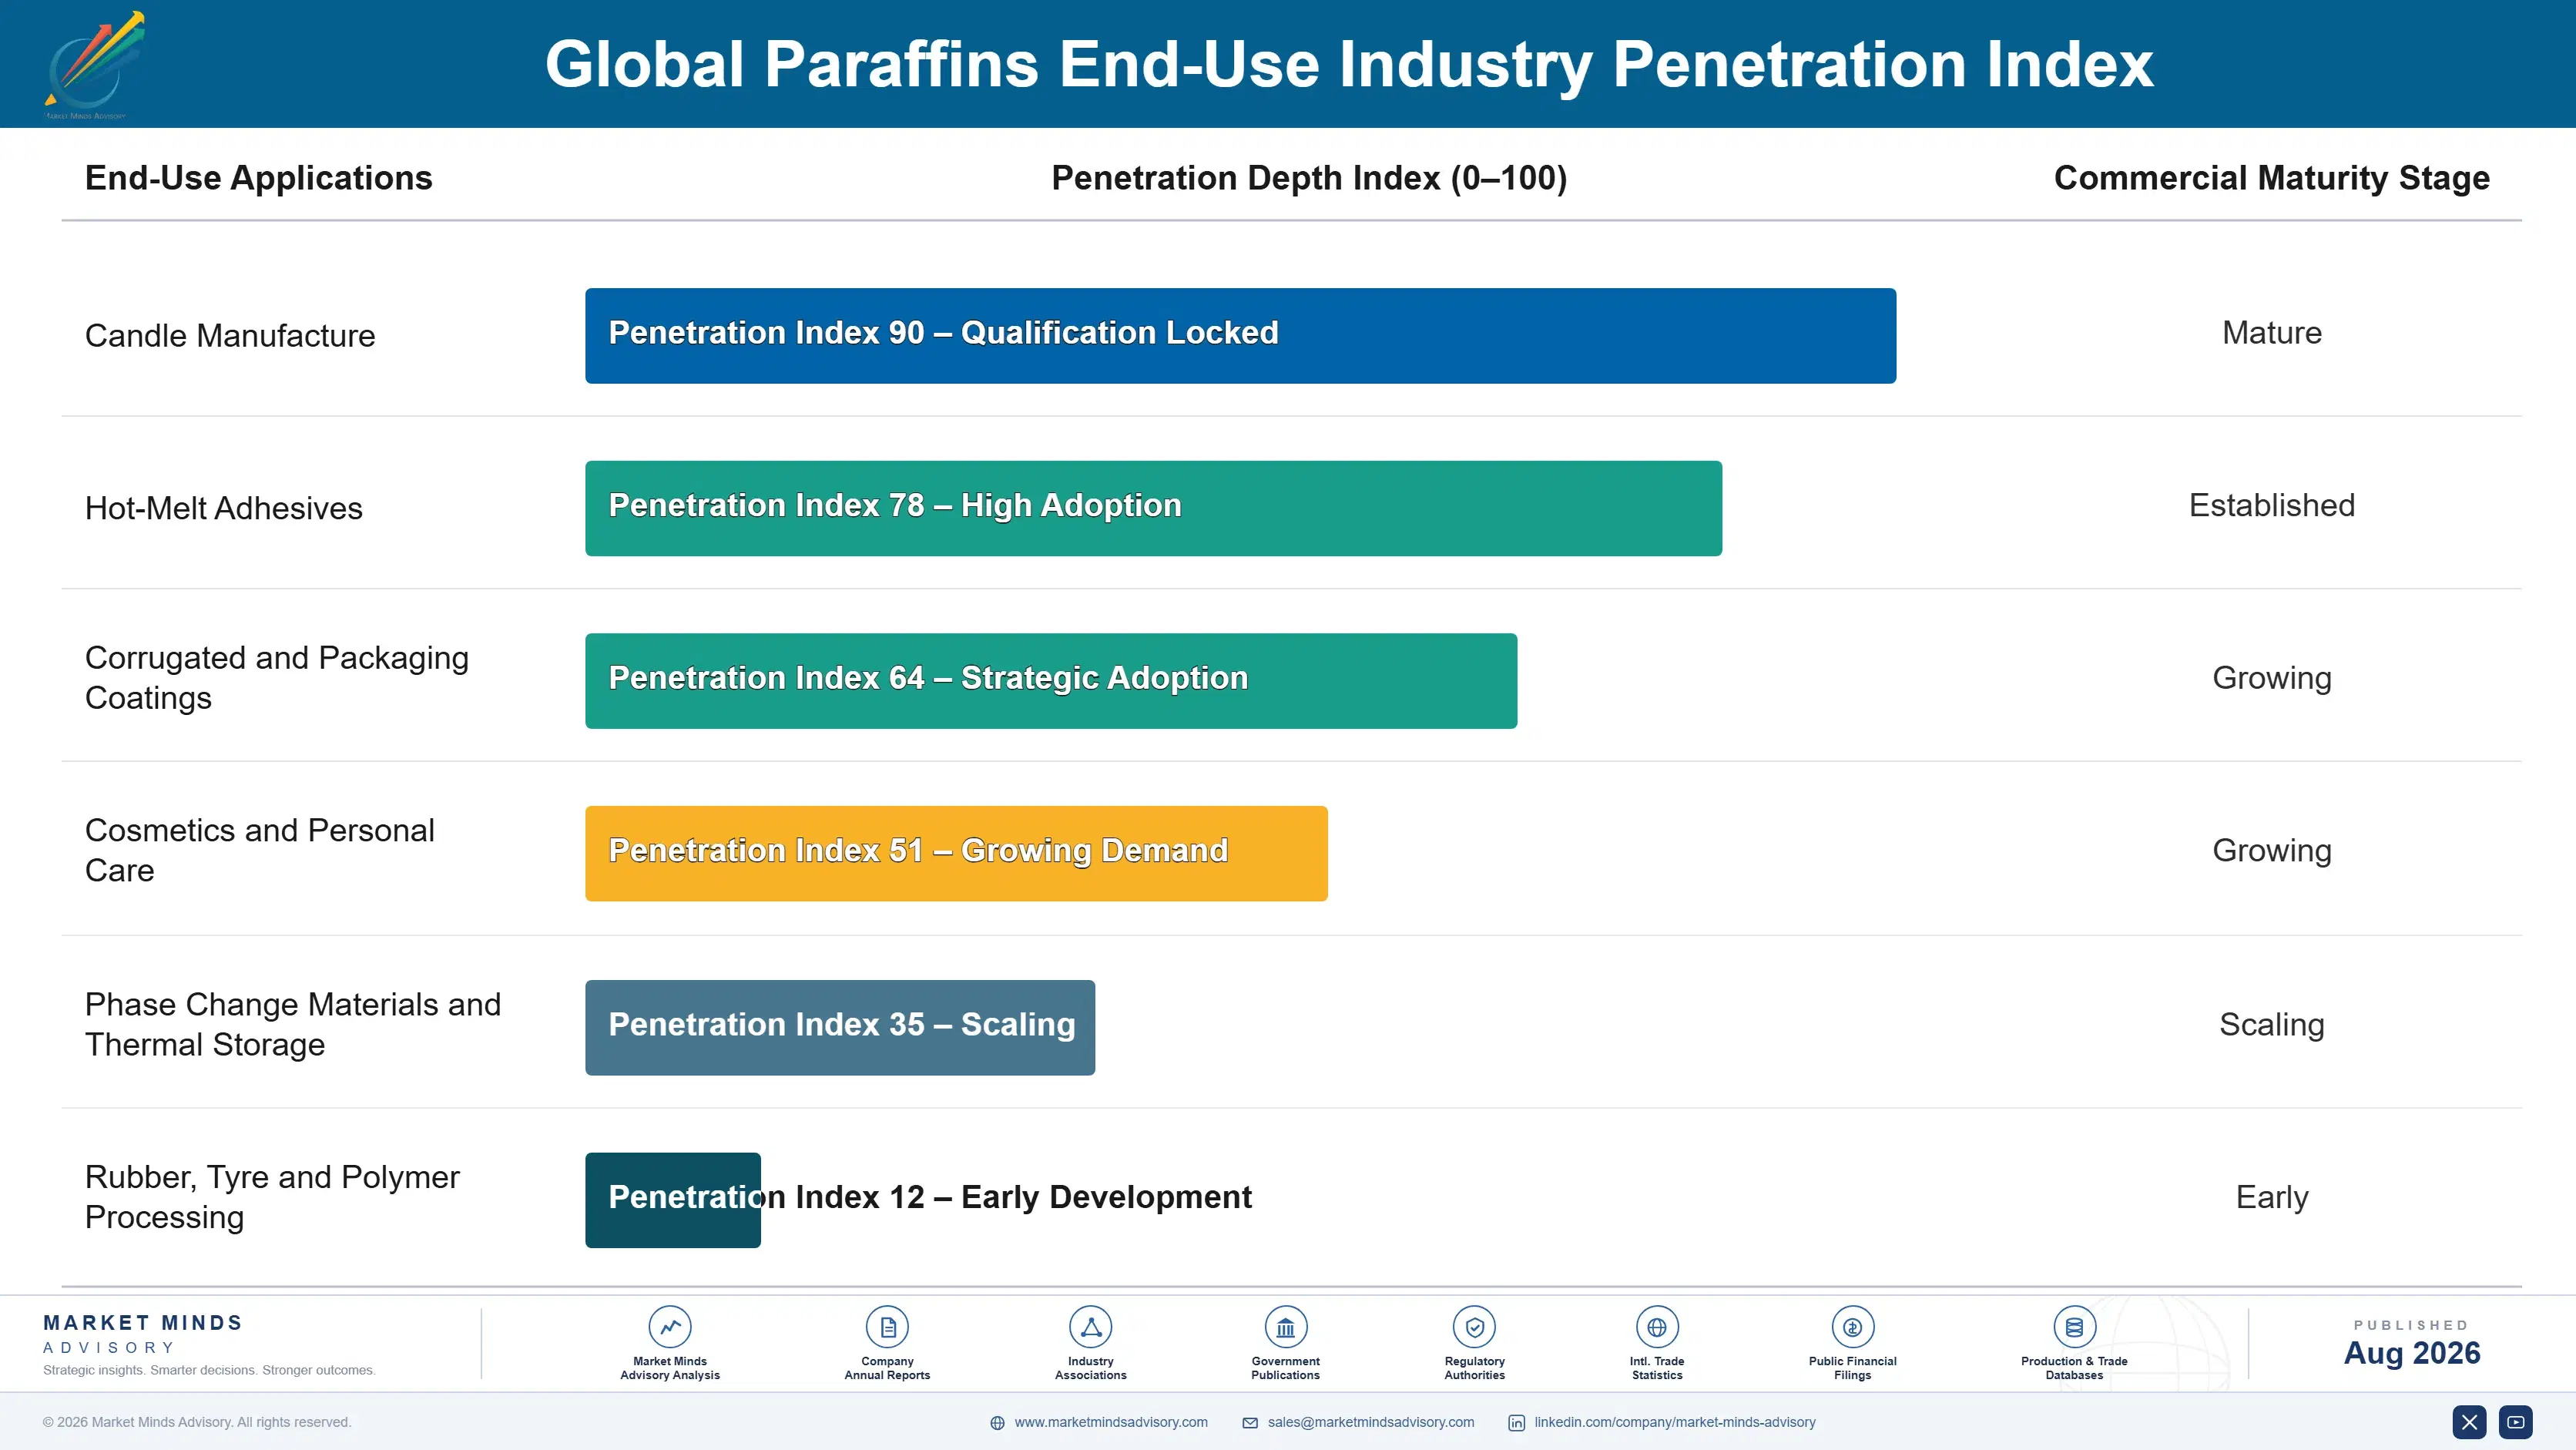
Technical wax demand behaves as an annuity attached to a qualified formulation. Once a grade is specified into a hot-melt adhesive or a food contact coating, it ships against that formulation for years, because oil content and congealing point changes cause bond or barrier failures that appear only in service.
Stickiness varies sharply by end use. Food contact and pharmaceutical customers are the tightest, since their own regulatory filings name the supplier and any change requires refiling. Hot-melt adhesive formulators sit close behind, held by bond performance that only field use reveals properly. Phase change material customers are moderately sticky, locked by congealing point tolerance. Candle manufacture is barely sticky at all, with buyers switching origin on delivered price every season and no qualification work involved whatsoever.

Buyer profiles have changed since the 2022 squeeze. Purchasing once sat with formulators comparing price per tonne against a congealing point specification. It now frequently involves supply chain risk and regulatory functions asking about contracted availability, refinery closure exposure and carbon intensity of the production route. Producers whose commercial approach still leads with spot pricing find themselves talking to buyers for whom availability is the first question and cost comes considerably later.
global-paraffins-market-trends-end-use-penetration-index-1787311664789

Where To Place Capital

These are among the four positions where our research anticipates prominent divergence between winners and laggards over the coming forecast period. Each is grounded in the demand model, the regulatory perimeter, and the announced capacity pipeline.
01 / SPECIFICATION CAPABILITY BUILD

Hydrofinishing is the whole margin question here

Semi-refined wax competes globally on delivered cost while hydrofinished technical grades realise roughly 40% more per tonne from the same underlying feedstock stream. Capability costs between $22 million and $45 million on an existing dewaxing site, which is modest against the pricing difference it delivers across the whole output stream. Many producers never built the capability because they treated wax as tonnage to clear rather than product to sell, and that historical decision is precisely what leaves the commercial opening available today.
02 / REGULATORY APPROVAL COVERAGE

Food and pharmaceutical approvals cost almost nothing

Food contact, cosmetic and pharmaceutical approvals require documented purity control and site compliance rather than any process change, costing under $3 million across an entire grade family over roughly eighteen months of work. Realised pricing runs 25% to 35% above technical grade and customers requalify very slowly, because their own regulatory filings reference the wax supplier by name and any change requires refiling. The return on this particular spend is comfortably the cleanest available anywhere across the whole wax business.
03 / SUPPLY SECURITY CONTRACTING

Trade spike upside for permanent demand retention

Wax supply cannot respond to price in any timeframe, which makes periodic squeezes inevitable and the demand destruction that follows them permanent rather than merely cyclical. Formulators who lost supply during 2022 substituted toward polyethylene wax and most of them have not returned since. Multi-year contracts carrying volume floors hold realisations 12% to 18% above soft spot pricing while sacrificing most spike upside, and they keep formulators from qualifying an alternative material that never comes back once it is in.
04 / SYNTHETIC ROUTE POSITIONING

Only synthetic capacity answers demand directly

Fischer-Tropsch wax is the single paraffin supply that can actually be built in response to wax demand rather than inherited from somebody's base oil run, and it commands roughly 55% above fully refined petroleum wax on process consistency alone. The barrier here is capital scale rather than any technology gap, and capacity additions depend entirely on gas or coal monetisation economics. Producers holding synthetic capacity are quietly taking exactly the technical applications that petroleum wax keeps losing to polyethylene alternatives every year.

Engagement Snapshot From the Field

A live engagement with an industry participant carrying material or product regulatory and market exposure ahead of a defining policy shift, showing how our research translates into a defensible multi-year portfolio strategy.
MARKET MINDS ADVISORY · CLIENT ENGAGEMENT SUMMARY
Global Paraffins Producer Strategic Portfolio Review and Transition Roadmap 2026·Investment Scenario on Global Paraffins Exposure Evaluation 2025-26
CLIENT PROFILE
A North American specialty refiner with annual revenue near $310 million from its wax and specialty products division (client-reported, unverified by MMA), operating solvent dewaxing at two sites with limited hydrofinishing capability. Roughly 71% of wax volume sold as slack and semi-refined grades into candle and particle board markets, priced against fuel oil alternatives under a residue accounting convention.
STRATEGIC CHALLENGE
Wax had been managed as a by-product to clear rather than a product to sell, and the division could not justify hydrofinishing investment under the internal cost allocation it operated. Meanwhile adhesive and packaging customers were asking for technical grades the refiner could not supply, and several had qualified polyethylene wax alternatives instead during the 2022 squeeze.
MMA APPROACH
MMA rebuilt the division's cost allocation to treat wax as a product rather than a refinery residue, modelled hydrofinishing investment returns under that revised basis, and assessed which lost adhesive accounts remained recoverable. Findings were tested against 47 expert interviews covering adhesive formulator qualification practice, food contact approval requirements and Group One closure schedules across North America.
KEY FINDINGS
  1. Residue-basis cost allocation had made every hydrofinishing case fail internally, while product-basis allocation showed returns above the corporate threshold on both sites.
  2. Technical grade pricing available to the client sat roughly 43% above its realised semi-refined pricing (client-reported, unverified by MMA), on essentially the same feedstock stream.
  3. Of eleven adhesive accounts lost during the 2022 squeeze, four had not fully committed to polyethylene alternatives and remained recoverable with consistent technical grade supply.
  4. Food contact approval across the grade family would cost under $2.4 million and open cosmetic and packaging customers the refiner had never been able to approach at all.
CLIENT PROFILE
A North American specialty refiner with annual revenue near $310 million from its wax and specialty products division (client-reported, unverified by MMA), operating solvent dewaxing at two sites with limited hydrofinishing capability. Roughly 71% of wax volume sold as slack and semi-refined grades into candle and particle board markets, priced against fuel oil alternatives under a residue accounting convention.
STRATEGIC CHALLENGE
Wax had been managed as a by-product to clear rather than a product to sell, and the division could not justify hydrofinishing investment under the internal cost allocation it operated. Meanwhile adhesive and packaging customers were asking for technical grades the refiner could not supply, and several had qualified polyethylene wax alternatives instead during the 2022 squeeze.
MMA APPROACH
MMA rebuilt the division's cost allocation to treat wax as a product rather than a refinery residue, modelled hydrofinishing investment returns under that revised basis, and assessed which lost adhesive accounts remained recoverable. Findings were tested against 47 expert interviews covering adhesive formulator qualification practice, food contact approval requirements and Group One closure schedules across North America.
KEY FINDINGS
  1. Residue-basis cost allocation had made every hydrofinishing case fail internally, while product-basis allocation showed returns above the corporate threshold on both sites.
  2. Technical grade pricing available to the client sat roughly 43% above its realised semi-refined pricing (client-reported, unverified by MMA), on essentially the same feedstock stream.
  3. Of eleven adhesive accounts lost during the 2022 squeeze, four had not fully committed to polyethylene alternatives and remained recoverable with consistent technical grade supply.
  4. Food contact approval across the grade family would cost under $2.4 million and open cosmetic and packaging customers the refiner had never been able to approach at all.
RECOMMENDED STRATEGY
Phase 1: Phase one: move wax to a product profit and loss basis before any capital request, since residue accounting had been failing every investment case automatically. Phase 2: Phase two: install hydrofinishing at the larger site only, sized against the recoverable adhesive accounts rather than against total wax output. Phase 3: Phase three: complete food contact approval across the grade family in parallel, opening cosmetic and packaging demand as capability comes online.
OUTCOME
The client moved wax onto a product accounting basis within four months and approved hydrofinishing at the larger site, reporting realised pricing on technical grades roughly 38% above its semi-refined material (client-reported, unverified by MMA). Three of the four recoverable adhesive accounts returned on multi-year contracts with volume floors attached.

Frequently Asked Questions

Foundational context covering the market sizes, CAGR, scope, country, region and competition that inform every finding below. This section is provided to cover basics and most often pre-purchase conversations, answered from the MMA Primary Research Dataset.

What is the current size of the Global Paraffins Market?

The market was worth $5.8 billion in 2025 and is forecast to reach $6.06 billion in 2026. Value growth reflects tightening supply and grade mix rather than any volume expansion.

How large will the Global Paraffins Market be by 2036?

MMA forecasts $9.32 billion by 2036, an expansion multiple of 1.54 times the 2026 base. That represents $3.26 billion of incremental value across the forecast period.

What is the CAGR for the Global Paraffins Market 2026 to 2036?

The base case compound annual growth rate is 4.4%, with a bull case of 5.6% and a bear case of 3.2%. Historical growth from 2020 to 2025 ran at 3.5%.

Which segment is growing fastest?

Fischer-Tropsch and synthetic wax at 6.6%, a full 1.50 times the market rate. It is the only paraffin supply anyone is deliberately adding rather than losing to refinery closures.

Who are the major companies in the Global Paraffins Market?

Sinopec, Sasol, ExxonMobil, Shell and CNPC lead, holding 38% of output between them. Fifteen further producers hold meaningful grade-specific or regional positions across the market.

Which country is growing fastest?

India at 7.2%, pulled by packaging adhesive consumption rising with e-commerce and by a very large candle manufacturing sector. Indian refiners also retain Group One wax capacity.

Report Segmentation Architecture

The full report scope spans multiple orthogonal segmentation dimensions, with cross-tabulated demand data provided for each dimension pair. Coverage extends further to regional breakdowns, trend trajectories, and the competitive detail needed to support segment-level decision-making.

By Paraffin Product Type

  • Fischer-Tropsch and Synthetic Wax
  • Fully Refined Paraffin Wax
  • Microcrystalline Wax
  • Liquid Normal Paraffins
  • Semi-Refined Paraffin Wax
  • Slack Wax

By End-Use Industry

  • Candle Manufacture
  • Hot-Melt Adhesives
  • Corrugated and Packaging Coatings
  • Cosmetics and Personal Care
  • Phase Change Materials and Thermal Storage
  • Rubber, Tyre and Polymer Processing

By Commercial Dimension

  • Direct Supply to Formulators
  • Slack Wax Sales to Third-Party Upgraders
  • Distributor and Trading House Channel
  • Term Contracts with Volume Floors
  • Food and Pharmaceutical Approved Supply Agreements

By Region

  • North America
  • Western Europe
  • East Asia
  • South Asia and Pacific
  • Latin America
  • Middle East and Africa
  • Eastern Europe

Scope, Methodology, and Coverage

Every figure in this report is reproducible from documented input assumptions. The scope below maps the historical period, the forecast horizon, the segmentation dimensions, and the countries covered, alongside the underlying primary and qualitative methodology.
Historical Period
2020 to 2025
Forecast Period
2026 to 2036
Base Year
2025 (USD billions; MMA Primary Research Dataset, August 2026)
Market Definition
This report covers paraffins supplied as refined petroleum and synthetic products, spanning fully refined and semi-refined paraffin wax, slack wax, microcrystalline wax, liquid normal paraffins and Fischer-Tropsch synthetic wax. Coverage traces value from solvent dewaxing and synthesis through hydrofinishing and blending to the point of formulation or end use. Petroleum jelly and white oils, polyethylene and polypropylene waxes, natural waxes including beeswax, carnauba and soy, chlorinated paraffins, base oils sold as lubricants, and finished articles such as candles or coated packaging are excluded from scope.
Quantitative Units
USD billions at producer realised prices; volume in thousand tonnes; gross margin percentages and capacity shares by tier.
Segmentation Dimensions
Paraffin product type, end-use industry, commercial dimension, region.
Regions Covered
North America, Western Europe, East Asia, South Asia and Pacific, Latin America, Middle East and Africa, Eastern Europe
Countries Covered
China, Japan, South Korea, India, Indonesia, Malaysia, Australia, United States, Canada, Mexico, Germany, France, Netherlands, Spain, Brazil, Russia, Poland, Turkey, Iran, South Africa.
Key Companies Profiled
Sinopec, Sasol, ExxonMobil, Shell, CNPC, Nippon Seiro, HF Sinclair, Calumet Specialty Products, The International Group, Sonneborn, and ten further producers.
Quantitative Methodology
Primary survey, n=3,800 respondents, Q4 2025, six countries; demand-side model with trade association cross-validation
Qualitative Methodology
47 expert interviews, Q4 2025; applied to validate demand model assumptions, identify emerging dynamics, and assess competitive positioning
Report Format
PDF and XLSX data workbook (Word format preview document)
Publisher
Market Minds Advisory
Report Code
MMA-2026-CHM-746
Published
August 2026
Contact
sales@marketmindsadvisory.com | www.marketmindsadvisory.com

Purchase the full Global Paraffins Market Report (2026 to 2036).

The full report sets out ten-year forecasts for paraffins by product type, end-use industry and commercial model across seven regions. It tracks Group One base oil capacity closures site by site and quantifies the wax output each removes through 2036. Competitive assessment covers twenty producers on a consistent production volume basis, separating retained refinery capacity from hydrofinishing and specification capability. Substitution risk from polyethylene and synthetic waxes is modelled application by application, with recoverable demand identified where substitution remains incomplete. Findings draw on a quantitative survey of 3,800 respondents across six countries and 47 expert interviews conducted during the fourth quarter of 2025.
Ten-year forecasts by paraffin product type and region
Group One capacity closures tracked site by site
Substitution risk modelled application by application
Twenty-producer assessment on consistent volume basis
By-product cost allocation compared across producer types
Grade margin architecture across three commercial tiers

Built For The People Who Decide

From boardroom strategy to bench-side execution, this report is read cover-to-cover by leaders shaping the next decade of their industry, turning demand scenarios, market dynamics and valuation benchmarks into decisions.
CXOs/ Presidents/ VPs/ Managers
M&A and Corporate Development
Strategy Teams and R&D Heads
Procurement and Product Directors
Regulatory and Compliance Leaders
Investor Relations and Equity Analysts