Market Minds Advisory
Nitric Acid Market

Nitric Acid Market: Semiconductor Purity Demand Meets Fertilizer Commodity Economics

Semiconductor fabrication expansion is pulling high-purity nitric acid demand well ahead of the broader fertilizer-driven commodity market, rewarding producers with ultra-high-purity processing capability over standard ammonium nitrate feedstock production alone.

Lead Analyst

Bilal Shaikh

Published

September 2026

Make Smarter Decisions with Customized Research Insights

Request a free sample report and evaluate market opportunities, growth trends, and competitive dynamics relevant to your business needs.

2025 MARKET VALUE$27.8BMarket Size 2025
2036 FORECAST VALUE$43.7BBase Case , 2026 to 2036
CAGR 2026 TO 20364.2 %Bull 5.2% / Bear 3.2%
INCREMENTAL OPPORTUNITY$14.7BNet 10- year value creation
EXPANSION MULTIPLE1.51x2036 value over 2026 base
Strategic Levers
M&A Pipeline
Regional Outlook
Country Rankings
Competitive Intelligence
Segmental Deep-dive
Call-Us : 91 93563 13602

Executive Snapshot and Market Trajectory

Nitric acid demand remains anchored in fertilizer production, but high-purity grades are pulling ahead fast as semiconductor fabrication expansion requires ultra-high-purity acid that standard dilute grades cannot reliably provide. Producers with process control depth capture the resulting margin premium across every application category. That gap widens further each year.
Demand concentrates in three areas: fertilizer production requiring dilute nitric acid for ammonium nitrate manufacturing, explosives manufacturing requiring concentrated grades for mining and construction applications, and semiconductor processing requiring ultra-high-purity acid for wafer cleaning and etching. China anchors global production given its dominant fertilizer manufacturing base and expanding semiconductor sector. Metal processing applications round out a genuinely diversified global demand base spanning multiple industrial sectors.
Competition remains genuinely fragmented among regional fertilizer and chemical producers, led by Yara International and CF Industries on volume dilute acid production and specialty electronics chemical suppliers on high-purity grades. Purity documentation and process control depth, not raw production capacity, decide which suppliers win long-term contracts. Semiconductor customers increasingly require trace metal documentation that standard commodity producers cannot easily provide without dedicated testing infrastructure and years of accumulated process control investment behind them.
Market Definition
This market covers nitric acid across dilute, concentrated, and high-purity grades used in fertilizer manufacturing, explosives production, metal processing, and semiconductor applications. It excludes finished ammonium nitrate fertilizer products, finished explosives, and nitrogen-based specialty chemicals not classified as nitric acid itself.
Base Year Value
$27.8B in 2025 (MMA Primary Research Dataset, August 2026)
Forecast Period
2026 to 2036, eleven discrete annual values
CAGR
4.2% base case. Bull 5.2%. Bear 3.2%.
Fastest Growth Segment
High-Purity Nitric Acid for Semiconductor and Electronics: 5.7% CAGR
Fastest Growth Country
China: 5.4% CAGR
Fastest Growth Region
South Asia and Pacific: 6.2% CAGR
Largest Region
East Asia: 29% of 2025 global value
Market Leaders
Yara International ASA, CF Industries Holdings Inc., OCI N.V., Nutrien Ltd., EuroChem Group AG. Source: MMA Analysis based on company annual reports.
Primary Survey
n=3,800 procurement and R&D decision-makers, Q4 2025, six countries
Methodology
Demand-side build-up, cross-validated against public data, 47 expert interviews

Nitric Acid Market Forecast Scenarios

global-nitric-acid-market-trends-size-forecast-scenario-1787311552482
Nitric acid demand grew steadily through 2020 to 2025 as global fertilizer production and industrial activity recovered from pandemic-related disruption while semiconductor demand accelerated meaningfully. The market grew at an estimated 3.6% historical CAGR across the period, with high-purity grade volume consistently outpacing standard dilute acid demand from 2022 onward. Supply chain disruption affecting ammonia feedstocks periodically constrained available production capacity.
The base case assumes 4.2% CAGR through 2036, driven by three mechanisms operating together. First, continued global fertilizer demand, tied to agricultural production and food security priorities, sustains steady dilute nitric acid consumption for ammonium nitrate manufacturing across major agricultural markets. Second, semiconductor fabrication capacity expansion is driving specification of ultra-high-purity nitric acid for wafer cleaning applications that standard commodity grades cannot reliably support. Third, continued mining and construction activity sustains steady concentrated acid demand for explosives manufacturing.
The bull case (5.2% CAGR) assumes faster-than-expected semiconductor capacity investment and accelerated global fertilizer demand pull premium acid demand forward ahead of current planning assumptions. The bear case (3.2% CAGR) reflects the risk that global fertilizer demand growth slows meaningfully, tempering the segment that has anchored steady growth across this mature commodity chemical market overall.

Purity Documentation Separates Semiconductor From Commodity Grades

Nitric acid economics increasingly separate along purity documentation rather than raw production capacity, since semiconductor customers pay meaningfully higher pricing for ultra-high-purity acid meeting trace metal specifications that standard fertilizer-grade production lines cannot reliably achieve. This dynamic is reshaping how producers allocate capital across their existing production and process control infrastructure base worldwide.
CR5 CONCENTRATION30%share held by the top five global nitric acid producers
AVERAGE SELLING PRICE$280-2,400/tonrange spanning dilute fertilizer to high-purity electronics grades
TOP PRODUCING COUNTRY SHAREChina, 25%share of total global nitric acid production capacity today
CAPACITY UTILIZATION74%average operating rate across qualified nitric acid production facilities
TRADE INTENSITY17%of finished acid volume crossing borders before industrial use
FEEDSTOCK COST SHARE51% of COGSammonia and platinum catalyst input costs combined together
Fertilizer producers and semiconductor manufacturers behave very differently as buyers. Fertilizer producers negotiate primarily on price and delivery consistency across large-volume dilute acid contracts tied to seasonal agricultural demand, while semiconductor manufacturers require extensive trace metal documentation and multi-year qualification processes that few standard producers can support without dedicated investment. Neither buyer type shows much willingness to switch suppliers once an established relationship proves reliable over multiple production cycles. Certification depth increasingly separates qualified suppliers from transactional commodity sellers.
Over the next decade, two forces will determine winners. Continued global fertilizer demand will keep expanding addressable dilute acid volume, while semiconductor fabrication growth adds a second, purity-driven growth vector rewarding producers with strong process control and documentation investment. Producers slow to invest in either dimension risk ceding share to faster-moving, better-capitalized competitors over the coming decade.
"Nitric acid is about as commodity as chemicals get, until you need to clean a silicon wafer without leaving a single stray metal ion behind. The suppliers winning semiconductor contracts are the ones who can prove parts-per-trillion purity, not the ones quoting the cheapest tanker load."
Director, Industrial Chemicals and Specialty Acids Practice · MMA Chemicals and

Market Trends

Semiconductor Fabrication Growth Drives High-Purity Demand

Global semiconductor fabrication capacity expansion is driving sustained demand for ultra-high-purity nitric acid meeting the stringent trace metal specifications wafer cleaning and etching processes require, a purity level standard fertilizer-grade production lines cannot reliably achieve without dedicated infrastructure. This demand has grown fastest among producers serving leading-edge fabrication facilities, where trace contamination directly affects wafer yield and process repeatability in ways commodity acid grades cannot support. Several major producers have expanded dedicated high-purity production lines specifically to serve this growing demand, recognizing that once a semiconductor customer qualifies a supplier, switching becomes costly given the process validation involved.
Market Impact: Adds 3 percent explosives segment d
Agricultural Fertilizer Demand Sustains Baseline Dilute Volume

Continued global agricultural production, tied to food security priorities and expanding cultivated acreage across emerging markets, sustains steady dilute nitric acid demand for ammonium nitrate fertilizer manufacturing that represents the largest single application in the entire market. This demand has remained remarkably stable given the consistent seasonal fertilizer application cycles across major agricultural regions, providing producers with reasonably predictable baseline revenue visibility. Producers serving this segment typically maintain long-standing relationships with fertilizer manufacturers built over years of consistent supply reliability. Producers securing early qualification with fertilizer manufacturers gain multi-year contract revenue visibility spanning seasonal application cycles.
Market Impact: Adds 2 percent metal processing dem

Market Opportunities and Growth Drivers

Mining and Construction Activity Sustains Explosives Demand

Global mining and construction activity continues to drive steady demand for concentrated nitric acid used in ammonium nitrate fuel oil explosives manufacturing, providing a demand segment that follows different cyclical patterns than fertilizer-driven dilute acid consumption. This demand has remained relatively steady given the consistent blasting and excavation requirements across active mining and infrastructure construction projects worldwide, supporting predictable baseline revenue for producers serving this application even during periods of fertilizer demand softness. Producers serving this demand typically maintain long-standing relationships with explosives manufacturers built over years of consistent supply reliability.
Market Impact: Adds 20 percent feedstock cost vola

Metal Processing Demand Grows With Manufacturing Investment

Growing metal finishing and pickling activity across manufacturing sectors continues to drive steady demand for nitric acid formulations used in surface treatment and metal cleaning applications ahead of coating and fabrication processes. This demand has grown steadily as manufacturing capacity expansion across multiple industrial sectors sustains consistent metal processing volume requiring nitric acid-based treatment chemistry. Producers serving this demand typically maintain close technical relationships with metal finishing operations built over years of consistent formulation performance. Continued manufacturing capacity investment is expected to sustain this demand pattern well into the next decade.
Market Impact: Adds 3 year qualification timeline

Market Restraints and Challenges

Ammonia Feedstock Price Volatility Compresses Margins

Ammonia feedstock prices have shown meaningful volatility tied to natural gas costs and broader nitrogen fertilizer supply and demand cycles, creating margin pressure for producers unable to pass through cost increases quickly given seasonal fertilizer contract pricing structures common in agricultural markets. This volatility disproportionately affects smaller producers with limited feedstock purchasing scale, since ammonia represents a substantial share of total production cost that cannot easily be offset through process efficiency alone. Producers are addressing this through longer-term ammonia supply agreements and, where feasible, backward integration into upstream ammonia production capacity.
Market Impact: Adds 7% high-purity segment volume

Semiconductor Qualification Timelines Limit New Entry

Achieving semiconductor customer qualification for ultra-high-purity nitric acid typically requires extensive trace metal testing and multi-year documentation processes that most standard fertilizer-grade producers lack the specialized process control infrastructure to complete without external partnership or sustained investment. This qualification barrier has kept the high-purity segment far more concentrated than the broader nitric acid market, where standard fertilizer specification requirements remain considerably less demanding. Smaller producers are addressing this through technical partnerships with established high-purity chemical suppliers, though this approach typically limits the pace at which new capacity can access premium contracts.
Market Impact: Adds 3% fertilizer segment stabilit
3 additional market trends, 4 additional growth drivers, and 3 additional restraints and challenges are covered in the full report. Contact sales@marketmindsadvisory.com to access the complete intelligence.

Segment CAGR and Growth Architecture

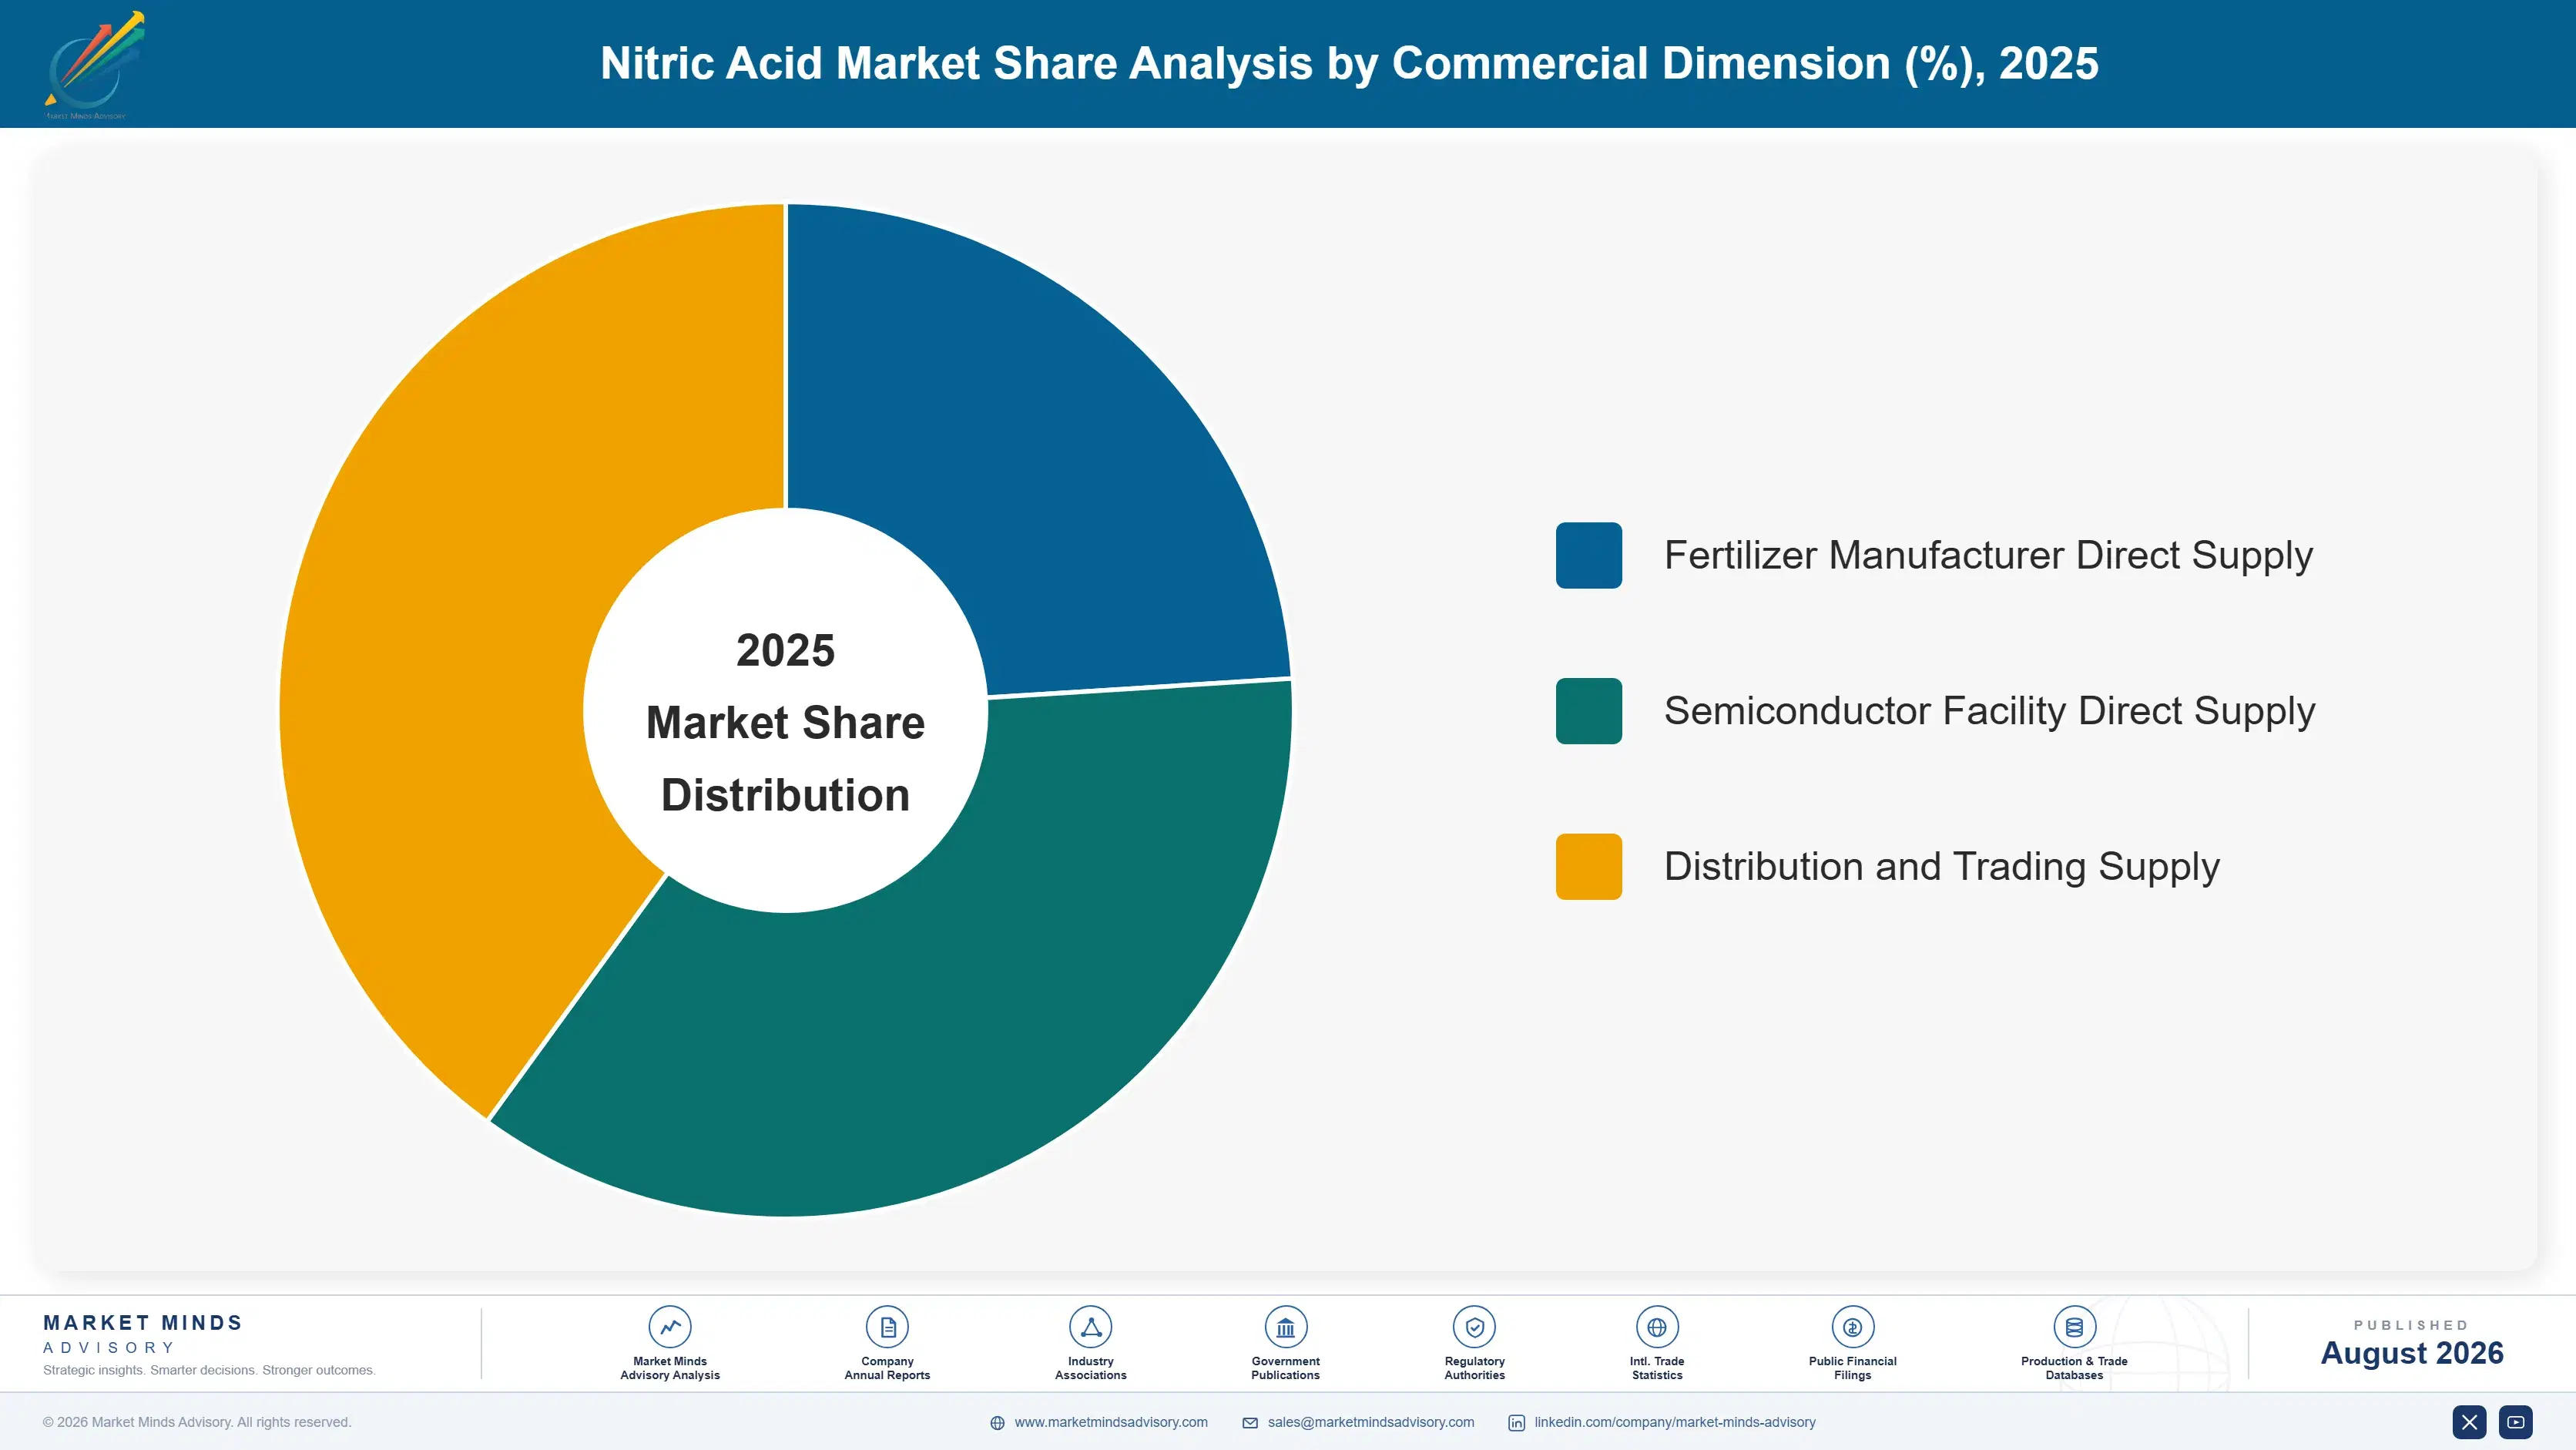
MMA segments this market by concentration and purity grade, the classification producers and buyers use when specifying strength and contamination requirements for a given application. This lens separates dilute, concentrated, and high-purity grades by underlying production specification rather than end-use industry alone. Buyer relationships vary considerably across each of these purity categories and application contexts.
global-nitric-acid-market-trends-market-share-analysis-1787311553013

High-Purity Nitric Acid for Semiconductor and Electronics

High-purity nitric acid for semiconductor and electronics is the fastest-growing segment by a meaningful margin, expanding directly alongside semiconductor fabrication capacity investment as manufacturers specify this grade for wafer cleaning and etching applications requiring trace metal purity conventional fertilizer-grade acid cannot achieve. This segment commands the highest pricing in the entire market, reflecting the sustained process control and testing investment required to achieve consistent trace metal specifications across production batches. Yara and CF Industries hold strong positions in specialty divisions serving this segment given established process expertise and long-standing electronics manufacturer relationships built over years of qualification work. Growth here concentrates disproportionately in leading-edge semiconductor fabrication facilities expanding alongside global chip manufacturing investment trends.
CAGR 5.7%

Concentrated Nitric Acid for Explosives Manufacturing

Concentrated nitric acid for explosives manufacturing demand is expanding faster than the broader commodity base, driven by continued mining and construction activity requiring ammonium nitrate fuel oil explosives for blasting and excavation applications across active project sites. This segment requires close collaboration between acid producers and explosives manufacturers during supply chain planning, since concentrated acid handling and transportation require specialized safety infrastructure that standard dilute acid distribution does not require. Orica and Incitec Pivot maintain meaningful positions in this segment given established explosives manufacturing integration. Growth here tracks mining and construction investment cycles rather than short-term agricultural commodity price swings affecting dilute acid demand. Continued global mining investment supports durable long-term demand visibility for this segment specifically.
CAGR 4.9%
Full segment breakdown across 6 segments available in the complete report.

Regional Architecture and Country Demand Map

East Asia dominates nitric acid production and consumption given China's massive fertilizer manufacturing base and expanding semiconductor sector, with North America and Western Europe following through established industrial demand. South Asia and Pacific trails only slightly given India's rapidly expanding agricultural and electronics manufacturing investment.

North America

United States fertilizer production, concentrated across established manufacturing clusters in the Midwest and Gulf Coast, anchors North American nitric acid demand alongside substantial semiconductor fabrication and mining explosives volume across the broader region. CF Industries and LSB Industries maintain significant domestic production and process control capacity serving both fertilizer manufacturers and semiconductor customers directly from established regional facilities. Canada contributes smaller but steady mining explosives demand tied to its established resource extraction sector. Growing domestic semiconductor manufacturing investment, driven by federal incentive programs supporting chip production reshoring, has accelerated high-purity acid demand across multiple producers in recent years. Growth trails East Asia's faster-expanding manufacturing base but benefits from strong semiconductor and agricultural demand diversity.
Share: 24% | CAGR: 4.7% (2026 to 2036)

Western Europe

Germany and Poland anchor European nitric acid demand through established fertilizer manufacturing and industrial processing industries. Grupa Azoty and Borealis, both with substantial European operations, maintain deep production and process infrastructure serving fertilizer and industrial customers across established regional facilities. European Union agricultural policy and food security priorities have driven meaningful fertilizer demand stability among regional producers serving farming customers across member states. Industrial processing demand across established German manufacturing sustains steady baseline acid demand for metal treatment applications. Growth trails the global average as the region's mature fertilizer and industrial base grows more slowly than expanding Asian manufacturing markets. Regional producers continue investing in supplier diversification programs to hedge against continued Asian supply concentration risk.
Share: 19% | CAGR: 2.8% (2026 to 2036)
Regional intelligence for 5 additional markets available in the complete report: East Asia, South Asia and Pacific, Latin America, Middle East and Africa, Eastern Europe. Contact sales@marketmindsadvisory.com.
global-nitric-acid-market-trends-country-cagr-analysis-1787311553525

Where Acid Producers Can Expand Margins

Producers create outsized value not from standard dilute tonnage but from high-purity process control, semiconductor qualification, and long-term contract security built over years of investment. The levers below identify where margin expands fastest, moving beyond commodity acid sales toward purity documentation, contract security, and process engineering support. Sustained investment across each dimension compounds meaningfully over time.

High-Purity Certification Commands Strong Premium Pricing

Producers that achieve and maintain ultra-high-purity semiconductor certification capture meaningfully higher realized pricing than standard fertilizer-grade acid, often 5 to 8 times the price per ton for equivalent volume, because semiconductor manufacturers pay for the documented trace metal purity and process control this certification provides over conventional commodity grades. This certification requires sustained process control and testing infrastructure investment, but producers that achieve it gain access to the highest-margin segment of the entire market well ahead of competitors selling standard commodity-grade acid alone. This positions certified producers to capture disproportionate profit share while holding modest tonnage.
Market Impact: Adds 450 to 600 basis points gross

Long-Term Semiconductor Supply Agreements Secure Revenue

Producers that secure multi-year supply agreements tied to specific semiconductor fabrication facilities gain revenue visibility spanning the full operating life of the facility, since fabrication plants rarely switch qualified suppliers given the trace metal validation risk involved in requalifying a new source mid-operation. This contract security requires proven purity consistency and delivery reliability, but producers achieving facility-level qualification convert commodity volume into durable, multi-year revenue relationships smaller transactional sellers cannot match. Producers achieving facility-level qualification convert commodity volume into revenue relationships spanning 8 to 12 years, since fabrication plants rarely requalify suppliers absent strong operational or safety cause.
Market Impact: Secures 8 to 12 years of contract r

Explosives Manufacturer Integration Deepens Relationships Further

Producers that develop integrated supply relationships with explosives manufacturers, including specialized concentrated acid handling and logistics infrastructure, capture demand that standard commodity distributors cannot easily serve given the safety infrastructure investment required. This integration requires substantial specialized handling equipment investment, but producers achieving proven safety and reliability records typically win 15 to 25% more explosives manufacturer contract allocations than generalist competitors lacking comparable specialized infrastructure. Consistent safety performance across multiple project cycles reinforces this competitive advantage over time. This integration requires substantial specialized safety infrastructure that generalist competitors rarely build given the capital commitment involved.
Market Impact: Wins 15 to 25 percent more contract

Backward Integration Into Ammonia Production Capacity

Producers that integrate backward into ammonia production capacity capture meaningfully lower feedstock cost exposure than competitors dependent on merchant market ammonia purchases, converting a substantial cost line into a durable margin advantage across both fertilizer and specialty acid production. This integration requires substantial capital investment in ammonia synthesis capacity, but producers achieving full backward integration typically reduce feedstock cost exposure by 20 to 30% relative to non-integrated competitors during periods of ammonia price volatility. This durability advantage compounds across multiple production cycles, since integrated capacity insulates margin from merchant market volatility.
Market Impact: Cuts feedstock exposure 20 to 30 pe

Who Controls the Margin Pool

CR5 stands at 30%, reflecting a genuinely fragmented market shaped by the regional nature of fertilizer distribution and the freight-driven economics that favor established local producers over global consolidation. The gap between the top five and smaller producers is widest in high-purity semiconductor grades, where trace metal documentation barriers protect leaders far more than in standard dilute fertilizer acid production.
Competition currently plays out across three dimensions: high-purity qualification races among specialty producers serving semiconductor customers, explosives manufacturer integration among producers targeting mining and construction demand, and capacity expansion timed to Asian fertilizer and semiconductor manufacturing growth among a broader group of regional producers. Smaller regional producers compete primarily on proximity-driven cost advantage within limited freight radii rather than purity depth or global contract scale.

Emerging pressure comes from two directions. Asian producers are investing in process control capability to reduce reliance on imported high-purity acid, though semiconductor qualification depth remains a gap relative to established Western and Japanese suppliers. Continued semiconductor capacity expansion could also reorder competitive rankings if high-purity demand accelerates faster than currently expected, favoring producers with early purity investment over pure-volume fertilizer competitors.
global-nitric-acid-market-trends-company-positioning-matrix-1787311554043

Competitive Moat and Risk Dimensions

YARA INTERNATIONAL ASA

Moat: Broadest Global Distribution Network

Yara operates the most extensive global fertilizer production and distribution network in the industry, built over decades of infrastructure investment, giving it preferred supplier status across agricultural customers worldwide requiring consistent, reliable dilute acid supply. This scale advantage, built over decades of consistent infrastructure reinvestment, is difficult for smaller regional producers to replicate quickly.
YARA INTERNATIONAL ASA

Risk: Limited Semiconductor Scale

Yara's production capacity remains concentrated primarily in standard fertilizer-grade acid, limiting its ability to compete for the highest-margin semiconductor contracts without significant additional process control investment. Expanding high-purity process control investment would help Yara capture additional semiconductor contract share over time. Progress here remains gradual given the scale of investment required.
CF INDUSTRIES HOLDINGS INC.

Moat: Deep North American Manufacturing Base

CF Industries operates extensive domestic production capacity built over decades of infrastructure investment, giving it preferred supplier status across North American fertilizer and industrial customers requiring reliable regional supply and logistics. This footprint gives CF Industries resilience against regional demand softness that more geographically concentrated competitors cannot easily offset.
CF INDUSTRIES HOLDINGS INC.

Risk: Concentrated Domestic Exposure

CF Industries' production and revenue base remains concentrated in North America, leaving it more exposed than geographically diversified competitors to domestic agricultural demand cycles specific to that single market alone. Diversifying into semiconductor-grade production would help CF Industries reduce this domestic concentration risk over time.

Players Tracked

Prominent Players

Yara International ASA
CF Industries Holdings Inc.
OCI N.V.
Nutrien Ltd.
EuroChem Group AG

Other Key Players

Orica Limited
Incitec Pivot Limited
Borealis AG
LSB Industries Inc.
Grupa Azoty S.A.
Achema AB
Sichuan Meifeng Chemical Industry Co. Ltd.
Shanxi Tianji Coal Chemical Industry Group Co. Ltd.
Fertiberia S.A.
Gujarat Narmada Valley Fertilizers & Chemicals Ltd.
Rashtriya Chemicals and Fertilizers Limited
Deepak Fertilisers and Petrochemicals Corporation Limited
Anhui Hongsifang Chemical Co. Ltd.
Toagosei Co. Ltd.
Kemira Oyj

Recent Developments

JANUARY 2025

CF Industries Expands High-Purity Production Capacity

CF Industries announced completion of a capacity expansion at its domestic production facility, adding qualified high-purity nitric acid capacity to serve growing semiconductor customer demand. The expansion follows several years of process control investment supporting trace metal purity documentation. The expansion strengthens its position in the fastest-growing demand segment.
Signal: Confirms leading producers are dedicating
MAY 2025

Sichuan Meifeng Expands Domestic Production Capacity

Sichuan Meifeng Chemical announced completion of a capacity expansion at its domestic production facility, adding qualified nitric acid capacity to serve growing Chinese fertilizer and industrial customer demand. The expansion follows several years of investment tracking continued domestic agricultural growth. The expansion strengthens its domestic market position.
Signal: Signals major Chinese producers are scalin
SEPTEMBER 2025

Yara and a Major Semiconductor Manufacturer Sign Supply Agreement

Yara signed a multi-year supply agreement with a major semiconductor manufacturer covering high-purity nitric acid supply for a new fabrication facility. The agreement secures forward volume for Yara at negotiated pricing tied to the manufacturer's long-term production planning. The deal reflects growing preference for locked-in supply security.
Signal: Signals semiconductor manufacturers are in

Ammonia and Platinum Catalyst Exposure

Ammonia feedstock and platinum catalyst inputs together account for roughly 51% of cost of goods sold across nitric acid production, with ammonia pricing tied to natural gas costs and platinum pricing tied to broader precious metal supply and demand cycles. Producers relying on spot-market ammonia purchases face greater price exposure than those with long-term supply agreements.
Natural gas and ammonia prices rose sharply during 2021 and 2022, documented in company annual reports across the sector, as broader energy market disruption tightened available ammonia supply faster than downstream demand could adjust. Several producers reported compressed margins during this period, since customer pricing on longer-term fertilizer contracts could not be renegotiated quickly enough to reflect rising feedstock cost. Recovery in downstream pricing followed only gradually as contract renegotiation cycles took time.

This exposure disadvantages smaller producers without long-term ammonia supply agreements relative to larger, better-capitalized competitors who hedge exposure through diversified sourcing and, in some cases, backward integration into upstream ammonia production. Producers without secured supply face meaningfully greater difficulty maintaining consistent margins during periods of raw material volatility. Margin compression is most acute among smaller regional producers lacking diversified sourcing relationships.
global-nitric-acid-market-trends-cost-volatility-analysis-1787311554240

Long-Term Ammonia Supply Contracts

Producers are locking in multi-year ammonia supply contracts at fixed or formula-based pricing, trading some upside flexibility for predictable production costs. This approach has become more common since 2021 as producers sought greater cost predictability across volatile pricing periods. Producers report this approach has meaningfully smoothed quarterly production cost variance since broader adoption began.

Backward Integration Into Ammonia Production

Several larger producers are investing in backward integration into upstream ammonia production capacity, directly reducing exposure to merchant market pricing volatility. This approach requires substantial capital investment but delivers a durable cost advantage once facilities reach full operating scale. Several producers are pursuing this route to achieve durable long-term cost advantages over merchant market alternatives.

Catalyst Recovery and Recycling Programs

Producers are investing in platinum catalyst recovery and recycling programs, reducing overall exposure to precious metal price volatility across the production process. This approach requires dedicated recovery infrastructure but delivers meaningful cost savings over time. This approach has become increasingly common among larger producers with sufficient scale to justify the investment. Growth continues steadily.

Portfolio Architecture for Margin Defence

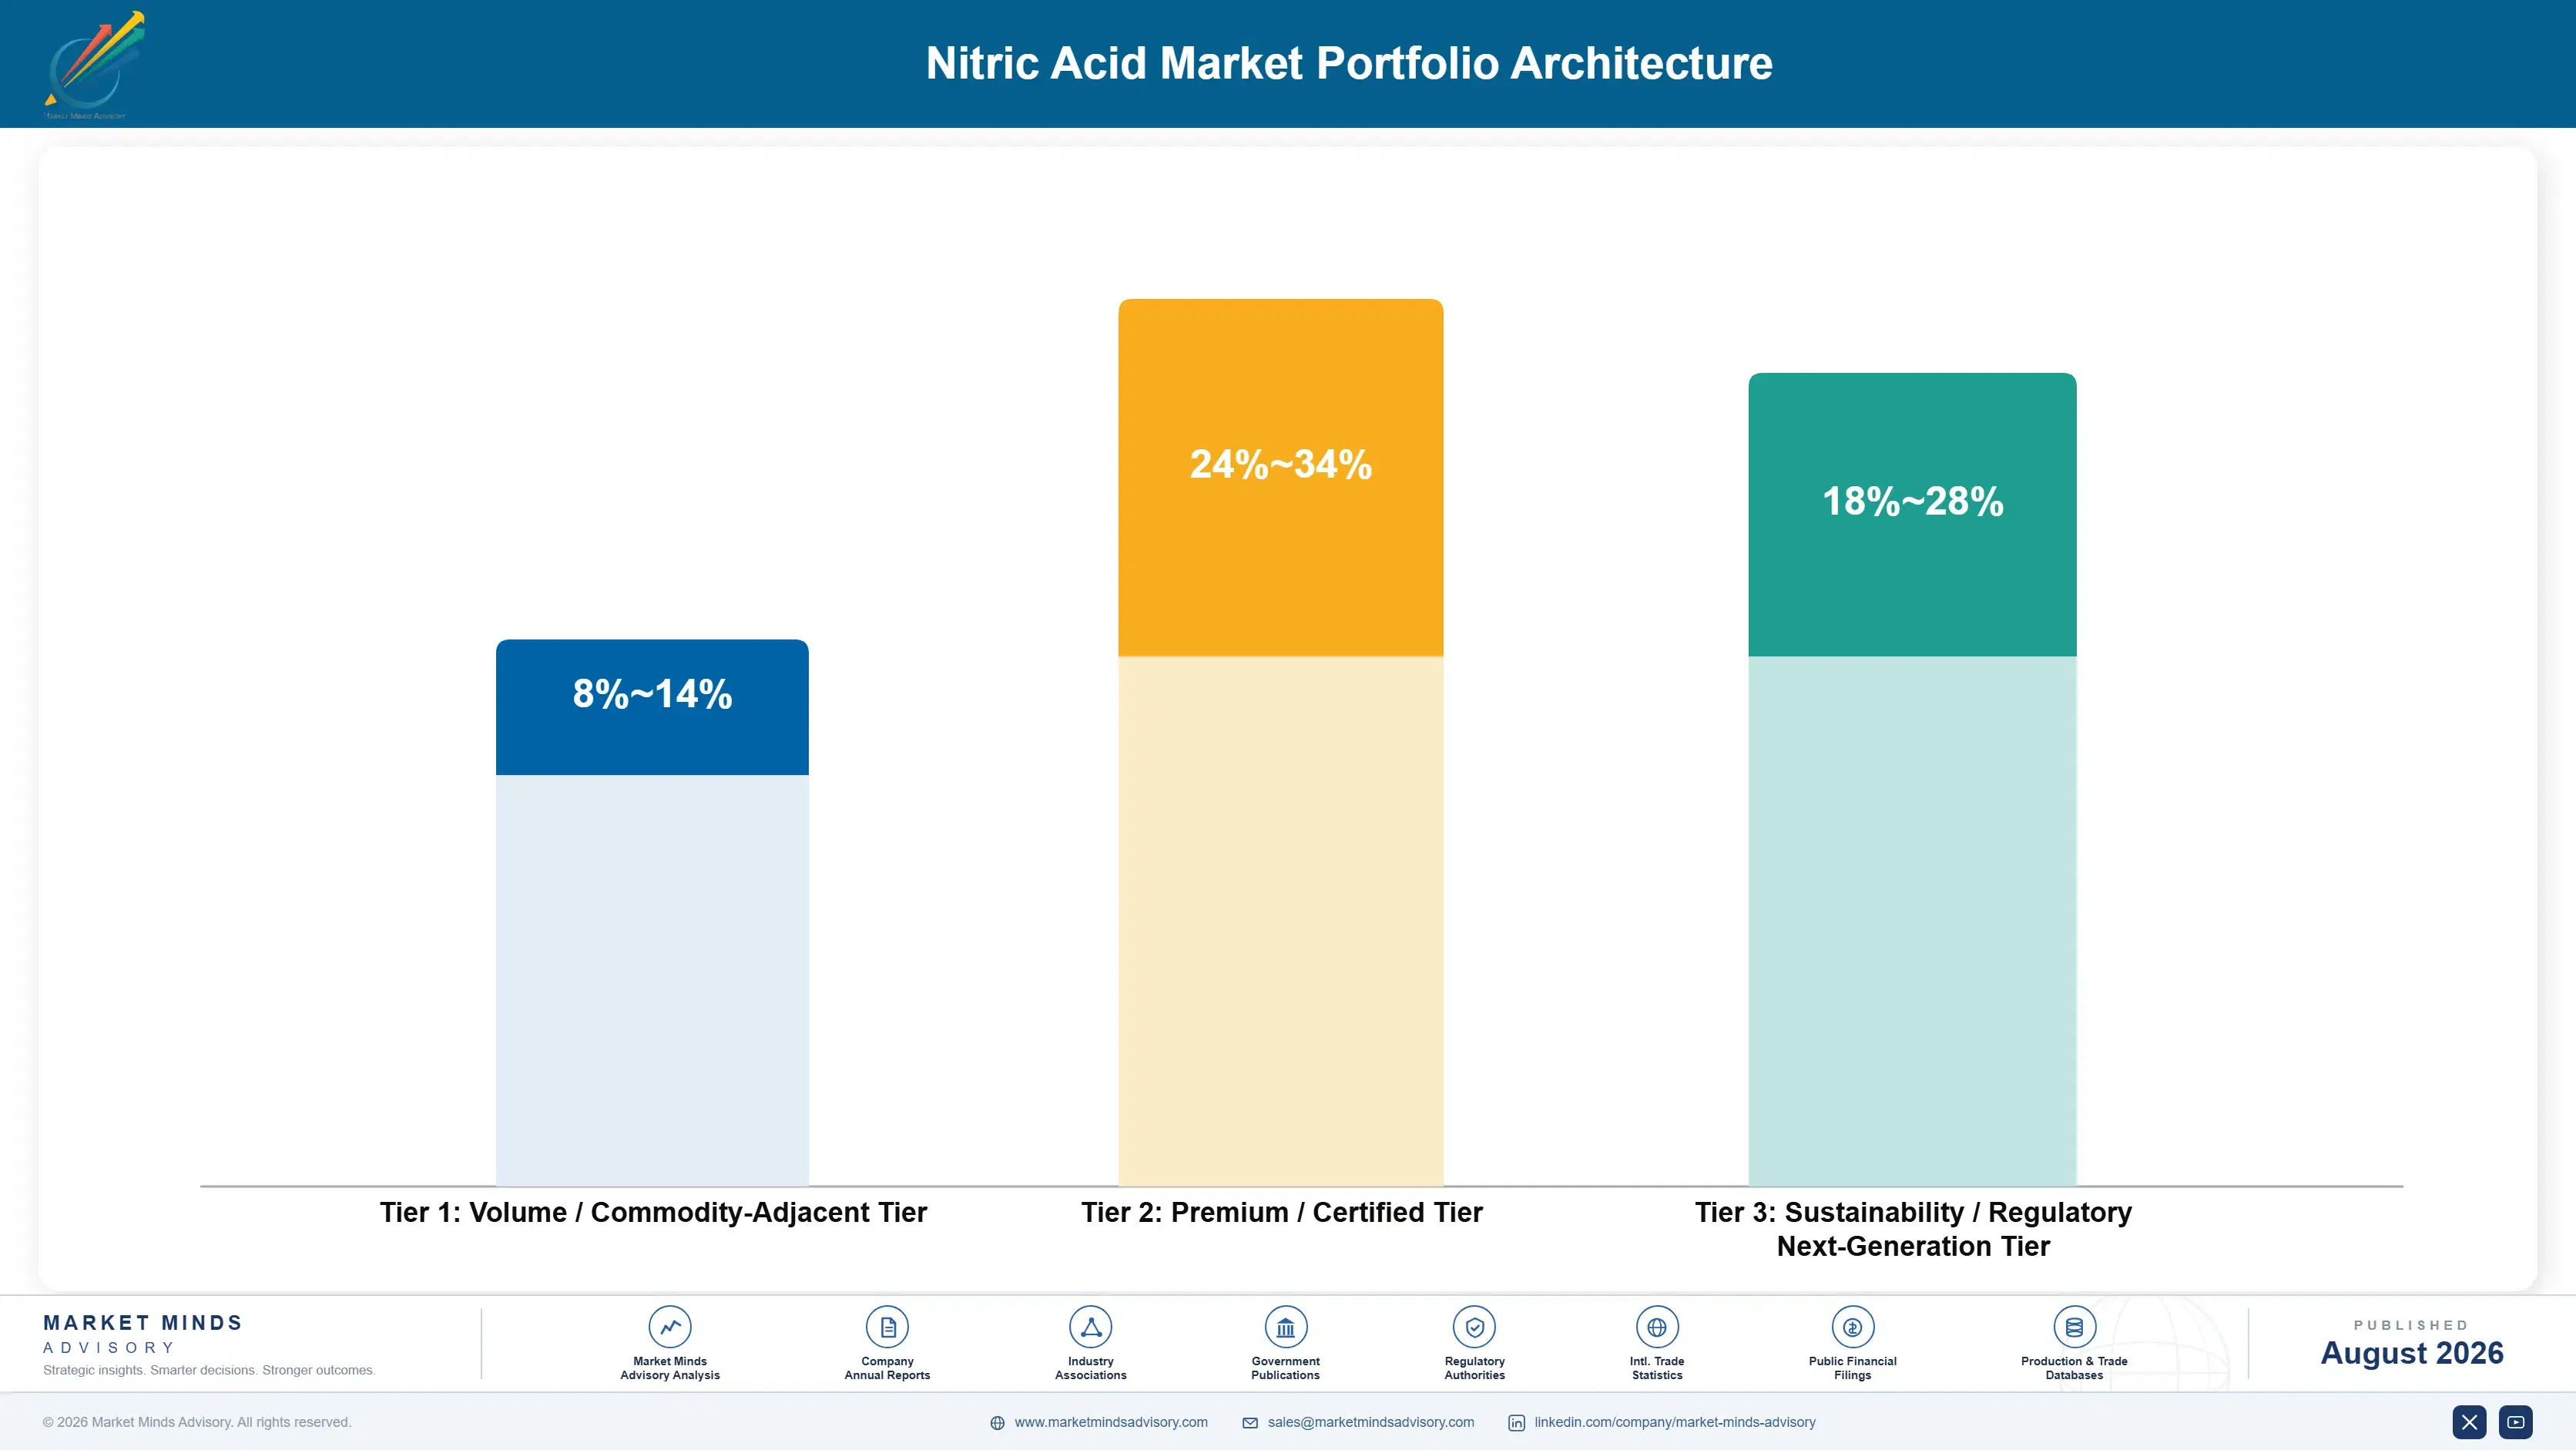
MMA organizes this market into three tiers by purity grade and margin profile. The volume tier covers standard dilute acid sold into conventional fertilizer applications, competing primarily on price. The premium tier covers concentrated and high-purity grades commanding higher margins through process control and certification barriers. The sustainability tier captures next-generation low-emission production processes still scaling toward broader commercial adoption.
Volume tier producers compete on price and delivery consistency with moderate margins, while premium tier suppliers protect pricing power through process control and certification barriers that keep new entrants out for years at a time. This creates real tension inside diversified producers, since capital allocated to sustaining standard capacity competes directly with capital needed to fund high-purity process control and semiconductor testing infrastructure, and most large producers now favor the latter given superior long-term returns.

The highest-value pools concentrate in high-purity acid for semiconductor fabrication and long-term facility supply agreements, where certification barriers and contract security combine to support the strongest pricing power in the entire market. Explosives manufacturer integration is emerging as a further high-value position as mining and construction investment intensifies globally. Diversification into explosives and specialty chemistry increasingly provides a further hedge against fertilizer demand cyclicality.

Volume / Commodity-Adjacent Tier

Standard dilute acid sold into conventional fertilizer applications, competing primarily on price and delivery consistency across established regional relationships. Producers compete mainly through delivery consistency and price position across established regional customer bases.
Gross Margin: 8-14%

Premium / Certified Tier

Concentrated and high-purity grades commanding higher margins through process control, certification, and durable multi-year customer supply relationships. Suppliers protect this pricing power through sustained process control and certification investment few competitors can match.
Gross Margin: 24-34%

Sustainability / Regulatory / Next-Generation Tier

Low-emission production processes and next-generation catalyst technologies positioned ahead of rising environmental compliance requirements among manufacturers. Producers investing early in low-emission processes are positioned to capture durable advantages as compliance requirements tighten.
Gross Margin: 18-28%
global-nitric-acid-market-trends-portfolio-architecture-1787311554738

High-value Sub-segments and Strategic Watch-out

High-Purity Acid for Semiconductor Fabrication

This segment combines the strongest certification barriers in the market with steady growth tied to continued semiconductor investment. Producers with established trace metal documentation hold a durable and difficult-to-replicate advantage. Producers with early certification investment are best positioned to capture this segment's above-average pricing power.
Gross Margin: 26-34%

Long-Term Semiconductor Facility Supply Agreements

Semiconductor capacity investment supports steady demand growth largely independent of broader commodity fertilizer cycles, with established purity validation providing meaningful competitive protection against new entrants. Producers with proven qualification and multi-year facility relationships hold the strongest position in this segment. That advantage endures over time.
Gross Margin: 22-30%

Standard Dilute Acid for Fertilizer Production

The largest volume base by tonnage, this segment covers standard-grade acid sold into conventional fertilizer applications, where competition is driven mostly by price and delivery consistency. Margins stay thin for most participants competing purely on price and logistics position here. Freight cost sets the effective competitive radius for most producers.
Gross Margin: 6-12%

Explosives Manufacturer Integration Expansion

Producers are expanding integrated supply relationships with explosives manufacturers to serve growing mining and construction demand, a trajectory worth monitoring closely by producers still focused primarily on standard fertilizer supply. Producers focused primarily on standard distribution face the greatest pressure to adapt to this emerging shift.
Gross Margin: 14-22%

Qualification Durability Across Application Categories

Once a producer secures qualification within a semiconductor facility's approved supplier list, that relationship typically persists for the full operating life of the fabrication facility, since switching suppliers requires requalification testing that most manufacturers avoid absorbing without strong cause. This creates durable, low-churn revenue characteristics for semiconductor-linked supply, distinct from the more transactional nature of standard fertilizer acid demand.
Adoption depth varies sharply by end use. Semiconductor manufacturers show the deepest stickiness, since switching suppliers requires extensive trace metal requalification that most avoid absorbing without strong cause given yield risk. Explosives manufacturers show similarly strong stickiness tied to specialized handling infrastructure integration requirements. Fertilizer producers show the least stickiness of the three, since these purchases occur more transactionally on standard commodity specifications tied to seasonal pricing.

Buyer profiles are shifting as procurement teams increasingly weigh trace metal documentation and process yield impact, not just price, as explicit criteria following recent periods of semiconductor supply chain disruption. Younger engineering teams increasingly favor suppliers with credible purity validation data over pure commodity sourcing, a consideration that has grown more prominent following recent equipment qualification episodes across the semiconductor industry.
global-nitric-acid-market-trends-end-use-penetration-index-1787311555224

Where MMA Sees the Opportunity

These are among the four positions where our research anticipates prominent divergence between winners and laggards over the coming forecast period. Each is grounded in the demand model, the regulatory perimeter, and the announced capacity pipeline.
01 / HIGH-PURITY CERTIFICATION INVESTMENT

Build High-Purity Certification Ahead of Growth

High-purity nitric acid commands the strongest pricing power in the entire market, and producers that invest in process control and trace metal documentation now position themselves ahead of continued semiconductor capacity expansion through 2036. This capability requires sustained process control investment across multiple years of qualification work. Waiting until semiconductor demand is obviously dominant risks ceding this purity advantage to producers who invested earlier and already hold facility relationships spanning multiple fabrication generations and years of accumulated process control and testing trust.
02 / SEMICONDUCTOR CONTRACT DEVELOPMENT

Secure Long-Term Semiconductor Contracts Early

Semiconductor facilities rarely switch qualified suppliers once operating, and producers that secure supply positions with fabrication facilities currently under development gain revenue visibility spanning years of future facility operation. This positioning requires proven purity consistency and delivery reliability relative to competing suppliers. Producers that achieve it convert commodity volume into the most durable revenue relationships available in this market, and waiting until facilities are already operating risks missing this multi-decade opportunity entirely, ceding it fully and permanently to earlier, better-qualified competitors.
03 / EXPLOSIVES INTEGRATION INVESTMENT

Build Explosives Manufacturer Integration Capability

Explosives manufacturer integration represents a genuine growth opportunity in a market where most producers still compete primarily as standard commodity distributors rather than specialized safety infrastructure partners. Producers that build integrated handling and logistics capability capture mining and construction demand that generalist competitors cannot easily serve. This capability requires substantial specialized equipment investment, but producers achieving proven safety records secure relationships that standard distributors cannot access without comparable investment and years of dedicated, sustained regulatory and safety trust behind them.
04 / AMMONIA BACKWARD INTEGRATION

Integrate Backward Into Ammonia to Cut Feedstock Risk

Ammonia backward integration provides the most direct path to reducing feedstock cost exposure in a business where ammonia represents the largest single cost line across the entire production process. Producers that invest in ammonia synthesis capacity now position themselves ahead of competitors still fully dependent on merchant market purchases. This capability requires substantial capital investment, but producers that achieve full integration convert a persistent cost vulnerability into a durable margin advantage that smaller competitors, lacking comparable capital access, cannot easily replicate.

Engagement Snapshot From the Field

A live engagement with an industry participant carrying material or product regulatory and market exposure ahead of a defining policy shift, showing how our research translates into a defensible multi-year portfolio strategy.
MARKET MINDS ADVISORY · CLIENT ENGAGEMENT SUMMARY
Nitric Acid Producer Strategic Portfolio Review and Transition Roadmap 2026·Investment Scenario on Nitric Acid Exposure Evaluation 2025-26
CLIENT PROFILE
The client is a semiconductor fabrication facility operator generating substantial annual revenue from leading-edge wafer production supplied to multiple downstream chip customers. The company sourced high-purity nitric acid from a single supplier and was evaluating diversification amid growing concerns about single-supplier capacity constraints during periods of tight industry-wide high-purity demand. The company has invested steadily in expanding its fabrication capacity across multiple wafer generations and technology nodes.
STRATEGIC CHALLENGE
The client needed to decide whether to invest approximately $2.8 million (client-reported, unverified by MMA) in qualifying a second high-purity nitric acid supplier, adding trace metal validation and testing cost, or maintain its existing single-supplier relationship despite growing concern about capacity allocation during periods of tight industry-wide demand. Leadership needed a defensible answer before the next fiscal budget cycle began.
MMA APPROACH
MMA's advisory team conducted primary interviews with high-purity nitric acid producers about current and projected capacity allocation, and analyzed historical availability patterns during periods of tight industry demand to assess realistic single-supplier risk. The analysis weighed qualification cost and testing timeline against production-level disruption risk. Findings were validated against comparable facility experiences during recent supply-constrained periods.
KEY FINDINGS
  1. Interview data indicated that high-purity allocation had been constrained by the client's existing supplier during a recent period of surging semiconductor demand, confirming genuine single-supplier capacity risk.
  2. Second-supplier qualification, including trace metal testing and process validation, typically took 14 to 18 months, requiring advance planning relative to the client's production forecasting horizon.
  3. The incremental qualification cost represented a modest share of the client's annual material budget relative to the production disruption risk a single-supplier shortfall could create for wafer fabrication operations.
  4. Comparable fabrication facilities that maintained dual-qualified acid suppliers reported no production disruptions during recent periods of tight industry-wide high-purity capacity, unlike single-supplier peers.
CLIENT PROFILE
The client is a semiconductor fabrication facility operator generating substantial annual revenue from leading-edge wafer production supplied to multiple downstream chip customers. The company sourced high-purity nitric acid from a single supplier and was evaluating diversification amid growing concerns about single-supplier capacity constraints during periods of tight industry-wide high-purity demand. The company has invested steadily in expanding its fabrication capacity across multiple wafer generations and technology nodes.
STRATEGIC CHALLENGE
The client needed to decide whether to invest approximately $2.8 million (client-reported, unverified by MMA) in qualifying a second high-purity nitric acid supplier, adding trace metal validation and testing cost, or maintain its existing single-supplier relationship despite growing concern about capacity allocation during periods of tight industry-wide demand. Leadership needed a defensible answer before the next fiscal budget cycle began.
MMA APPROACH
MMA's advisory team conducted primary interviews with high-purity nitric acid producers about current and projected capacity allocation, and analyzed historical availability patterns during periods of tight industry demand to assess realistic single-supplier risk. The analysis weighed qualification cost and testing timeline against production-level disruption risk. Findings were validated against comparable facility experiences during recent supply-constrained periods.
KEY FINDINGS
  1. Interview data indicated that high-purity allocation had been constrained by the client's existing supplier during a recent period of surging semiconductor demand, confirming genuine single-supplier capacity risk.
  2. Second-supplier qualification, including trace metal testing and process validation, typically took 14 to 18 months, requiring advance planning relative to the client's production forecasting horizon.
  3. The incremental qualification cost represented a modest share of the client's annual material budget relative to the production disruption risk a single-supplier shortfall could create for wafer fabrication operations.
  4. Comparable fabrication facilities that maintained dual-qualified acid suppliers reported no production disruptions during recent periods of tight industry-wide high-purity capacity, unlike single-supplier peers.
RECOMMENDED STRATEGY
Phase 1: Phase 1 (Months 1-5): Initiate trace metal testing and process validation with the second high-purity supplier in parallel with the primary relationship. Phase 2: Phase 2 (Months 6-16): Complete validation testing, finalizing supply agreement terms with the qualified second supplier for a defined volume allocation. Phase 3: Phase 3 (Months 17-18): Integrate the second supplier into standard procurement rotation, maintaining dual-qualified status through ongoing production., monitoring supplier performance closely across both relationships
OUTCOME
The client completed second-supplier qualification within 17 months, within the projected timeline, and avoided a documented capacity shortfall that affected a competing facility's single-sourced production line during the same period. The client reported that dual-sourcing added modest incremental cost while eliminating a supply risk it judged unacceptable for facilities of this scale.

Frequently Asked Questions

Foundational context covering the market sizes, CAGR, scope, country, region and competition that inform every finding below. This section is provided to cover basics and most often pre-purchase conversations, answered from the MMA Primary Research Dataset.

What is the current size of the Nitric Acid Market?

The Nitric Acid Market was valued at $27.8 billion in 2025. MMA projects it will reach $28.97 billion in 2026 as semiconductor and fertilizer demand both continue expanding.

How large will the Nitric Acid Market be by 2036?

MMA forecasts the market will reach $43.71 billion by 2036, up from $28.97 billion in 2026. That represents a 1.51 times expansion over the ten-year forecast window.

What is the CAGR for the Nitric Acid Market 2026 to 2036?

The market is projected to grow at a 4.2% CAGR between 2026 and 2036. MMA's bull and bear scenarios range from 5.2% to 3.2% depending on semiconductor and fertilizer demand growth.

Which segment is growing fastest?

High-Purity Nitric Acid for Semiconductor and Electronics is the fastest-growing segment, expanding at a 5.7% CAGR, roughly 1.36 times the overall market rate as fabrication demand accelerates.

Who are the major companies in the Nitric Acid Market?

Yara International, CF Industries, OCI, Nutrien, and EuroChem lead the market, together holding an estimated 30% of global production capacity. CR5 concentration reflects the genuinely regional, freight-driven nature of this industry.

Which country is growing fastest?

China is the fastest-growing country market, expanding at an estimated 5.4% CAGR as its fertilizer manufacturing base and semiconductor investment both continue rapid expansion. This reflects both fertilizer scale and rapidly expanding semiconductor investment.

Report Segmentation Architecture

The full report scope spans multiple orthogonal segmentation dimensions, with cross-tabulated demand data provided for each dimension pair. Coverage extends further to regional breakdowns, trend trajectories, and the competitive detail needed to support segment-level decision-making.

By Primary Market Dimension

  • Dilute Nitric Acid
  • Concentrated Nitric Acid
  • High-Purity Nitric Acid
  • Metal Processing Grade Acid
  • Explosives Grade Acid

By End-Use Industry

  • Fertilizer Manufacturing
  • Semiconductor and Electronics
  • Explosives and Mining
  • Metal Processing
  • Chemical Synthesis

By Commercial Dimension

  • Fertilizer Manufacturer Direct Supply
  • Semiconductor Facility Direct Supply
  • Distribution and Trading Supply

By Region

  • North America
  • Western Europe
  • East Asia
  • South Asia and Pacific
  • Latin America
  • Middle East and Africa
  • Eastern Europe

Scope, Methodology, and Coverage

Every figure in this report is reproducible from documented input assumptions. The scope below maps the historical period, the forecast horizon, the segmentation dimensions, and the countries covered, alongside the underlying primary and qualitative methodology.
Historical Period
2020 to 2025
Forecast Period
2026 to 2036
Base Year
2025 (USD billions; MMA Primary Research Dataset, August 2026)
Market Definition
This report covers nitric acid across dilute, concentrated, and high-purity grades used in fertilizer manufacturing, explosives production, metal processing, and semiconductor applications. It excludes finished ammonium nitrate fertilizer products, finished explosives, and nitrogen-based specialty chemicals not classified as nitric acid itself.
Quantitative Units
USD billions (current prices); metric tons of production capacity where applicable
Segmentation Dimensions
By Concentration and Purity Grade; By End-Use Industry; By Commercial Dimension; By Region
Regions Covered
North America, Western Europe, East Asia, South Asia and Pacific, Latin America, Middle East and Africa, Eastern Europe
Countries Covered
USA, China, Germany, Poland, France, UK, Japan, South Korea, India, Australia, Canada, Brazil, Mexico, Vietnam, Lithuania, UAE, Saudi Arabia, South Africa, Norway, Netherlands, Italy, Spain, Argentina, Colombia, and additional markets relevant to this sector
Key Companies Profiled
Yara International ASA, CF Industries Holdings Inc., OCI N.V., Nutrien Ltd., EuroChem Group AG, Orica Limited, Incitec Pivot Limited, Borealis AG, LSB Industries Inc., Grupa Azoty S.A., Achema AB, Sichuan Meifeng Chemical Industry Co. Ltd., Shanxi Tianji Coal Chemical Industry Group Co. Ltd., Fertiberia S.A., Gujarat Narmada Valley Fertilizers & Chemicals Ltd., Rashtriya Chemicals and Fertilizers Limited, Deepak Fertilisers and Petrochemicals Corporation Limited, Anhui Hongsifang Chemical Co. Ltd., Toagosei Co. Ltd., Kemira Oyj
Quantitative Methodology
Primary survey, n=3,800 respondents, Q4 2025, six countries; demand-side model with trade association cross-validation
Qualitative Methodology
47 expert interviews, Q4 2025; applied to validate demand model assumptions, identify emerging dynamics, and assess competitive positioning
Report Format
PDF and XLSX data workbook (Word format preview document)
Publisher
Market Minds Advisory
Report Code
MMA-2026-CHM-129
Published
August 2026
Contact
sales@marketmindsadvisory.com | www.marketmindsadvisory.com

Purchase the full Nitric Acid Market Report (2026 to 2036).

The full Nitric Acid Market report delivers ten-year forecasts across all seven regions, six concentration and purity grade segments, and the full competitive landscape of twenty profiled producers. It includes detailed analysis of high-purity certification economics, semiconductor qualification pathways, and demand drivers spanning fertilizer, semiconductor, explosives, and metal processing applications. Buyers receive segment-level margin benchmarking across the volume, premium, and sustainability tiers identified in this summary. The report also includes primary survey data from 3,800 respondents and 47 expert interviews conducted in the fourth quarter of 2025, supporting every demand and pricing assumption in the forecast.
Ten-year regional and segment-level forecast models
Competitive profiles covering twenty nitric acid producers
High-purity certification economics and pricing analysis
Semiconductor qualification pathway and documentation mapping
Portfolio margin benchmarking across three commercial tiers
Primary survey and expert interview data appendix

Built For The People Who Decide

From boardroom strategy to bench-side execution, this report is read cover-to-cover by leaders shaping the next decade of their industry, turning demand scenarios, market dynamics and valuation benchmarks into decisions.
CXOs/ Presidents/ VPs/ Managers
M&A and Corporate Development
Strategy Teams and R&D Heads
Procurement and Product Directors
Regulatory and Compliance Leaders
Investor Relations and Equity Analysts