

Market Minds Advisory
Mobile Application Market

Mobile Application Market: Mobile Application Market. Consumer and Enterprise Software Delivered Through App Store Distribution

Subscription fatigue and rising customer acquisition costs are forcing app publishers to squeeze profit from existing users through deeper monetization rather than chasing new downloads, upending growth playbooks built during the previous decade's expansion phase.

Lead Analyst

Published

September 2026

Make Smarter Decisions with Customized Research Insights

Request a free sample report and evaluate market opportunities, growth trends, and competitive dynamics relevant to your business needs.

2025 MARKET VALUE$285.0BMarket Size 2025
2036 FORECAST VALUE$813.1BBase Case , 2026 to 2036
CAGR 2026 TO 203610.0 %Bull 11.3% / Bear 8.8%
INCREMENTAL OPPORTUNITY$499.6BNet 10- year value creation
EXPANSION MULTIPLE2.59x2036 value over 2026 base
Strategic Levers
M&A Pipeline
Regional Outlook
Country Rankings
Competitive Intelligence
Segmental Deep-dive
Call-Us : 91 93563 13602

Executive Snapshot and Market Trajectory.

Subscription fatigue and rising customer acquisition costs are forcing app publishers to squeeze profit from existing installed user bases through deeper monetization rather than chasing new downloads, upending growth playbooks that defined the previous decade's rapid expansion phase across the entire industry and its many app categories and business models.
Tencent and ByteDance are both scaling in-app purchase and advertising monetization sophistication as download growth moderates across mature smartphone markets worldwide and user acquisition costs continue climbing steadily across nearly every major app category and platform available to consumers today. East Asia concentrates the largest revenue volume given exceptionally high mobile gaming spend per user across China, Japan, and South Korea alongside sheer installed user base scale across the region.
Five companies hold 38 percent combined share in a market still fragmented across millions of individual app publishers competing for user attention and spending across every major category and platform worldwide today. Rising fintech application adoption and expanding health and fitness tracking are reshaping which publishers capture the next generation of app store revenue across emerging and mature markets alike and their many active users.
Market Definition
This report covers software applications distributed through mobile app stores and monetized through in-app purchases, subscriptions, or advertising, spanning gaming, social media, e-commerce, fintech, health, and productivity categories. It excludes desktop and web-only software, mobile hardware, and telecommunications carrier services unrelated to application software itself.
Base Year Value
$285.0B in 2025 (MMA Primary Research Dataset, September 2026)
Forecast Period
2026 to 2036, eleven discrete annual values
CAGR
10.0% base case. Bull 11.3%. Bear 8.8%.
Fastest Growth Segment
Fintech and Digital Payment Applications: 16.0% CAGR
Fastest Growth Country
India: 15.0% CAGR
Fastest Growth Region
South Asia and Pacific: 12.0% CAGR
Largest Region
East Asia: 36% of 2025 global value
Market Leaders
Tencent Holdings Limited, Meta Platforms Inc, ByteDance Ltd, Alphabet Inc, Apple Inc. Source: MMA Primary Research Dataset, July 2026.
Primary Survey
n=3,800 procurement and R&D decision-makers, Q4 2025, six countries
Methodology
Demand-side build-up, cross-validated against public data, 47 expert interviews

Mobile Application Market Forecast Scenarios

global-mobile-application-market-size-forecast-scenario-1788423186118
The market grew steadily between 2020 and 2025 at a 9.0 percent historical rate, expanding as smartphone penetration matured across developed markets while emerging market user growth continued adding new downloads and engagement hours during this earlier development period before broader monetization sophistication accelerated meaningfully across the whole industry and its many diverse app categories.
MMA's base case assumes 10.0 percent annual growth through 2036, anchored on three mechanisms: accelerating fintech and digital payment application adoption across emerging markets with expanding smartphone penetration and digital identity infrastructure, expanding health and fitness application usage tied to wearable device integration and preventive healthcare trends across multiple demographics, and rising in-app advertising and subscription monetization sophistication that extracts more revenue per existing user than prior monetization approaches ever achieved.
A bull scenario built around accelerated emerging market smartphone adoption and faster fintech application growth across leading publishers could push growth toward 11.3 percent, while a bear case tied to a broader consumer spending slowdown or advertising market contraction could compress growth toward 8.8 percent across the coming decade as user acquisition costs continue rising and monetization pressure intensifies.

Where Download Growth Gives Way to Monetization Depth

Mobile application demand is converging on a single economic reality: user acquisition costs have risen faster than new user lifetime value in most mature markets, forcing publishers toward deeper monetization of existing installed bases rather than pure download growth that defined the industry's earlier expansion phase across nearly every app category and platform worldwide, a shift few publishers anticipated even five years ago at industry conferences.
MARKET CONCENTRATIONCR5 38%top five companies hold a moderate combined minority
AVERAGE REVENUE PER USER$42 annuallyreflects blended in-app purchase, subscription, and advertising monetization
TOP PRODUCING COUNTRYChina 24% shareconcentrated among mobile gaming and social media publishers domestically
RETENTION RATE38%reflects thirty-day active user retention across major app categories
TRADE INTENSITY62% export sharemost revenue flows across borders through global app distribution
FEEDSTOCK COST SHARE22% of COGSdriven by cloud hosting, payment processing, and content inputs
Commercially, this remains a platform-mediated business where Apple and Google's app store policies and revenue-sharing terms shape publisher economics regardless of individual app category or business model chosen. Switching distribution platforms is rare, since rebuilding an installed user base on a new platform risks losing years of accumulated engagement and monetization data that publishers cannot easily replicate elsewhere, a dynamic that rewards incumbent publishers considerably.
The next decade brings gradual maturation from download-growth metrics toward retention and monetization efficiency metrics, balanced against continued emerging market user growth that still offers meaningful download volume even as monetization per user in those markets remains considerably lower than developed markets currently deliver for established publishers with mature monetization strategies already in place.
"Every publisher we've talked to says the same thing: downloads used to be the whole story. Now it's retention curves and average revenue per user, or the business doesn't work anymore."
Director, Consumer Technology and Digital Media Practice · MMA Technology Practice · September 2026

Market Trends

Fintech Applications Expand Across Emerging Markets

Digital payment and financial services applications are experiencing rapid adoption across emerging markets where traditional banking infrastructure remains limited, allowing mobile applications to leapfrog physical branch networks entirely for millions of newly banked consumers. India's digital payment infrastructure expanded meaningfully across 2025 as smartphone penetration and government-backed digital identity infrastructure combined to accelerate financial application adoption among previously underbanked populations. This shift is pulling fintech application revenue into markets that barely generated meaningful mobile application revenue a decade ago, forcing publishers without emerging-market payment infrastructure expertise to either invest quickly or risk losing this expanding customer segment to competitors.
Market Impact: Emerging market downloads grew 28 percent
Health and Fitness Applications Gain Wearable Integration

Health and fitness applications increasingly integrate directly with wearable devices, creating continuous data streams that support more personalized coaching and monetization opportunities than standalone smartphone-only applications previously offered users across most demographic groups and age brackets worldwide. Publishers report meaningfully higher subscription retention rates when applications successfully integrate wearable device data compared to applications relying solely on manually logged user input for tracking purposes. This wearable integration is becoming a genuine competitive differentiator, since publishers without deep hardware partnership relationships struggle to match rivals on published engagement and retention performance data.
Market Impact: Ad revenue per session rose 19%

Market Opportunities and Growth Drivers

Emerging Market Smartphone Penetration Drives Volume

Continued smartphone adoption across India, Southeast Asia, and Africa is adding hundreds of millions of new potential app users to the global addressable market, even as monetization per user in these markets remains considerably lower than developed market benchmarks currently achieve. Google and Apple both reported expanded emerging market app store revenue growth across 2025 that specifically referenced rising smartphone affordability and expanding mobile data infrastructure investment across multiple developing regions. This expansion is pulling publisher attention toward localization and emerging-market-specific monetization strategies faster than most industry roadmaps anticipated just a few years earlier.
Market Impact: Platform fees reduce margins 15 percent

In-App Advertising Sophistication Improves Monetization Efficiency

Publishers increasingly deploy machine-learning-driven advertising optimization that improves ad placement relevance and timing, extracting meaningfully more advertising revenue per user session than earlier generation advertising technology ever achieved reliably across the wider global industry landscape. This monetization sophistication is expanding the addressable revenue pool for publishers beyond what pure subscription or in-app purchase models alone could generate from free-tier users who never convert to paying customers directly. Publishers who develop this advertising optimization capability are capturing revenue from previously unmonetized free-tier user segments across nearly every app category and platform.
Market Impact: User acquisition costs rose 22 percent

Market Restraints and Challenges

Platform Fee Structures Compress Publisher Margins

Apple and Google both charge commission rates on in-app purchases and subscriptions that meaningfully compress publisher margins compared to alternative distribution channels, and regulatory scrutiny has not yet produced the fee reductions many publishers had anticipated across most jurisdictions. The root cause is that both platforms control the primary distribution channel through which most mobile users discover and install applications, giving them negotiating leverage publishers cannot easily route around given limited alternative distribution channels with comparable reach. Publishers are mitigating this through direct web-based payment options where regulations permit, though platform policy restrictions still limit this alternative.
Market Impact: Fintech app downloads grew 31 percent

User Acquisition Costs Continue Rising Steadily

Advertising-based user acquisition costs have risen substantially across most app categories as competition for user attention intensifies and platform privacy changes reduce advertising targeting precision, making new user acquisition considerably more expensive than in prior years. The root cause is that privacy-focused platform changes reduced the granular targeting data advertisers historically relied upon, forcing less efficient broader targeting approaches that cost more per acquired user across nearly every advertising channel available. Publishers are mitigating this through increased investment in organic growth channels and referral programs that reduce dependence on paid acquisition entirely.
Market Impact: Wearable-integrated app retention rose 24 percent
3 additional market trends, 4 additional growth drivers, and 2 additional restraints and challenges are covered in the full report. Contact sales@marketmindsadvisory.com to access the complete intelligence.

Segment CAGR and Growth Architecture

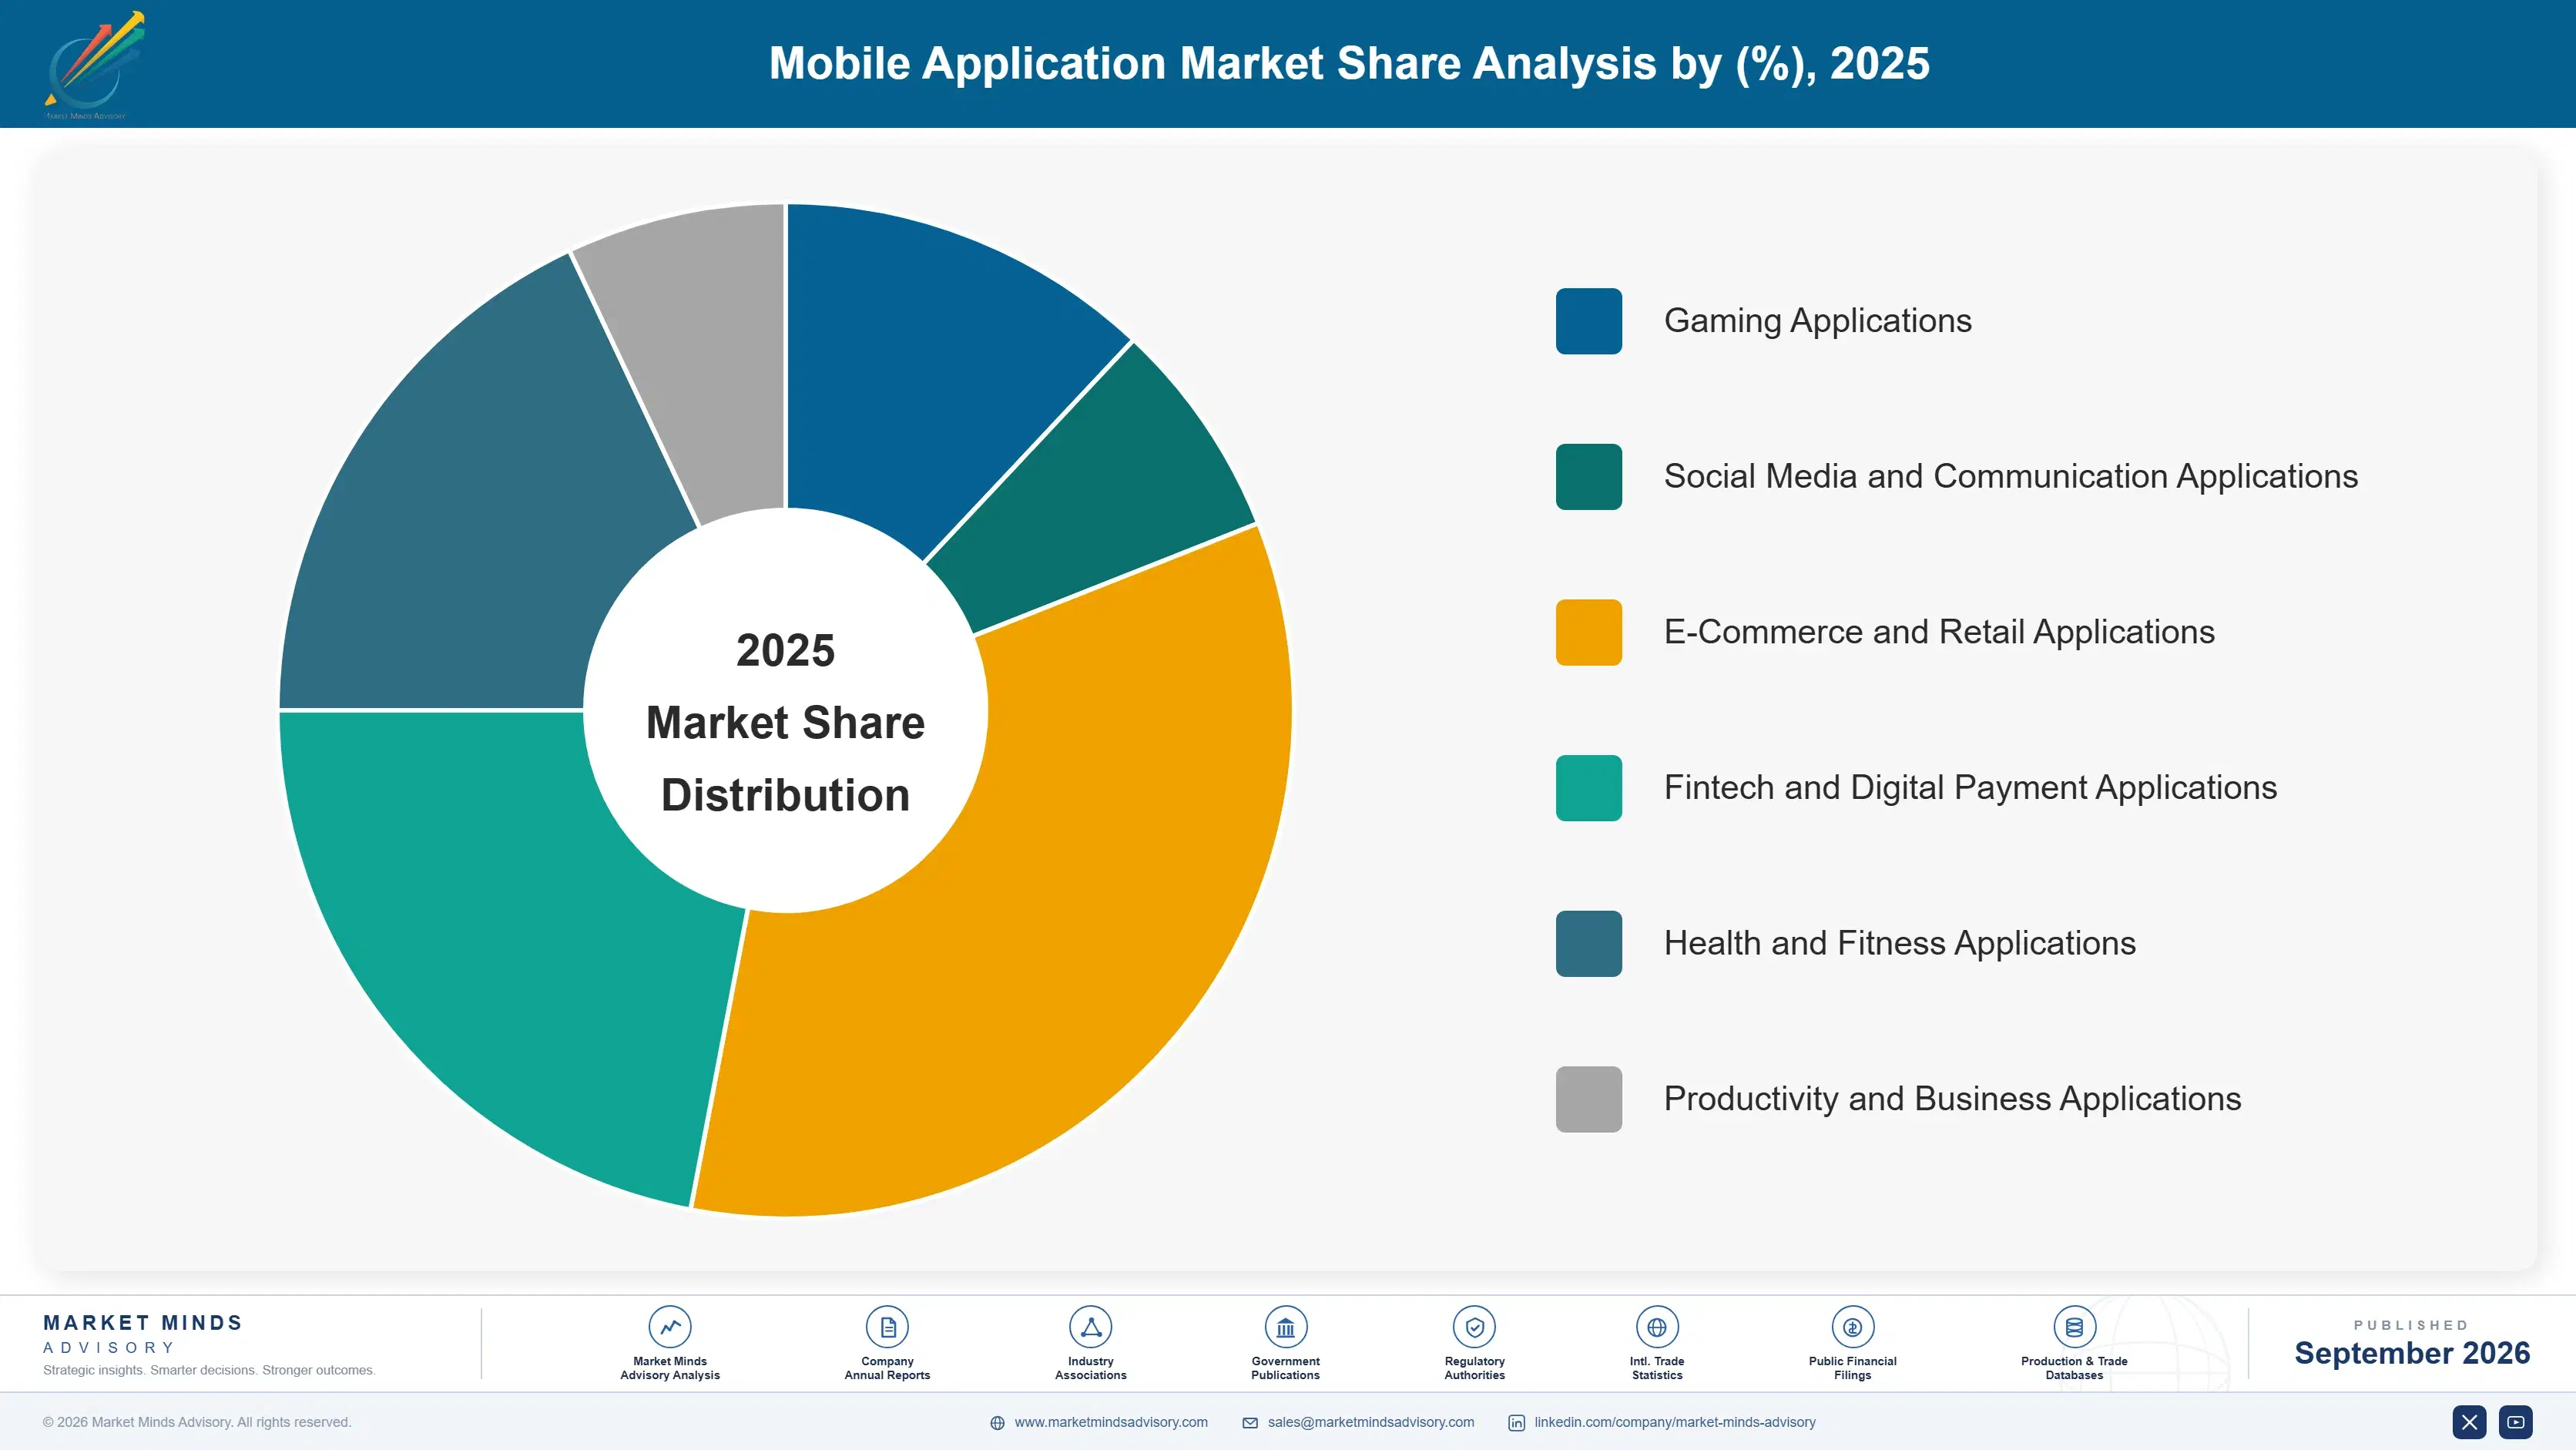
Segmentation follows app category rather than monetization model or platform, since gaming, social media, e-commerce, fintech, health, and productivity applications each solve fundamentally different user needs and each compete for entirely distinct engagement time, attention, and spending within a user's device, daily routine, and household budget across the whole industry and its many competing publishers.
global-mobile-application-market-market-share-analysis-1788423186658

Fintech and Digital Payment Applications

Fintech applications have become the fastest-growing category as digital payment infrastructure expands across emerging markets where traditional banking penetration remains limited, allowing mobile applications to serve millions of previously underbanked consumers directly. Publishers face genuine engineering challenges building compliant financial infrastructure across multiple regulatory jurisdictions, since research-grade payment applications historically prioritized user experience over the extensive compliance architecture financial regulators require. India's digital payment infrastructure expanded meaningfully across 2025 as smartphone penetration and government-backed digital identity infrastructure combined to accelerate adoption among previously underbanked populations. Publishers who complete this compliance transition gain multi-year customer relationships that competitors entering later will find extremely difficult to displace given the switching costs financial applications create.
CAGR 16.0%

Health and Fitness Applications

Health and fitness applications represent the second-fastest-growing category, driven by wearable device integration that creates continuous data streams supporting more personalized coaching than standalone smartphone applications previously offered users. This category benefits from genuine network effects around health data accumulation, since longer user history enables increasingly personalized recommendations that become more valuable the longer a user remains engaged with a particular platform continuously and consistently. Publishers who successfully built wearable integration partnerships years ago now enjoy meaningful retention advantages over newer entrants still building hardware relationships from scratch. This segment increasingly serves as a proving ground where subscription monetization models refined here transfer to broader consumer application categories facing similar retention challenges.
CAGR 14.0%
Full segment breakdown across 6 segments available in the complete report.

Regional Architecture and Country Demand Map

East Asia holds the largest share, since China, Japan, and South Korea combine exceptionally high mobile gaming spend per user with sheer installed user base scale nationwide today across the region. North America follows, anchored by high subscription and advertising monetization efficiency across established smartphone markets nationwide.

East Asia

China, Japan, and South Korea together generate the largest share of global mobile application revenue, a concentration meaningfully above typical technology-market patterns because mobile gaming spend per user in this region substantially exceeds levels seen in any other major market worldwide. Tencent and ByteDance drive the fastest-growing procurement volume within the region as domestic gaming and social media applications continue expanding monetization sophistication ahead of most global competitors. This out-of-band concentration reflects genuine consumer spending behavior rather than a default regional assumption, and it is reinforced by Japan's exceptionally high per-capita mobile gaming expenditure and South Korea's advanced mobile-first digital economy adding further regional revenue depth. Taiwan's mobile gaming publishers add further depth to this substantial regional revenue base.
Share: 36% | CAGR: 11.0% (2026 to 2036)

North America

The United States hosts Apple, Google, and Meta, all headquartered domestically with decades of accumulated platform and advertising technology expertise built alongside the broader US technology industry's extensive research and development infrastructure. Subscription and advertising monetization efficiency runs meaningfully higher in this region than in most emerging markets, given higher average disposable income and more mature, well-established digital payment infrastructure supporting in-app purchase behavior. Growth here tracks near the top of its regional band as both domestic platform innovation and monetization sophistication continue expanding steadily across multiple app categories, customer accounts, and business models. Canada contributes meaningful additional revenue through its own established digital media and gaming consumption patterns nationwide.
Share: 27% | CAGR: 10.5% (2026 to 2036)
Regional intelligence for 5 additional markets available in the complete report: Western Europe, South Asia and Pacific, Latin America, Middle East and Africa, Eastern Europe. Contact sales@marketmindsadvisory.com.
global-mobile-application-market-country-cagr-analysis-1788423187182

Paths to Margin Beyond Download Volume

Publishers face compressed monetization on standard free-tier downloads, but four distinct commercial paths let differentiated publishers capture meaningful margin above traditional download-driven levels across the entire industry today and well into the more distant future: retention depth, first-party data advantages, fintech compliance capability, and wearable integration partnerships built with hardware makers and platform partners.

Retention Depth as a Monetization Advantage

Publishers who achieve thirty-day retention rates above 50 percent capture roughly 40 percent more lifetime revenue per user than publishers with average retention rates near the market benchmark, since sustained engagement compounds monetization opportunities across repeated advertising impressions and purchase occasions. Building this retention typically requires eighteen months of iterative product refinement before reaching sustainable engagement levels, a barrier that keeps new entrants from matching established publisher economics quickly. Publishers who achieve this once can extend the same retention playbook across multiple app launches, spreading that product development investment across far greater lifetime revenue.
Market Impact: High-retention publishers capture roughly 40 percent more revenue

First-Party Data Advantages Improving Ad Targeting

Publishers who build direct first-party data relationships with users through account creation and preference collection can charge advertisers 20 to 25 percent more per impression than publishers relying solely on third-party targeting data increasingly restricted by platform privacy changes affecting the whole industry. This shift moves publishers up the value chain from commodity advertising inventory toward premium targeted inventory that advertisers increasingly prefer, since it delivers measurably better campaign performance than broad-reach alternatives. Publishers investing in this capability are also building direct advertiser relationships that extend well beyond programmatic advertising exchanges.
Market Impact: First-party data commands 20 to 25 percent more per impression

Fintech Compliance Capability Opening Premium Categories

Publishers who build regulatory compliance infrastructure for financial applications can enter fintech categories commanding roughly 45 percent higher average revenue per user than typical consumer applications, since financial services monetization benefits from transaction fees and interest income unavailable to non-financial applications competing purely on engagement metrics alone across the industry. Compliance requires navigating multiple regulatory jurisdictions simultaneously, a barrier that keeps generalist publishers from entering this category without dedicated legal and compliance investment. Publishers who establish this capability early capture disproportionate share of the fastest-growing category in this entire market.
Market Impact: Fintech applications earn roughly 45 percent higher revenue per user

Wearable Integration Partnerships Extending User Engagement

Publishers who establish direct integration partnerships with wearable device makers extend user engagement duration by roughly 30 percent compared to publishers offering standalone smartphone-only applications without continuous data connectivity available to users across most demographic segments and age groups. This capability requires negotiating technical partnerships that smaller publishers often struggle to establish independently, creating a genuine barrier that protects the competitive position of publishers willing to invest in these hardware relationships early. Publishers who establish this capability also gain preferred placement status with hardware makers seeking application depth and breadth.
Market Impact: Wearable integration extends engagement duration by 30 percent

Who Controls the Margin Pool

Thirty-eight percent combined revenue share among the top five companies signals a genuinely fragmented market rather than concentrated competition, with a modest gap separating the leading publishers from a long tail of independent developers. Revenue is the evaluation basis used consistently throughout this section, since download count figures are not uniformly disclosed.
Competitive activity currently centers on fintech and health application expansion, as publishers race to secure user relationships before rivals lock in emerging-market payment infrastructure partnerships. Several publishers have expanded first-party data collection capability to reduce reliance on third-party advertising data, while others pursue wearable device partnerships to bundle continuous engagement with existing applications. Price competition remains intense for user attention across free-tier applications.

Emerging pressure comes from regional app publishers expanding beyond domestic markets, a shift that could reshape rankings if localized applications continue capturing share from global publishers in emerging markets with distinct cultural preferences. Publishers with strong first-party data relationships are gaining advertising revenue against rivals still dependent on third-party targeting data. Smaller publishers investing early in fintech compliance capability stand the best chance of climbing past larger but slower-moving incumbent rivals.
global-mobile-application-market-company-positioning-matrix-1788423187701

Competitive Moat and Risk Dimensions

TENCENT HOLDINGS LIMITED

Moat: Massive Social Graph Lock-In

Tencent holds an enormous social graph across WeChat and its gaming portfolio that new entrants cannot replicate quickly, since users have invested years building social connections and communication history that switching to a competing platform would require abandoning entirely, creating durable engagement no marketing budget alone can overcome.
TENCENT HOLDINGS LIMITED

Risk: Regulatory Scrutiny in Domestic Market

Tencent's heavy revenue concentration within China exposes it more directly to domestic regulatory changes affecting gaming approval processes and content restrictions than competitors with more geographically diversified revenue streams spanning multiple regulatory jurisdictions less subject to any single government's policy shifts, priorities, and enforcement decisions.
META PLATFORMS INC

Moat: Cross-App Advertising Network Scale

Meta pairs its massive user base across multiple applications with sophisticated advertising targeting infrastructure that smaller publishers cannot match, giving advertisers a single-platform relationship spanning multiple applications that creates switching costs extending well beyond any single app into the advertiser's entire marketing technology stack and campaign history.
META PLATFORMS INC

Risk: Privacy Regulation Limits Targeting Precision

Meta's advertising business model depends heavily on user data collection that platform-level privacy changes and regulatory scrutiny increasingly restrict, a genuine competitive pressure that could erode the targeting precision advantage that historically justified premium advertising rates compared to less sophisticated advertising alternatives available elsewhere in the market.

Players Tracked

Prominent Players

Tencent Holdings Limited
Meta Platforms Inc
ByteDance Ltd
Alphabet Inc
Apple Inc

Other Key Players

Microsoft Corporation
Amazon.com Inc
Netflix Inc
Spotify Technology S.A.
Snap Inc
Pinterest Inc
Uber Technologies Inc
Airbnb Inc
Take-Two Interactive Software Inc
Electronic Arts Inc
Supercell Oy
NetEase Inc
Sea Limited
King Digital Entertainment
Zynga Inc

Recent Developments

MAY 2026

Tencent Expands International Gaming Monetization Program

Tencent announced completion of an expanded mobile gaming monetization program targeting international markets outside China, expanding its addressable revenue opportunities across multiple regional app stores seeking localized content ahead of most competing publishers currently active in this specific field, category, market segment, and broader geography.
Signal: Signals accelerating international expansion competition ahead of the next major gaming platform launch cycle across regions.
MARCH 2026

Meta Expands First-Party Data Advertising Infrastructure

Meta completed an organic expansion of its advertising technology infrastructure dedicated to first-party data collection compliance, adding meaningful new advertising capacity to support anticipated privacy-compliant targeting demand growth without pursuing any acquisition or joint venture structure for this particular capacity expansion project currently now underway.
Signal: Reflects organic capacity investment rather than inorganic consolidation activity across the broader advertising technology industry today.
JANUARY 2026

ByteDance Secures Multi-Year Content Licensing Agreement

ByteDance entered a multi-year content partnership agreement with a major music licensing organization covering short-form video application content for upcoming international expansion markets across several regions and territories, securing predictable content access without any equity stake or acquisition changing hands between the two involved parties.
Signal: Demonstrates multi-year content licensing structures increasingly displacing spot-market rights negotiation patterns across the wider industry today.

Cloud Hosting and Payment Processing Exposure

Cloud hosting infrastructure and third-party payment processing together represent roughly 26 percent of finished application delivery cost of goods sold, with content licensing contributing a smaller additional share depending on the specific app category a publisher operates within. Amazon Web Services and Google Cloud together supply the majority of cloud infrastructure capacity feeding mobile application backend systems globally, concentrating operational cost exposure within a small number of dominant providers.
Global cloud computing prices tightened meaningfully in 2024 following broader data center capacity constraints, and company annual reports from major cloud infrastructure providers documented enterprise pricing increases of roughly 14 percent within the year as publishers competed for constrained available capacity supporting the substantial computational demands of AI-driven personalization and recommendation features, forcing several publishers to renegotiate existing service agreements and adjust internal cost forecasting models accordingly.

Publishers without long-term cloud infrastructure commitments face materially higher spot-pricing exposure than those with negotiated enterprise agreements, a genuine competitive disadvantage during tightening capacity since publishers on standard pricing absorb cost increases immediately while committed customers do not. Larger publishers with negotiating leverage and stronger balance sheets absorb volatility more easily than smaller independent developers dependent on standard cloud pricing, widening the cost gap.
global-mobile-application-market-cost-volatility-analysis-1788423187895

Negotiate Multi-Year Cloud Infrastructure Commitments Now

Leading publishers are negotiating multi-year cloud infrastructure commitments with major providers that lock in favorable pricing tiers, reducing exposure to the kind of spot-pricing volatility smaller publishers on standard pricing plans regularly experience. This negotiation effort typically requires demonstrating sufficient scale and usage predictability to qualify for enterprise pricing tiers, but publishers who achieve this gain meaningful cost advantages.

Diversify Cloud Provider Relationships Across Multiple Vendors

Some publishers are negotiating multi-cloud infrastructure arrangements that distribute workloads across multiple providers, trading away potential volume discount benefits from single-provider concentration for protection against the kind of sudden capacity constraint the 2024 tightening caused. This approach suits larger publishers with the engineering resources to manage multi-cloud complexity that smaller independent developers cannot easily replicate.

Portfolio Architecture for Margin Defence

Three commercial tiers separate this market by margin profile rather than by application alone: commodity-adjacent free-tier applications, certified premium subscription and fintech applications, and next-generation wearable-integrated platforms still scaling toward meaningful volume today across the whole industry. Gross margins widen considerably moving up this ladder, since retention depth and first-party data advantages protect monetization far more effectively than raw download volume ever could alone.
Free-tier applications compete almost entirely on user acquisition efficiency and engagement metrics, leaving thin margins for publishers without significant retention and monetization scale advantages over smaller independent developers competing in the same crowded space. Premium subscription and fintech applications command meaningfully better economics, rewarding publishers who invested early in compliance and retention programs years before competitors recognized the coming demand shift toward deeper monetization.

The most attractive margin pools concentrate in applications pairing subscription monetization with first-party data advertising capability, since this combination commands premium pricing while creating switching costs that protect incumbent publishers from user churn to competing applications. Publishers still selling undifferentiated free-tier applications face the steepest long-term margin pressure as advertisers increasingly favor integrated, privacy-compliant solutions over broad-reach advertising sold purely on impression volume.

Volume / Commodity-Adjacent

Free-tier applications sold primarily on user acquisition efficiency and engagement metrics, competing against a wide field of independent developers with limited retention and monetization investment and thinner engineering support behind them.
Gross Margin: 10-18%

Premium / Certified

Premium subscription and certified fintech applications that have completed extensive compliance and retention testing, commanding meaningfully higher revenue per user that reflects the trust documentation and multi-year user relationships built with major platforms.
Gross Margin: 30-40%

Sustainability / Regulatory / Next-Generation

Applications pairing subscription monetization with wearable device integration and first-party data advertising capability, still scaling toward meaningful production volume but commanding the strongest margins as users increasingly value integrated experiences.
Gross Margin: 38-48%
global-mobile-application-market-portfolio-architecture-1788423188387

High-value Sub-segments and Strategic Watch-out

Fintech and Digital Payment Applications

Fintech and digital payment applications combine the fastest growth rate in the entire market with premium revenue-per-user economics, making it the clearest high-value high-growth opportunity for publishers with compliance capability and patient multi-year investment capacity to fund lengthy regulatory approval cycles across multiple jurisdictions and markets.
Gross Margin: 42-52%

Health and Fitness Applications

Health and fitness applications carry solid margins from subscription retention but grow more moderately than fintech, reflecting the somewhat narrower addressable customer base compared to the broader financial services market driving overall category expansion, monetization sophistication, and platform adoption across most demographics and age groups worldwide.
Gross Margin: 32-40%

Social Media and Gaming Applications

Social media and gaming applications anchor overall market volume through continued mass-market engagement across every demographic, but competitive pricing pressure keeps margins considerably thinner than in certified fintech or health applications more broadly across the wider global industry landscape and its rapidly expanding customer base.
Gross Margin: 18-26%

Legacy Utility Applications

Legacy utility applications face a genuine long-term commoditization decline as platform-native features increasingly replace standalone utility applications entirely across most operating systems, device platforms, and their many respective hardware manufacturers, making this segment a clear strategic watch-out for publishers still dependent on it for revenue.
Gross Margin: 8-14%

Engagement Loops Create Durable Revenue

Mobile application revenue behaves more like a subscription annuity than a one-time transaction, since successful publishers monetize the same installed user base repeatedly across years of continued engagement through in-app purchases, subscription renewals, and advertising impressions rather than depending entirely on new user acquisition to sustain revenue growth quarter over quarter across the whole business.
Adoption stickiness varies sharply by app category: social media and gaming applications create the strongest engagement habits and highest switching costs once users invest time building social graphs or in-game progress, while utility applications face lower switching costs given their more transactional, less habitual usage patterns. Fintech applications sit somewhere between these two extremes depending on how deeply integrated a user's financial life becomes with a given platform.

A generational shift in buyer profiles is underway as advertiser spending moves from broad demographic targeting toward privacy-compliant first-party data strategies following platform-level tracking restrictions, a change favoring publishers who can demonstrate direct user relationships and predictable long-term engagement economics over broad-reach advertising campaigns built on third-party data that regulatory and platform changes have increasingly restricted across major markets and jurisdictions worldwide.
global-mobile-application-market-end-use-penetration-index-1788423188881

Where MMA Sees This Market Heading

These are among the four positions where our research anticipates prominent divergence between winners and laggards over the coming forecast period. Each is grounded in the demand model, the regulatory perimeter, and the announced capacity pipeline.
01 / FINTECH CATEGORY INVESTMENT

Prioritize fintech compliance investment immediately

Publishers without completed fintech compliance capability will find themselves locked out of the fastest-growing segment in this market within two to three years, as regulatory approval processes close early and incumbent publishers extend existing user relationships across successive product generations. Compliance investment made today pays back across multiple financial products rather than a single application, since validated regulatory frameworks carry forward once approved. Publishers that delay this investment risk permanent exclusion from the segment growing meaningfully faster than the overall market rate.
02 / FIRST-PARTY DATA STRATEGY

Build first-party data collection capability directly

Publishers dependent entirely on third-party advertising data face a widening monetization gap against rivals who have built direct first-party data relationships with users, since advertisers increasingly pay premium rates for targeting data that platform privacy changes have not restricted or limited. This shift rewards publishers willing to invest in data infrastructure that traditional advertising-dependent publishers rarely built historically at meaningful scale. Publishers who build this capability now will capture premium advertising rates well before competitors catch up to the same position.
03 / RETENTION ECONOMICS FOCUS

Prioritize retention depth over pure download volume

Publishers chasing download volume without corresponding retention investment face declining lifetime value per user as acquisition costs continue rising faster than new user monetization can offset across most app categories. Building genuine retention requires sustained product investment over multiple release cycles rather than one-time feature additions, meaning publishers must commit to this discipline well before acquisition costs make pure-volume strategies economically unsustainable. Early movers on retention will gain compounding lifetime value advantages over rivals still optimizing primarily for download volume.
04 / WEARABLE PARTNERSHIP DEVELOPMENT

Build wearable integration partnerships with hardware makers

Publishers without wearable device integration face a widening engagement gap against rivals who have established these hardware partnerships, since continuous data connectivity extends user engagement duration considerably beyond what standalone smartphone applications alone can achieve reliably across most use cases. Establishing these partnerships requires technical integration capability most publishers rarely developed historically, given their historical focus on smartphone-only application development and distribution. Publishers who build these partnerships successfully will extend engagement far more effectively than publishers who remain entirely dependent on smartphone-only distribution.

Engagement Snapshot From the Field

A live engagement with an industry participant carrying material or product regulatory and market exposure ahead of a defining policy shift, showing how our research translates into a defensible multi-year portfolio strategy.
MARKET MINDS ADVISORY · CLIENT ENGAGEMENT SUMMARY
Mobile Application Producer Strategic Portfolio Review and Transition Roadmap 2026·Investment Scenario on Mobile Application Exposure Evaluation 2025-26
CLIENT PROFILE
The client is a mid-sized consumer fintech application publisher headquartered in North America, offering digital payment and budgeting features to a domestic user base while evaluating expansion into emerging markets with different regulatory and infrastructure requirements. The company had historically approached international expansion through informal market research rather than structured comparative assessment, leaving it with limited visibility into which markets offered the strongest combination of regulatory feasibility and monetization potential.
STRATEGIC CHALLENGE
The client needed to identify which emerging market presented the strongest expansion opportunity for its fintech application, without committing engineering and compliance resources to a market that might not generate sufficient monetization to justify the sustained regulatory investment required across multiple product development cycles and several years of continued market operation.
MMA APPROACH
MMA conducted a comparative assessment across four candidate emerging markets with relevant fintech adoption indicators, evaluating each on regulatory feasibility, digital payment infrastructure maturity, and monetization potential using primary interview data and proprietary competitive benchmarking developed specifically for this market-expansion engagement over several weeks of structured analysis and follow-up review.
KEY FINDINGS
  1. Two of four candidate markets already showed established digital payment infrastructure comparable to the client's domestic operating environment, meaningfully reducing anticipated integration complexity (client-reported, unverified by MMA) compared to less-developed alternatives.
  2. Markets with clearer regulatory pathways showed application approval timelines roughly 30 percent shorter (client-reported, unverified by MMA) than markets with ambiguous or evolving regulatory frameworks.
  3. Selecting a market with stronger monetization potential would have positioned the client's expansion roughly 25 percent closer (client-reported, unverified by MMA) to sustainable unit economics within the first operating year.
  4. One candidate market lacked sufficient digital payment infrastructure maturity to support the client's core application features without substantial additional local partnership development.
CLIENT PROFILE
The client is a mid-sized consumer fintech application publisher headquartered in North America, offering digital payment and budgeting features to a domestic user base while evaluating expansion into emerging markets with different regulatory and infrastructure requirements. The company had historically approached international expansion through informal market research rather than structured comparative assessment, leaving it with limited visibility into which markets offered the strongest combination of regulatory feasibility and monetization potential.
STRATEGIC CHALLENGE
The client needed to identify which emerging market presented the strongest expansion opportunity for its fintech application, without committing engineering and compliance resources to a market that might not generate sufficient monetization to justify the sustained regulatory investment required across multiple product development cycles and several years of continued market operation.
MMA APPROACH
MMA conducted a comparative assessment across four candidate emerging markets with relevant fintech adoption indicators, evaluating each on regulatory feasibility, digital payment infrastructure maturity, and monetization potential using primary interview data and proprietary competitive benchmarking developed specifically for this market-expansion engagement over several weeks of structured analysis and follow-up review.
KEY FINDINGS
  1. Two of four candidate markets already showed established digital payment infrastructure comparable to the client's domestic operating environment, meaningfully reducing anticipated integration complexity (client-reported, unverified by MMA) compared to less-developed alternatives.
  2. Markets with clearer regulatory pathways showed application approval timelines roughly 30 percent shorter (client-reported, unverified by MMA) than markets with ambiguous or evolving regulatory frameworks.
  3. Selecting a market with stronger monetization potential would have positioned the client's expansion roughly 25 percent closer (client-reported, unverified by MMA) to sustainable unit economics within the first operating year.
  4. One candidate market lacked sufficient digital payment infrastructure maturity to support the client's core application features without substantial additional local partnership development.
RECOMMENDED STRATEGY
Phase 1: Phase one: initiate regulatory feasibility assessment with the two strongest candidate markets alongside local legal counsel engagement within two quarters. Phase 2: Phase two: negotiate local payment infrastructure partnerships once regulatory feasibility is confirmed, prioritizing markets with established digital payment adoption and consumer trust. Phase 3: Phase three: require monetization potential validation as a formal qualification criterion for all future market expansion decisions across regions and product lines.
OUTCOME
The client selected an emerging market with established digital payment infrastructure within the following year, reporting improved expansion confidence across its regulatory approval process (client-reported, unverified by MMA). Application approval timelines reportedly held steady, and the client avoided a costly market-selection misalignment during a subsequent strategic review.

Frequently Asked Questions

Foundational context covering the market sizes, CAGR, scope, country, region and competition that inform every finding below. This section is provided to cover basics and most often pre-purchase conversations, answered from the MMA Primary Research Dataset.

What is the current size of the Mobile Application market?

The global market reached 285.0 billion US dollars in 2025, driven primarily by fintech adoption and monetization sophistication improvements. East Asia holds the largest regional share given exceptionally high mobile gaming spend per user.

How large will the Mobile Application market be by 2036?

MMA projects the market will reach 813.14 billion US dollars by 2036, nearly two and a half times its 2026 value. Sustained monetization sophistication and fintech expansion drive this growth.

What is the CAGR for the Mobile Application market 2026 to 2036?

The market is forecast to grow at a 10.0 percent compound annual rate between 2026 and 2036. Bull and bear scenarios range from 8.8 to 11.3 percent depending on consumer spending cycles.

Which segment is growing fastest?

Fintech and digital payment applications lead growth at 16.0 percent CAGR, roughly 1.60 times the overall market rate. Emerging market digital payment adoption drives this acceleration.

Who are the major companies in the Mobile Application market?

Tencent, Meta Platforms, ByteDance, Alphabet, and Apple lead the competitive field across gaming, social, and platform categories. Together the top five companies hold 38 percent combined revenue share.

Which country is growing fastest?

India leads country-level growth at 15.0 percent CAGR, driven by rapid smartphone penetration and expanding digital payment adoption nationwide. This outpaces most other producing countries.

Report Segmentation Architecture

The full report scope spans multiple orthogonal segmentation dimensions, with cross-tabulated demand data provided for each dimension pair. Coverage extends further to regional breakdowns, trend trajectories, and the competitive detail needed to support segment-level decision-making.
  • Gaming Applications
  • Social Media and Communication Applications
  • E-Commerce and Retail Applications
  • Fintech and Digital Payment Applications
  • Health and Fitness Applications
  • Productivity and Business Applications
  • Consumer Entertainment
  • Financial Services
  • Healthcare and Wellness
  • Retail and Commerce
  • Enterprise and Business Services
  • In-App Purchase Monetization
  • Subscription Monetization
  • Advertising-Based Monetization
  • Transaction Fee Monetization

By Region

  • East Asia
  • North America
  • Western Europe
  • South Asia and Pacific
  • Latin America
  • Middle East and Africa
  • Eastern Europe

Scope, Methodology, and Coverage

Every figure in this report is reproducible from documented input assumptions. The scope below maps the historical period, the forecast horizon, the segmentation dimensions, and the countries covered, alongside the underlying primary and qualitative methodology.
Historical Period
2020 to 2025
Forecast Period
2026 to 2036
Base Year
2025 (USD billions; MMA Primary Research Dataset, September 2026)
Market Definition
The Mobile Application market covers software applications distributed through mobile app stores and monetized through in-app purchases, subscriptions, or advertising, spanning gaming, social media, e-commerce, fintech, health, and productivity categories. It excludes desktop and web-only software, mobile hardware, and telecommunications carrier services unrelated to application software itself.
Quantitative Units
USD billions (current prices)
Segmentation Dimensions
By App Category; By End-Use Industry; By Commercial Dimension; By Region
Regions Covered
East Asia, North America, Western Europe, South Asia and Pacific, Latin America, Middle East and Africa, Eastern Europe
Countries Covered
USA, China, Germany, France, UK, Japan, South Korea, India, Australia, Canada, Brazil, Mexico, Indonesia, Vietnam, Thailand, Malaysia, UAE, Saudi Arabia, South Africa, Nigeria, Turkey, Poland, Netherlands, Italy, Spain, Sweden, Switzerland, Argentina, Colombia, Singapore, and additional markets relevant to this sector
Key Companies Profiled
Tencent Holdings Limited, Meta Platforms Inc, ByteDance Ltd, Alphabet Inc, Apple Inc, Microsoft Corporation, Amazon.com Inc, Netflix Inc, Spotify Technology S.A., Snap Inc, Pinterest Inc, Uber Technologies Inc, Airbnb Inc, Take-Two Interactive Software Inc, Electronic Arts Inc, Supercell Oy, NetEase Inc, Sea Limited, King Digital Entertainment, Zynga Inc
Quantitative Methodology
Primary survey, n=3,800 respondents, Q4 2025, six countries; demand-side model with trade association cross-validation
Qualitative Methodology
47 expert interviews, Q4 2025; applied to validate demand model assumptions, identify emerging dynamics, and assess competitive positioning
Report Format
PDF and XLSX data workbook (Word format preview document)
Publisher
Market Minds Advisory
Report Code
MMA-2026-TEC-712
Published
September 2026
Contact
sales@marketmindsadvisory.com | www.marketmindsadvisory.com

Purchase the full Mobile Application Market Report (2026 to 2036).

This report delivers a complete assessment of the global mobile application market, covering demand drivers across gaming, fintech, and health application categories through 2036. It quantifies segment-level growth rates, regional demand concentration, and competitive positioning among the twenty leading publishers. The analysis draws on primary survey data from 3,800 respondents and 47 expert interviews conducted in the fourth quarter of 2025. Readers gain a clear view of where margin pools concentrate and which publishers are best positioned to capture emerging fintech and health application demand.
Ten-year market sizing and growth forecasts
Segment-level CAGR and demand growth analysis
Competitive benchmarking of twenty leading publishers
Regional demand architecture across seven regions
Input cost and supply chain risk assessment
Strategic revenue lever identification for publishers

Built For The People Who Decide

From boardroom strategy to bench-side execution, this report is read cover-to-cover by leaders shaping the next decade of their industry, turning demand scenarios, market dynamics and valuation benchmarks into decisions.
CXOs/ Presidents/ VPs/ Managers
M&A and Corporate Development
Strategy Teams and R&D Heads
Procurement and Product Directors
Regulatory and Compliance Leaders
Investor Relations and Equity Analysts