Market Minds Advisory
Global Lining Market

Global Lining Market: Corrosion Protection, Wear Resistance, and Process Vessel Integrity

Corrosion protection now decides plant uptime as aging chemical and mining infrastructure pushes operators toward fluoropolymer and ceramic linings over cheaper rubber, while feedstock volatility and applicator shortages squeeze margins across every material category.

Lead Analyst

Bilal Shaikh

Published

September 2026

Make Smarter Decisions with Customized Research Insights

Request a free sample report and evaluate market opportunities, growth trends, and competitive dynamics relevant to your business needs.

2025 MARKET VALUE$5.8BMarket Size 2025
2036 FORECAST VALUE$11.5BBase Case , 2026 to 2036
CAGR 2026 TO 20366.4 %Bull 7.6% / Bear 5.2%
INCREMENTAL OPPORTUNITY$5.3BNet 10- year value creation
EXPANSION MULTIPLE1.86x2036 value over 2026 base
Strategic Levers
M&A Pipeline
Regional Outlook
Country Rankings
Competitive Intelligence
Segmental Deep-dive
Call-Us : 91 93563 13602

Executive Snapshot and Market Trajectory

Plant owners are replacing rubber and epoxy linings well ahead of scheduled service life as unplanned shutdowns grow costlier, and fluoropolymer systems are winning specification battles in high-purity chemical and semiconductor-adjacent processing even where rubber still costs measurably less to install per square metre of surface.
Chemical processing capacity additions across East Asia are driving most new lining specification, while fluoropolymer and PTFE systems grow fastest at roughly nine percent annually as high-purity acid and solvent handling spreads from petrochemical plants into battery materials and semiconductor wet-etch processing. China alone accounts for the largest share of new tank and reactor installations, and mining operators across Australia and Chile are lifting ceramic wear-lining volumes as ore grades decline steadily across major basins.
Competitive intensity centers on application expertise rather than raw material supply, since certified applicators for glass-lined and fluoropolymer systems remain significantly scarce relative to rising demand. Tightening emissions and process-safety rules across the European Union and United States are pushing operators toward longer-life, lower-maintenance specifications, and several producers are now qualifying recycled resin content in epoxy and vinyl ester systems to meet corporate procurement sustainability targets industry-wide.
Market Definition
The global lining market covers protective lining materials and systems, rubber, fluoropolymer, epoxy and vinyl ester, glass, ceramic, and ebonite, applied to the interior surfaces of tanks, vessels, pipes, and reactors to resist corrosion, abrasion, and chemical attack. It includes material supply and application services sold as a combined system. Architectural coatings, pipeline external coatings, and high-temperature refractory linings are excluded.
Base Year Value
$5.8B in 2025 (MMA Primary Research Dataset, August 2026)
Forecast Period
2026 to 2036, eleven discrete annual values
CAGR
6.4% base case. Bull 7.6%. Bear 5.2%.
Fastest Growth Segment
Fluoropolymer and PTFE Lining: 9.2% CAGR
Fastest Growth Country
India: 10.8% CAGR
Fastest Growth Region
South Asia and Pacific: 8.4% CAGR
Largest Region
East Asia: 29% of 2025 global value
Market Leaders
Pfaudler Inc., De Dietrich Process Systems, Trelleborg AB, Sulzer Ltd, Saint-Gobain Performance Plastics. Source: MMA Analysis based on company annual reports.
Primary Survey
n=3,800 procurement and R&D decision-makers, Q4 2025, six countries
Methodology
Demand-side build-up, cross-validated against public data, 47 expert interviews

Global Lining Market Forecast Scenarios

global-lining-market-trends-size-forecast-scenario-1787553783483
Lining demand grew at a 5.6% historical rate between 2020 and 2025, held back by pandemic-driven plant shutdowns and delayed turnaround schedules across chemical and mining sites worldwide. Recovery from 2022 came faster than expected as deferred maintenance backlogs forced operators back into service, and fluoropolymer specification accelerated as battery investment expanded acid-handling capacity across East Asia.
Three mechanisms carry the base case to 6.4%. First, chemical processing capacity additions across China, India, and Southeast Asia keep generating new tank and reactor lining specification independent of replacement cycles. Second, mining operators facing declining ore grades are lifting abrasive slurry throughput, which shortens rubber and ceramic wear-lining service life and pulls replacement volume forward. Third, tightening emissions and process-safety regulation across the European Union and United States is pushing operators toward higher-specification fluoropolymer and glass systems despite materially higher installed cost per vessel.
The bull case at 7.6% assumes accelerated fluoropolymer conversion as semiconductor and battery investment broadens across South Asia faster than scheduled, pulling forward specification that would otherwise land after 2030. The bear case at 5.2% assumes prolonged capex caution in Western Europe and a slower mining cycle, both of which would delay new-build orders through the forecast.

Corrosion Economics and the Replacement Cycle

Three forces converge on the lining market at once. Aging chemical and mining infrastructure across mature economies needs relining faster than planned budgets assumed, new capacity across East Asia and South Asia needs first-time specification, and tightening safety regulation is pushing buyers toward materials that cost more upfront but fail less often in service. India's incentive programme and China's battery buildout both pull specification forward faster than expected.
MARKET CONCENTRATIONCR5 38%Fragmented field behind a handful of specialist leaders
AVERAGE APPLICATOR DAY RATEUSD 850 to 1,400Certified crews command a persistent and growing scarcity premium
TOP PRODUCING COUNTRY SHAREChina 24%Domestic chemical and battery capacity anchors national output growth
CAPACITY UTILISATION76%Application shops run near practical ceiling most quarters
FEEDSTOCK SHARE OF COGS42% to 55%Resin and elastomer inputs dominate finished material cost
TYPICAL RELINING INTERVAL5 to 12 yearsService life varies sharply by chemical duty severity
Commercially, the market behaves like a specialty industrial service rather than a commodity material trade. Buyers select on total cost of ownership, downtime risk, and applicator track record more than on unit price, and switching a qualified lining system on a critical vessel is rare once a plant has validated a supplier's chemical resistance data. Long qualification cycles in pharmaceutical and semiconductor service reinforce that stickiness, since switching suppliers can trigger months of revalidation work.
Over the next decade the defining forces are applicator capacity, feedstock security, and the pace at which fluoropolymer and ceramic systems displace rubber in duty cycles where rubber has historically dominated on cost alone. Suppliers solving the applicator bottleneck will set the market's pace.
"Nobody budgets for a lining failure until the vessel is down and the plant is losing a shift a day. That is the entire pricing power of this market in one sentence."
Director, Process Materials and Corrosion Engineering Practice · MMA Chemicals and Materials Practice · August 2026

Market Trends

Fluoropolymer Systems Displace Rubber in High-Purity Duty

Semiconductor wet-etch stations, battery precursor plants, and high-purity acid storage increasingly specify PTFE and PFA lining over rubber, since trace metal contamination tolerances have tightened across chip fabrication nodes below five nanometres. Taiwan, South Korea, and China added a combined wave of new fabrication capacity between 2023 and 2025, each facility requiring dozens of lined tanks and piping runs qualified to sub-part-per-billion contamination limits. Rubber cannot meet these tolerances at all, so the substitution is a fixed requirement of the application rather than a preference shift, and fluoropolymer converters are booking multi-year application backlogs as a direct result.
Market Impact: Adds USD 340 million demand

Mining Operators Extend Ceramic Wear-Lining Into Wet Circuits

Falling ore grades across major copper and iron basins mean processing plants must move more tonnes of slurry to recover the same metal output, and that abrasive throughput destroys rubber linings faster than replacement budgets were designed to absorb. Operators are shifting toward ceramic tile and composite ceramic-rubber hybrid linings in cyclones, pump housings, and pipe elbows, extending service life by a factor of two to three over rubber alone in the highest-wear zones. Weir Group and Kalenborn Kalprotect both expanded ceramic wear-lining production during 2024 and 2025 to meet the order backlog.
Market Impact: Cuts inspection-driven downtime by 30%

Market Opportunities and Growth Drivers

Chemical Capacity Buildout Across China and India Drives Specification

China and India together commissioned a large wave of new chemical processing capacity across 2023 to 2025, spanning specialty chemicals, fertiliser intermediates, and battery precursor materials, and every new reactor, storage tank, and transfer line in acid or solvent service requires a specified lining system from first commissioning. India's Production Linked Incentive programme for chemicals is pulling forward capital spending that would otherwise have landed later in the decade. That first-fit demand carries no replacement-cycle uncertainty, since a new reactor cannot run unlined even for a single small production campaign.
Market Impact: Extends queues 4 to 6 months

Process Safety Regulation Tightens Vessel Integrity Requirements

Regulatory bodies including the United States EPA and the European Commission have tightened process safety and emissions containment requirements following several high-profile industrial incidents traced to lining or vessel wall failure, and inspection intervals for critical service tanks have shortened as a result. Operators facing shorter mandated inspection windows are choosing longer-life fluoropolymer and glass systems over rubber specifically to reduce the frequency of costly shutdown-and-inspect cycles, even though the upfront material and application cost runs well above rubber. Insurers are reinforcing the same shift, with several major industrial insurers now pricing corrosion-related business interruption risk directly into premium calculations.
Market Impact: Raises fluoropolymer resin cost by 15%

Market Restraints and Challenges

Certified Applicator Shortage Caps Installation Throughput

Lining application, particularly glass-lining and fluoropolymer loose-lining work, requires years of hands-on training that most technical schools do not teach, and the workforce holding this skill is aging out faster than replacements are being certified. The root cause sits in the trade itself: application quality cannot be automated, and a defective weld discovered after commissioning can cost far more than the original job. The commercial impact is a persistent capacity ceiling that queues projects for months regardless of feedstock availability. Producers are responding by building in-house certification academies and offering multi-year retention bonuses to slow attrition among senior crews.
Market Impact: Adds 2.1 points to CAGR

Fluorspar Supply Concentration Threatens PTFE Resin Pricing

PTFE and PFA resin production depends on fluorspar, and China controls a majority of global fluorspar mining and processing capacity, giving it effective pricing power over fluoropolymer lining supply. The root cause is geological concentration combined with China's willingness to use export licensing as a policy tool, demonstrated when new export documentation requirements introduced in 2023 disrupted shipments for several months. The commercial impact falls hardest on fluoropolymer converters outside China, facing both higher input cost and delivery uncertainty. Several Western resin producers are now qualifying supply from Mexican and South African fluorspar deposits to reduce single-country dependence.
Market Impact: Extends wear-lining life 2 to 3x
3 additional market trends, 4 additional growth drivers, and 3 additional restraints and challenges are covered in the full report. Contact sales@marketmindsadvisory.com to access the complete intelligence.

Segment CAGR and Growth Architecture

Segmentation follows lining material type, a single technical and commercial logic, since chemical resistance, temperature tolerance, and application method vary by material family rather than by the end-use industry a vessel serves or the equipment it protects. Vessels, tanks, and piping appear across every category below; the framework tracks lining chemistry, not end-use application, keeping segments mutually exclusive by composition.
global-lining-market-trends-market-share-analysis-1787553784015

Fluoropolymer and PTFE Lining

Fluoropolymer and PTFE lining grows fastest at 9.2%, about 1.44 times the overall 6.4% rate, as semiconductor, battery precursor, and high-purity acid handling applications specify PTFE, PFA, and ECTFE systems that rubber and epoxy cannot meet on trace contamination limits. Loose PTFE lining, sheet lining, and rotolined vessels each serve slightly different duty cycles, but all compete for the same scarce certified applicator base. Demand concentrates in East Asia, where semiconductor and battery precursor capacity additions have been heaviest, while European and American fine chemical producers convert legacy rubber-lined vessels ahead of schedule. Chemours, Daikin, and Saint-Gobain Performance Plastics supply the bulk of qualified resin and sheet, and installation backlogs now run past twelve months at several major converters.
CAGR 9.2%

Ceramic and Wear-Resistant Lining

Ceramic and wear-resistant lining grows at 8.1%, the second-fastest material category, as mining operators facing declining ore grades push more abrasive slurry through cyclones, pumps, and pipe elbows than rubber alone can withstand. Alumina tile, silicon carbide, and composite ceramic-rubber hybrids extend service life by two to three times over rubber in the highest-wear zones, which justifies the higher installed cost once downtime cost is included. Chile, Peru, Australia, and increasingly Indonesia drive the bulk of new specification as copper and nickel processing capacity expands. Weir Group and Kalenborn Kalprotect lead qualified supply, and both companies expanded ceramic production capacity during 2024 and 2025 to work through order backlogs that stretch past a year in some regions.
CAGR 8.1%
Full segment breakdown across 6 segments available in the complete report.

Regional Architecture and Country Demand Map

East Asia leads on chemical and battery-linked capacity additions, North America and Western Europe follow on turnaround and relining spend across aging infrastructure, and South Asia and Pacific posts the fastest growth as India's chemical buildout accelerates from a smaller base, while Latin America adds steady mining volume.

North America

Gulf Coast petrochemical turnaround spending anchors North American demand, where operators in Texas and Louisiana schedule planned relining work around multi-week shutdown windows to minimise lost production days. Canadian mining operators, particularly in Ontario and British Columbia copper and nickel districts, add steady ceramic wear-lining volume as processing plants push through lower-grade ore. The region's 24% share and 6.0% growth rate reflect a mature but well-funded replacement cycle rather than first-fit demand, since most major vessels were lined decades ago and now cycle through scheduled relining. United States EPA process safety rules are pulling specification toward fluoropolymer and glass even on relining jobs where rubber was once the default, trading higher upfront cost for lower unplanned downtime risk.
Share: 24% | CAGR: 6.0% (2026 to 2036)

Western Europe

Regulatory pressure, not new capacity, defines demand across Western Europe, where REACH-driven emissions containment rules and an aging chemical plant base built largely before 1990 push operators toward longer-life lining systems even as overall chemical output growth stays flat. Germany and France hold the largest installed base of glass-lined reactors in pharmaceutical and fine chemical production, sustaining steady De Dietrich and Pfaudler relining volume. The region's 20% share sits below East Asia's despite a comparable installed base, because Western European chemical capacity has grown slowly relative to Asian expansion for a decade. Growth of 4.9%, the slowest of the seven regions, reflects capital discipline across an industry facing persistent energy cost disadvantage relative to American and Middle Eastern competitors.
Share: 20% | CAGR: 4.9% (2026 to 2036)
Regional intelligence for 5 additional markets available in the complete report: East Asia, South Asia and Pacific, Latin America, Middle East and Africa, Eastern Europe. Contact sales@marketmindsadvisory.com.
global-lining-market-trends-country-cagr-analysis-1787553784532

Where Lining Suppliers Can Defend Margin

Four moves separate lining suppliers earning premium margin from those competing purely on installed cost per square metre, each targeting a point where buyers pay for certainty rather than material alone. The strongest movers combine data, certified labour, and feedstock security into offerings that a pure material seller cannot match, turning a commodity transaction into a defensible long-term service relationship.

Bundle Predictive Inspection Data With Relining Contracts

Suppliers that install ultrasonic thickness sensors and offer condition-based relining schedules convert a one-time material sale into a recurring service relationship, and plant operators pay a premium for the reduced risk of an unplanned failure between scheduled turnarounds. Early adopters report contract renewal rates well above suppliers selling lining material alone, since switching away from an incumbent with years of condition data is costly for the buyer. Pfaudler and Sulzer have both built digital monitoring offerings around this model since 2023, bundling sensor hardware with multi-year service agreements rather than selling relining as a discrete transaction each cycle.
Market Impact: Lifts service contract margin by 8 to 12 points

Certify Applicator Crews Directly to Control Quality

Material suppliers that run their own certification academies for applicator crews, rather than relying on third-party contractors of variable quality, can charge a premium for guaranteed workmanship and reduce the callback and warranty claims that erode margin on complex jobs. This also addresses the industry's most binding constraint, since certified crew capacity, not material supply, currently caps how much revenue a supplier can book in any given quarter. Trelleborg and Weir Group have both expanded in-house training programmes since 2024, and early results show warranty claim rates roughly 40% below crews certified through independent third parties.
Market Impact: Cuts warranty claim rates by roughly 40% overall

Localise Fluoropolymer Resin Qualification Outside China

Suppliers that qualify fluoropolymer resin from Mexican or South African fluorspar sources, rather than depending entirely on Chinese material, can offer buyers supply security that commands a premium during periods of export licensing disruption, as seen in 2023. Building this qualification takes years of testing against chemical resistance and purity specifications, which creates a durable advantage once complete rather than one competitors can copy quickly. Chemours and Daikin have both disclosed diversification efforts in recent annual reports, targeting a meaningfully lower share of Chinese-origin fluorspar in their resin supply chains by the end of the decade.
Market Impact: Commands a 5 to 9% supply security premium

Offer Combined Ceramic-Rubber Hybrid Systems for Wear Zones

Suppliers that engineer hybrid linings, combining ceramic tile in the highest-wear zones with rubber elsewhere on the same vessel, capture more of the total lining budget per project than suppliers offering a single material family, since mining customers increasingly specify hybrid solutions rather than sourcing ceramic and rubber separately from different vendors. This also deepens the customer relationship, since a hybrid design requires close collaboration on wear modelling that a single-material competitor cannot replicate easily. Kalenborn Kalprotect and Weir Group have both expanded hybrid product lines since 2024, reporting order values roughly 20% higher than comparable single-material contracts.
Market Impact: Raises average contract value by about 20% per project

Who Controls the Margin Pool

Concentration sits at a moderate CR5 of 38%, with the gap between Pfaudler, the largest single player, and mid-tier challengers measured in specialised capability rather than sheer scale. All participants here are assessed on one basis, annual lining materials and application services revenue, meaning material supply, engineered systems, and field application booked together.
Competitive activity runs along three lines. Application capacity constrains growth more than manufacturing capacity does, since certified crews remain the binding resource across the industry. Feedstock security is becoming a genuine differentiator as fluorspar and specialty resin supply concentrates in China. And digital condition monitoring is shifting several suppliers from one-time material sales toward recurring service contracts that lock in customer relationships for years at a time.

Pressure is building from mid-sized regional applicators who lack manufacturing scale but compete aggressively on service responsiveness and local relationships, particularly in mining regions where a fast callout matters more than brand recognition. Rankings will shift toward suppliers who combine qualified feedstock security with in-house applicator certification, since both are becoming harder to build from a standing start as the skilled labour shortage deepens across the industry.
global-lining-market-trends-company-positioning-matrix-1787553785058

Competitive Moat and Risk Dimensions

PFAUDLER INC.

Moat: Integrated glass-lining service network

Pfaudler manufactures glass-lined reactors and vessels and maintains a global field service network for relining and repair, giving it a combined equipment and service relationship few competitors replicate. Decades of installed base across pharmaceutical and fine chemical customers create high switching cost, since replacement vessels must match exact process validation records already on file with regulators.
PFAUDLER INC.

Risk: Concentrated pharmaceutical customer exposure

A large share of Pfaudler's glass-lining revenue ties to pharmaceutical and fine chemical capital spending, which runs in multi-year cycles tied to drug approval pipelines and patent expiry timing. A slowdown in pharmaceutical capital investment, or faster-than-expected adoption of continuous flow chemistry that uses smaller vessels, would compress the addressable base this segment depends on directly.
DE DIETRICH PROCESS SYSTEMS

Moat: European glass-lined reactor heritage

De Dietrich holds one of the deepest engineering archives in glass-lined reactor design, built over more than two centuries of continuous operation, and European pharmaceutical and specialty chemical producers frequently specify De Dietrich equipment by name in capital project documentation. That brand specificity gives it pricing power competitors without the same heritage cannot match easily.
DE DIETRICH PROCESS SYSTEMS

Risk: High fixed European manufacturing cost

De Dietrich's manufacturing base sits predominantly in France and Germany, carrying energy and labour costs well above Asian competitors now qualifying similar glass-lining capability. As Chinese and Indian glass-lined equipment manufacturers close the quality gap, De Dietrich's cost structure becomes a growing competitive disadvantage on price-sensitive projects outside its traditional European customer base.

Players Tracked

Prominent Players

Pfaudler Inc.
De Dietrich Process Systems
Trelleborg AB
Sulzer Ltd
Saint-Gobain Performance Plastics

Other Key Players

Chemours Company
Daikin Industries Ltd
Weir Group PLC
CoorsTek Inc.
Belzona Polymerics Ltd
ERIKS NV
Winn & Coales International
PPG Industries Inc.
Carboline Company
RPM International Inc.
Kalenborn Kalprotect GmbH
ContiTech (Continental AG)
Magotteaux International
3M Company
Corrosion Engineering International

Recent Developments

MARCH 2025

Pfaudler Opens New Glass-Lining Application Facility in India

Pfaudler commissioned a new glass-lining application and reactor finishing facility in Gujarat, expanding capacity to serve India's growing pharmaceutical and specialty chemical manufacturing base. The facility adds dedicated capacity for vessel relining alongside new equipment fabrication, reducing lead times for Indian customers who waited on capacity from Pfaudler's European plants.
Signal: Capacity is following India's chemical buildout in real time rather than waiting for it to mature into steady, predictable demand.
SEPTEMBER 2025

Trelleborg Acquires Chilean Rubber Lining Applicator

Trelleborg acquired a regional rubber and ceramic wear-lining applicator based in Antofagasta, Chile, strengthening its field service coverage across the country's major copper mining districts. The acquisition brings established customer relationships and certified crews rather than new manufacturing capacity, reflecting where the binding constraint in this market actually sits.
Signal: Buying certified applicator relationships instead of factory capacity shows precisely where real scarcity in this market actually binds hardest.
JANUARY 2026

Sulzer Signs Multi-Year PTFE Resin Supply Agreement

Sulzer signed a multi-year supply agreement with a fluoropolymer resin producer to secure PTFE feedstock volumes outside China, following the 2023 export licensing disruption that affected several converters. The agreement was a commercial supply contract, not an equity investment or joint venture, and includes volume commitments through 2029.
Signal: Locking in multi-year resin volume outside China signals that fluorspar supply concentration is now treated as a board-level risk.

Resin, Elastomer, and Energy Exposure

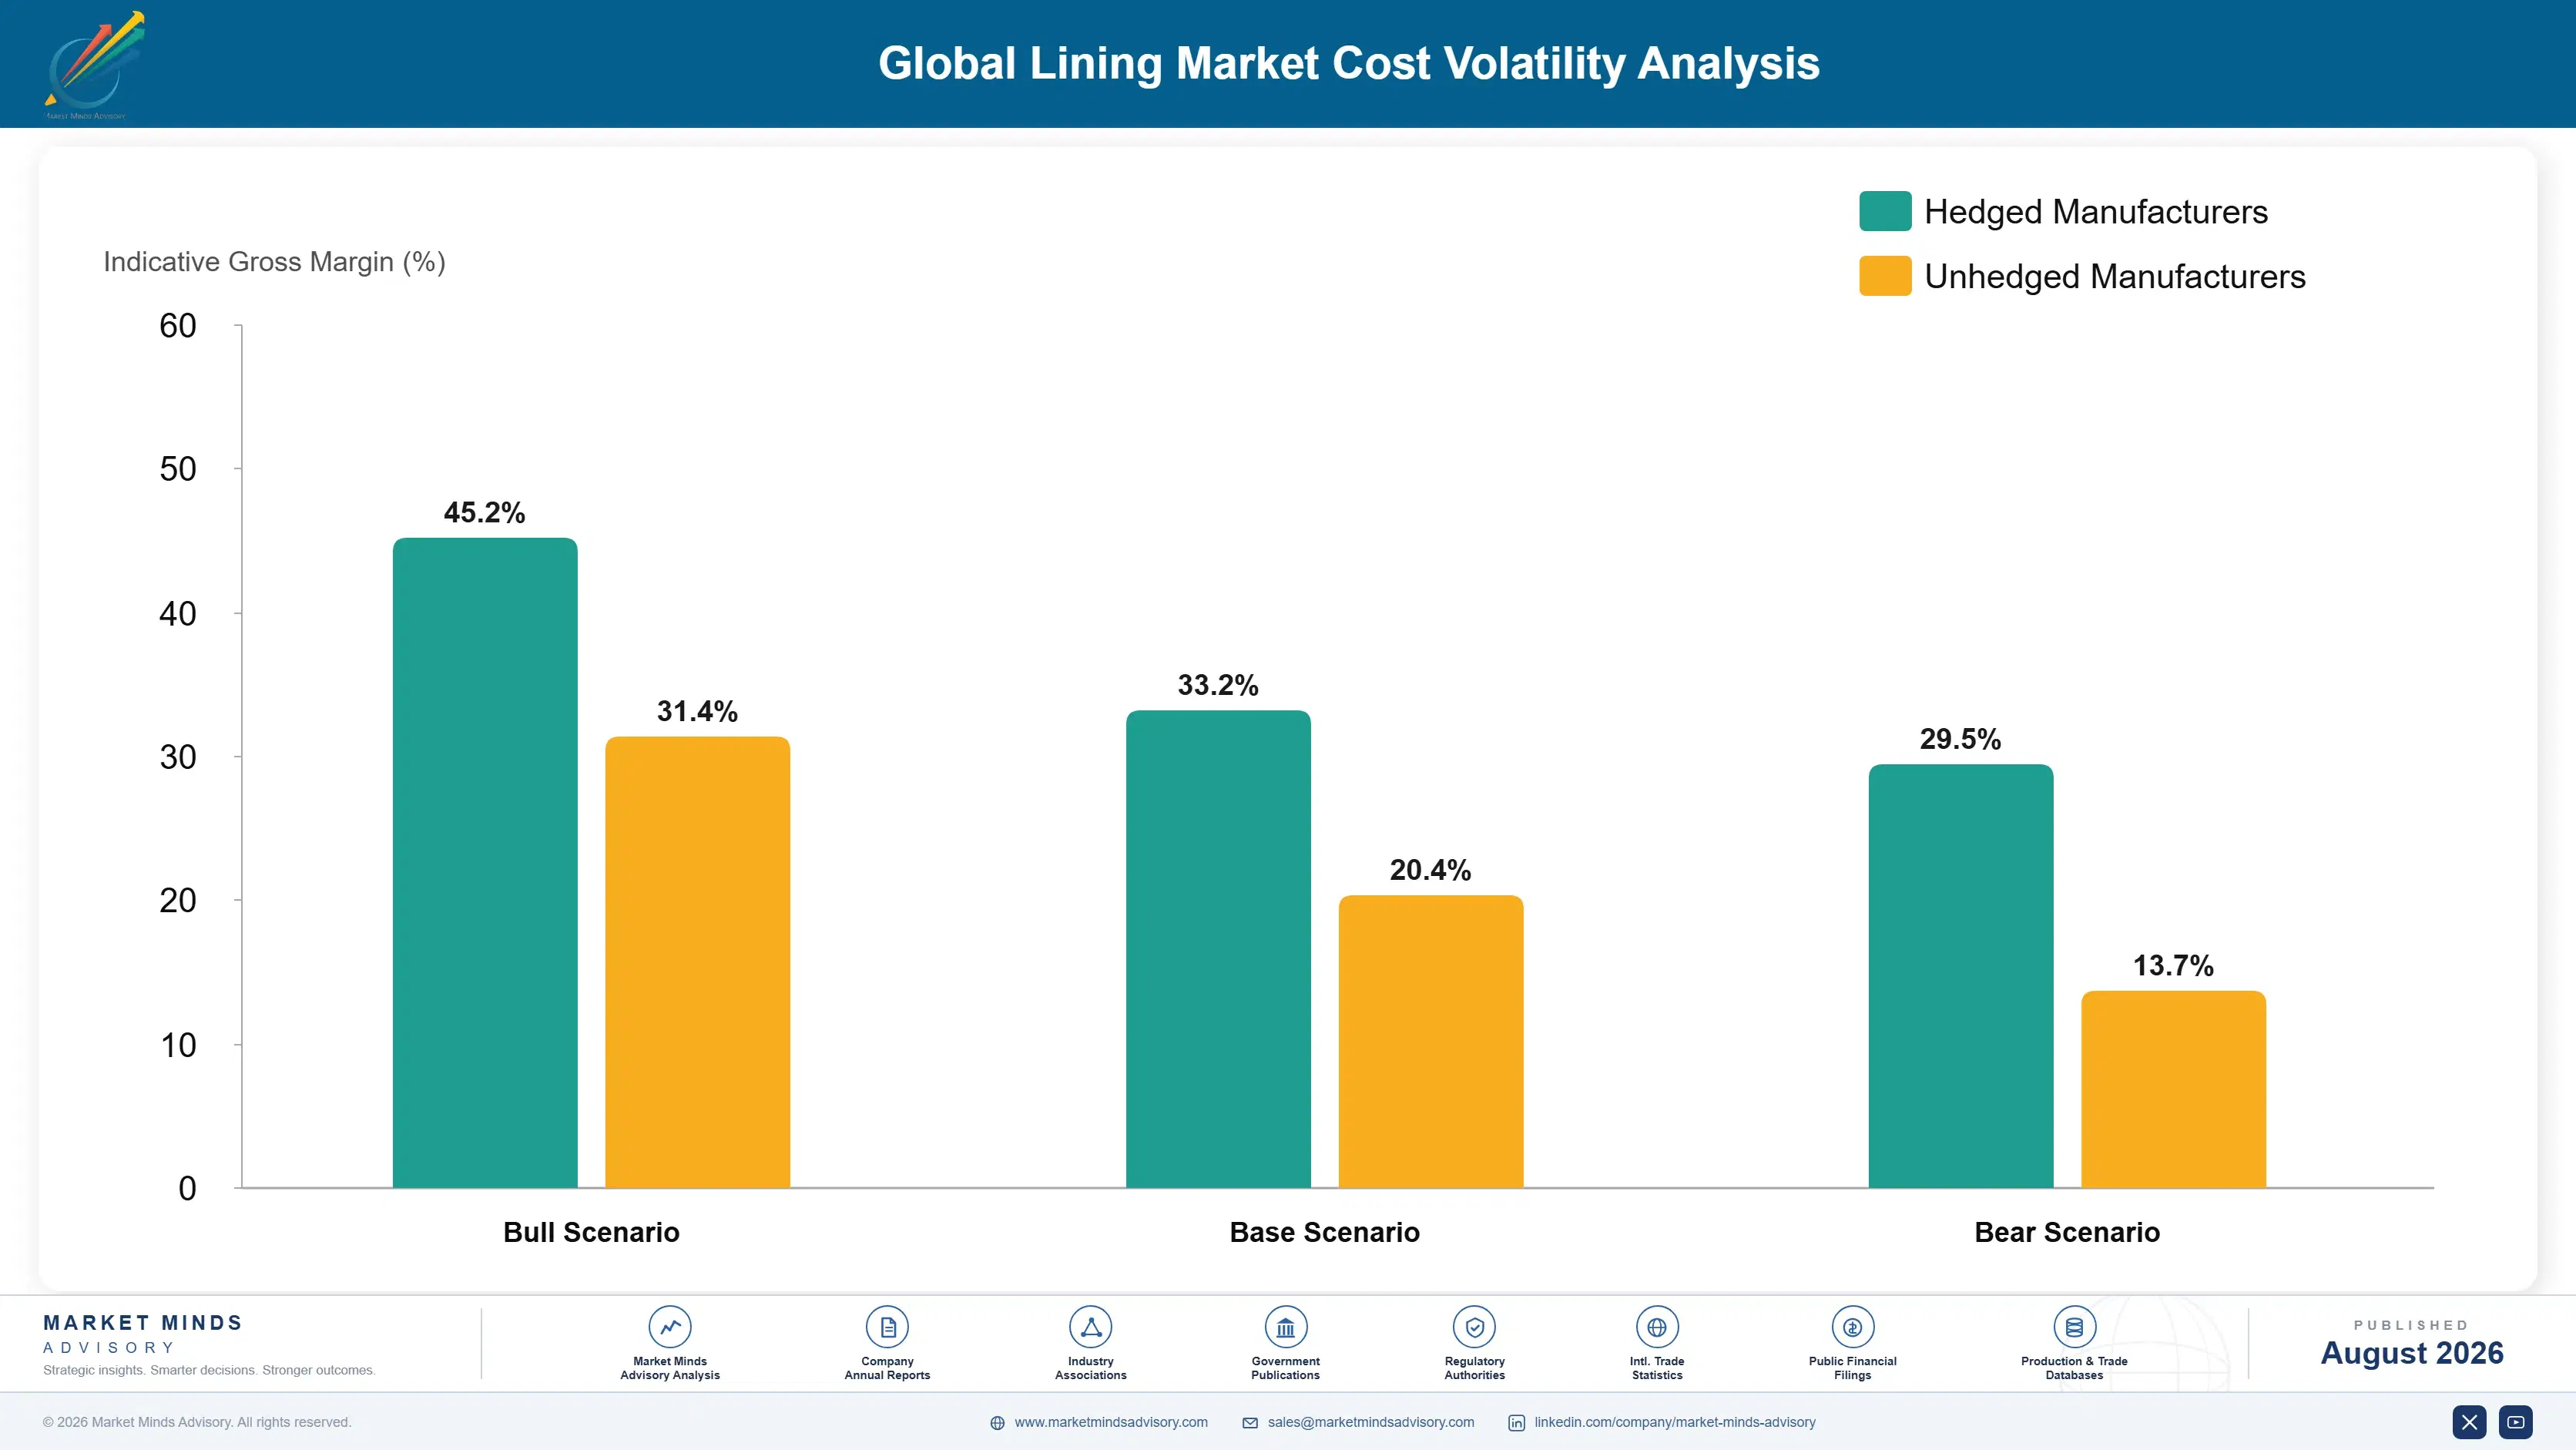
Fluoropolymer resin runs 30% to 38% of finished cost for PTFE and PFA lining products, tied directly to fluorspar mining and processing concentrated in China. Synthetic rubber and elastomer compounds account for 20% to 28% of cost in rubber lining, while firing and curing energy adds 12% to 18% across ceramic and glass-lined product lines depending on kiln fuel source.
The clearest recent volatility event came in 2023, when China introduced new export documentation requirements on fluorspar shipments that disrupted PTFE resin availability for several months. Chemours Company's 2023 Annual Report disclosed higher fluoropolymer input costs following the disruption, and several converters reported delivery delays stretching past eight weeks during the peak of the disruption before alternate sourcing routes were qualified. Smaller fabricators felt the disruption hardest, since spot-market resin prices climbed sharply during the same period.

Exposure varies sharply by player type. Vertically integrated fluoropolymer converters with direct fluorspar sourcing agreements absorbed the 2023 disruption with far less margin damage than smaller lining fabricators who buy resin on the spot market. Geography compounds the gap further, since European and American converters without domestic fluorspar face a persistently higher landed cost than Chinese competitors regardless of any single disruption event.
global-lining-market-trends-cost-volatility-analysis-1787553785257

Qualify Fluorspar Supply From Mexico and South Africa

Converters that complete multi-year qualification testing against Mexican and South African fluorspar reduce single-country dependence and gain negotiating leverage during Chinese export licensing disruptions. Qualification is slow, often two to three years, but once complete it becomes a durable advantage that spot-market competitors cannot replicate quickly during the next supply shock. Chemours and Daikin have both begun this process already.

Lock Multi-Year Resin Supply Agreements Ahead of Disruption

Fixed-volume, multi-year supply agreements with resin producers, similar to Sulzer's 2026 agreement, protect converters from spot-price spikes during export disruptions at the cost of some pricing flexibility during periods of oversupply. Buyers with committed volume also receive priority allocation when total available resin tightens industry-wide. That trade-off favours converters serving contamination-sensitive customers who cannot tolerate an unplanned shortage.

Shift Kiln Energy Sourcing Toward Long-Term Contracts

Ceramic and glass-lining producers running energy-intensive firing kilns are increasingly signing multi-year industrial power and natural gas contracts rather than buying on spot markets, smoothing the cost swings that hit margin hardest during regional energy price spikes tied to broader commodity cycles. Firing schedules can also shift toward off-peak power windows, trimming energy cost without new capital investment.

Portfolio Architecture for Margin Defence

The portfolio splits into three tiers with real margin separation. Volume rubber lining for mining and general chemical service competes on installed cost per square metre and earns modest but steady margin. Premium fluoropolymer and glass systems earn considerably more, since buyers pay for contamination control and service life rather than material alone. Ceramic wear-lining and sustainability-linked recycled-content systems sit in a growing third tier where certification and traceability, not material cost, set the price.
The tension between volume and premium work is real. Rubber lining generates the steadiest cash flow and funds applicator training pipelines that premium fluoropolymer work later depends on, yet rubber alone offers limited margin upside as competition intensifies among regional applicators. Fluoropolymer and glass-lined premium work carries far better margin but requires certified crews that take years to train and cannot be scaled quickly when demand surges.

High-value margin pools concentrate in semiconductor and battery precursor fluoropolymer lining, where contamination tolerances rule out competition from lower-cost materials entirely, and in pharmaceutical glass-lined reactor relining, where regulatory validation requirements lock customers into their original equipment supplier for years at a time regardless of price.

Volume / Commodity-Adjacent Tier

Rubber lining for general chemical storage and mining slurry handling, priced on installed cost per square metre against multiple qualified regional competitors, with margin held down by wide applicator availability and low material differentiation across suppliers.
Gross Margin: 18-28%

Premium / Certified Tier

Fluoropolymer and glass-lined systems for high-purity chemical, semiconductor, and pharmaceutical service, priced on contamination control and validated service life rather than installed cost, since regulatory qualification locks buyers to a supplier for the operating life of the vessel.
Gross Margin: 38-52%

Sustainability / Regulatory / Next-Generation Tier

Ceramic wear-lining and recycled-content epoxy systems sold against emissions and circularity procurement targets, commanding certification-based pricing that rewards documented material traceability over raw performance data, particularly among buyers reporting against corporate sustainability commitments.
Gross Margin: 30-46%
global-lining-market-trends-portfolio-architecture-1787553785759

High-value Sub-segments and Strategic Watch-out

Fluoropolymer and PTFE Lining

High value and the fastest-growing segment at 9.2%, driven by semiconductor and battery precursor contamination tolerances that rubber cannot meet. Margin runs highest here, and installation backlogs already stretch past twelve months at several major converters. Certified applicator capacity, not resin supply, is now the binding constraint on growth.
Gross Margin: 40-52%

Glass and Glass-Lined Systems

High value with moderate growth near 5.0%, anchored in pharmaceutical and fine chemical relining where regulatory validation locks customers to their original supplier for the life of the vessel and beyond. Glass-lined reactors rarely change supplier once qualified, which gives incumbents like Pfaudler and De Dietrich a durable relining annuity.
Gross Margin: 38-50%

Rubber Lining

The volume core, covering mining slurry handling and general chemical storage across every region. Steady but thin margin, competing on installed cost per square metre against a fragmented field of regional applicators. Volume stays resilient because mining and general chemical demand rarely pauses, even as premium segments slow.
Gross Margin: 18-26%

Ebonite Lining

The strategic watch-out. A legacy hard-rubber technology being steadily displaced by fluoropolymer and ceramic hybrids in the same duty cycles, with growth slowing to 4.1% as qualified applicator numbers continue shrinking. Suppliers still holding ebonite capacity should plan an orderly wind-down rather than new capital investment in this product line.
Gross Margin: 15-24%

Why Lining Contracts Run for Decades

Lining demand behaves like an annuity once a vessel is validated for a given process. A pharmaceutical or fine chemical reactor lined and process-validated against a specific product line will typically keep the same lining specification for the vessel's operating life, since requalifying an alternate material means repeating costly regulatory validation work that plant managers avoid whenever possible.
Adoption depth varies sharply by end-use vertical. Pharmaceutical and semiconductor buyers lock in almost total loyalty to validated lining specifications, since any change triggers a requalification process that can take months and cost far more than the lining itself. Mining and general chemical buyers show far more willingness to switch suppliers between relining cycles, since wear-lining performance is judged mainly on service life and price rather than any regulatory validation requirement.

Buyer profiles are shifting generationally as procurement moves from plant engineers who select on familiarity toward centralised corporate procurement functions that weigh total cost of ownership and supplier sustainability credentials more heavily. Younger maintenance engineers increasingly push for condition-monitoring data before committing to a relining specification, a habit almost absent among the retiring generation of plant managers.
global-lining-market-trends-end-use-penetration-index-1787553786248

Where the Next Decade Gets Decided

These are among the four positions where our research anticipates prominent divergence between winners and laggards over the coming forecast period. Each is grounded in the demand model, the regulatory perimeter, and the announced capacity pipeline.
01 / FLUOROPOLYMER CAPACITY POSITIONING

Build fluoropolymer application capacity ahead of semiconductor and battery demand

Fluoropolymer lining is growing at 9.2%, well above every other material category, and installation backlogs already stretch past twelve months at several major converters. Suppliers that expand certified fluoropolymer applicator capacity now will capture disproportionate share as semiconductor and battery precursor capacity keeps commissioning across East Asia and increasingly South Asia. Waiting for demand to fully materialise before investing in training and applicator capacity means arriving after the queue has already formed, and after competitors have locked in the customer relationships that come with early qualification.
02 / APPLICATOR TALENT PIPELINE

Own the applicator certification pipeline rather than renting third-party crews

Certified crew capacity, not raw material supply, is the binding constraint across this entire market, and third-party contractor quality varies enough to generate costly warranty claims on complex jobs. Suppliers building in-house certification academies, as Trelleborg and Weir Group have both done since 2024, are already reporting materially lower claim rates than competitors relying on external crews. This advantage compounds over time as trained crews stay longer at employers who invested directly in them, widening the quality gap against competitors who keep renting third-party labour project by project.
03 / FLUORSPAR SUPPLY DIVERSIFICATION

Diversify fluorspar sourcing before the next Chinese export disruption

The 2023 fluorspar export documentation disruption showed how quickly Chinese policy can constrain fluoropolymer resin availability industry-wide, and China's share of global fluorspar processing has not meaningfully declined since then. Converters that complete qualification against Mexican and South African fluorspar sources now will hold a durable negotiating advantage during the next disruption, while competitors still dependent on spot Chinese material face renewed delivery risk. Qualification takes years, so the window to act is now, before the next Chinese export policy shift forces converters to scramble for alternative supply.
04 / EAST ASIA CAPACITY COMMITMENT

Prioritise East Asian capacity even where entry cost runs higher

East Asia holds 29% of global lining value and grows at 7.4%, ahead of every mature region, driven by chemical, battery, and semiconductor capacity that shows no sign of decelerating through the forecast period. Suppliers without meaningful East Asian application capacity are ceding the fastest-growing and largest single regional pool to domestic Chinese, Korean, and Japanese competitors who already hold local relationships. Entry cost is real, but the alternative is permanent share loss in the region that matters most for every category this report tracks.

Engagement Snapshot From the Field

A live engagement with an industry participant carrying material or product regulatory and market exposure ahead of a defining policy shift, showing how our research translates into a defensible multi-year portfolio strategy.
MARKET MINDS ADVISORY · CLIENT ENGAGEMENT SUMMARY
Global Lining Producer Strategic Portfolio Review and Transition Roadmap 2026·Investment Scenario on Global Lining Exposure Evaluation 2025-26
CLIENT PROFILE
A specialty chemical producer operating multiple acid and solvent processing sites across the United States and Germany approached MMA after two unplanned shutdowns tied to lining failure within eighteen months. The client reported annual revenue near USD 2.3 billion, with roughly a dozen critical vessels approaching the end of their originally specified rubber lining service life (client-reported, unverified by MMA).
STRATEGIC CHALLENGE
Plant engineering wanted to relike vessels with the same rubber specification that had served for decades, while the corporate risk function pushed for a full switch to fluoropolymer despite substantially higher upfront cost. Nobody had modelled the actual downtime cost of a third failure against the incremental capital cost of upgrading, leaving two internal factions arguing past each other for months.
MMA APPROACH
MMA built a vessel-by-vessel risk model comparing rubber relining cost against fluoropolymer conversion cost, weighted by each vessel's chemical duty severity and historical failure history. We benchmarked applicator lead times across both material options and modelled downtime cost per shutdown day using the client's own production data to make the comparison concrete rather than theoretical.
KEY FINDINGS
  1. Four of the twelve vessels handled chemical duty severe enough that fluoropolymer conversion paid back its incremental cost within a single avoided shutdown event.
  2. The remaining eight vessels showed no compelling case for conversion, since their duty cycles fell well within rubber's proven service envelope and failure history.
  3. Certified fluoropolymer applicator lead times ran nearly double rubber lead times, meaning a blanket conversion decision would have created a scheduling bottleneck across the whole site.
  4. Downtime cost per shutdown day exceeded the client's own internal estimate by a wide margin once lost production and contractual customer penalties were both included in the model (client-reported, unverified by MMA).
CLIENT PROFILE
A specialty chemical producer operating multiple acid and solvent processing sites across the United States and Germany approached MMA after two unplanned shutdowns tied to lining failure within eighteen months. The client reported annual revenue near USD 2.3 billion, with roughly a dozen critical vessels approaching the end of their originally specified rubber lining service life (client-reported, unverified by MMA).
STRATEGIC CHALLENGE
Plant engineering wanted to relike vessels with the same rubber specification that had served for decades, while the corporate risk function pushed for a full switch to fluoropolymer despite substantially higher upfront cost. Nobody had modelled the actual downtime cost of a third failure against the incremental capital cost of upgrading, leaving two internal factions arguing past each other for months.
MMA APPROACH
MMA built a vessel-by-vessel risk model comparing rubber relining cost against fluoropolymer conversion cost, weighted by each vessel's chemical duty severity and historical failure history. We benchmarked applicator lead times across both material options and modelled downtime cost per shutdown day using the client's own production data to make the comparison concrete rather than theoretical.
KEY FINDINGS
  1. Four of the twelve vessels handled chemical duty severe enough that fluoropolymer conversion paid back its incremental cost within a single avoided shutdown event.
  2. The remaining eight vessels showed no compelling case for conversion, since their duty cycles fell well within rubber's proven service envelope and failure history.
  3. Certified fluoropolymer applicator lead times ran nearly double rubber lead times, meaning a blanket conversion decision would have created a scheduling bottleneck across the whole site.
  4. Downtime cost per shutdown day exceeded the client's own internal estimate by a wide margin once lost production and contractual customer penalties were both included in the model (client-reported, unverified by MMA).
RECOMMENDED STRATEGY
Phase 1: Phase 1 (0 to 6 months): Convert the four highest-severity vessels to fluoropolymer lining during their next scheduled shutdown window. Phase 2: Phase 2 (6 to 18 months): Relike the remaining eight vessels with upgraded rubber compounds carrying improved abrasion resistance ratings. Phase 3: Phase 3 (18 to 36 months): Install condition-monitoring sensors across all twelve vessels to base future relining timing on measured wear rather than fixed calendar intervals.
OUTCOME
The client avoided a third unplanned shutdown across the following eighteen months and reported the fluoropolymer conversion on its four highest-risk vessels paid back within fourteen months through avoided downtime alone. Total relining spend across the programme came in near USD 18 million, materially below the cost of a single major unplanned outage (client-reported, unverified by MMA).

Frequently Asked Questions

Foundational context covering the market sizes, CAGR, scope, country, region and competition that inform every finding below. This section is provided to cover basics and most often pre-purchase conversations, answered from the MMA Primary Research Dataset.

What is the current size of the Global Lining Market?

The global lining market reached USD 5.8 billion in 2025, spanning rubber, fluoropolymer, epoxy, glass, ceramic, and ebonite lining systems for tanks, vessels, and process piping worldwide.

How large will the Global Lining Market be by 2036?

MMA forecasts the market will reach roughly USD 12.0 billion by 2036, up from about USD 6.2 billion in 2026, as chemical and mining capacity additions continue driving specification.

What is the CAGR for the Global Lining Market 2026 to 2036?

The base case CAGR is 6.4% for 2026 to 2036, with a bull case of 7.6% and a bear case of 5.2% depending on industrial capex timing.

Which segment is growing fastest?

Fluoropolymer and PTFE lining grows fastest at 9.2% CAGR, about 1.44 times the overall market rate, driven by semiconductor and battery precursor contamination requirements. Ceramic and wear-resistant lining follows close behind as mining operators respond to declining ore grades.

Who are the major companies in the Global Lining Market?

Pfaudler, De Dietrich Process Systems, Trelleborg, Sulzer, and Saint-Gobain Performance Plastics lead the field, assessed on combined material and application services revenue. Fifteen additional players compete across regional and material-specific niches.

Which country is growing fastest?

India posts the fastest national growth at 10.8% CAGR, driven by its Production Linked Incentive programme pulling forward new chemical processing capacity. China remains the largest single national market by installed lining value.

Report Segmentation Architecture

The full report scope spans multiple orthogonal segmentation dimensions, with cross-tabulated demand data provided for each dimension pair. Coverage extends further to regional breakdowns, trend trajectories, and the competitive detail needed to support segment-level decision-making.

By Lining Material Type

  • Fluoropolymer and PTFE Lining
  • Ceramic and Wear-Resistant Lining
  • Epoxy and Vinyl Ester Lining
  • Rubber Lining
  • Glass and Glass-Lined Systems
  • Ebonite Lining

By End-Use Industry

  • Chemical Processing
  • Mining and Mineral Processing
  • Oil and Gas
  • Power Generation
  • Water and Wastewater Treatment

By Commercial Dimension

  • Material Supply Only
  • Combined Supply and Application Service
  • Aftermarket Repair and Relining
  • Distribution and Stocking Channel

By Region

  • North America
  • Western Europe
  • East Asia
  • South Asia and Pacific
  • Latin America
  • Middle East and Africa
  • Eastern Europe

Scope, Methodology, and Coverage

Every figure in this report is reproducible from documented input assumptions. The scope below maps the historical period, the forecast horizon, the segmentation dimensions, and the countries covered, alongside the underlying primary and qualitative methodology.
Historical Period
2020 to 2025
Forecast Period
2026 to 2036
Base Year
2025 (USD billions; MMA Primary Research Dataset, August 2026)
Market Definition
The global lining market comprises protective lining materials, engineered systems, and application services applied to the interior surfaces of tanks, vessels, reactors, and process piping to resist corrosion, abrasion, and chemical attack. It spans rubber, fluoropolymer, epoxy and vinyl ester, glass, ceramic, and ebonite material families. Architectural and marine coatings, external pipeline coatings, and high-temperature refractory linings are excluded.
Quantitative Units
USD billions (current prices); square metres of lined surface where applicable
Segmentation Dimensions
By Lining Material Type; By End-Use Industry; By Commercial Dimension; By Region
Regions Covered
North America, Western Europe, East Asia, South Asia and Pacific, Latin America, Middle East and Africa, Eastern Europe
Countries Covered
USA, China, Germany, France, UK, Japan, South Korea, India, Australia, Canada, Brazil, Mexico, Indonesia, Vietnam, Thailand, Malaysia, UAE, Saudi Arabia, South Africa, Nigeria, Turkey, Poland, Netherlands, Italy, Spain, Sweden, Switzerland, Argentina, Colombia, Singapore, and additional markets relevant to this sector
Key Companies Profiled
Pfaudler Inc., De Dietrich Process Systems, Trelleborg AB, Sulzer Ltd, Saint-Gobain Performance Plastics, Chemours Company, Daikin Industries Ltd, Weir Group PLC, CoorsTek Inc., Belzona Polymerics Ltd, ERIKS NV, Winn & Coales International, PPG Industries Inc., Carboline Company, RPM International Inc., Kalenborn Kalprotect GmbH, ContiTech (Continental AG), Magotteaux International, 3M Company, Corrosion Engineering International
Quantitative Methodology
Primary survey, n=3,800 respondents, Q4 2025, six countries; demand-side model with trade association cross-validation
Qualitative Methodology
47 expert interviews, Q4 2025; applied to validate demand model assumptions, identify emerging dynamics, and assess competitive positioning
Report Format
PDF and XLSX data workbook (Word format preview document)
Publisher
Market Minds Advisory
Report Code
MMA-2026-CHM-101
Published
August 2026
Contact
sales@marketmindsadvisory.com | www.marketmindsadvisory.com

Purchase the full Global Lining Market Report (2026 to 2036).

The full MMA Global Lining Market report sizes demand across six material types, five end-use industries, four commercial dimensions, and seven regions through 2036. It profiles twenty participants on a consistent basis of annual lining materials and application services revenue, scoring each on applicator capacity, feedstock security, and service depth. Scenario models quantify how fluoropolymer conversion, ceramic wear-lining adoption, and fluorspar supply diversification move both demand and realised pricing. The report also includes delivered-cost modelling by material type, an applicator capacity constraint assessment, and a fluorspar supply concentration risk screen built for procurement, strategy, and investment teams.
Six-segment material type demand model across the forecast
Seven-region growth, share, and demand breakdown for 2036
Twenty-company competitive benchmarking across material and service lines
Fluorspar supply concentration risk screen by geography
Applicator capacity constraint analysis by region and material
Ten-year revenue, margin, and volume forecast

Built For The People Who Decide

From boardroom strategy to bench-side execution, this report is read cover-to-cover by leaders shaping the next decade of their industry, turning demand scenarios, market dynamics and valuation benchmarks into decisions.
CXOs/ Presidents/ VPs/ Managers
M&A and Corporate Development
Strategy Teams and R&D Heads
Procurement and Product Directors
Regulatory and Compliance Leaders
Investor Relations and Equity Analysts