Market Minds Advisory
Global Lead Market

Global Lead Market: Refined Metal, Alloys and Compounds Across Battery and Industrial Demand, 2026 to 2036

The most recycled metal on earth depends almost entirely on one application, and every forecast for lead is really a forecast about how long the twelve-volt battery survives in an electrified vehicle.

Lead Analyst

Bilal Shaikh

Published

August 2026

Make Smarter Decisions with Customized Research Insights

Request a free sample report and evaluate market opportunities, growth trends, and competitive dynamics relevant to your business needs.

2025 MARKET VALUE$27.4BMarket Size 2025
2036 FORECAST VALUE$40.4BBase Case , 2026 to 2036
CAGR 2026 TO 20363.6 %Bull 4.8% / Bear 2.4%
INCREMENTAL OPPORTUNITY$12.1BNet 10- year value creation
EXPANSION MULTIPLE1.42x2036 value over 2026 base
Strategic Levers
M&A Pipeline
Regional Outlook
Country Rankings
Competitive Intelligence
Segmental Deep-dive
Call-Us : 91 93563 13602

Executive Snapshot and Market Trajectory

Lead is a one-application metal dressed as a diversified one. Batteries absorb 86% of refined consumption, and 62% of refined output comes from recycling those same batteries, which makes this a closed loop whose size is set entirely by what happens in automotive and stationary storage rather than upstream.
Growth concentrates in lead-calcium and lead-tin alloys, expanding at 5.4%, which are the grid alloys that absorbent glass mat and enhanced flooded batteries require for start-stop duty and deep cycling. East Asia holds 42% of value, well above the band this report applies elsewhere, because Chinese refined production and consumption together dominate the global balance to a degree that no other base metal comes close to matching.
Production is fragmented, with the top five holding 27% of refined tonnage, because secondary smelting is a regional business built around scrap collection radius rather than around orebodies or scale economics. Competition runs on scrap feed access and environmental compliance cost rather than on metal quality, which exchange specification standardised long ago. Emissions regulation is what removes capacity here, and over fifteen years it has removed a great deal of it.
Market Definition
The market comprises refined lead metal and lead-bearing products, spanning refined ingot, lead-calcium and lead-tin alloys, lead-antimony alloys, lead oxides and chemical compounds, and rolled sheet and extruded products, from both primary concentrate smelting and secondary recycling of scrap. Sizing captures refined metal and product revenue at realised delivered price across all end-use applications. Lead ore and concentrate sold before refining, spent battery scrap traded as feedstock, finished lead acid batteries, radiation shielding assemblies and ammunition manufacture fall outside scope.
Base Year Value
$27.4B in 2025 (MMA Primary Research Dataset, August 2026)
Forecast Period
2026 to 2036, eleven discrete annual values
CAGR
3.6% base case. Bull 4.8%. Bear 2.4%.
Fastest Growth Segment
Lead-Calcium and Lead-Tin Alloys: 5.4% CAGR
Fastest Growth Country
India: 5.8% CAGR
Fastest Growth Region
South Asia and Pacific: 5.6% CAGR
Largest Region
East Asia: 42% of 2025 global value
Market Leaders
Glencore, Korea Zinc, Ecobat, Nyrstar, Hindustan Zinc. Source: MMA Analysis based on company annual reports.
Primary Survey
n=3,800 procurement and R&D decision-makers, Q4 2025, six countries
Methodology
Demand-side build-up, cross-validated against public data, 47 expert interviews

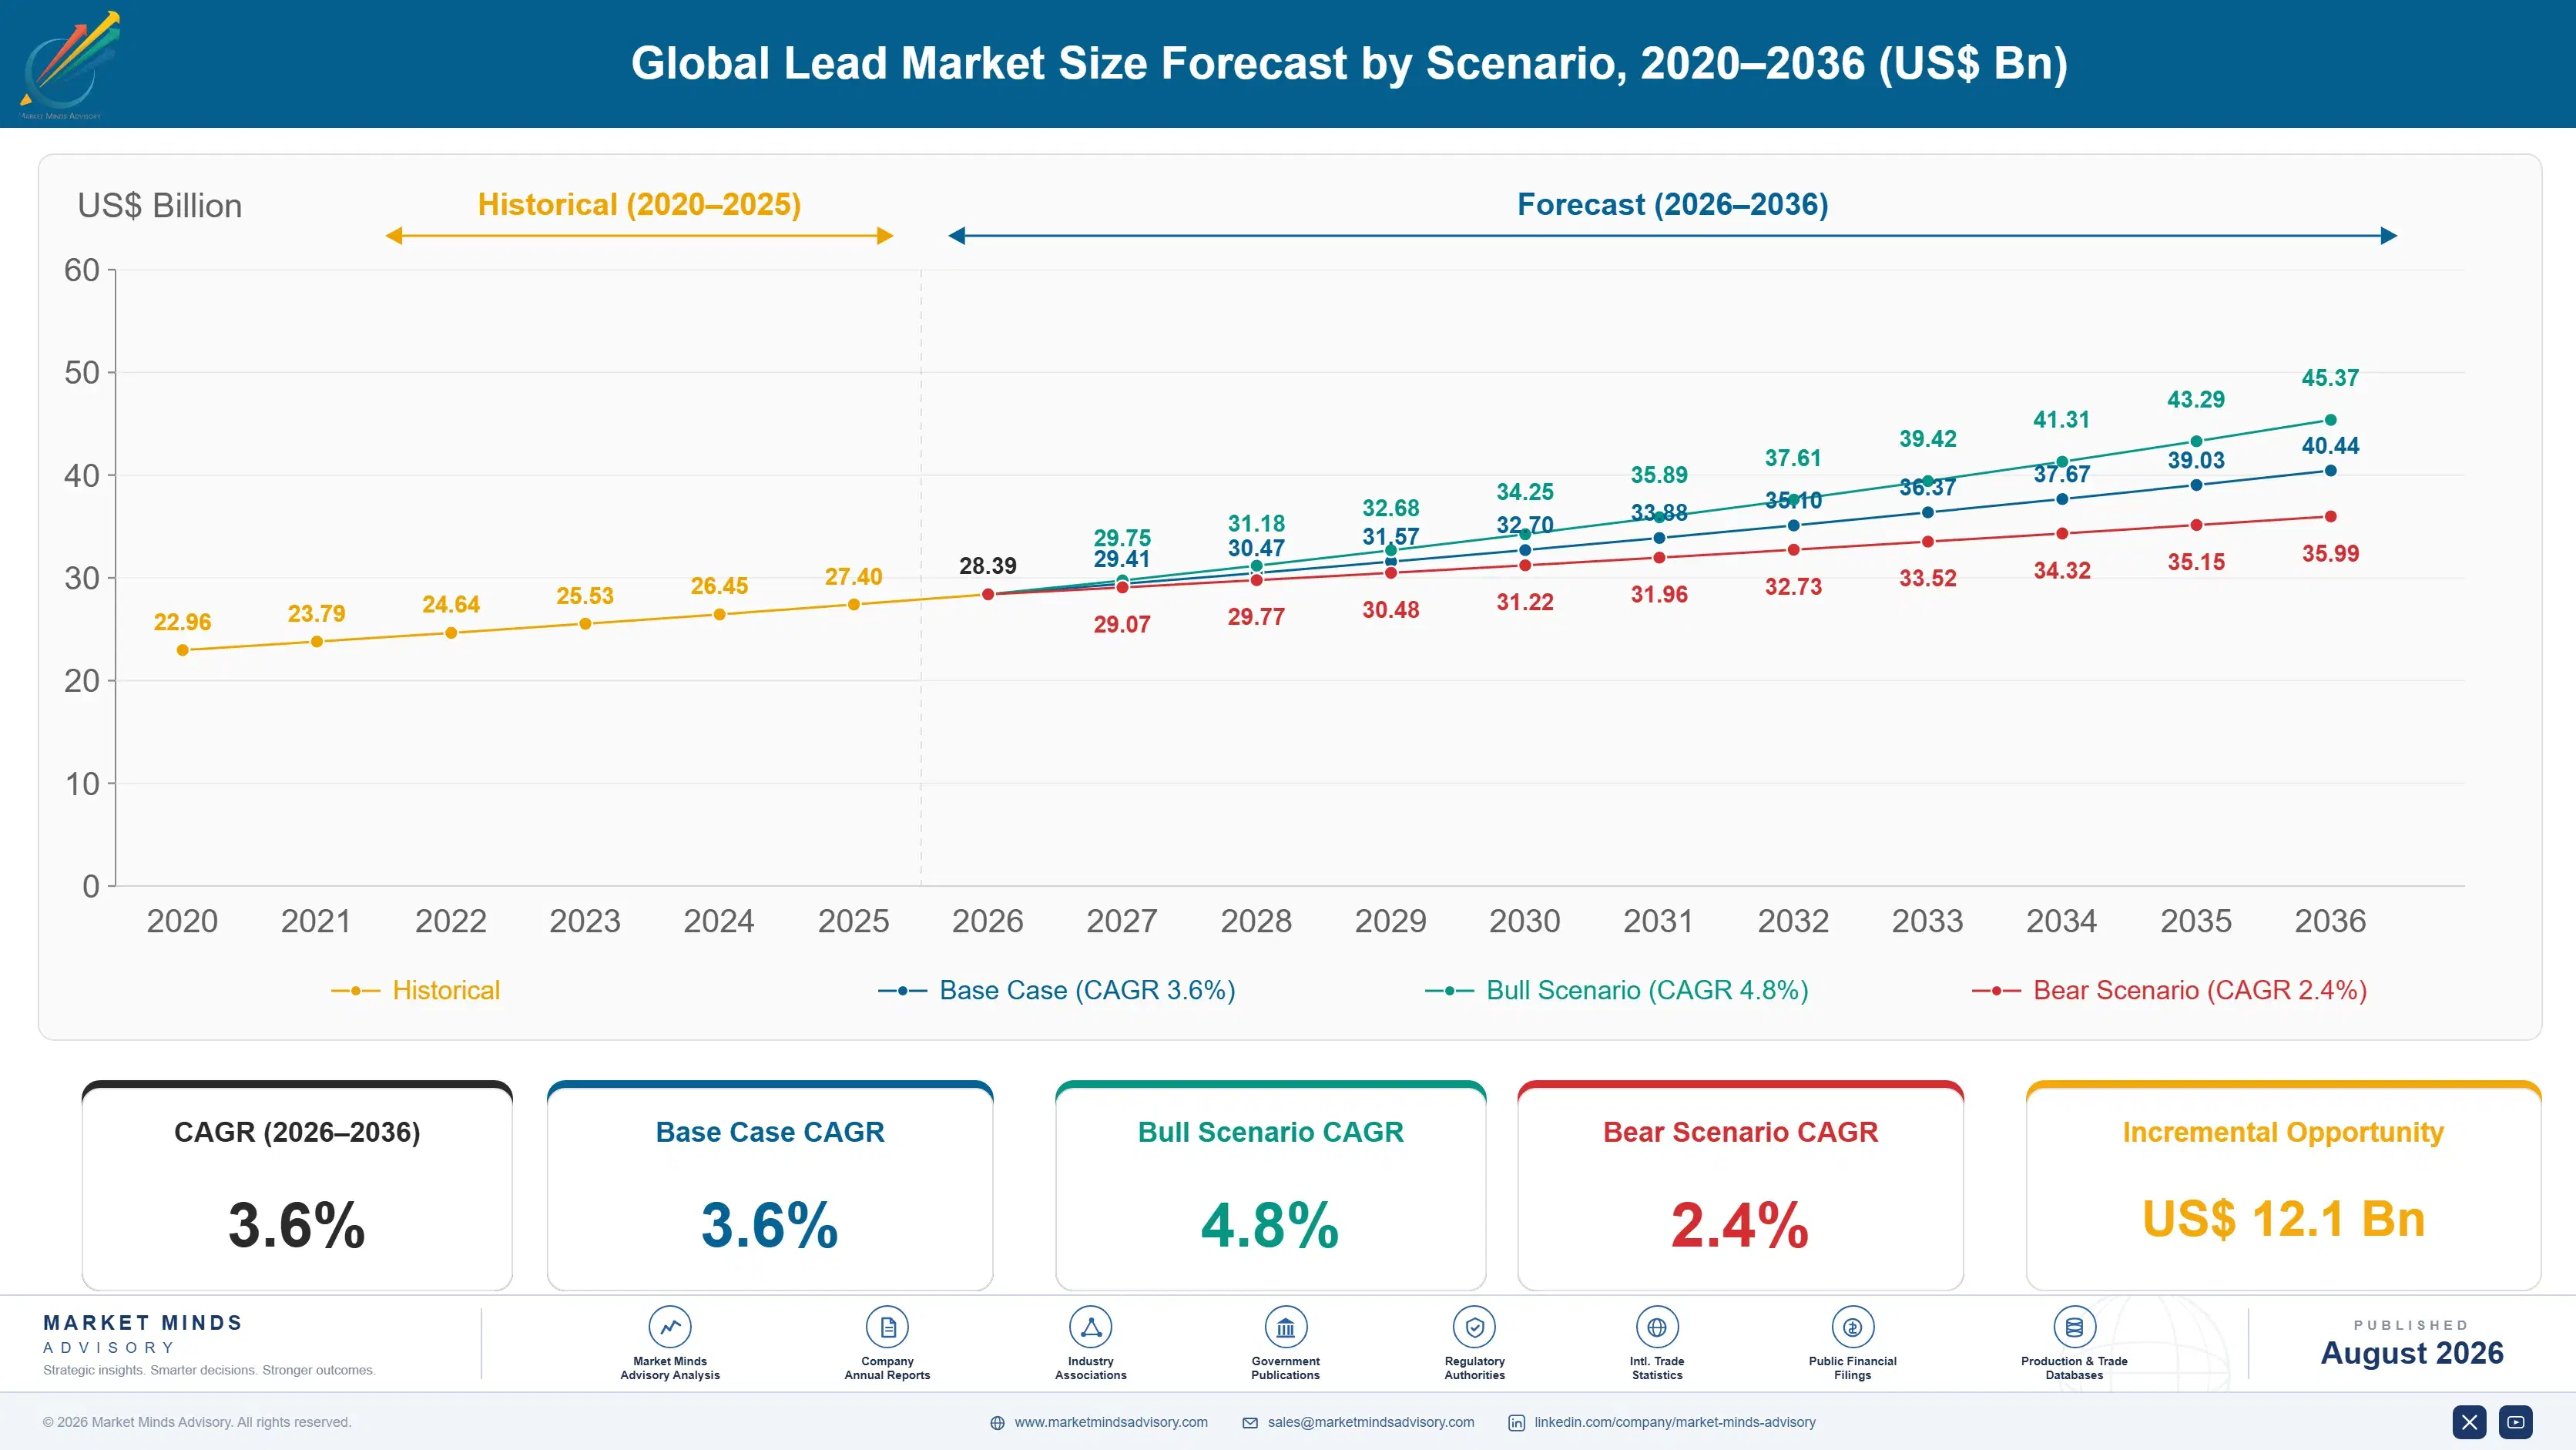
Global Lead Market Forecast Scenarios

global-lead-market-trends-size-forecast-scenario-1787310302571
Growth of 2.6% across 2020 to 2025 was slower than the metal's demand fundamentals suggested, for reasons on the supply side. Environmental compliance closed secondary smelters across China, India and parts of Europe, energy costs made others uneconomic through 2022, and scrap collection was disrupted for two years. Refined output constrained the market rather than demand, which is unusual in a base metal.
The base case at 3.6% rests on three mechanisms. Vehicle parc growth keeps expanding the replacement battery pool, which is the demand that actually matters since every vehicle including electric ones carries an auxiliary battery. Start-stop and mild hybrid systems require absorbent glass mat construction using more lead per unit than conventional flooded designs. And stationary storage in telecom, backup and industrial applications keeps buying lead acid on cost grounds despite everything said about lithium.
The bull case at 4.8% turns on stationary and industrial demand holding better than expected as lithium supply chains prioritise vehicles and grid projects. The bear case at 2.4% turns on the twelve-volt system. Should low-voltage lithium architectures displace the auxiliary battery in mass-market vehicles faster than currently modelled, the replacement pool that underwrites this market begins shrinking within the forecast period.

What Actually Sets Refined Lead Value

Lead runs on a loop that no other base metal comes close to matching. Batteries take 86% of refined consumption, spent batteries are collected at rates near 99% in mature markets, and 62% of refined output comes back out of that scrap. Mined concentrate is the balancing item rather than the foundation, which means primary supply responds to a gap rather than setting the level. Demand and supply are the same physical material eighteen months apart.
TOP FIVE SHARE27%Concentration of refined lead tonnage across the largest producers
REFINED LEAD PRICEUSD 2,050 per tonneExchange cash settlement price per tonne of refined metal
SECONDARY SUPPLY SHARE62%Share of refined output produced from recycled scrap feed
BATTERY END-USE SHARE86%Share of refined consumption absorbed by lead acid batteries
BATTERY RECYCLING RATE99%Share of spent batteries collected and recycled across mature markets
SMELTING ENERGY SHARE18%Energy share of total secondary smelting conversion cost
Competition therefore happens around scrap, not around orebodies. A secondary smelter's economics are set by how much battery scrap it can gather within an economic haulage radius and what it pays for it, and scrap pricing tracks the refined metal price closely enough that margin lives in conversion cost rather than in the spread.
Environmental compliance is the industry's defining commercial variable. Emissions, soil and worker exposure rules have closed a great deal of secondary capacity across China, India and Europe over fifteen years, and the survivors are the ones that invested early. Compliance cost is a barrier to entry, which in a commodity this fragmented is unusual and valuable.
"Everyone forecasting lead spends their time on electric vehicles displacing the starter battery and misses that the same vehicles all carry a twelve-volt auxiliary battery doing more work than before. The threat is real but it arrives through low-voltage architecture changes, not through powertrain change, and those move on a completely different timetable."
Director, Base Metals and Recycling Practice · MMA Chemicals and Materials / Bas

Market Trends

Start-Stop Battery Construction Raises Lead Content Per Unit

Absorbent glass mat and enhanced flooded batteries serving start-stop and mild hybrid systems use denser grid structures and more lead per battery than conventional flooded designs, roughly 22% more in a comparable capacity unit. That matters commercially because it partly offsets any unit decline arising from powertrain change, and the offset is larger than most forecasts allow for. The alloys these batteries require are lead-calcium and lead-tin rather than conventional antimonial grades, which shifts value toward alloy producers with the metallurgical control to hold tight composition tolerances across large production volumes consistently.
Market Impact: Parc expands 2.8% annually
Environmental Compliance Removes Secondary Smelting Capacity

Emissions limits, soil remediation obligations and worker exposure standards have closed secondary lead capacity steadily across China, India and parts of Europe, with roughly 1.4 million tonnes of annual refining capacity retired over the past decade alone. Informal and small-scale recycling has been the primary target, which is appropriate on public health grounds and commercially significant besides. The survivors gain feedstock and pricing power in their collection regions, and compliance investment becomes a genuine barrier to entry in a business that historically had almost no barriers worth mentioning at all.
Market Impact: Costs roughly 55% below lithium

Market Opportunities and Growth Drivers

Global Vehicle Parc Growth Expands The Replacement Pool

Replacement batteries rather than original equipment fitment drive most demand, and the replacement pool is a function of how many vehicles exist rather than how many are sold. The global parc continues expanding at roughly 2.8% annually, and every vehicle on the road carries a lead acid battery that fails within four to six years regardless of what powers the wheels. Electric vehicles carry auxiliary batteries doing more work than conventional starters do. This is the most predictable demand in any base metal, and it is remarkably insensitive to economic cycles.
Market Impact: Affects 9% of electric platforms

Stationary Storage Retains Lead Acid On Cost Grounds

Telecom backup, uninterruptible power supply and industrial standby applications continue specifying lead acid despite a decade of predictions to the contrary, because installed cost per kilowatt hour remains roughly 55% below lithium equivalents and cycle life is adequate for standby duty. Recycling infrastructure and end-of-life liability are settled questions for lead and unsettled ones for lithium, which matters considerably to telecom operators managing hundreds of thousands of remote sites. Growth is unspectacular and durable, which is exactly the sort of baseload that secondary smelters running capital-intensive assets need underneath them.
Market Impact: Energy is 18% of conversion

Market Restraints and Challenges

Low-Voltage Architecture Threatens The Auxiliary Battery

The genuine risk to this market is not powertrain electrification but the twelve-volt system itself. Several manufacturers are developing low-voltage lithium auxiliary architectures, and around 9% of new electric vehicle platforms already specify them. The root cause is packaging and weight rather than cost, which makes it harder to argue against. Commercially the exposure builds slowly, since the replacement pool reflects vehicles already on the road. Participants are responding by developing lead acid formats optimised for auxiliary duty, pursuing stationary and industrial demand harder, and building compound and alloy business less exposed to batteries.
Market Impact: Uses roughly 22% more lead

Scrap Feed Competition Compresses Secondary Smelting Margin

Scrap battery prices track refined metal closely, leaving conversion cost as the only place margin can live. The root cause is that collection is competitive and geographically bounded, so smelters bid against each other for feed inside overlapping haulage radii while selling into an exchange-priced market they cannot influence. Compliance and energy cost then determine who survives a low-price period. Mitigation runs through owning collection networks rather than buying on the open market, investing in furnace energy efficiency, and recovering antimony, tin and polypropylene value that many operators still discard.
Market Impact: Retired 1.4 million tonnes capacity
3 additional market trends, 2 additional growth drivers, and 4 additional restraints and challenges are covered in the full report. Contact sales@marketmindsadvisory.com to access the complete intelligence.

Segment CAGR and Growth Architecture

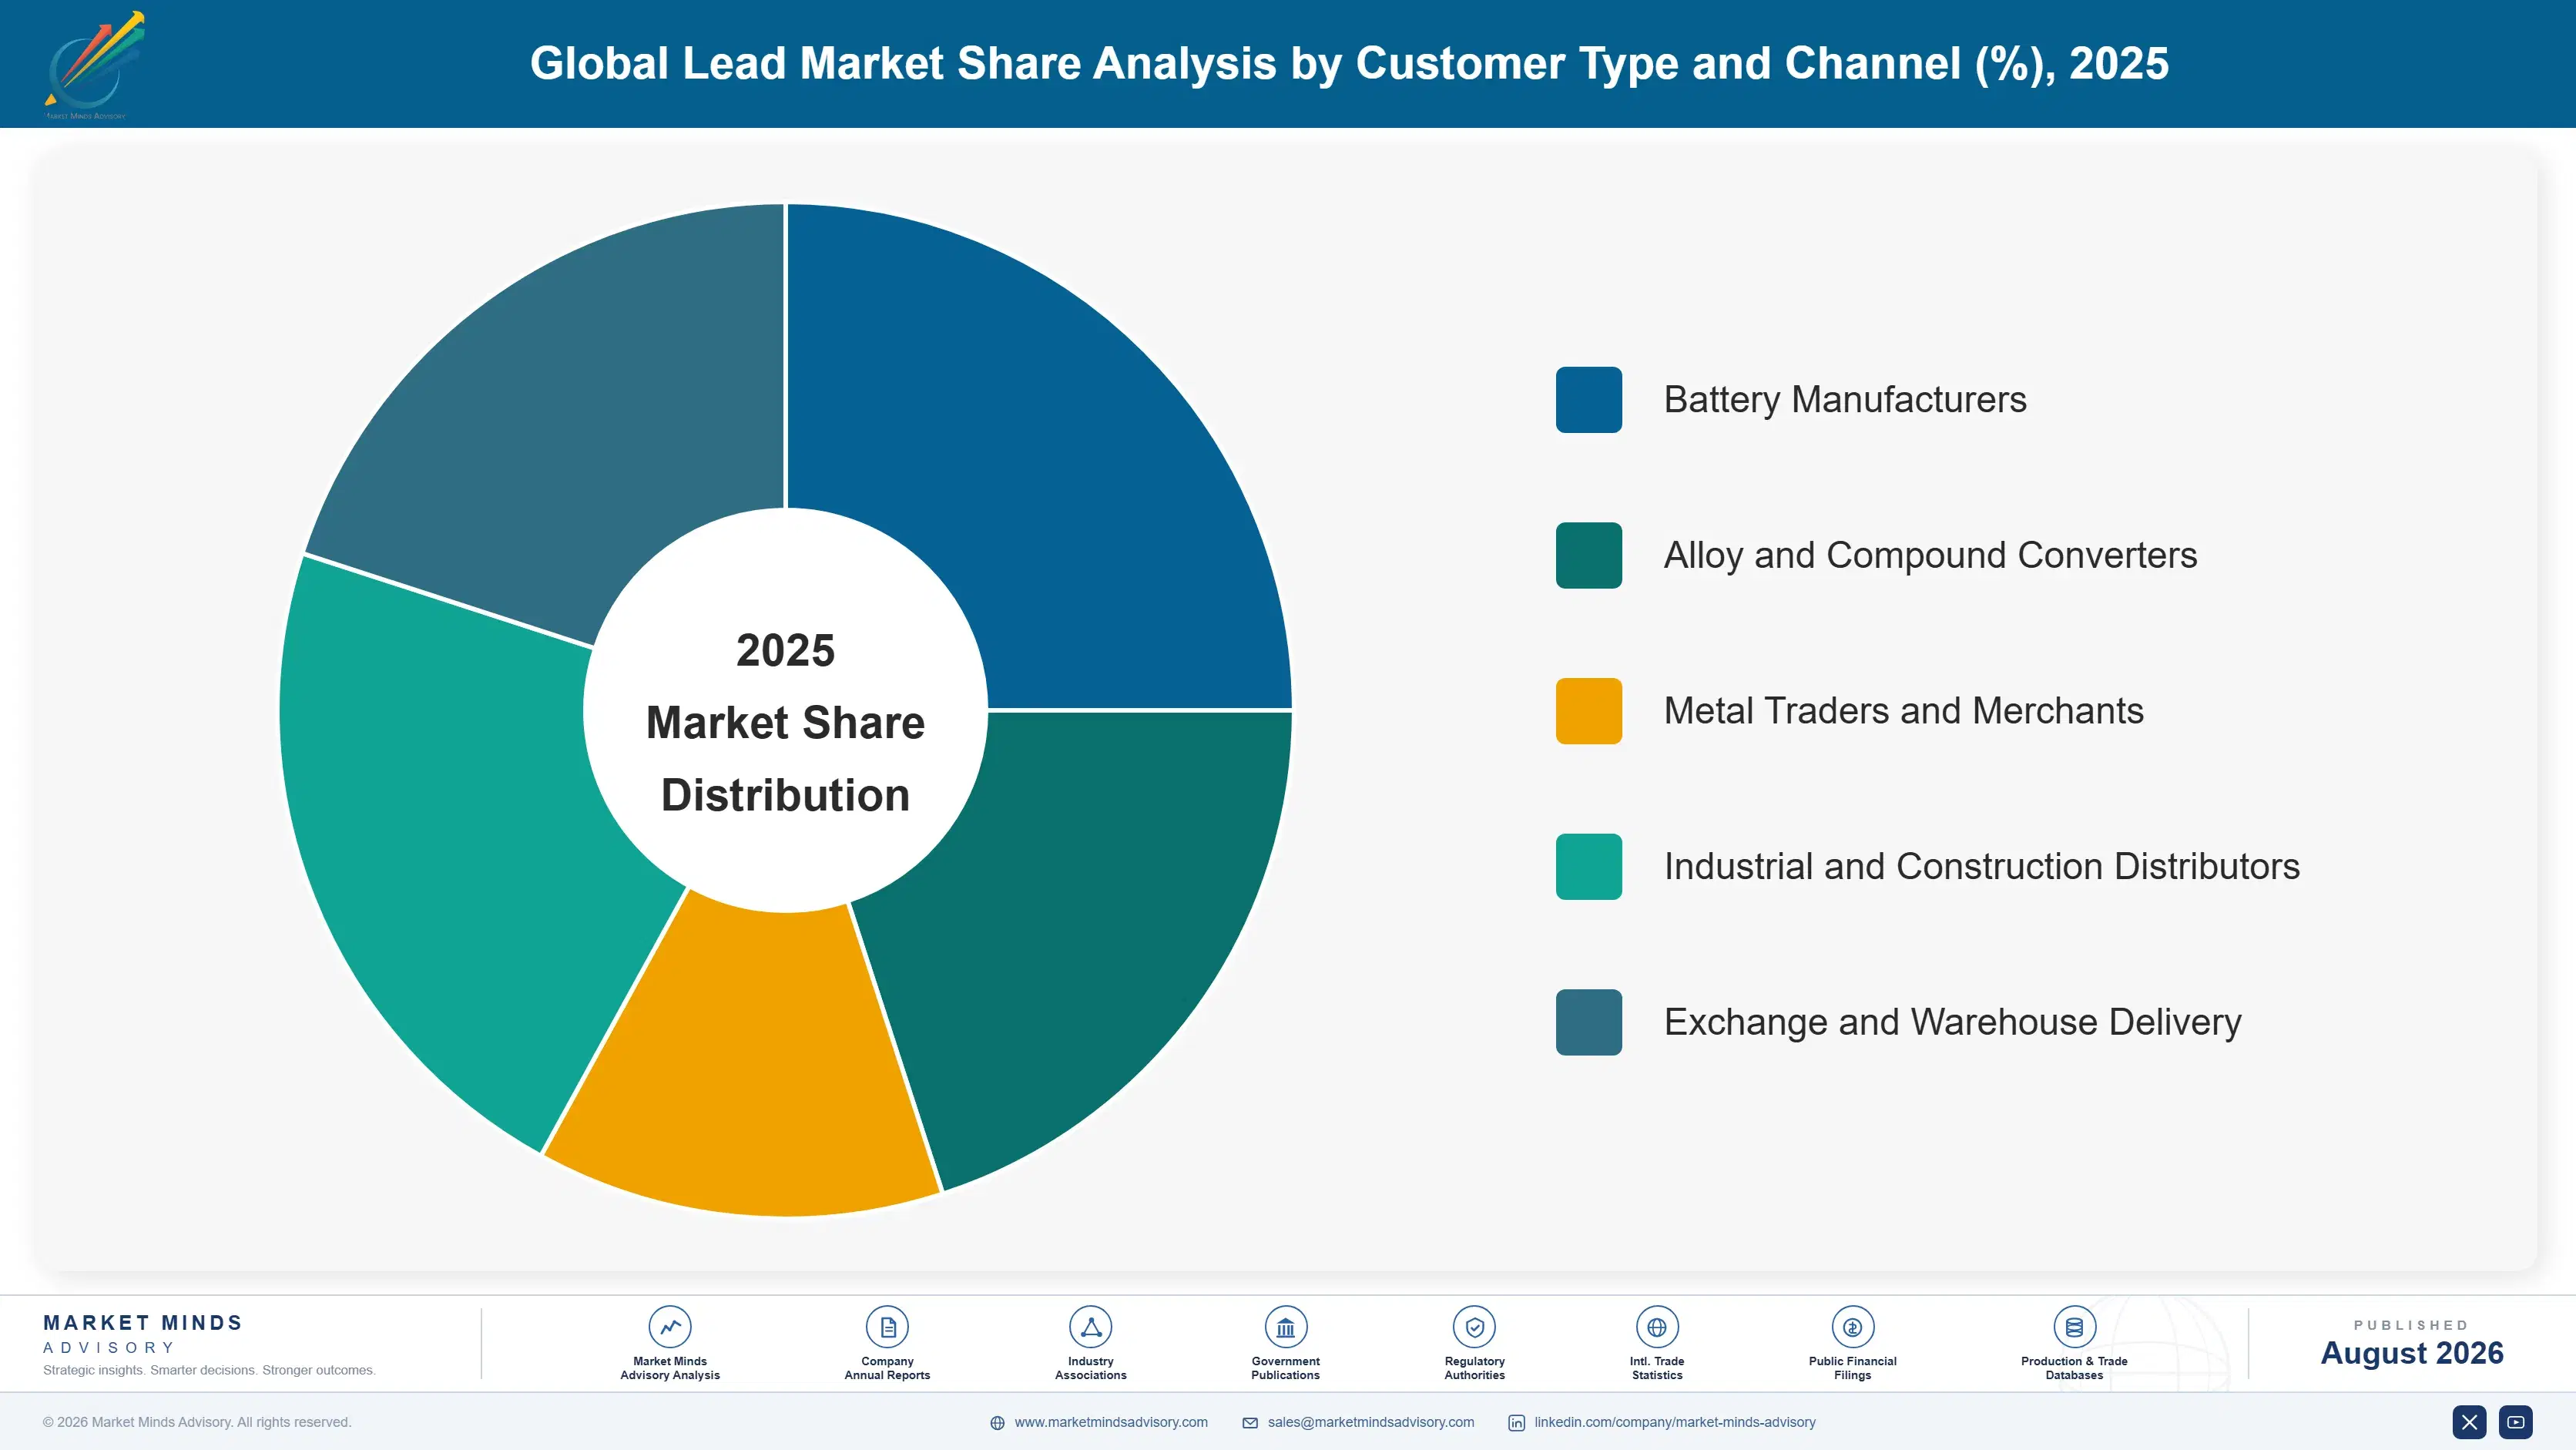
Segmentation follows lead product form, which is the dimension determining metallurgical processing requirement, customer type, specification tolerance and realised premium over exchange price together. Production route, whether primary concentrate or secondary scrap, cuts across every product form without distinguishing between them commercially, since refined metal from either route meets the same specification, so route sits in supply analysis instead.
global-lead-market-trends-market-share-analysis-1787310303113

Lead-Calcium and Lead-Tin Alloys

Growing at 5.4%, exactly 1.50 times the market rate, on demand from absorbent glass mat and enhanced flooded battery construction where conventional antimonial alloys cannot deliver the low gassing and corrosion performance that start-stop duty requires. Composition tolerances are tight, since calcium content variation of a few hundredths of a percent changes grid corrosion behaviour measurably over a battery's life. That metallurgical control is what genuinely separates alloy producers commercially, and it supports a premium over exchange price that refined ingot has never commanded in any market. Battery manufacturers qualify their alloy suppliers carefully and switch away very reluctantly, which makes positions here considerably more durable than anything in commodity metal supply.
CAGR 5.4%

Lead Oxides and Chemical Compounds

Expanding at 4.5% across battery paste oxides, which take the overwhelming majority of volume, alongside stabilisers, glass and ceramic applications and radiation shielding compounds. Battery paste oxide is produced close to the battery plants themselves, because the material is difficult and expensive to transport, which ties this business to customer geography more tightly than any other lead product. Particle size distribution and free lead content determine paste performance, giving producers with real process control a genuine technical position with their customers. Non-battery compound applications have been shrinking under restrictions on lead in consumer products for two decades, and what remains is largely industrial demand that is difficult to substitute with anything else.
CAGR 4.5%
Full segment breakdown across 5 segments available in the complete report.

Regional Architecture and Country Demand Map

Regional value follows refined production and battery manufacturing capacity, which sit close together because lead oxide and alloy supply are geographically tied to the plants consuming them. That concentration is far tighter than vehicle population alone would suggest, and it shapes the entire regional picture.

East Asia

Forty-two percent of value sits here, materially above the band applied to global markets. Note: the deviation is genuine, since Chinese refined lead production and consumption together dominate the world balance to a degree no other base metal shows. China produces and consumes roughly half of global refined lead, driven by battery manufacturing scale, electric two-wheeler batteries in enormous volume, and a secondary smelting industry consolidated hard by environmental enforcement over the past decade. Japan and South Korea contribute refined output and high-specification alloy production serving domestic battery manufacture. Growth of 4.5% runs above the global rate. Enforcement of emissions and soil standards remains the main variable affecting Chinese supply.
Share: 42% | CAGR: 4.5% (2026 to 2036)

North America

Twenty-one percent of value, marginally below the usual band because East Asian dominance compresses every other share proportionally. This is almost entirely a secondary market now, with primary smelting having largely exited the region and battery recycling supplying the great majority of refined supply through a collection network that achieves recovery rates near 99%. Replacement demand from a large and ageing vehicle parc is the commercial foundation, and it is unusually stable. Environmental compliance cost is high and has been for decades, which consolidated the industry early and left survivors with genuine barriers protecting them. Growth of 3.0% reflects a mature replacement market rather than any underlying expansion in demand.
Share: 21% | CAGR: 3.0% (2026 to 2036)
Regional intelligence for 5 additional markets available in the complete report: Western Europe, South Asia and Pacific, Latin America, Middle East and Africa, Eastern Europe. Contact sales@marketmindsadvisory.com.
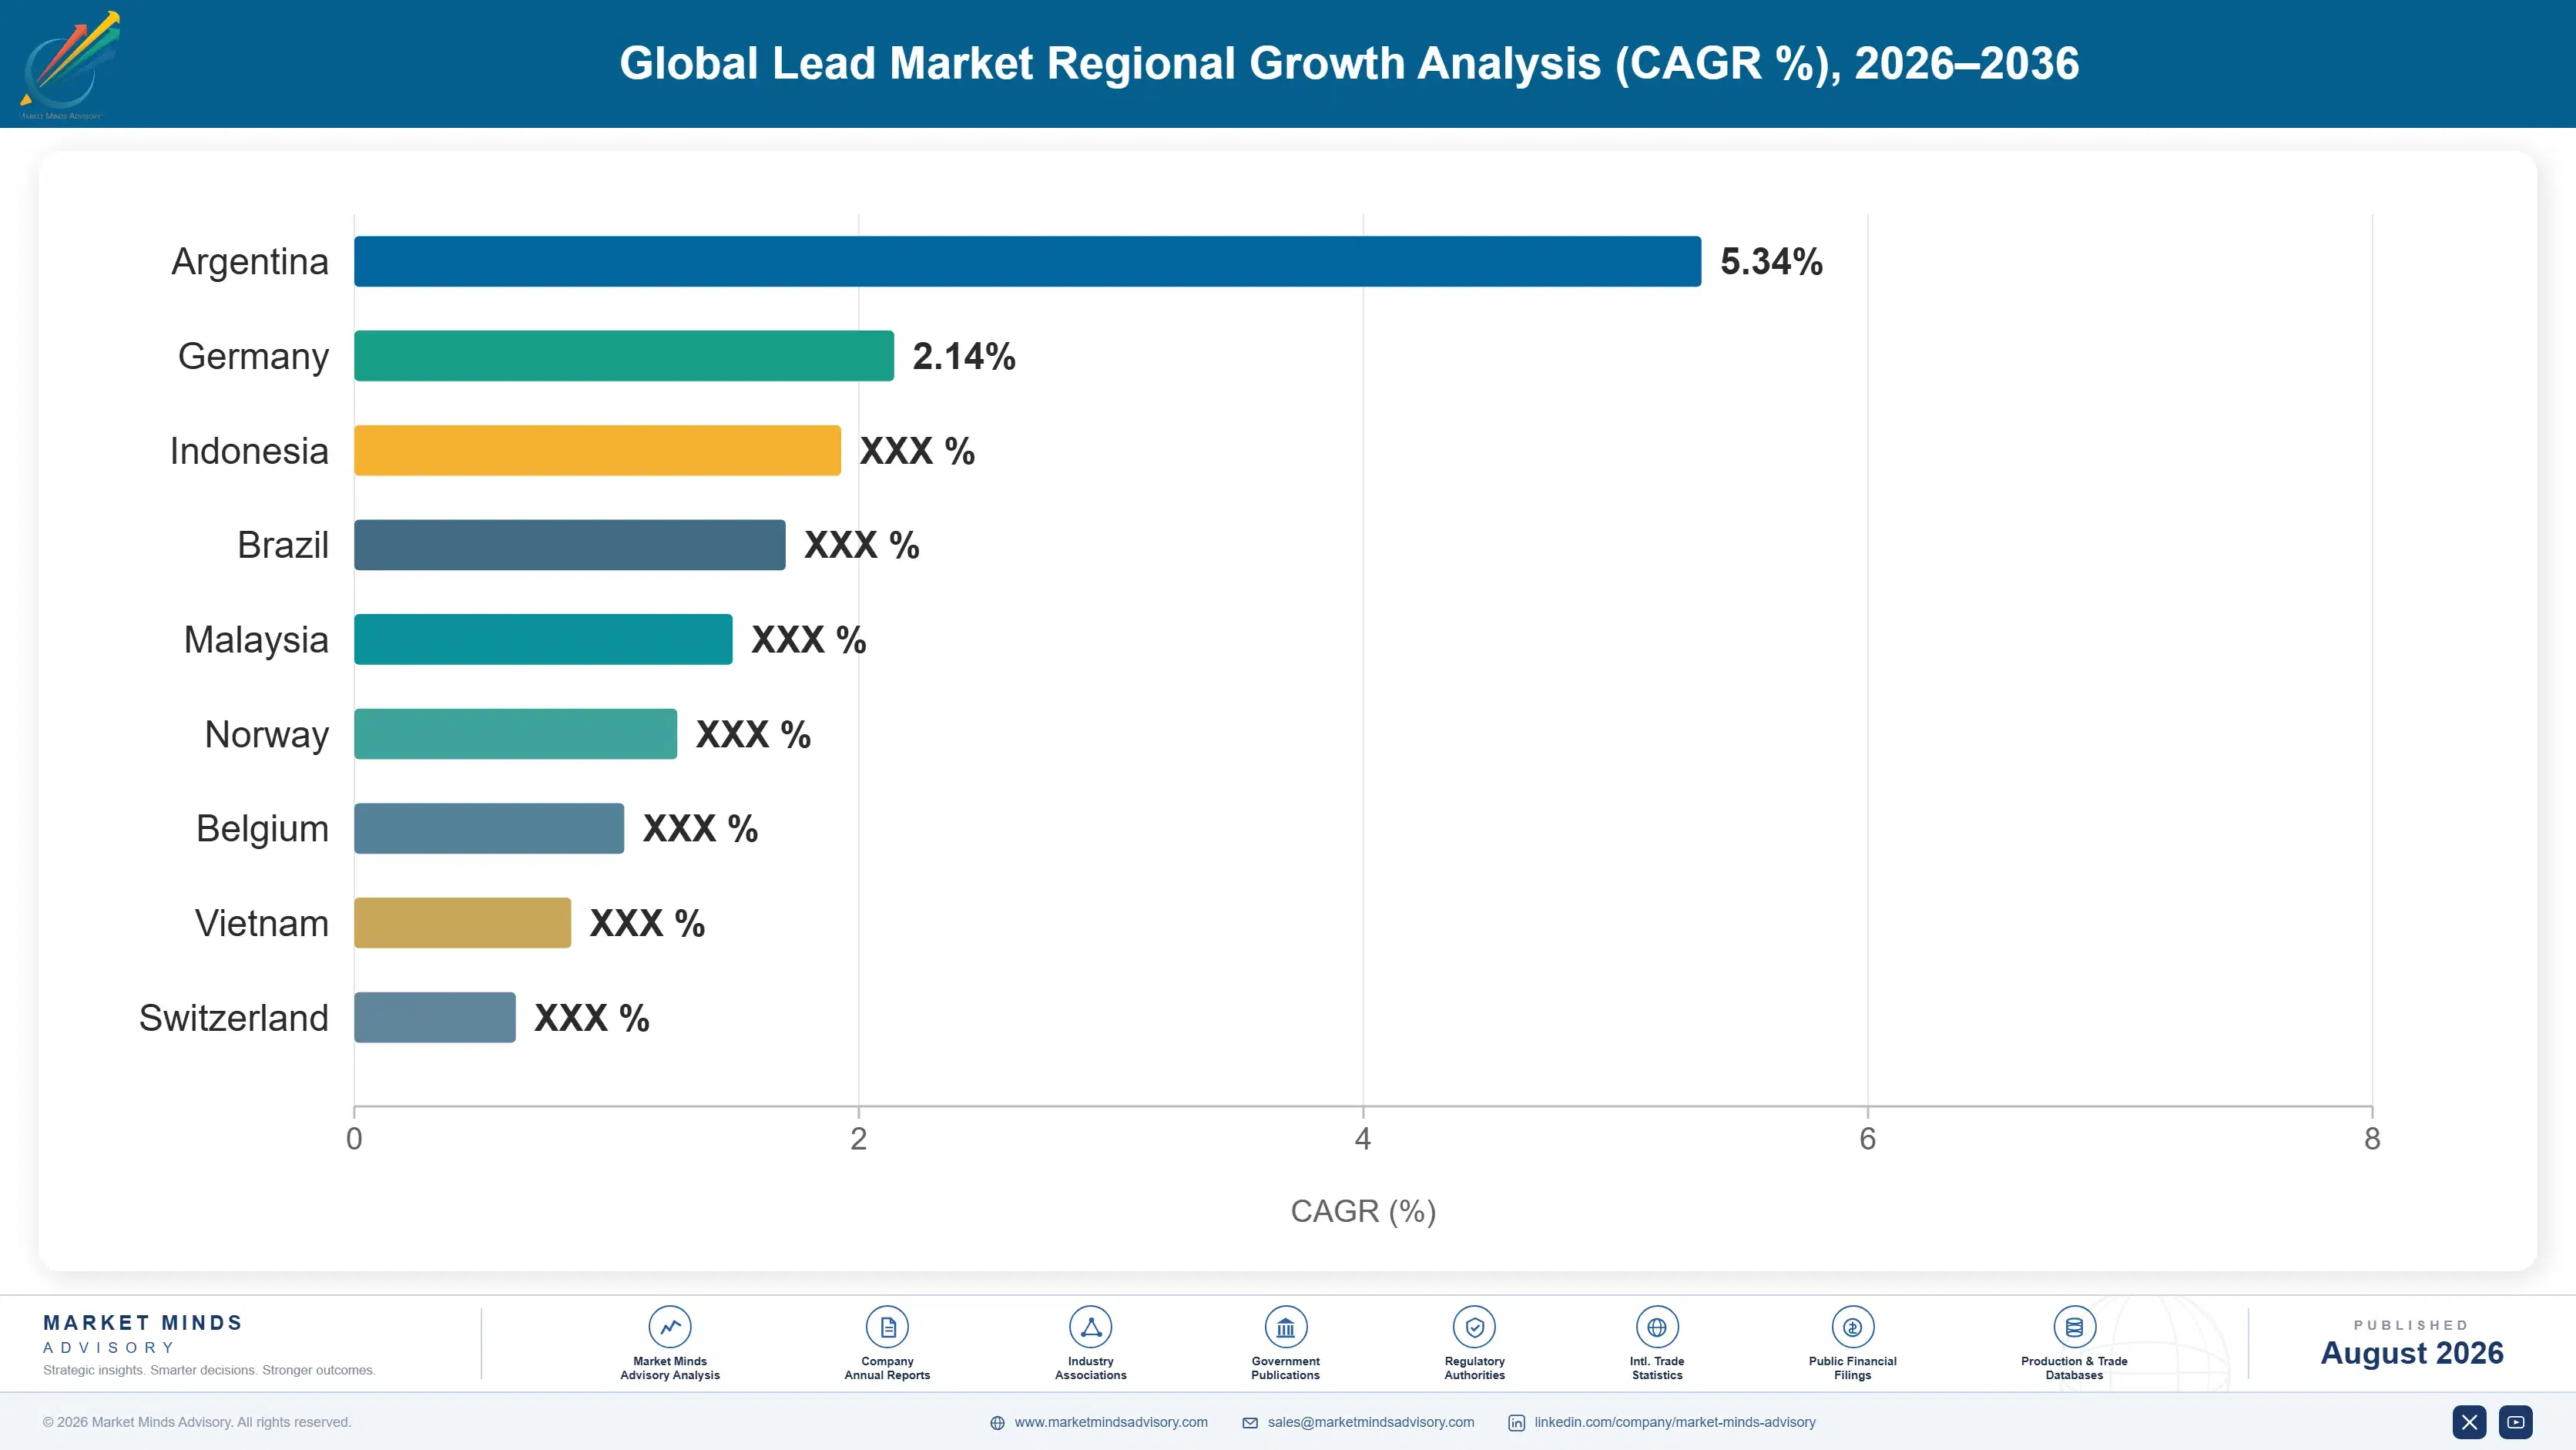
global-lead-market-trends-country-cagr-analysis-1787310303628

Where Lead Producers Can Earn More

Selling refined ingot into an exchange-priced market leaves a producer with conversion cost as the only lever available, which is a thin place to compete from. The value worth chasing sits in scrap collection control, in alloy and oxide specification work, and in the by-product streams that most operators still throw away without measuring them.

Own Scrap Collection Rather Than Buying On Market

Scrap battery pricing tracks refined metal closely, so a smelter buying feed on the open market captures nothing from a rising price and absorbs the squeeze on a falling one. Producers owning collection networks, retailer take-back arrangements and distributor relationships secure feed at roughly 12% below open market terms and, more importantly, secure it at all during periods when collection tightens. The investment is in logistics and relationships rather than in plant. Most secondary smelters still treat feedstock as a purchasing function rather than as the core of the business.
Market Impact: Secures feed roughly 12% below open

Move Volume Into Specification Alloys And Oxides

Refined ingot sells at exchange price and nothing more, while lead-calcium and lead-tin alloys command premiums for composition tolerance that battery manufacturers genuinely need and qualify carefully. Producers shifting output toward specification alloys realise roughly 9% above exchange-linked ingot pricing on the same tonnage, and they gain customer positions that survive price cycles. The metallurgical control required is real but it is not exotic, and it is well within reach of any competent refinery. What it takes is process discipline and a willingness to serve fewer customers far more closely than commodity trading has ever rewarded.
Market Impact: Realises roughly 9% above exchange-

Recover Antimony, Tin And Polypropylene Value

Spent batteries contain antimony, tin and polypropylene casing material that many secondary operators still treat as waste or recover badly. Full recovery adds roughly USD 45 per tonne of battery scrap processed, which against typical secondary conversion margins is not a marginal improvement but a substantial one. The processing investment involved is modest and the technology has been settled for years. Operators skip it because the primary metal stream dominates management attention, which is a poor reason to leave that much value on the floor year after year without anybody quantifying it.
Market Impact: Adds roughly USD 45 per scrap tonne

Invest Ahead Of Emissions Standards Rather Than Behind

Environmental enforcement has retired roughly 1.4 million tonnes of secondary capacity over a decade, and every closure transferred feedstock and pricing power to compliant survivors nearby. Operators investing ahead of tightening standards capture that transfer, typically gaining roughly 15% additional feed volume in their collection region when a competitor closes. Those investing under enforcement pressure pay considerably more for the same equipment and gain nothing at all. Compliance capital is the closest thing this industry has to a growth investment, which is not remotely how most operators' finance functions classify it.
Market Impact: Gains roughly 15% more feed volume

Who Controls the Margin Pool

Concentration is low and geographically determined. The top five participants hold 27% of refined lead tonnage produced, the basis used throughout this section covering primary and secondary output together, and the gap between the diversified miners and the specialist recyclers reflects two quite different businesses sharing one metal. Glencore and Korea Zinc produce refined lead alongside zinc and other base metals, while Ecobat and the regional recyclers built their positions entirely on scra
Competition currently runs on three dimensions and metal quality is not among them, since exchange specification standardised that long ago. Scrap collection reach decides feedstock cost and availability. Environmental compliance position decides who continues operating as standards tighten. Alloy and oxide specification capability decides who earns a genuine premium rather than an exchange price plus a regional differential.

Pressure is building from two directions. Chinese consolidation under environmental enforcement has created large compliant operators with cost positions that export markets feel. Low-voltage architecture development threatens the demand pool over a longer horizon. Rankings shift first in secondary smelting, where compliance capital requirements keep rising and marginal operators keep exiting the business entirely.
global-lead-market-trends-company-positioning-matrix-1787310304145

Competitive Moat and Risk Dimensions

GLENCORE

Moat: Integrated mining and marketing

Combining mined concentrate, refined production and a global marketing operation gives visibility across the physical market that no specialist recycler can obtain, and it allows the company to place metal where premiums are highest rather than where a smelter happens to sit. Concentrate supply relationships across multiple continents provide optionality that pure secondary operators lack entirely.
GLENCORE

Risk: Primary route slow decline

Secondary production supplies 62% of refined output and that share continues rising, which slowly erodes the relevance of primary smelting capacity and the concentrate supply feeding it. Lead is also a minor line within a very large diversified portfolio, competing for capital against commodities with considerably better growth narratives attached to them.
ECOBAT

Moat: Scrap collection network reach

Collection infrastructure spanning North America and Europe, built around retailer take-back, distributor relationships and haulage economics, secures feedstock in a business where feedstock access is the whole competitive question. That network took decades to assemble and cannot be replicated by capital alone, because it depends on relationships with thousands of collection points.
ECOBAT

Risk: Single metal demand concentration

The business depends almost entirely on lead acid battery demand, which is exposed to low-voltage architecture change over the forecast period with no obvious hedge available. Diversification into lithium recycling is underway across the industry but the economics are unproven and the collection infrastructure required differs considerably from what exists today.

Players Tracked

Prominent Players

Glencore
Korea Zinc
Ecobat
Nyrstar
Hindustan Zinc

Other Key Players

Boliden
Doe Run Company
Teck Resources
Yunnan Chihong Zinc and Germanium
Henan Yuguang Gold and Lead
Zijin Mining Group
China Minmetals
Aurubis
Umicore
Clarios
Exide Industries
Amara Raja Energy and Mobility
East Penn Manufacturing
Gravita India
Campine

Recent Developments

MARCH 2025

Secondary smelting capacity retired under emissions enforcement

Further secondary lead smelting capacity was permanently closed across several Chinese and Indian producing regions under tightened emissions and soil contamination enforcement during the year, transferring collection volumes and regional pricing power directly to compliant operators able to meet the revised standards within their own collection radius.
Signal: Every enforcement round transfers feedstoc
JULY 2025

Battery manufacturer qualifies additional alloy supplier

A major battery manufacturer qualified an additional lead-calcium alloy supplier specifically for absorbent glass mat grid production, following an extended programme of composition tolerance testing, in order to reduce single-source dependency across a battery product line growing considerably faster than its conventional flooded battery designs.
Signal: Alloy qualification takes long enough that
OCTOBER 2025

Collection network expansion announced across regional markets

A secondary lead producer announced an expansion of its battery collection network through additional retailer take-back agreements and independent distributor arrangements, targeting long-term feedstock security across regions where competitor closures under emissions enforcement had left substantial collection volumes available to whoever could economically haul them away.
Signal: Collection reach is where this industry's

What Sits Inside Refined Lead Cost

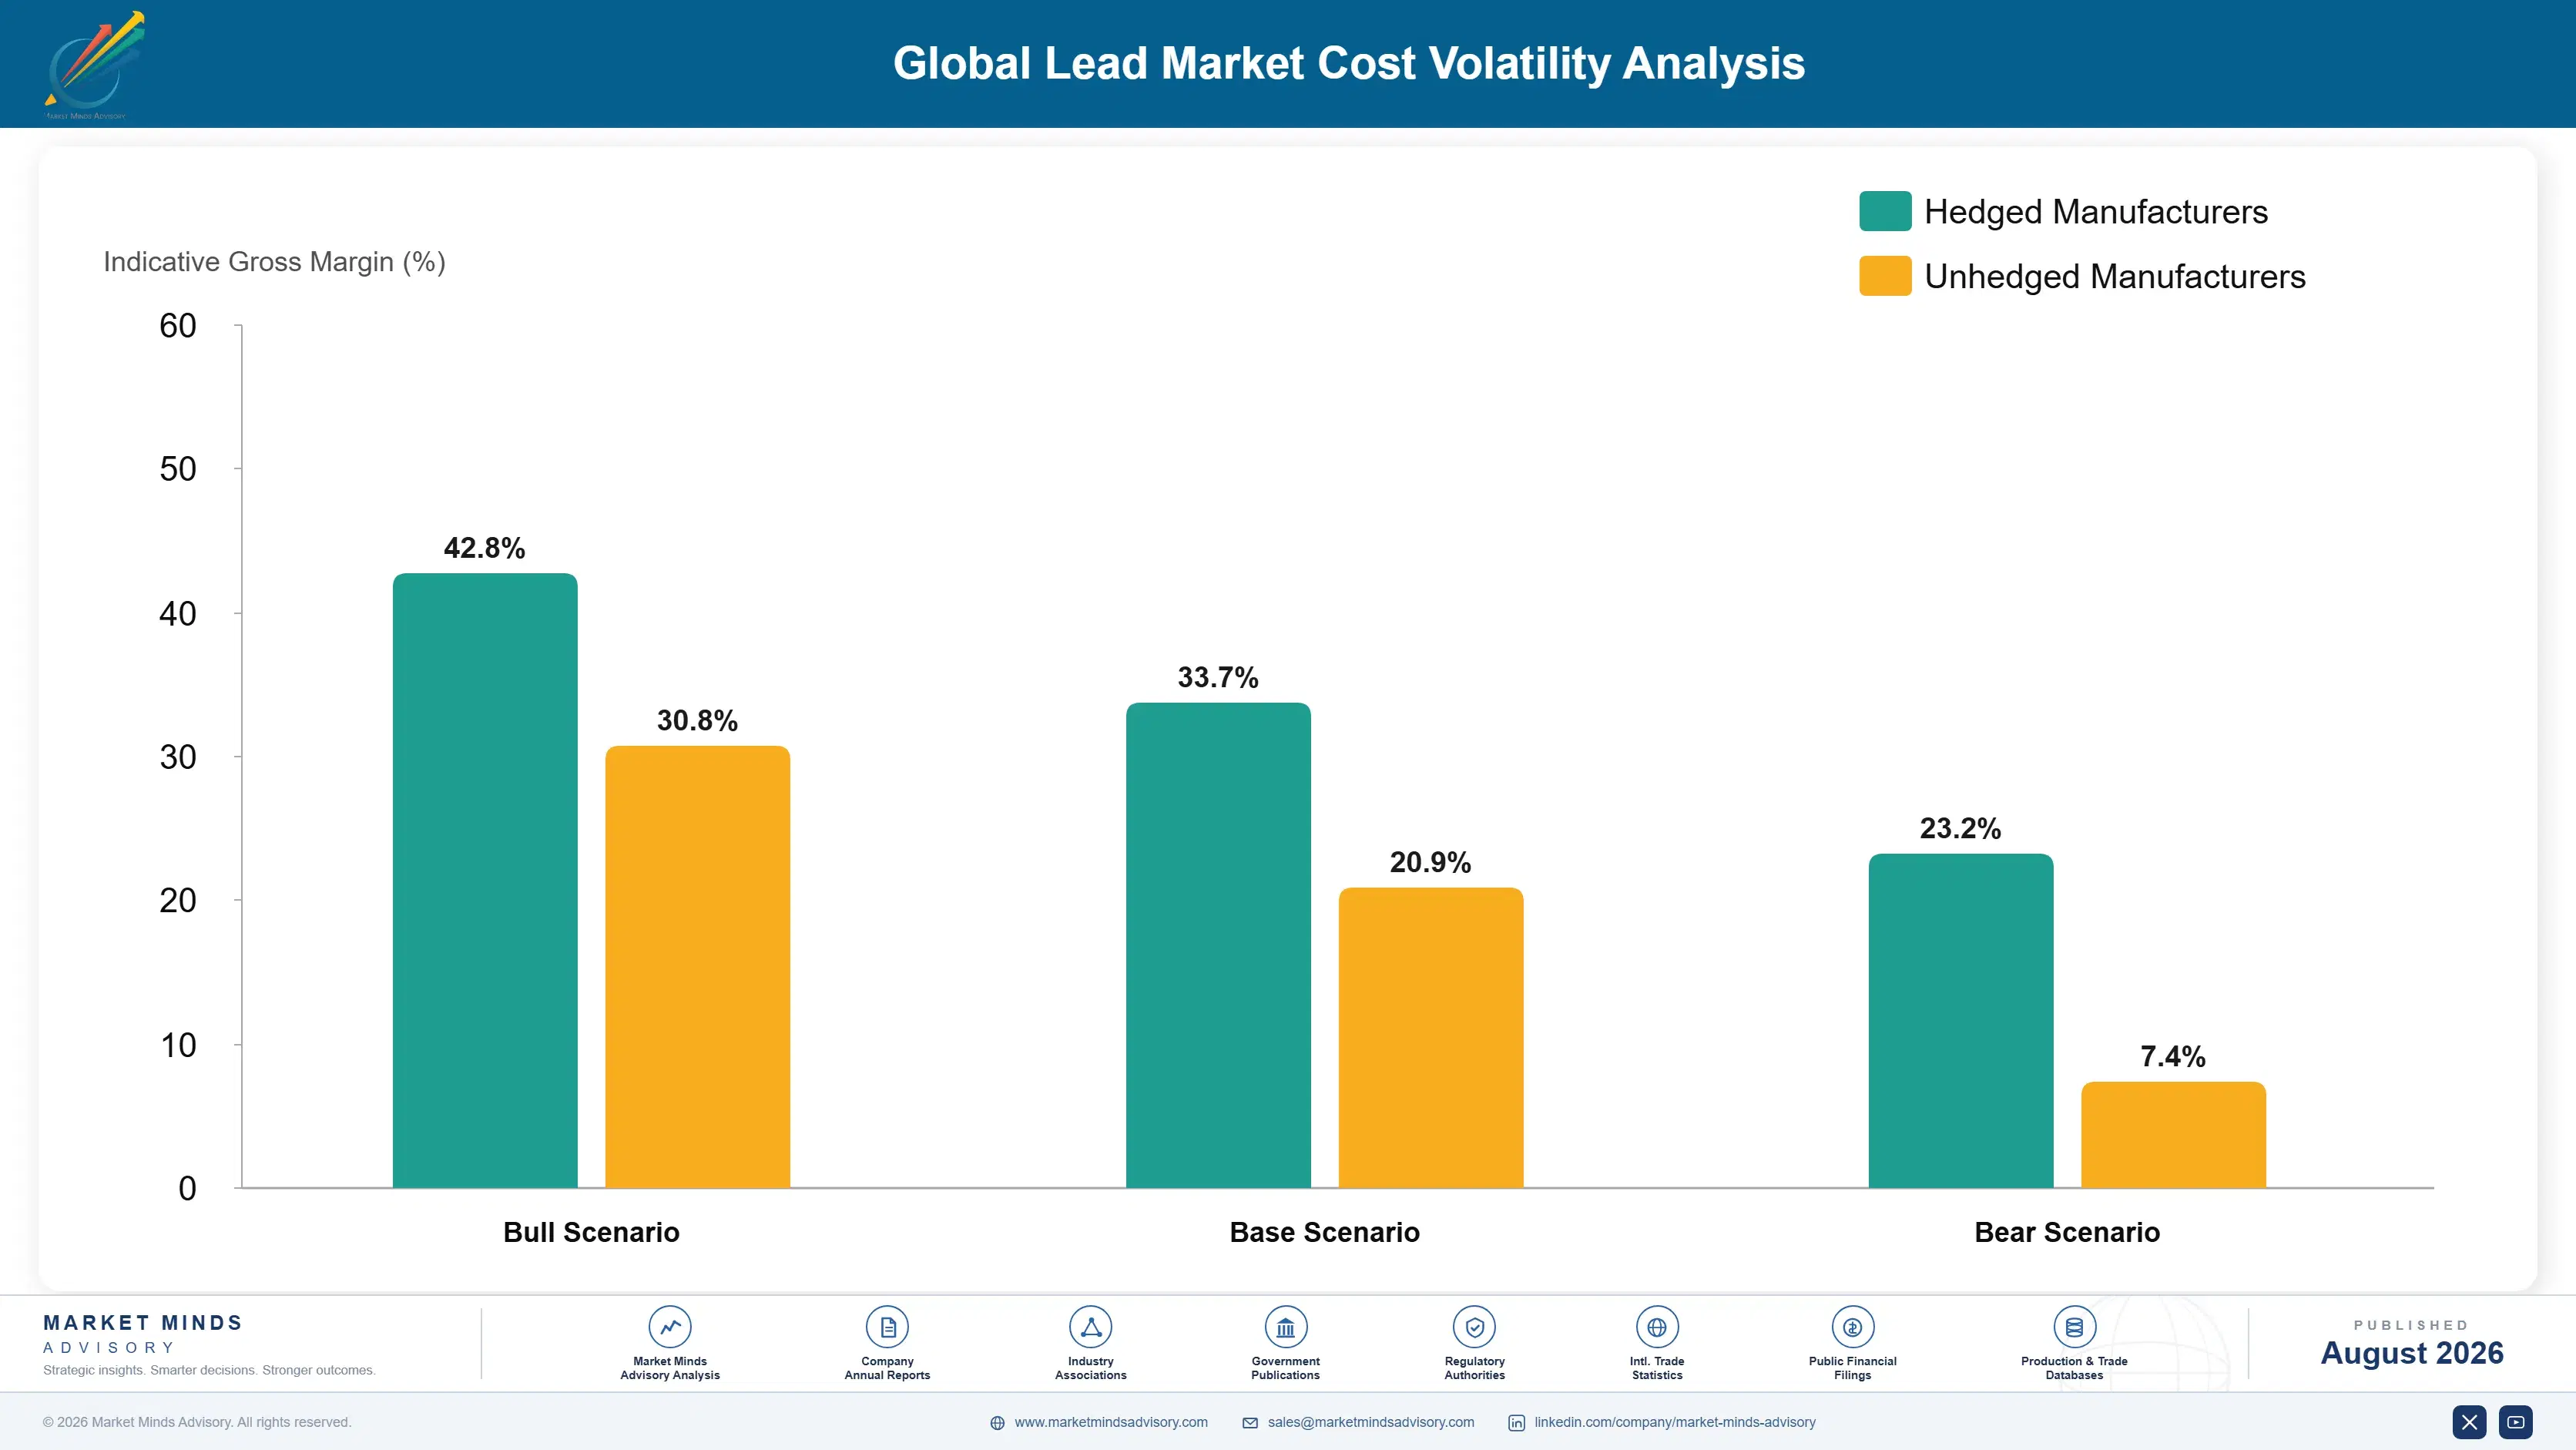
Scrap battery feedstock accounts for roughly 68% of secondary refined lead cost, purchased regionally within economic haulage radius and priced against the exchange metal it will become. Energy for smelting and refining contributes about 18%, principally natural gas and electricity. Fluxes, reagents and consumables add around 6%, and emissions control operating cost a further 5%, which keeps rising as standards tighten.
Energy costs moved violently through 2021 and 2022. European industrial gas and electricity prices reached levels the IEA documented as unprecedented for the sector, and Chinese provincial power rationing during late 2021 constrained smelting output across several producing regions simultaneously. Boliden Annual Report 2022 recorded elevated energy costs across its smelting operations for the period, and several European secondary operations ran below capacity or suspended production entirely.

The competitive disadvantage mechanism runs through energy price and compliance capital rather than through scrap purchasing skill. Smelting is energy intensive, so an operator paying European industrial power rates carries a permanent handicap against one buying Chinese, Indian or North American energy. Compliance investment compounds it, since older plants need more capital to meet the same standard. Small operators with ageing furnaces and high tariffs carry both exposures at once.
global-lead-market-trends-cost-volatility-analysis-1787310304352

Invest in furnace energy efficiency and heat recovery

Modern furnace design, oxygen enrichment and waste heat recovery cut energy consumption per tonne substantially against older installations, which matters permanently rather than only during a price spike. The capital payback lengthens when energy is cheap and shortens dramatically when it is not, and operators who invested during quiet periods were the ones still running through 2022.

Contract energy on multi-year indexed or hedged terms

Energy at 18% of conversion cost is large enough that spot exposure decides profitability in a volatile year, and small operators frequently buy on default tariffs without ever examining alternatives. Multi-year contracting and hedging are available and underused across the secondary sector, mostly because energy procurement sits below the threshold that attracts management attention.

Stage compliance capital ahead of regulatory deadlines

Investing before a standard binds costs considerably less than investing under enforcement pressure, when equipment lead times stretch and every competitor is buying the same abatement systems simultaneously. Early investment also positions the operator to absorb feedstock released when a less prepared competitor closes, which is where the genuine return on that capital actually sits.

Portfolio Architecture for Margin Defence

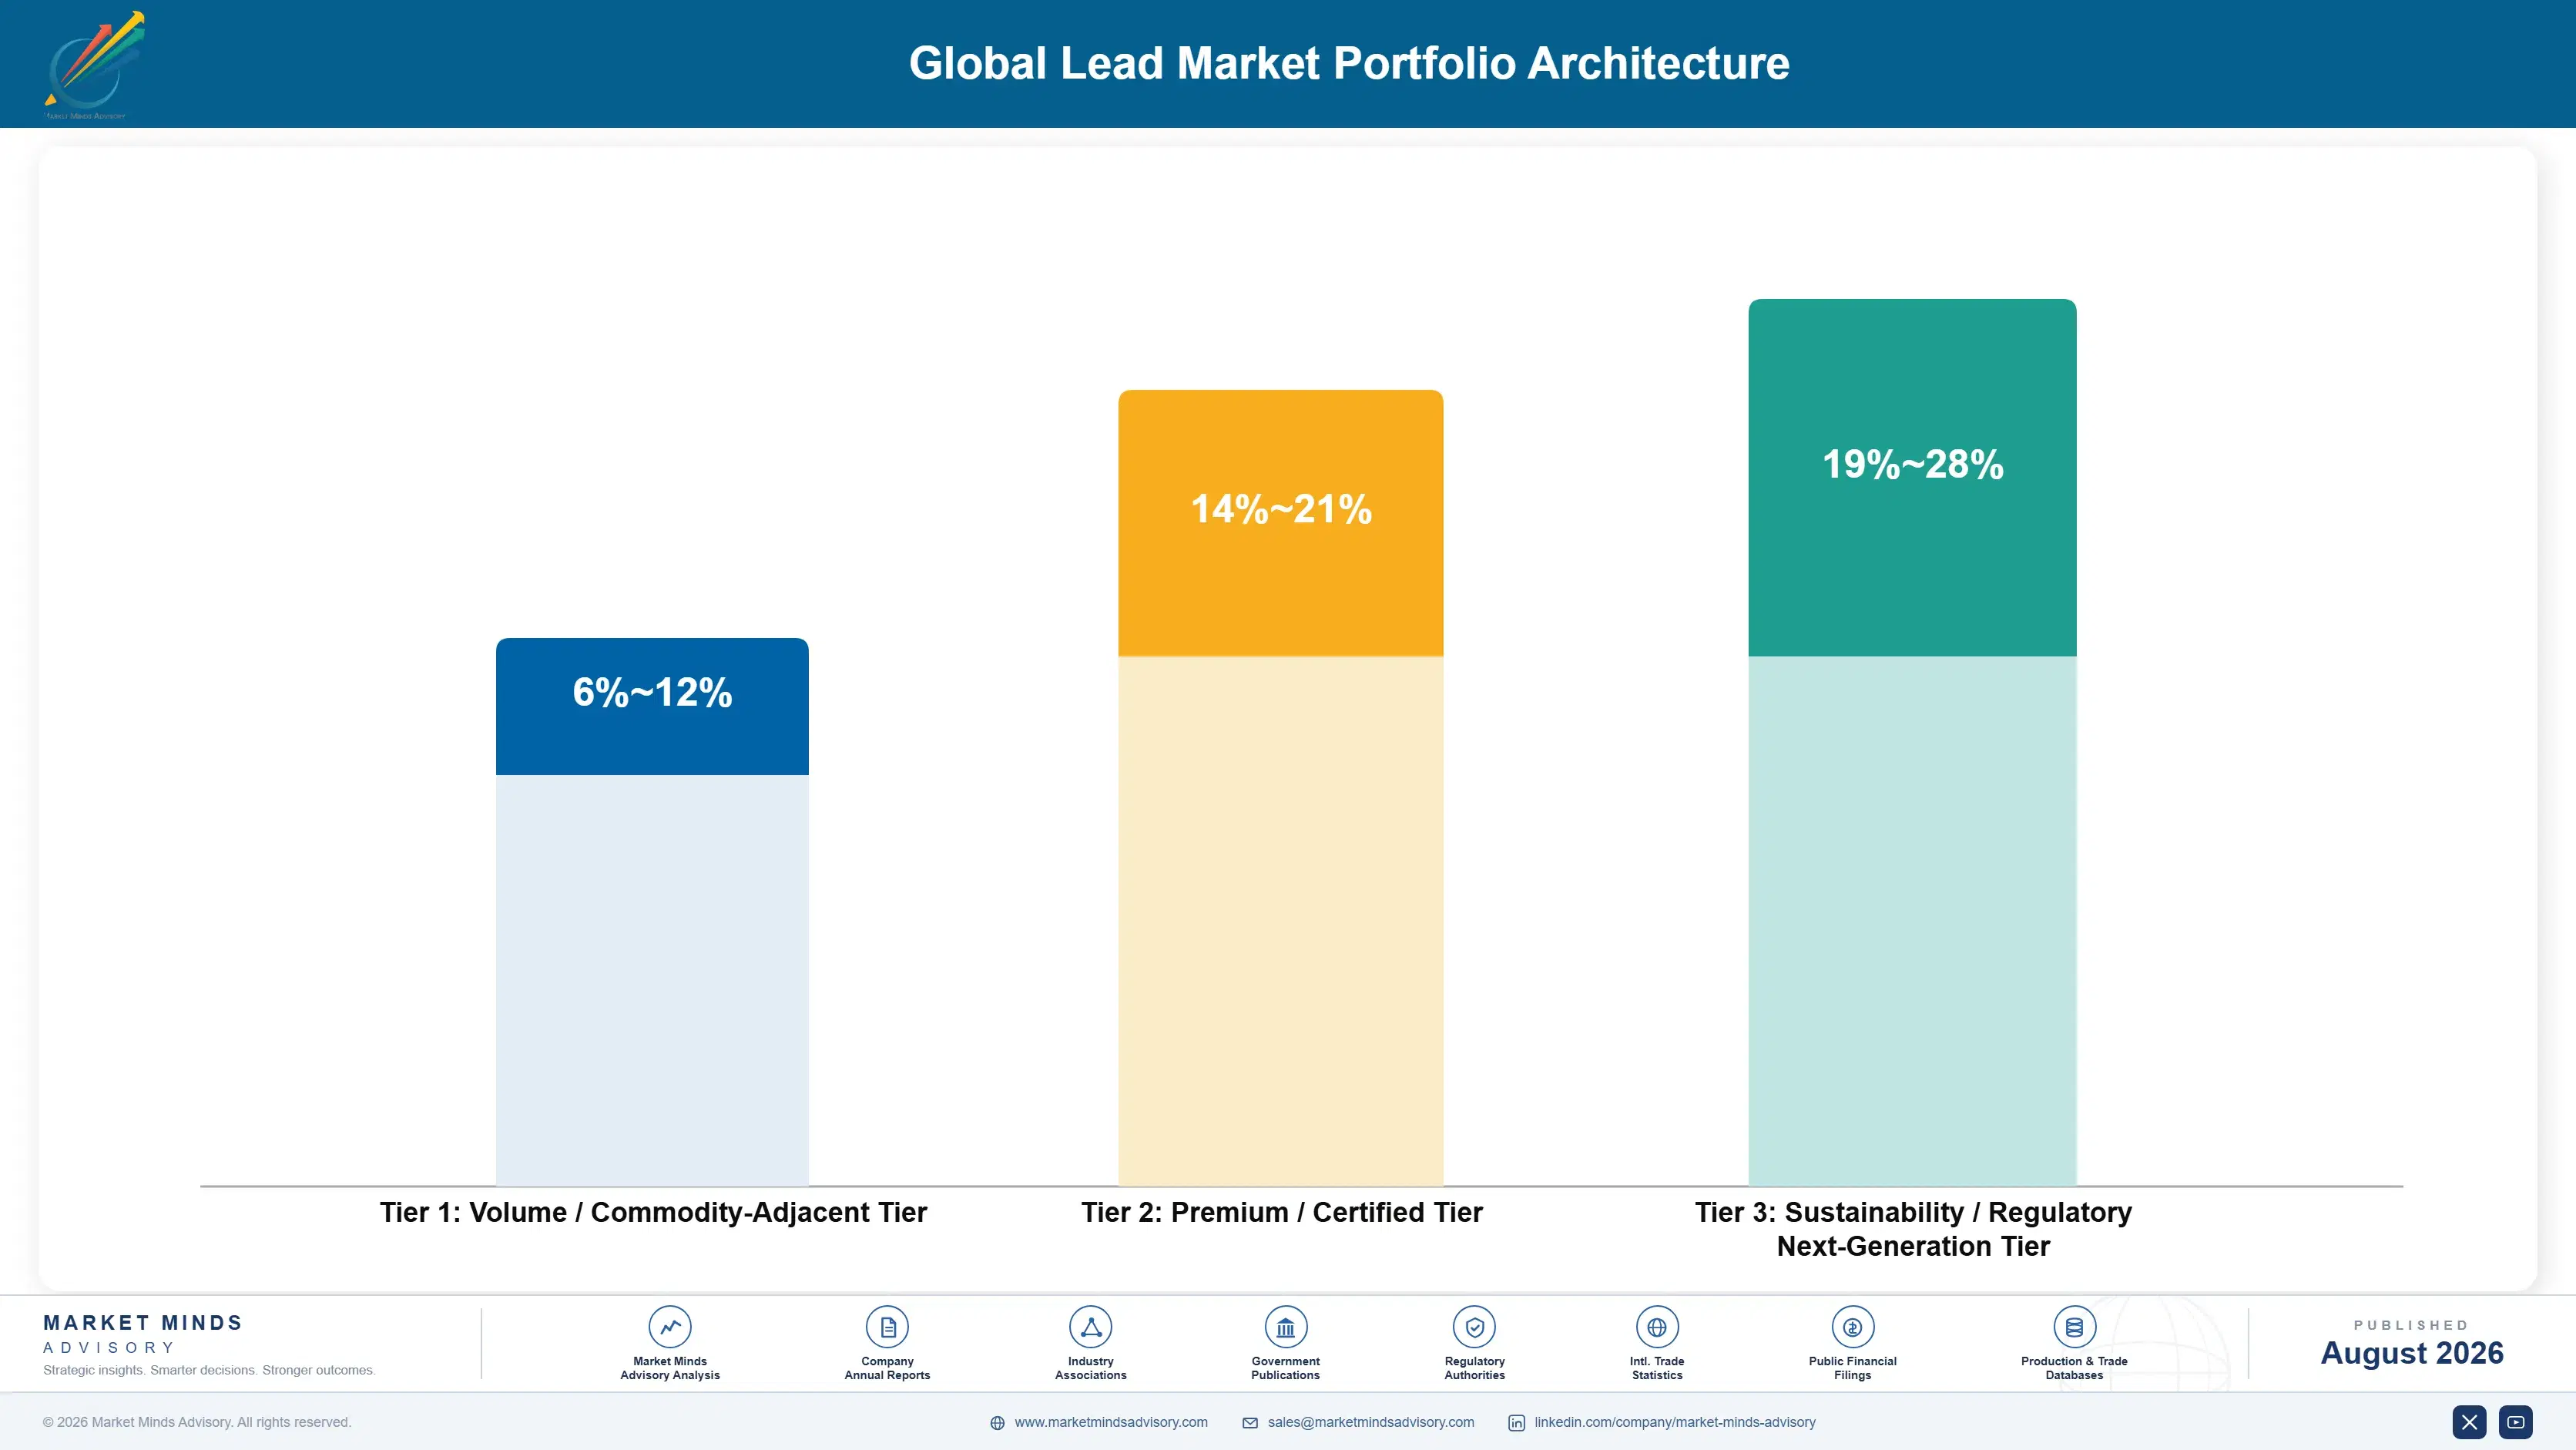
Margin architecture in lead separates by how far a product sits from exchange pricing. Refined ingot earns the exchange price plus a regional premium that the market sets and no producer influences, which leaves conversion cost as the entire competitive question. Value rises with specification content and customer proximity rather than with tonnage, which is a difficult adjustment for an industry that measured itself in tonnes for a century.
The volume versus premium tension is sharper than the metal's commodity reputation suggests. Refined ingot carries the tonnage that justifies smelter scale and collection networks, at margins that a soft price period removes entirely. Specification alloys and battery oxides earn considerably better on smaller volumes tied to particular customers. Producers chasing tonnage alone fund a compliance-heavy asset base from margins that exchange pricing will not reliably support.

High-value pools concentrate in three places. Lead-calcium and lead-tin alloys command premiums for composition tolerance that battery manufacturers qualify carefully and rarely resource. Battery oxides earn on proximity, since the material travels poorly and customers need it nearby. And recovered antimony, tin and polypropylene add value that costs relatively little to capture.

Volume / Commodity-Adjacent Tier

Refined lead ingot sold at exchange price plus regional premium into open market and trading channels, where conversion cost and scrap purchase terms determine whether the tonnage earns anything at all.
Gross Margin: 6-12%

Premium / Certified Tier

Lead-calcium, lead-tin and antimonial alloys supplied to qualified battery manufacturers against tight composition tolerances. Metallurgical control and qualification status defend pricing. The seven-point range reflects standard against high-specification grid alloy work.
Gross Margin: 14-21%

Sustainability / Regulatory / Next-Generation Tier

Battery paste oxides supplied close to customer plants, plus recovered antimony, tin and polymer by-product streams. Proximity and recovery capability defend margin here. The nine-point range reflects oxide supply against full by-product recovery economics.
Gross Margin: 19-28%
global-lead-market-trends-portfolio-architecture-1787310304866

High-value Sub-segments and Strategic Watch-out

Lead-calcium and lead-tin grid alloys

High value and high growth together, because absorbent glass mat construction requires composition tolerances that battery manufacturers qualify carefully and change reluctantly once established. Start-stop duty uses roughly 22% more lead per unit, which supports volume growth alongside the specification premium these alloys already command.
Gross Margin: 14-21%

Battery paste oxide supply near plants

Strong realised value on steady growth, protected by the simple fact that battery oxide travels poorly and expensively, so whichever supplier sits nearest a battery plant holds a position that distant competitors are unable to contest economically whatever production cost advantage they might otherwise hold elsewhere.
Gross Margin: 19-28%

Refined ingot merchant tonnage

The volume core, justifying smelter scale and collection network investment while earning nothing beyond exchange price and a regional premium that nobody controls. Necessary for asset utilisation, but a soft price period removes the margin entirely, and no amount of commercial effort prevents that happening.
Gross Margin: 6-12%

By-product antimony, tin and polymer recovery

The strategic watch-out here, because full recovery adds roughly USD 45 per tonne of battery scrap processed against typical secondary conversion margins, where that is genuinely material money. Most secondary operators still under-recover these streams simply because the primary metal stream dominates management attention almost entirely.
Gross Margin: 22-34%

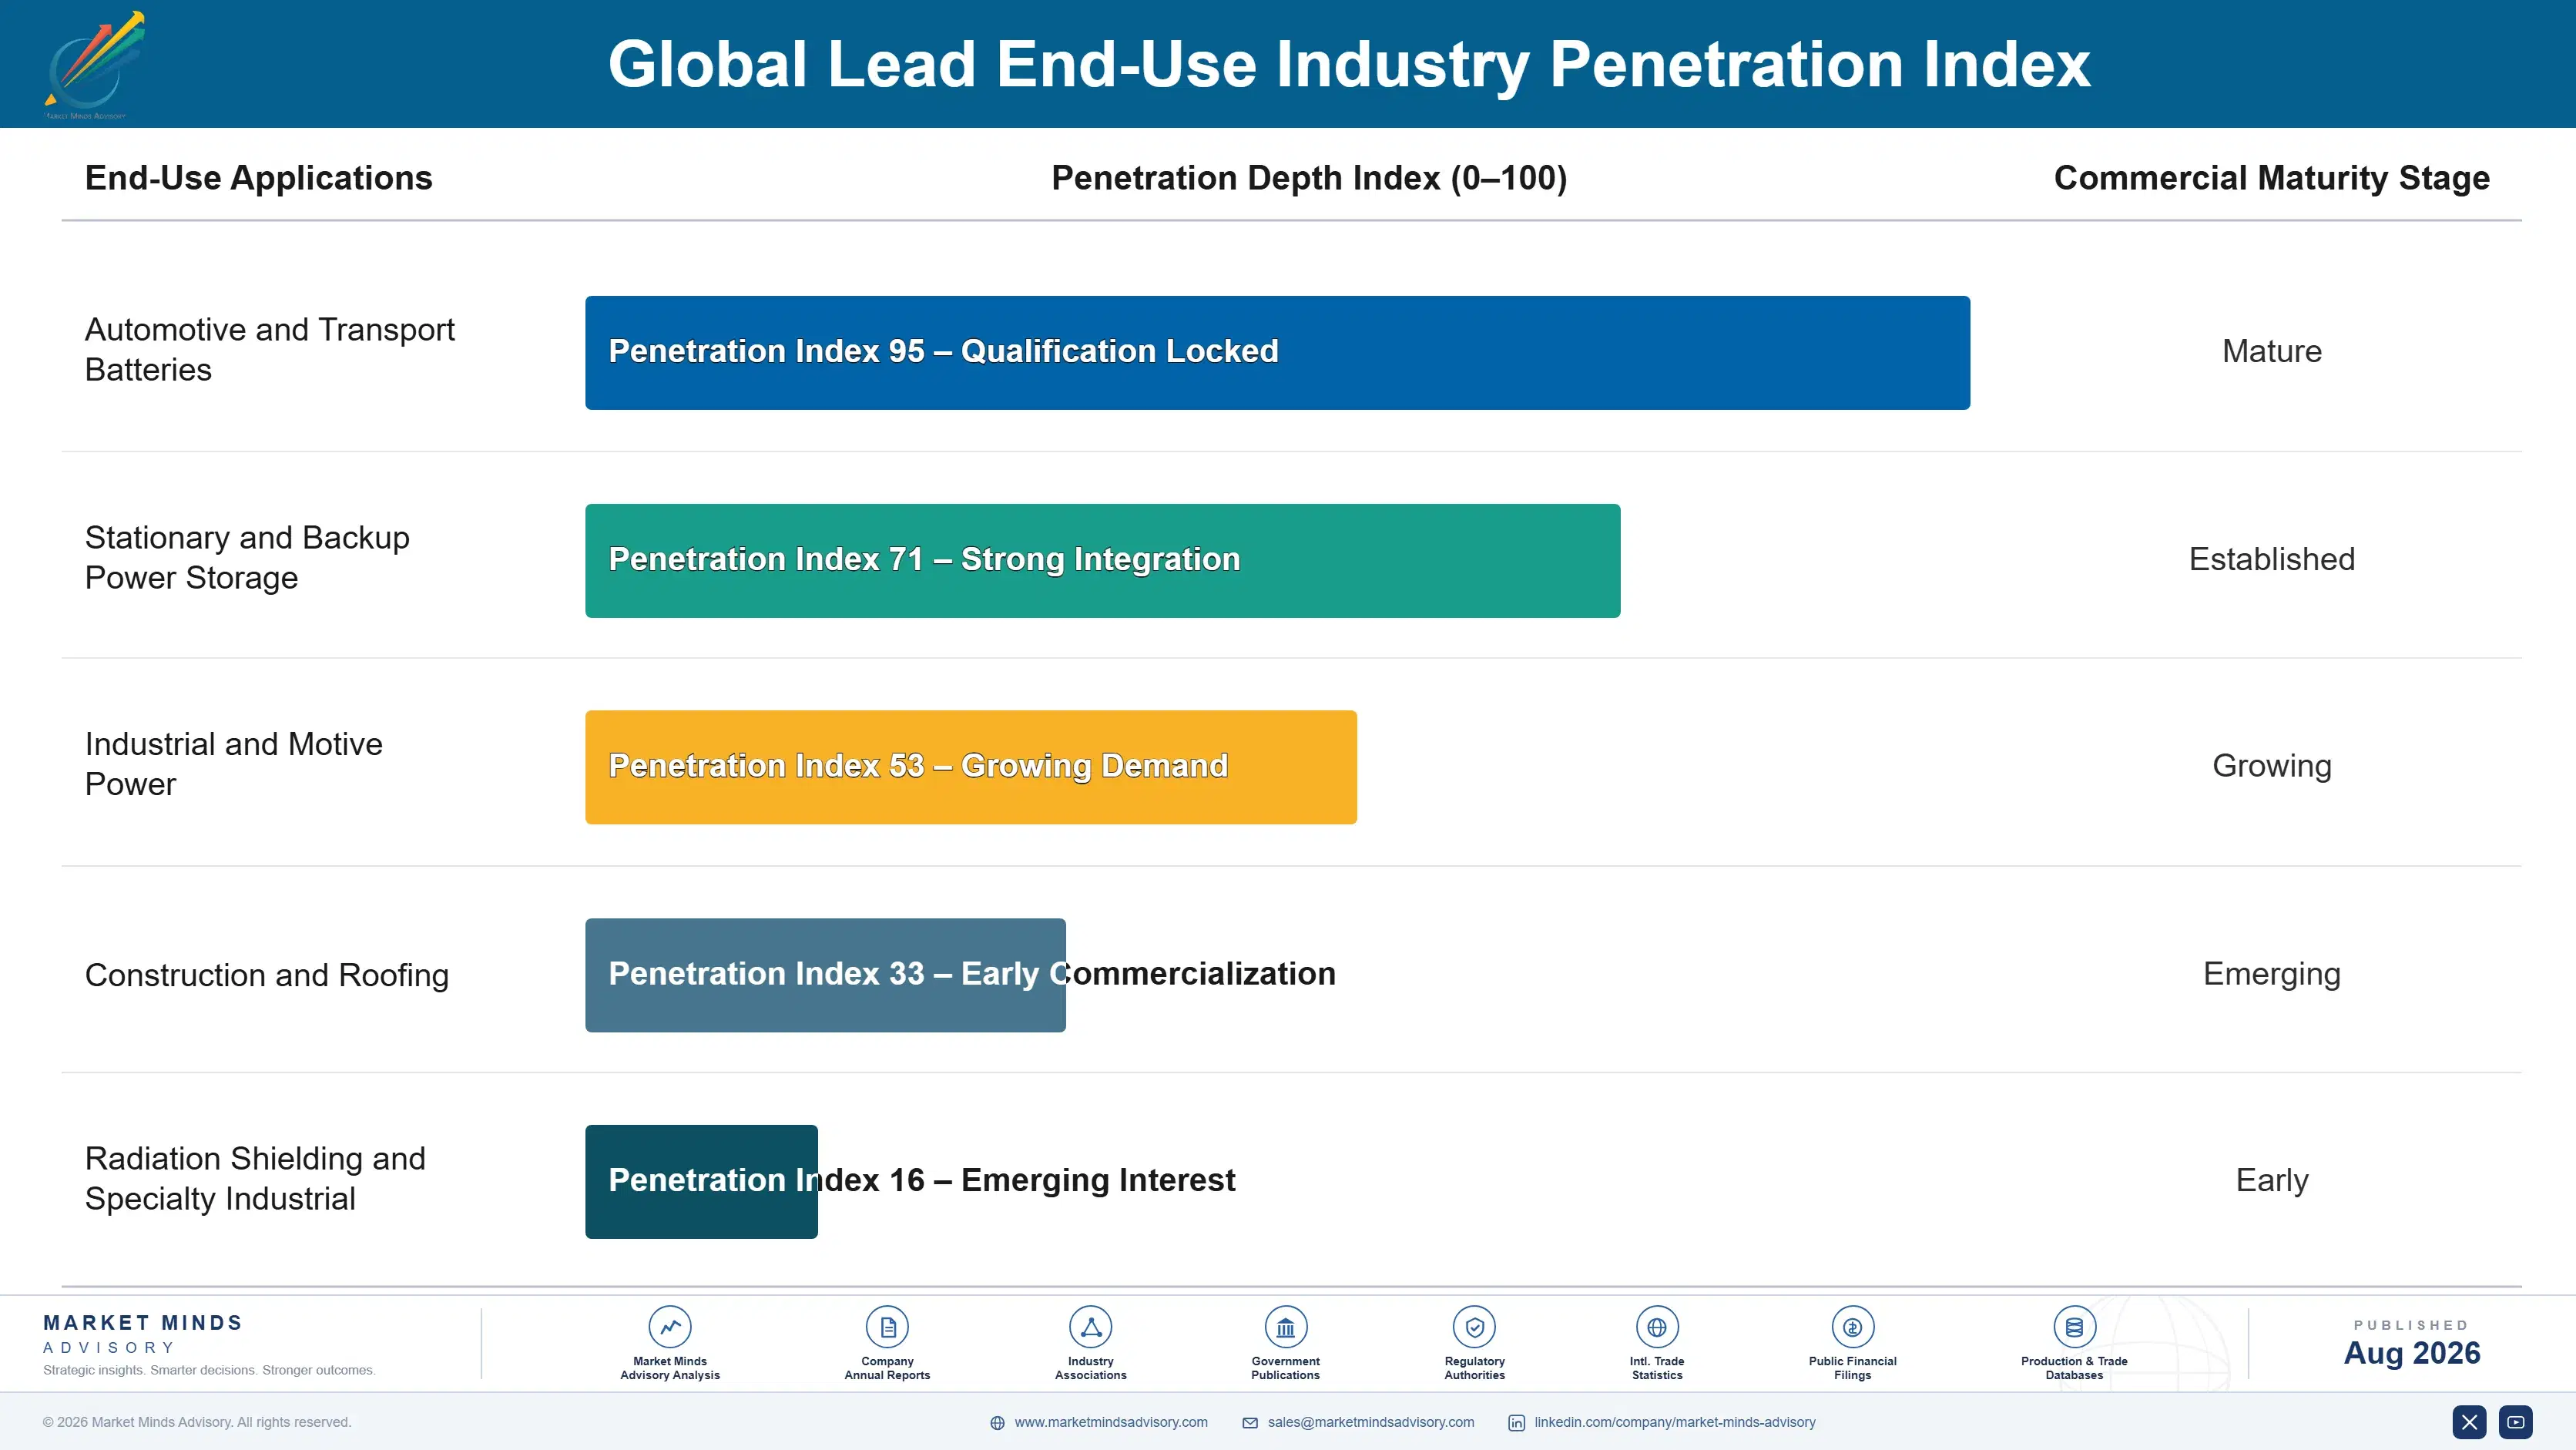
How Lead Demand Behaves

Lead demand is installed-base annuity revenue in an unusually pure form. Batteries fail within four to six years and get replaced regardless of economic conditions, vehicle sales or fuel prices, so consumption tracks the vehicle parc rather than the vehicle market. That makes this among the most forecastable base metals over any horizon short enough that the parc composition does not change materially, and among the least forecastable beyond it.
Stickiness varies considerably by product. Refined ingot is the loosest, traded against exchange price where any qualified producer can supply and switching costs nothing. Specification alloys are considerably tighter, because battery manufacturers qualify composition tolerances and requalification takes months. Battery oxide is stickiest of all, tied to geography rather than relationship, since transporting oxide any real distance is uneconomic and a customer's alternatives are limited to whoever else is nearby.

The buyer profile has consolidated substantially. A decade ago refined lead was sold to a wide range of battery manufacturers, compound producers and industrial users. Today battery manufacturing has concentrated into fewer, larger groups purchasing centrally, which shifts negotiating power toward buyers and makes qualified alloy positions considerably more valuable than merchant relationships.
global-lead-market-trends-end-use-penetration-index-1787310305363

Where We Land On This

These are among the four positions where our research anticipates prominent divergence between winners and laggards over the coming forecast period. Each is grounded in the demand model, the regulatory perimeter, and the announced capacity pipeline.
01 / SCRAP COLLECTION OWNERSHIP

Own the collection network rather than buying feed

Scrap battery pricing tracks refined metal closely enough that a smelter buying on the open market captures nothing from a rising price and absorbs the full squeeze on a falling one. Producers owning collection networks and retailer take-back arrangements secure feed at roughly 12% below open market terms and secure it at all when collection tightens regionally. Most secondary smelters still treat feedstock as a purchasing function reporting into procurement rather than as the actual core of the business they are running.
02 / SPECIFICATION ALLOY MIGRATION

Shift tonnage from ingot into specification alloys

Refined ingot earns the exchange price and a regional premium that no producer influences, which leaves conversion cost as the only competitive lever available in a soft market. Lead-calcium and lead-tin alloys realise roughly 9% above exchange-linked ingot pricing on identical tonnage, and they create qualified customer positions that survive price cycles intact rather than being retendered each year. The metallurgical control required amounts to process discipline rather than any exotic capability, which makes the industry's collective reluctance considerably harder to explain.
03 / COMPLIANCE CAPITAL TIMING

Invest ahead of emissions standards, not under enforcement

Environmental enforcement has retired roughly 1.4 million tonnes of secondary capacity across a decade, and every closure transferred collection volume and pricing power to compliant operators in the same haulage radius. Operators investing ahead of tightening standards typically gain roughly 15% additional feed volume when a competitor exits, while those investing under enforcement pressure pay more and gain nothing at all. Finance functions almost never classify compliance capital as growth investment, and in this particular industry it plainly is exactly that.
04 / AUXILIARY BATTERY EXPOSURE

Model low-voltage architecture, not powertrain electrification

Forecasts that treat electric vehicles as the threat to lead demand misread the mechanism entirely, since every electric vehicle carries an auxiliary battery working harder than a conventional starter ever did. The genuine exposure is low-voltage lithium architecture, already specified on roughly 9% of new electric platforms, arriving through packaging and weight decisions rather than powertrain ones. Producers should be tracking twelve-volt system design roadmaps platform by platform rather than staring at powertrain mix forecasts that answer a different question.

Engagement Snapshot From the Field

A live engagement with an industry participant carrying material or product regulatory and market exposure ahead of a defining policy shift, showing how our research translates into a defensible multi-year portfolio strategy.
MARKET MINDS ADVISORY · CLIENT ENGAGEMENT SUMMARY
Global Lead Producer Strategic Portfolio Review and Transition Roadmap 2026·Investment Scenario on Global Lead Exposure Evaluation 2025-26
CLIENT PROFILE
A secondary lead producer operating four smelting and refining sites across Europe and North America, supplying refined ingot into merchant channels alongside a smaller alloy and oxide business serving regional battery manufacturers. Annual refined output approached 340,000 tonnes and revenue near USD 690 million (client-reported, unverified by MMA), with roughly four fifths of tonnage sold as exchange-priced ingot.
STRATEGIC CHALLENGE
Margins had deteriorated for three consecutive years and management attributed it to metal price weakness, responding with cost reduction programmes at every site. Scrap feed had become harder to secure in two collection regions, which was being handled as a purchasing problem. A proposed furnace capacity investment assumed feedstock would be available to fill it.
MMA APPROACH
MMA interviewed forty-seven scrap collectors, battery manufacturers, distributors and regulators across six markets, reconstructing how collection volumes are actually allocated between competing smelters. We modelled conversion cost site by site including energy tariffs and compliance capital, benchmarked by-product recovery against industry practice, and mapped alloy qualification requirements at every regional battery producer.
KEY FINDINGS
  1. In both tightening collection regions a competitor had signed exclusive retailer take-back arrangements, and the client had never approached a single retailer group directly in either market.
  2. By-product recovery of antimony, tin and polypropylene ran well below industry practice at three of four sites, leaving value on the floor equal to a substantial share of the margin decline being investigated.
  3. Alloy and oxide business delivered materially better realised margins than ingot on identical tonnage (client-reported, unverified by MMA), yet represented under a fifth of output and had received no investment in five years.
  4. Two sites faced compliance capital requirements within four years that management had not scheduled, while both regional competitors had already completed equivalent investment programmes.
CLIENT PROFILE
A secondary lead producer operating four smelting and refining sites across Europe and North America, supplying refined ingot into merchant channels alongside a smaller alloy and oxide business serving regional battery manufacturers. Annual refined output approached 340,000 tonnes and revenue near USD 690 million (client-reported, unverified by MMA), with roughly four fifths of tonnage sold as exchange-priced ingot.
STRATEGIC CHALLENGE
Margins had deteriorated for three consecutive years and management attributed it to metal price weakness, responding with cost reduction programmes at every site. Scrap feed had become harder to secure in two collection regions, which was being handled as a purchasing problem. A proposed furnace capacity investment assumed feedstock would be available to fill it.
MMA APPROACH
MMA interviewed forty-seven scrap collectors, battery manufacturers, distributors and regulators across six markets, reconstructing how collection volumes are actually allocated between competing smelters. We modelled conversion cost site by site including energy tariffs and compliance capital, benchmarked by-product recovery against industry practice, and mapped alloy qualification requirements at every regional battery producer.
KEY FINDINGS
  1. In both tightening collection regions a competitor had signed exclusive retailer take-back arrangements, and the client had never approached a single retailer group directly in either market.
  2. By-product recovery of antimony, tin and polypropylene ran well below industry practice at three of four sites, leaving value on the floor equal to a substantial share of the margin decline being investigated.
  3. Alloy and oxide business delivered materially better realised margins than ingot on identical tonnage (client-reported, unverified by MMA), yet represented under a fifth of output and had received no investment in five years.
  4. Two sites faced compliance capital requirements within four years that management had not scheduled, while both regional competitors had already completed equivalent investment programmes.
RECOMMENDED STRATEGY
Phase 1: Phase 1 (0 to 9 months): Halt the furnace investment and build direct retailer and distributor collection arrangements in both constrained regions. Phase 2: Phase 2 (9 to 24 months): Upgrade by-product recovery at the three underperforming sites and pursue alloy qualification at regional battery manufacturers. Phase 3: Phase 3 (24 to 42 months): Schedule compliance capital ahead of deadlines, and shift the sales mix deliberately away from merchant ingot.
OUTCOME
The client deferred roughly USD 55 million of furnace investment (client-reported, unverified by MMA) and redirected part of it into collection arrangements and by-product recovery. Feed volumes recovered in both constrained regions within eighteen months, two alloy qualifications were secured with regional battery manufacturers, and compliance capital was scheduled ahead of the binding deadlines at both exposed sites.

Frequently Asked Questions

Foundational context covering the market sizes, CAGR, scope, country, region and competition that inform every finding below. This section is provided to cover basics and most often pre-purchase conversations, answered from the MMA Primary Research Dataset.

What is the current size of the Global Lead Market?

The market reached USD 27.4 billion in 2025, measured as refined metal and lead product revenue at realised delivered price. Batteries absorb 86% of refined consumption across all regions.

How large will the Global Lead Market be by 2036?

MMA forecasts USD 40.44 billion by 2036, an expansion of 1.42 times the 2026 level. Incremental value across the forecast period reaches USD 12.05 billion.

What is the CAGR for the Global Lead Market 2026 to 2036?

The base case compound annual growth rate is 3.6%, with a bull case of 4.8% and a bear case of 2.4%. Low-voltage architecture change and stationary storage demand separate those scenarios.

Which segment is growing fastest?

Lead-calcium and lead-tin alloys grow fastest at 5.4%, exactly 1.50 times the overall market rate. Absorbent glass mat and enhanced flooded battery construction require these grid alloys specifically.

Who are the major companies in the Global Lead Market?

Glencore, Korea Zinc, Ecobat, Nyrstar and Hindustan Zinc lead, holding 27% of refined tonnage between them. Scrap collection reach rather than mining position explains most competitive standing.

Which country is growing fastest?

India grows fastest at 5.8%, where vehicle parc expansion, two-wheeler batteries and telecom backup demand pull refined lead simultaneously. Formalisation of informal recycling adds measured growth as well.

Report Segmentation Architecture

The full report scope spans multiple orthogonal segmentation dimensions, with cross-tabulated demand data provided for each dimension pair. Coverage extends further to regional breakdowns, trend trajectories, and the competitive detail needed to support segment-level decision-making.

By Lead Product Form

  • Lead-Calcium and Lead-Tin Alloys
  • Lead Oxides and Chemical Compounds
  • Refined Lead Ingot
  • Lead-Antimony Alloys
  • Rolled Sheet and Extruded Products

By End-Use Industry

  • Automotive and Transport Batteries
  • Stationary and Backup Power Storage
  • Industrial and Motive Power
  • Construction and Roofing
  • Radiation Shielding and Specialty Industrial

By Customer Type and Channel

  • Battery Manufacturers
  • Alloy and Compound Converters
  • Metal Traders and Merchants
  • Industrial and Construction Distributors
  • Exchange and Warehouse Delivery

By Region

  • North America
  • Western Europe
  • East Asia
  • South Asia and Pacific
  • Latin America
  • Middle East and Africa
  • Eastern Europe

Scope, Methodology, and Coverage

Every figure in this report is reproducible from documented input assumptions. The scope below maps the historical period, the forecast horizon, the segmentation dimensions, and the countries covered, alongside the underlying primary and qualitative methodology.
Historical Period
2020 to 2025
Forecast Period
2026 to 2036
Base Year
2025 (USD billions; MMA Primary Research Dataset, August 2026)
Market Definition
The market comprises refined lead metal and lead-bearing products, spanning lead-calcium and lead-tin alloys, lead oxides and chemical compounds, refined ingot, lead-antimony alloys, and rolled sheet and extruded products, produced through both primary concentrate smelting and secondary recycling of scrap. Sizing captures refined metal and product revenue at realised delivered price across automotive, stationary storage, industrial, construction and specialty applications globally. Lead ore and concentrate traded before refining, spent battery scrap sold as feedstock, finished lead acid batteries, assembled radiation shielding products and ammunition manufacture fall outside scope.
Quantitative Units
USD billions (current prices); refined lead tonnes produced annually; USD per tonne at realised delivered price
Segmentation Dimensions
By Lead Product Form; By End-Use Industry; By Customer Type and Channel; By Region
Regions Covered
North America, Western Europe, East Asia, South Asia and Pacific, Latin America, Middle East and Africa, Eastern Europe
Countries Covered
USA, Canada, Mexico, UK, Germany, France, Italy, Spain, Netherlands, Belgium, Sweden, Poland, Czech Republic, Bulgaria, Turkey, China, Japan, South Korea, Taiwan, India, Vietnam, Thailand, Indonesia, Australia, Brazil, Peru, Chile, Saudi Arabia, UAE, Morocco, South Africa, and additional markets relevant to this sector
Key Companies Profiled
Glencore, Korea Zinc, Ecobat, Nyrstar, Hindustan Zinc, Boliden, Doe Run Company, Teck Resources, Yunnan Chihong Zinc and Germanium, Henan Yuguang Gold and Lead, Zijin Mining Group, China Minmetals, Aurubis, Umicore, Clarios, Exide Industries, Amara Raja Energy and Mobility, East Penn Manufacturing, Gravita India, Campine.
Quantitative Methodology
Primary survey, n=3,800 respondents, Q4 2025, six countries; demand-side model with trade association cross-validation
Qualitative Methodology
47 expert interviews, Q4 2025; applied to validate demand model assumptions, identify emerging dynamics, and assess competitive positioning
Report Format
PDF and XLSX data workbook (Word format preview document)
Publisher
Market Minds Advisory
Report Code
MMA-2026-CHM-417
Published
August 2026
Contact
sales@marketmindsadvisory.com | www.marketmindsadvisory.com

Purchase the full Global Lead Market Report (2026 to 2036).

The full report sizes the global lead market across five product forms, five end-use industries, five customer channels and seven regions, with annual forecasts to 2036 in revenue and refined tonnes produced. It models conversion cost site by site including energy tariffs, compliance capital and by-product recovery, which is the analysis that establishes which secondary operators survive a soft price period. Twenty participants are assessed on a consistent refined tonnage basis covering primary and secondary output together, with scrap collection reach mapped separately from smelting capacity. Low-voltage auxiliary battery architecture roadmaps are tracked across major vehicle platforms.
Five lead product forms sized and forecast annually
Conversion cost modelled site by site including compliance capital
Twenty participants on consistent refined tonnage produced basis
Scrap collection reach mapped separately from smelting capacity
By-product recovery economics benchmarked across secondary operators
Low-voltage auxiliary architecture roadmaps tracked by platform

Built For The People Who Decide

From boardroom strategy to bench-side execution, this report is read cover-to-cover by leaders shaping the next decade of their industry, turning demand scenarios, market dynamics and valuation benchmarks into decisions.
CXOs/ Presidents/ VPs/ Managers
M&A and Corporate Development
Strategy Teams and R&D Heads
Procurement and Product Directors
Regulatory and Compliance Leaders
Investor Relations and Equity Analysts