Market Minds Advisory
Kyanite Market

Kyanite Market: Refractory Volume, Electrical-Grade Margin

India and South Africa hold most reserves, refractory and ceramic demand keeps volumes flat in mature markets, and electrical-grade insulator buyers now pay a widening premium for the low-iron, high-alumina material China's steel slowdown ignores.

Lead Analyst

Bilal Shaikh

Published

September 2026

Make Smarter Decisions with Customized Research Insights

Request a free sample report and evaluate market opportunities, growth trends, and competitive dynamics relevant to your business needs.

2025 MARKET VALUE$1.1BMarket Size 2025
2036 FORECAST VALUE$1.7BBase Case , 2026 to 2036
CAGR 2026 TO 20364.3 %Bull 5.5% / Bear 3.2%
INCREMENTAL OPPORTUNITY$0.6BNet 10- year value creation
EXPANSION MULTIPLE1.52x2036 value over 2026 base
Strategic Levers
M&A Pipeline
Regional Outlook
Country Rankings
Competitive Intelligence
Segmental Deep-dive
Call-Us : 91 93563 13602

Executive Snapshot and Market Trajectory

Refractory buyers are not chasing kyanite for cost anymore; they are chasing supply security. India curbed raw ore exports in 2023, South African andalusite output keeps sliding on grid outages, and steelmakers who once single-sourced now qualify second and third suppliers before signing annual contracts.
Electrical and electronic insulators are the fastest-growing application at 6.1% CAGR, nearly one and a half times the market average, as EV inverter housings and 5G base-station ceramics demand the low-dielectric-loss purity ordinary refractory-grade kyanite cannot supply. Geographic concentration is severe: India and the United States together mine most of the world's usable ore, while China dominates downstream calcination and mullite conversion capacity, leaving little room for a third entrant to build scale quickly.
Ownership is fragmented rather than cartelized; the five largest producers hold under half of global capacity, and none controls enough reserves to set price unilaterally. Regulatory pressure is building on two fronts, Indian export licensing and South African mining-right renewals, while calciners everywhere face rising natural gas costs. Buyers increasingly specify beneficiated, low-iron concentrate over crude lump, pushing margin toward processors who can hit tighter chemistry tolerances consistently.
Market Definition
The kyanite market covers the mining, beneficiation, and calcination of kyanite-group aluminosilicate minerals, kyanite, andalusite, and sillimanite, sold as crude ore, beneficiated concentrate, or calcined and mullite-converted grades for refractory, ceramic, abrasive, foundry, and electrical insulator use. It excludes downstream finished refractory brick, ceramic ware, and insulator manufacturing, which are separate markets that merely consume this mineral input.
Base Year Value
$1.1B in 2025 (MMA Primary Research Dataset, August 2026)
Forecast Period
2026 to 2036, eleven discrete annual values
CAGR
4.3% base case. Bull 5.5%. Bear 3.2%.
Fastest Growth Segment
Electrical and Electronic Insulators: 6.1% CAGR
Fastest Growth Country
India: 7.4% CAGR
Fastest Growth Region
South Asia and Pacific: 6.3% CAGR
Largest Region
East Asia: 28% of 2025 global value
Market Leaders
Kyanite Mining Corporation, IREL (India) Limited, Thelo DMS, Imerys, Sinosteel Corporation. Source: MMA Analysis based on company annual reports.
Primary Survey
n=3,800 procurement and R&D decision-makers, Q4 2025, six countries
Methodology
Demand-side build-up, cross-validated against public data, 47 expert interviews

Kyanite Market Forecast Scenarios

global-kyanite-market-trends-size-forecast-scenario-1787552939172
Kyanite demand grew steadily but unspectacularly across 2020 to 2025, expanding at a 3.7% historical CAGR as steel and glass furnace relining cycles provided a dependable base while pandemic-era construction delays briefly softened ceramic offtake in 2021. Refractory consumption recovered by 2022, and Indian export curbs introduced in 2023 tightened available concentrate just as calciners in China and Europe were rebuilding furnace-lining inventory.
The base case carries the market to a 4.3% CAGR through three mechanisms. First, steel capacity additions across India and Southeast Asia keep basic refractory relining volumes rising even as Western mills shrink. Second, EV inverter housings and 5G base-station ceramics pull calcined, low-iron kyanite into a higher-value electrical insulator channel. Third, South and Southeast Asian tile and sanitaryware makers substitute kyanite-based mullite for costlier synthetic alumina as construction broadens beyond metro markets.
The bull case reaches 5.5% if China formally restricts sillimanite and kyanite blending the way it has restricted other refractory minerals, forcing buyers toward higher-priced Indian and South African concentrate. The bear case falls to 3.2% if a prolonged Chinese steel downturn cuts refractory demand faster than insulator growth offsets it, leaving calciners with underused capacity and thinner margins.

The Refractory-to-Insulator Value Migration

Kyanite sits at the intersection of two industries moving in opposite directions. Global steel capacity keeps expanding in India, Vietnam, and Indonesia, sustaining basic refractory demand, while advanced ceramics and power electronics pull the same mineral toward tighter chemistry specifications entirely. Both trends draw on the same finite reserve base, concentrated overwhelmingly in India, the United States, and southern Africa, which keeps sourcing risk permanently on procurement agendas.
MARKET CONCENTRATIONCR5: 47%Top five miners hold under half of global capacity
AVERAGE SELLING PRICE$310/tonneCalcined concentrate commands a steady premium over crude ore
TOP PRODUCER SHAREIndia: 38%India supplies more than a third of global output
CAPACITY UTILISATION71%Calciners run below optimal rates amid soft export demand
EXPORT TRADE INTENSITY44%Nearly half of mined tonnage crosses a national border
RESERVE LIFE INDEX27 yearsProven reserves cover roughly three decades at current extraction
Commercially, this is a relationship-driven market, not a spot-traded commodity. Refractory producers sign multi-year offtake agreements tied to furnace relining schedules, and switching suppliers mid-contract risks a chemistry mismatch that can shorten furnace campaign life. Electrical-grade buyers go further, qualifying individual mines and even individual ore bodies before approving a source, since dielectric performance varies with iron content that differs seam to seam.
Over the next decade, reserve depletion in legacy Indian deposits, tightening South African mining-right renewals, and rising calcination energy costs will matter more than headline demand growth. Producers who lock in beneficiation capacity and long-dated mining rights now will capture the widening spread between crude ore and qualified electrical-grade concentrate, while undercapitalised miners get squeezed toward commodity pricing.
"Everyone treats kyanite as a commodity because the price per tonne looks small. It isn't small once a furnace campaign fails because the chemistry drifted, and that's the number buyers are actually managing."
Director, Industrial Minerals and Refractories Practice · MMA Chemicals and Materials / Industrial Minerals Practice · August 2026

Market Trends

India's 2023 Raw Kyanite Export Licensing Tightens Global Supply

India's Directorate General of Foreign Trade tightened licensing on raw and lightly processed kyanite exports in 2023, requiring value-addition certification before shipment clears customs. The stated goal is to keep beneficiation and calcination jobs onshore rather than exporting crude ore for processing elsewhere. For overseas refractory and ceramics buyers, the practical effect has been longer lead times and a shift toward contracting directly with Indian calciners rather than ore traders. South African and American supply cannot fully absorb the volume Indian export curbs remove from the open market, so qualified buyers increasingly pre-book capacity a year ahead of need.
Market Impact: Locks in demand from 40 furnaces
EV and 5G Ceramics Demand Ultra-Low-Iron Kyanite Grades

Power electronics substrates and 5G base-station ceramics require calcined kyanite with iron oxide content below roughly 0.5%, far tighter than the 1.5% to 2% tolerance refractory-grade material carries. Only a handful of beneficiation plants, mainly in Georgia, USA and specific Indian operations, currently hit that specification consistently at commercial volume. Equipment makers, including inverter and insulator manufacturers, have begun signing multi-year supply agreements directly with these plants rather than buying through general refractory-mineral distributors, a lasting change in how the highest-value tonnage moves through the supply chain and who captures the resulting premium.
Market Impact: Segment grows 1.4 times faster

Market Opportunities and Growth Drivers

Global Steel Capacity Expansion Sustains Basic Refractory Offtake

World Steel Association data show crude steel capacity additions concentrated in India, Vietnam, and Indonesia adding tens of millions of tonnes of capacity through 2030, and every new or relined blast furnace needs kyanite-based mullite refractory in its working lining. India alone commissioned several large integrated steel expansions between 2023 and 2025, each requiring initial fit-out followed by relining every eighteen months to three years. Because refractory failure halts production, mills treat lining qualification as a safety decision rather than a pure cost one, which insulates basic kyanite demand from price competition affecting less critical inputs.
Market Impact: Raises beneficiation cost 8% to 12%

EV and Grid Infrastructure Insulator Demand Accelerates

The International Energy Agency projects electric vehicle sales and grid buildout will multiply demand for high-voltage ceramic insulators and inverter substrates several times over by 2035, and kyanite-derived mullite remains the preferred low-thermal-expansion filler because alternatives like fused silica cost substantially more at equivalent purity. Grid operators expanding transmission capacity for renewable generation and EV charging are simultaneously specifying longer-life ceramic insulator strings, competing with electronics makers for the same low-iron feedstock. That overlap is pulling the electrical-grade segment's growth rate well above the market average, and plants guaranteeing tight iron tolerance are booking capacity years ahead.
Market Impact: Cuts calciner margins 4 points

Market Restraints and Challenges

Reserve Depletion In Legacy Indian Deposits Raises Cost

Several of India's longest-producing kyanite deposits in Jharkhand and Odisha show declining ore grades as decades of selective mining removed the highest-quality seams first, a root cause that is geological rather than regulatory. The commercial impact shows up as rising beneficiation cost per tonne, since lower-grade feed needs additional flotation and magnetic separation to hit the iron specification buyers expect. Producers are responding by blending ore from multiple pits to stabilise grade, investing in finer separation equipment, and developing new Andhra Pradesh deposits identified through recent government surveys, though qualifying a new mine typically takes several years.
Market Impact: Cuts effective export volume 15%

Natural Gas Price Volatility Squeezes Calcination Margins

Calcining kyanite to mullite requires heating ore above 1,350 degrees Celsius for hours, making natural gas the dominant variable cost for processors in Europe and parts of Asia lacking captive power. The root cause is direct exposure to global gas benchmarks: European calciners paid multiples of pre-2021 prices through the 2022 energy crisis, and margins have not fully recovered because customers resisted matching cost pass-through. Some processors have shifted toward electric rotary kilns where grid power is cheap, while others are relocating capacity to India and the United States, where gas supply is contracted at fixed rates.
Market Impact: Adds 6% premium to electrical-grade tonnage
3 additional market trends, 3 additional growth drivers, and 3 additional restraints and challenges are covered in the full report. Contact sales@marketmindsadvisory.com to access the complete intelligence.

Segment CAGR and Growth Architecture

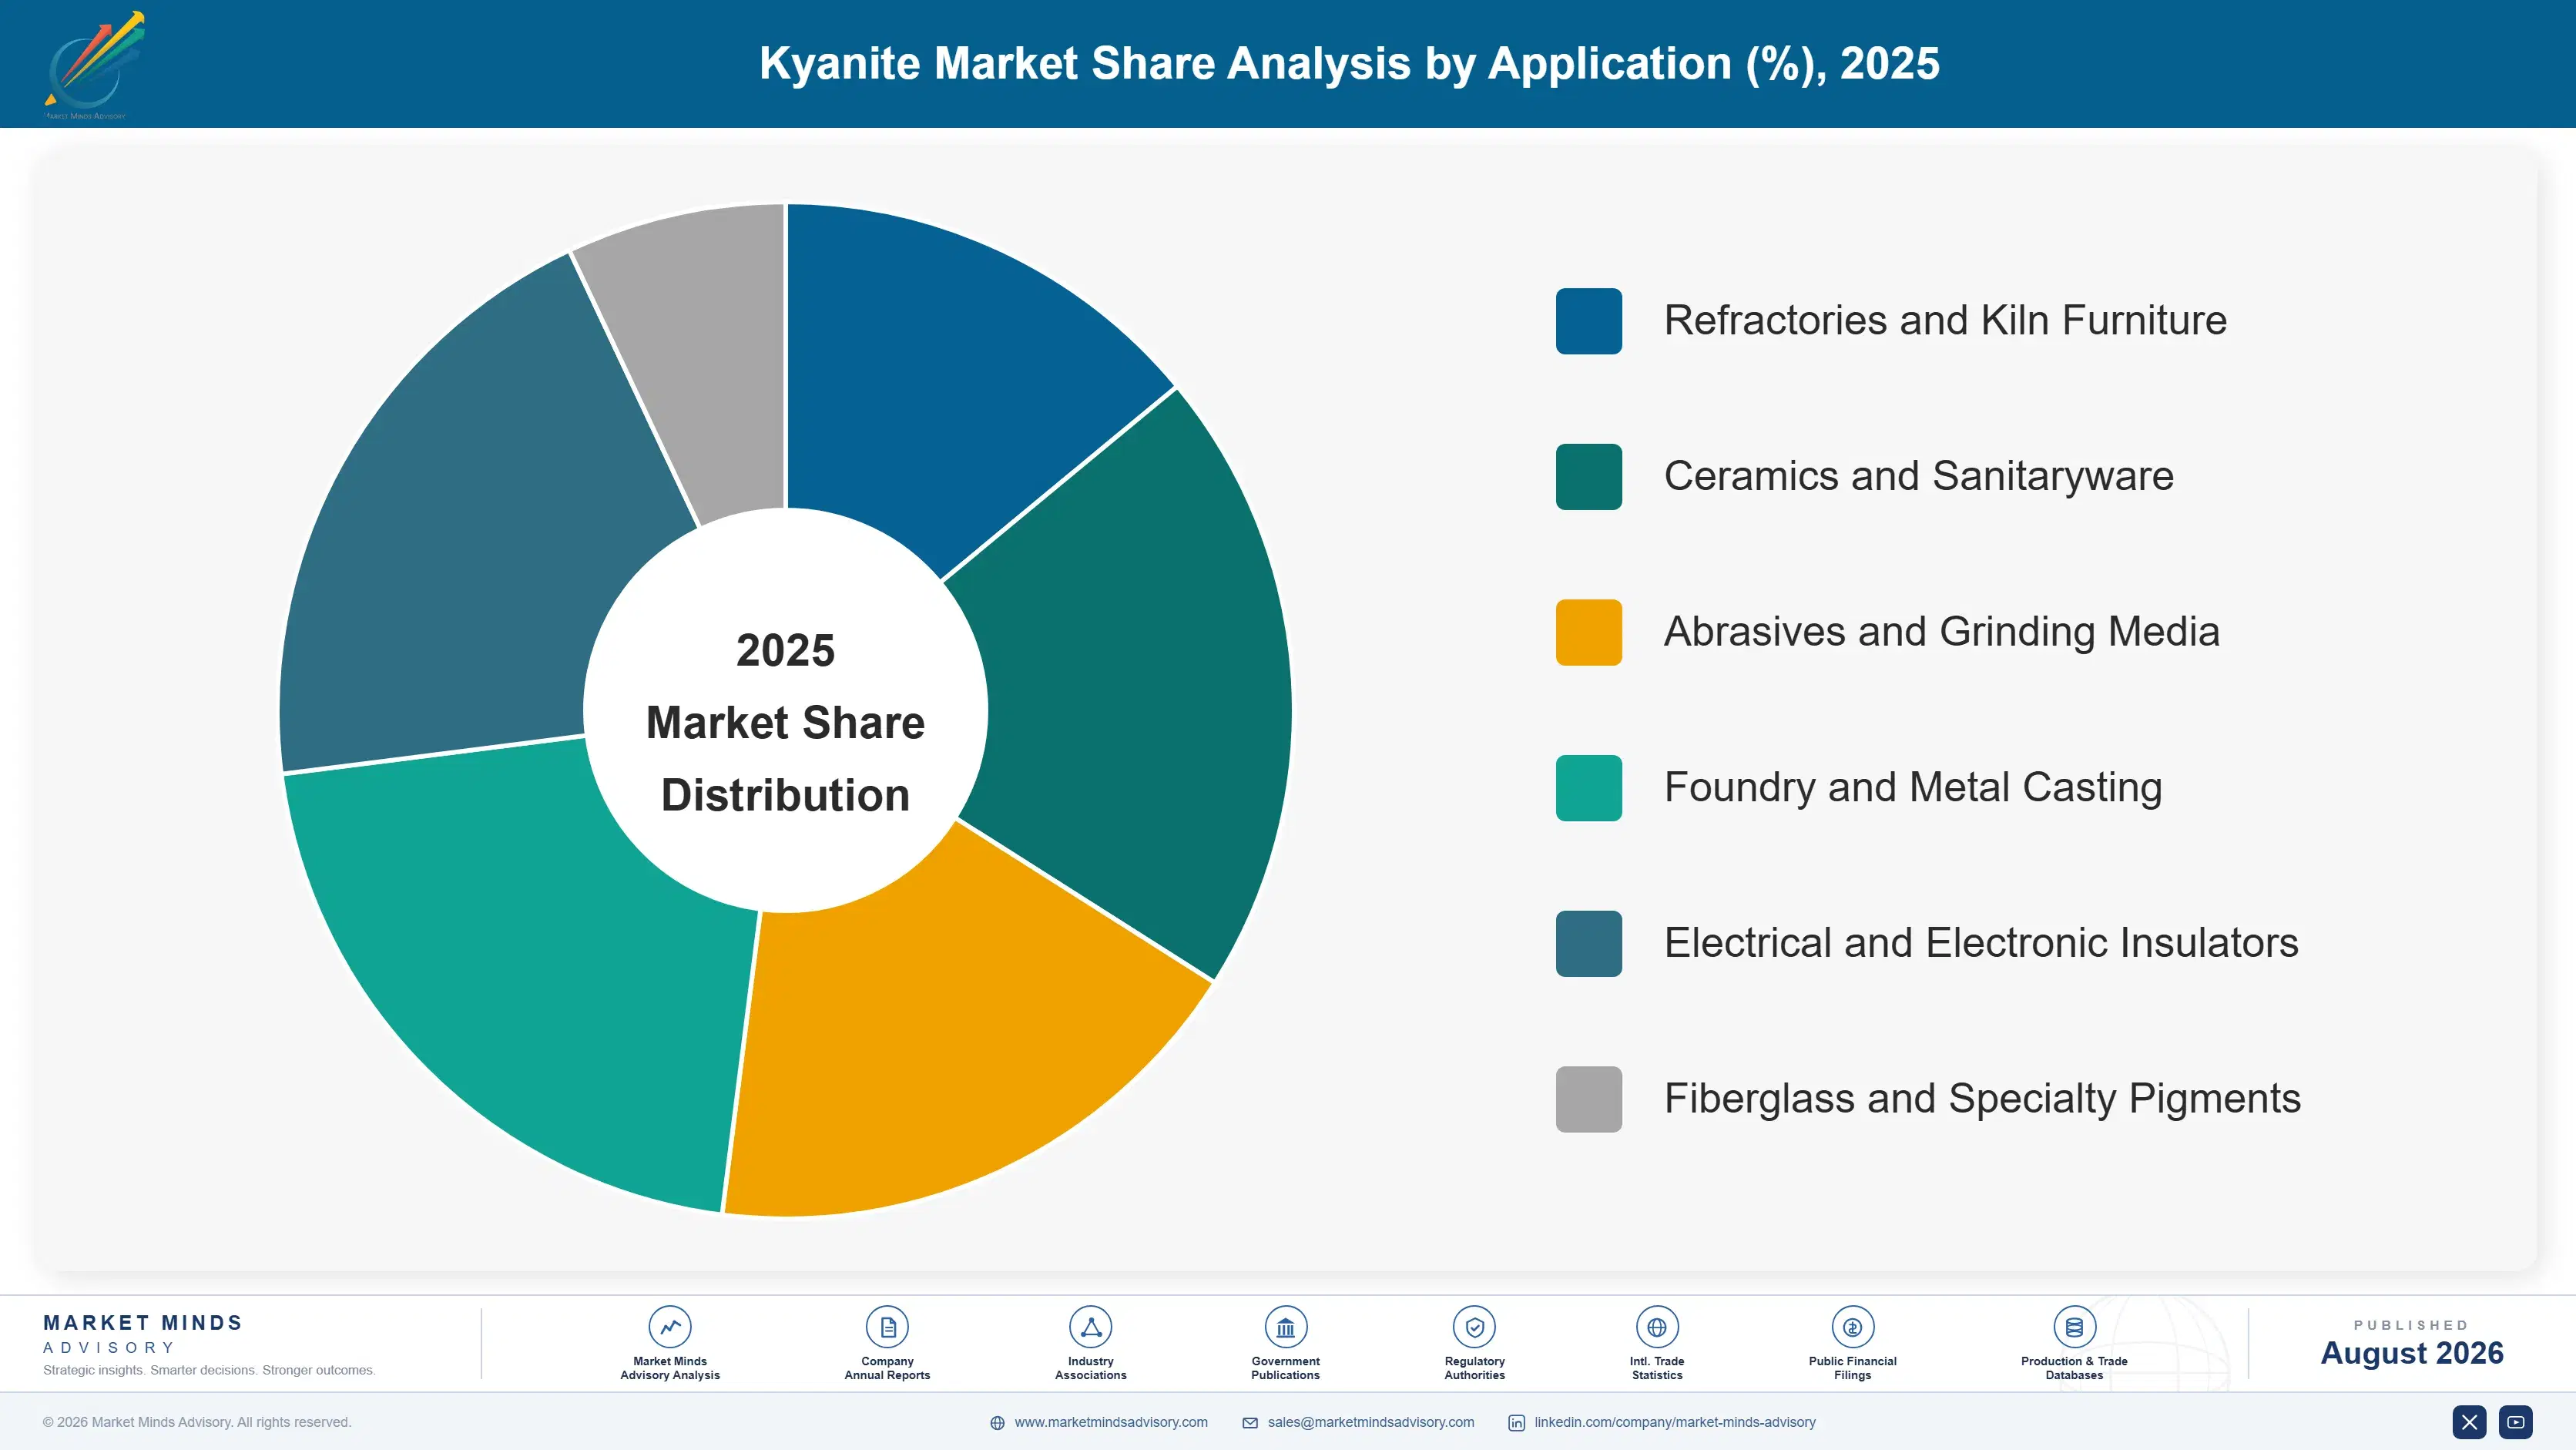
Segmentation follows end-use application, a single commercial logic tracking how buyers specify chemistry, particle size, and calcination grade. Refractories, ceramics, abrasives, foundry, electrical insulators, and a smaller fiberglass and pigments category each pull from the same ore body but demand distinct processing, so commercial position tracks application specification rather than mine of origin or crude versus calcined form.
global-kyanite-market-trends-market-share-analysis-1787552940530

Electrical and Electronic Insulators

Electrical and electronic insulators are the fastest-growing kyanite application at 6.1% CAGR, roughly 1.4 times the overall market rate, driven by power electronics substrates, EV inverter housings, and 5G base-station ceramics that require ultra-low iron mullite for stable dielectric performance at high frequency. Only calcined, tightly beneficiated concentrate meets this specification; ordinary refractory-grade material carries too much iron oxide and introduces unacceptable dielectric loss. Qualification cycles run twelve to eighteen months per supplier, since manufacturers test dielectric constant, thermal expansion, and mechanical strength before approving a source, and rarely re-tender given the cost of requalifying a component line. That stickiness is pulling processing capacity and pricing power toward the few plants capable of consistently hitting sub-0.5% iron specifications.
CAGR 6.1%

Fiberglass and Specialty Pigments

Fiberglass and specialty ceramic pigments form the second-fastest segment at 5.4% CAGR, using milled kyanite and mullite as a low-expansion filler in E-glass fiber formulations and as a base for high-temperature pigments used in architectural and automotive coatings. Growth tracks wind turbine blade production and construction-sector demand for fiberglass reinforcement, both of which have expanded steadily as composite materials displace metal in weight-sensitive applications. Unlike refractory-grade kyanite, this segment values consistent particle size distribution over raw alumina content, so processors invest differently in milling and classification equipment than those serving furnace-lining customers. Pricing sits between commodity refractory-grade and premium electrical-grade material, and the segment has proven resistant to substitution pressure that constrains growth in more mature ceramic applications.
CAGR 5.4%
Full segment breakdown across 6 segments available in the complete report.

Regional Architecture and Country Demand Map

East Asia leads at 28% of 2025 value on Chinese refractory and calcination capacity, followed by North American electrical-grade production. India and South Africa supply most raw ore, while South Asia and Pacific posts the fastest regional growth as steel and ceramics capacity expands beyond established Asian centers.

North America

North America's 26% share rests on downstream value rather than mine output alone. Kyanite Mining Corporation's Virginia operation remains one of the world's few vertically integrated kyanite-to-mullite producers, feeding both domestic refractory makers serving steel and glass furnaces and a growing electronics substrate channel tied to CHIPS Act-driven semiconductor fabrication investment. United States Geological Survey data show domestic kyanite output has held relatively steady even as end demand shifted toward higher-value calcined grades. Growth of 4.6% trails East Asia's raw volume expansion but reflects genuine mix improvement: American buyers increasingly specify premium electrical-grade concentrate for defense and aerospace ceramic components, a smaller but consistently higher-margin pool than basic refractory tonnage moving through the rest of the market.
Share: 26% | CAGR: 4.6% (2026 to 2036)

Western Europe

Western Europe underperforms the base rate by more than a point, expected given the region's shrinking basic steel capacity, yet it retains an outsized role in calcined and beneficiated mineral trade. Imerys, through its Damrec subsidiary, mines andalusite at Glomel in Brittany, France, supplying European and export refractory customers, while German and French ceramics and sanitaryware manufacturers remain steady premium-grade consumers. Rising natural gas costs following the 2022 energy crisis pushed several regional calciners to relocate processing capacity to North Africa and India rather than absorb European energy prices indefinitely. The 2.8% regional CAGR reflects that quiet capacity migration: demand persists, particularly in aerospace and automotive ceramics, but processing value increasingly happens outside the region of origin.
Share: 20% | CAGR: 2.8% (2026 to 2036)
Regional intelligence for 5 additional markets available in the complete report: East Asia, South Asia and Pacific, Latin America, Middle East and Africa, Eastern Europe. Contact sales@marketmindsadvisory.com.
global-kyanite-market-trends-country-cagr-analysis-1787552941807

Where Kyanite Processors Can Defend Margin

Margin in this market concentrates in processing, not mining. The framing below identifies four commercial moves that shift revenue toward beneficiation, qualification, and contract structures that basic ore sale cannot capture, each grounded in where buyers already pay a premium: verified chemistry, guaranteed lead time, electrical-grade qualification, and long-dated supply security that insulates both sides from spot volatility.

Build Electrical-Grade Qualification Capacity Ahead Of Demand

Electrical-grade qualification takes twelve to eighteen months per customer, and processors who invest in the flotation and magnetic separation equipment needed to consistently hit sub-0.5% iron content ahead of demand can capture buyers before competitors even begin qualification. Once qualified, electronics and insulator manufacturers rarely re-tender, given the cost of requalifying an entire component line against a new supplier and revalidating every downstream process step. That stickiness means early qualification converts into multi-year revenue, and the segment's 6.1% CAGR, roughly 1.4 times the market average, rewards whoever invests in separation capacity first.
Market Impact: Electrical-grade tonnage commands roughly a 30% price premium

Convert Ore Traders Into Direct Contract Customers

India's 2023 export licensing changes pushed many Southeast Asian and European buyers who previously purchased crude ore through independent traders to seek direct relationships with Indian calciners instead. Producers who move quickly to sign multi-year offtake agreements directly with end users capture the margin traders previously earned on intermediation, while also gaining demand visibility that supports capacity investment decisions across multiple planning cycles. This shift particularly benefits mid-sized calciners able to offer flexible contract volumes larger buyers want but that the largest five producers cannot always accommodate at full capacity.
Market Impact: Captures roughly 8% margin previously paid to traders

Price Long-Dated Supply Contracts Above Spot

Refractory buyers value supply certainty over the lowest possible spot price, because an unplanned furnace relining triggered by a missed shipment costs far more than any reasonable price premium on the mineral itself. Processors who offer three- to five-year contracts with fixed volume commitments and built-in price escalation tied to energy costs can charge 5% to 10% above spot pricing while locking in demand that justifies capacity investment well ahead of need. This works particularly well with steelmakers undergoing planned capacity expansion, since their relining schedule is known years in advance.
Market Impact: Long-dated contracts add a 5% to 10% premium

Monetize Processing Byproduct Streams And Tailings

Kyanite beneficiation generates byproduct streams, including mica, quartz sand, and iron oxide concentrate, that many processors currently treat as waste rather than saleable output. Mica byproduct finds ready buyers in paint, cosmetics, and drilling fluid applications, while cleaned quartz sand serves construction and glass markets at prices that, while modest per tonne, add up across processing volumes running into hundreds of thousands of tonnes annually across a typical mid-sized operation. Producers who invest in byproduct separation now report 6% to 9% of total site revenue coming from streams once treated purely as waste.
Market Impact: Byproduct sales add 6% to 9% of revenue

Who Controls the Margin Pool

Concentration is moderate: the top five producers hold an estimated 47% of global processing capacity, measured on beneficiated and calcined tonnage output, leaving a long tail of smaller regional miners and calciners to compete for the remainder of available volume. The gap between leader and challenger is real but not extreme.
Competitive activity currently runs along three lines. First, beneficiation quality: processors invest in flotation and magnetic separation to hit tighter iron specifications demanded by electrical-grade buyers. Second, supply security: after India's 2023 export licensing changes, buyers favor producers who guarantee volume through direct contracts rather than ore traders. Third, geographic diversification: several producers are qualifying secondary deposits outside their historical home base to reduce single-region exposure.

Pressure is building from downstream demand shifting faster than mining capacity can respond. Electronics and insulator manufacturers pay materially more for guaranteed electrical-grade supply, and processors slow to invest in separation capacity risk ceding that channel to more aggressive competitors. Meanwhile, South African grid instability and Indian export policy both introduce supply-side volatility that rewards diversified sourcing over concentrated operations. Rankings are likely to shift toward whichever five producers move fastest on electrical-grade qualification.
global-kyanite-market-trends-company-positioning-matrix-1787552943355

Competitive Moat and Risk Dimensions

KYANITE MINING CORPORATION

Moat: Only US Vertically Integrated Producer

Kyanite Mining Corporation operates the only significant vertically integrated kyanite mine-to-mullite operation in the United States, giving it a domestic supply position that CHIPS Act-linked semiconductor and defense electronics buyers value highly given rising interest in supply chain reshoring. Decades of operating history at its Virginia site also give it geological and processing knowledge competitors cannot easily replicate quickly.
KYANITE MINING CORPORATION

Risk: Single-Site Reserve Concentration Risk

Nearly all of the company's output originates from a single Virginia deposit, meaning any operational disruption, permitting delay, or accelerated reserve depletion at that site directly threatens the majority of its production capacity. Unlike India-based competitors with multiple mining locations, geographic diversification is not currently available as a risk mitigation option for this producer.
IREL (INDIA) LIMITED

Moat: State-Backed Scale And Reserve Access

As an Indian government undertaking, IREL benefits from privileged access to some of the country's largest kyanite reserves and operates at a processing scale most private competitors cannot match. Government backing also provides a degree of insulation from short-term financing pressure that affects smaller independent miners during periods of price weakness or capital-intensive capacity expansion.
IREL (INDIA) LIMITED

Risk: Export Policy And Bureaucratic Delay

State ownership brings bureaucratic decision cycles that can slow capacity expansion and capital allocation relative to nimbler private competitors, particularly when investment decisions require multiple layers of government approval. IREL is also directly exposed to shifts in India's own export licensing policy, which it does not fully control despite being a state entity.

Players Tracked

Prominent Players

Kyanite Mining Corporation
IREL (India) Limited
Thelo DMS
Imerys
Sinosteel Corporation

Other Key Players

RHI Magnesita N.V.
Minerals Technologies Inc.
Orissa Minerals Development Company Limited
Kerala Minerals and Metals Limited
Calderys
Vesuvius plc
LKAB Minerals AB
Haicheng Refractories Group
Puyang Refractories Group
Jiangsu Xuzhou Minerals Group
Assam Sillimanite Limited
Trans-Hex Group
Xiangyang Refractory Materials Co.
Saint-Gobain Ceramic Materials
Hoganas Borgestad Group

Recent Developments

MARCH 2024

India Tightens Kyanite Export Licensing Requirements

India's Directorate General of Foreign Trade introduced revised licensing requirements for raw and lightly processed kyanite exports in March 2024, mandating value-addition documentation before customs clearance. The policy responded to domestic pressure to retain beneficiation and calcination employment onshore rather than exporting unprocessed ore for finishing elsewhere.
Signal: A regulatory change, not a corporate transaction, that permanently reshaped how international buyers source Indian material going forward.
SEPTEMBER 2024

Imerys Expands Andalusite Calcination Capacity At Glomel

Imerys announced an investment to expand calcination capacity at its Damrec andalusite operation in Glomel, France, in September 2024, targeting higher-purity output for electrical insulator and specialty ceramics customers. The expansion was an organic capacity investment, not an acquisition or joint venture, aimed at capturing growing European electrical-grade demand.
Signal: An organic capacity expansion confirms established European processors are chasing the same electrical-grade premium as newer entrants.
JANUARY 2025

Thelo DMS Restores Andalusite Output After Grid Outages

Thelo DMS reported a partial recovery in andalusite processing output at its South African operations in January 2025, following months of production curtailment caused by Eskom load-shedding through 2024. The company invested in backup generation capacity to reduce future exposure to national grid instability affecting output.
Signal: Recovery from grid-driven curtailment shows how directly national infrastructure reliability now determines African kyanite supply availability.

Energy And Logistics, Not Ore

Natural gas and electricity for calcination represent 30% to 40% of processing cost of goods sold, since converting kyanite to mullite requires sustained heating above 1,350 degrees Celsius. Mining and beneficiation labor and equipment account for another 25% to 35%, while logistics, particularly ocean freight for India-to-Europe and India-to-East-Asia shipments, adds 10% to 15% more.
The 2022 European energy crisis illustrated this exposure directly. EIA and IEA data recorded natural gas prices in Europe reaching several multiples of pre-2021 levels as Russian pipeline supply was curtailed, and Imerys' 2022 annual report disclosed materially higher energy costs at its French andalusite calcination operations during that period. Margins at European calciners have not fully recovered even as gas prices normalized by 2024, because customers resisted matching the full cost pass-through processors sought.

Exposure varies sharply by processor location and integration. Vertically integrated miners with captive or contracted power, such as operations in India and parts of the United States, absorb far less volatility than European calciners dependent entirely on spot gas markets. Smaller independent calciners without long-term energy contracts face the steepest competitive disadvantage against captive-power rivals across the industry.
global-kyanite-market-trends-cost-volatility-analysis-1787552943691

Shift Calcination Capacity Toward Captive Or Contracted Power

Processors relocating or expanding calcination capacity in regions with captive coal, gas, or renewable power, including parts of India and the United States, reduce direct exposure to volatile European spot gas pricing that has repeatedly squeezed margins since 2022. This shift also supports longer-dated customer contracts, since processors can quote fixed multi-year prices without a large energy risk premium.

Hedge Gas Exposure Through Forward Purchase Agreements

European calciners without captive power can hedge a meaningful share of expected annual gas consumption through forward purchase agreements or futures contracts, smoothing quarter-to-quarter cost volatility even though it does not lower average cost across a full price cycle. This approach has become common since 2022 among processors serving customers on fixed-price multi-year supply contracts.

Recover Value Through Byproduct And Waste Stream Sales

Selling mica, quartz sand, and iron oxide byproducts generated during beneficiation offsets a portion of total processing cost, effectively lowering the net energy and labor burden per tonne of finished kyanite concentrate. Producers investing in byproduct separation capability report meaningfully improved unit economics without any change to core mining or calcination operations at their sites.

Portfolio Architecture for Margin Defence

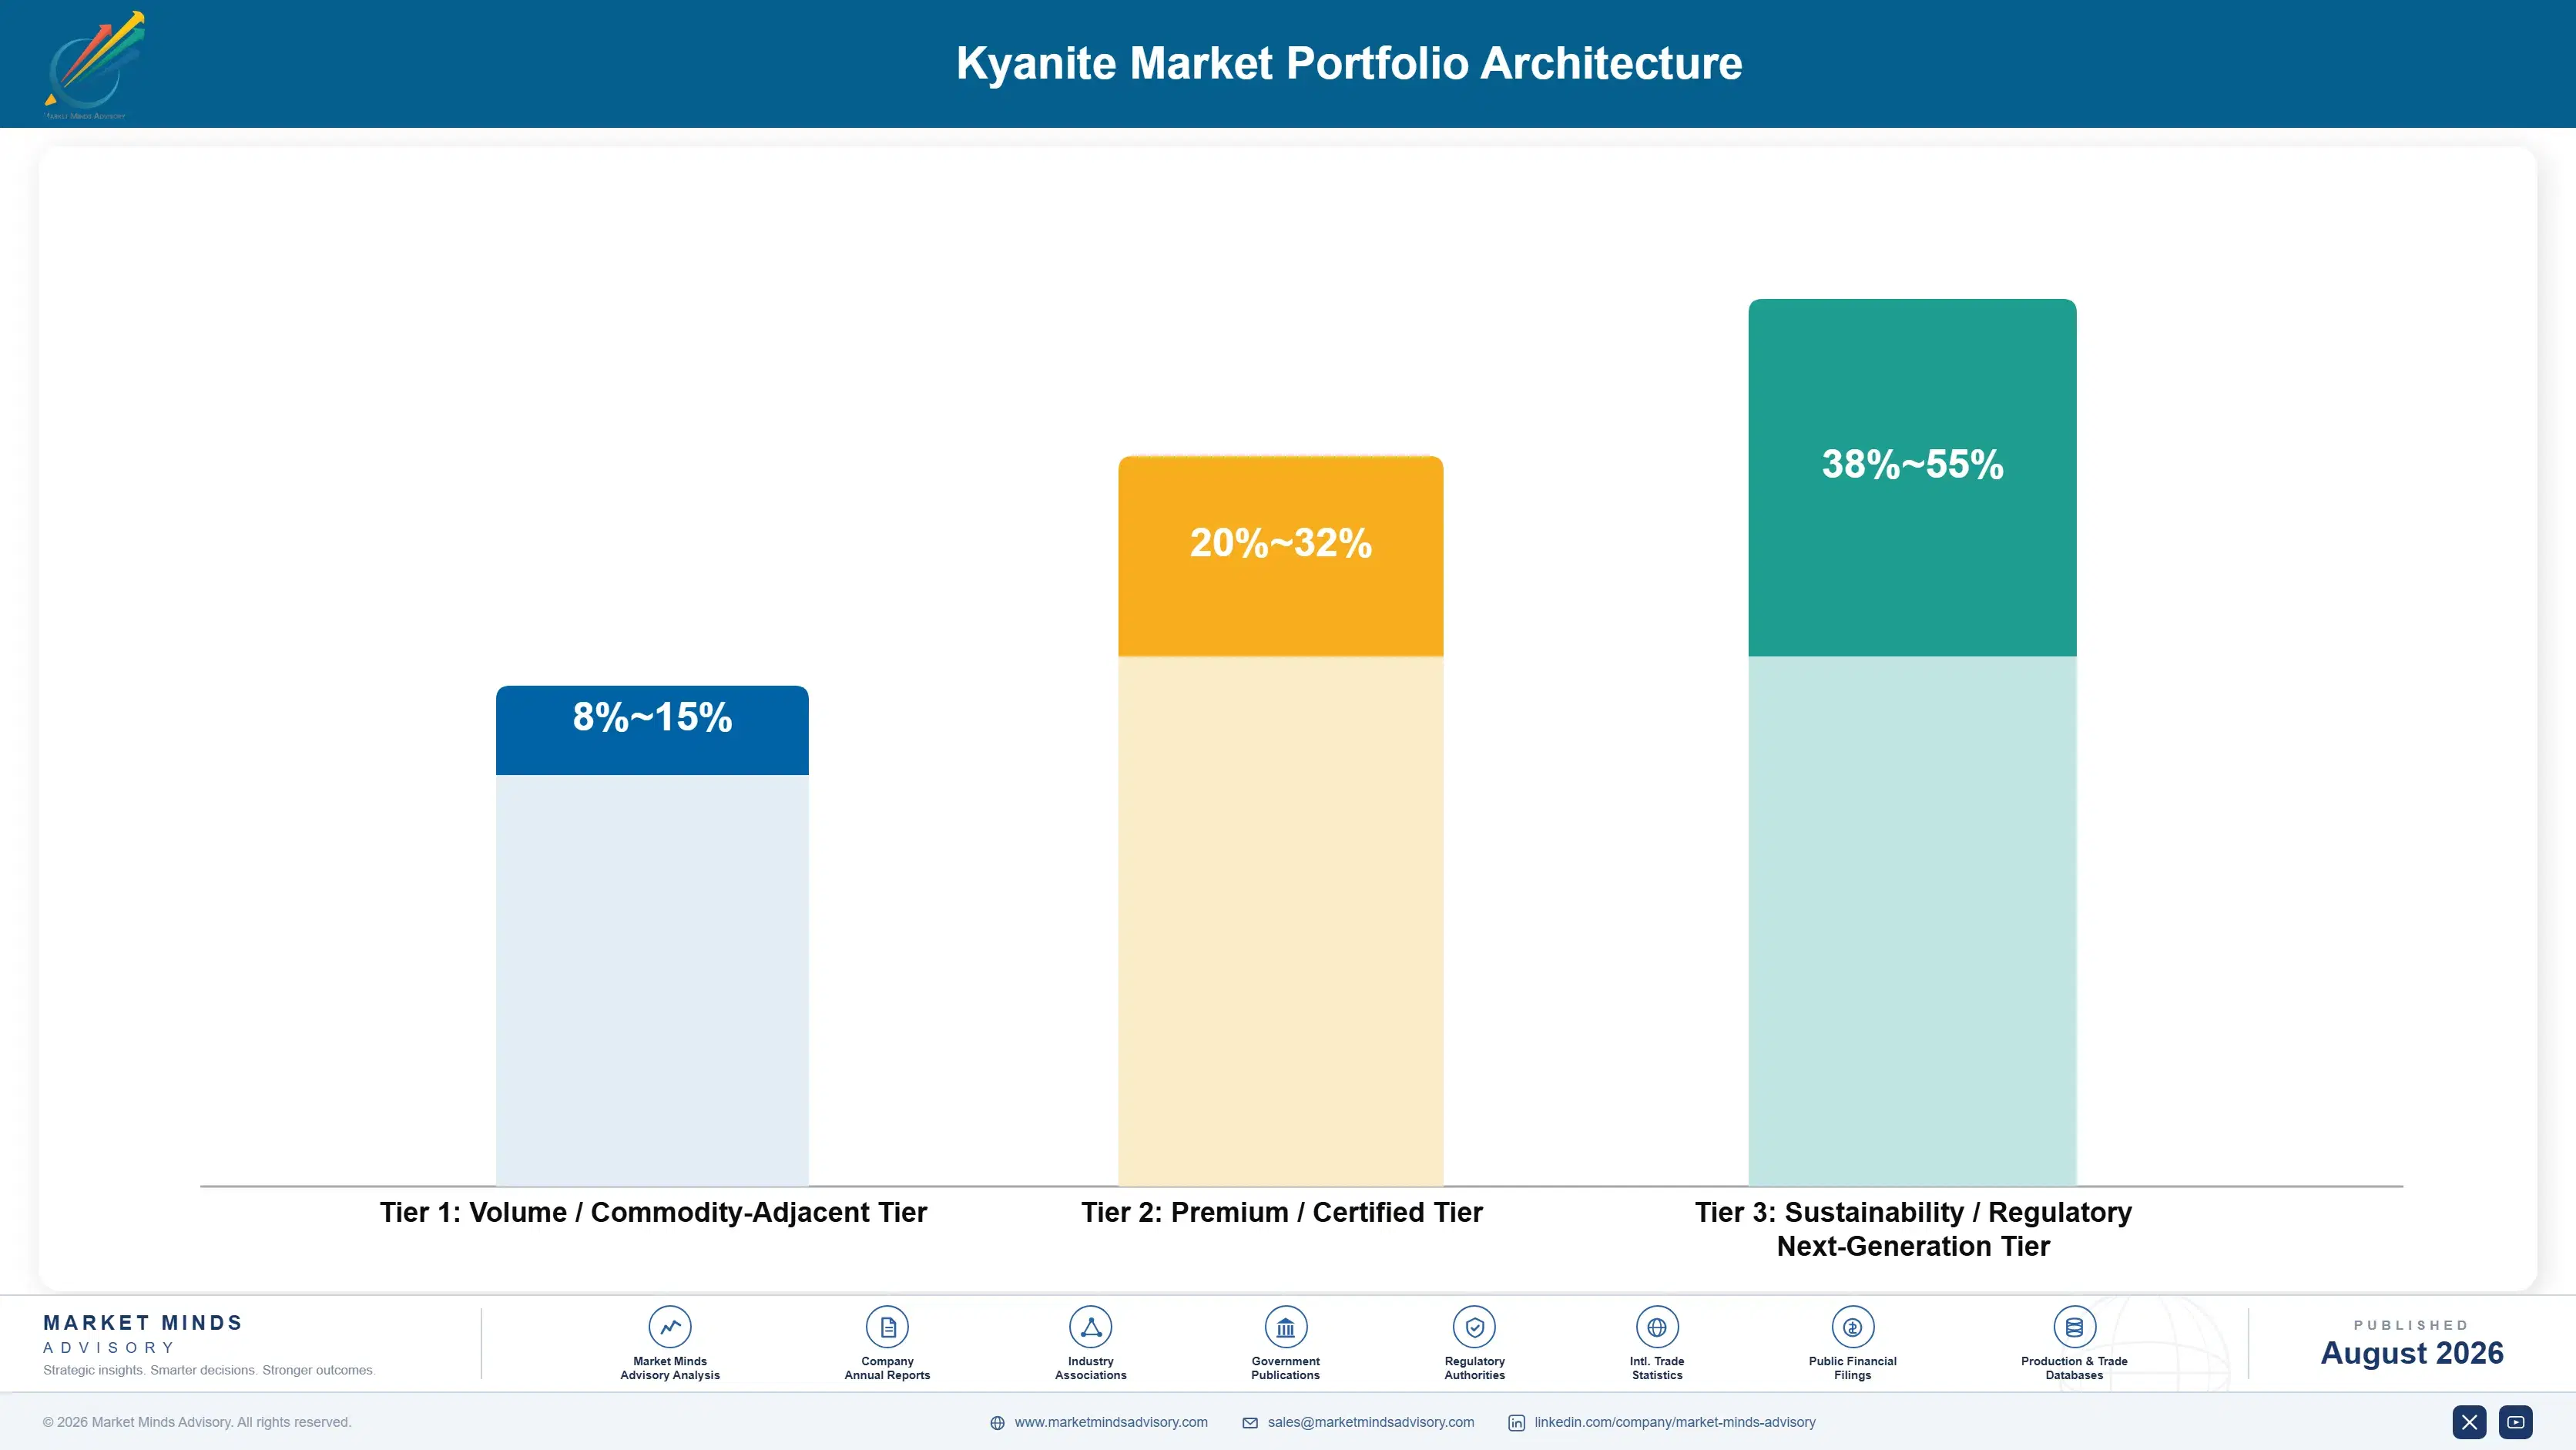
The kyanite portfolio splits into three tiers with meaningful margin separation. Basic refractory-grade crude and lightly beneficiated ore competes largely on delivered price and forms the volume base of the market. Certified ceramics and foundry-grade concentrate commands a moderate premium tied to tighter chemistry consistency. Electrical and specialty insulator-grade material earns the highest margins, reflecting qualification barriers and limited capacity able to meet sub-0.5% iron specifications reliably.
The tension running through this portfolio is between steady volume and thin margin on one side, and genuine scarcity value on the other. Refractory-grade tonnage remains necessary to fund mining and beneficiation infrastructure, yet it faces continuous price pressure from buyers who treat it as a substitutable commodity input. Electrical-grade material faces no such pressure today, but volumes remain small relative to total market tonnage overall.

High-value pools concentrate specifically where beneficiation quality, not raw reserve size, determines competitive position. A processor with modest reserves but proven sub-0.5% iron beneficiation captures more electrical-grade margin than a larger miner still selling crude ore. That inversion is relatively new to this market and is reshaping where investment capital flows across the industry.

Volume / Commodity-Adjacent Tier

Crude and lightly beneficiated refractory-grade kyanite sold primarily on delivered price to steel and glass furnace relining customers, competing directly against substitute aluminosilicate minerals and synthetic alumina on cost alone.
Gross Margin: 8-15%

Premium / Certified Tier

Calcined, chemistry-certified concentrate serving ceramics, sanitaryware, foundry, and abrasive customers who specify tighter iron and particle-size tolerances than basic refractory buyers require across their annual purchasing programs and supplier qualification cycles.
Gross Margin: 20-32%

Sustainability / Regulatory / Next-Generation Tier

Ultra-low-iron electrical and electronic insulator-grade material qualified for power electronics substrates, EV inverter housings, and 5G ceramics, where scarce processing capability rather than reserve size determines who captures the resulting premium.
Gross Margin: 38-55%
global-kyanite-market-trends-portfolio-architecture-1787552944557

High-value Sub-segments and Strategic Watch-out

Electrical and Electronic Insulators

The fastest-growing and highest-margin segment, at 6.1% CAGR and gross margins reaching the mid-50s, driven by EV inverter housings and 5G base-station ceramics that require sub-0.5% iron concentrate only a handful of beneficiation plants worldwide can consistently supply at qualified commercial volume and specification. Buyers increasingly pre-book capacity years ahead.
Gross Margin: 38-55%

Fiberglass and Specialty Pigments

Second-fastest at 5.4% CAGR, using milled mullite as a low-expansion filler in wind turbine blade fiberglass and high-temperature architectural pigments, commanding pricing between commodity refractory-grade and premium electrical-grade material across most buyer programs, specification tiers, and regional markets served. Wind and construction demand both keep expanding steadily.
Gross Margin: 25-35%

Refractories and Kiln Furniture

The largest segment by tonnage, growing near 3.9%, supplying basic furnace lining material to steel and glass manufacturers on multi-year contracts, priced competitively against substitute aluminosilicate refractory minerals throughout the buyer base, across regions, and across furnace types in daily operation. Relining cycles keep this tier reliably steady overall.
Gross Margin: 10-18%

Abrasives and Grinding Media

The slowest-growing visible category, facing steady substitution from synthetic alumina and silicon carbide abrasives that offer more consistent hardness, leaving kyanite-based abrasive demand dependent mainly on legacy foundry applications worldwide with little new growth expected across the forecast period. Synthetic substitutes keep gaining share here steadily.
Gross Margin: 12-20%

Contracts, Not Transactions, Govern Demand

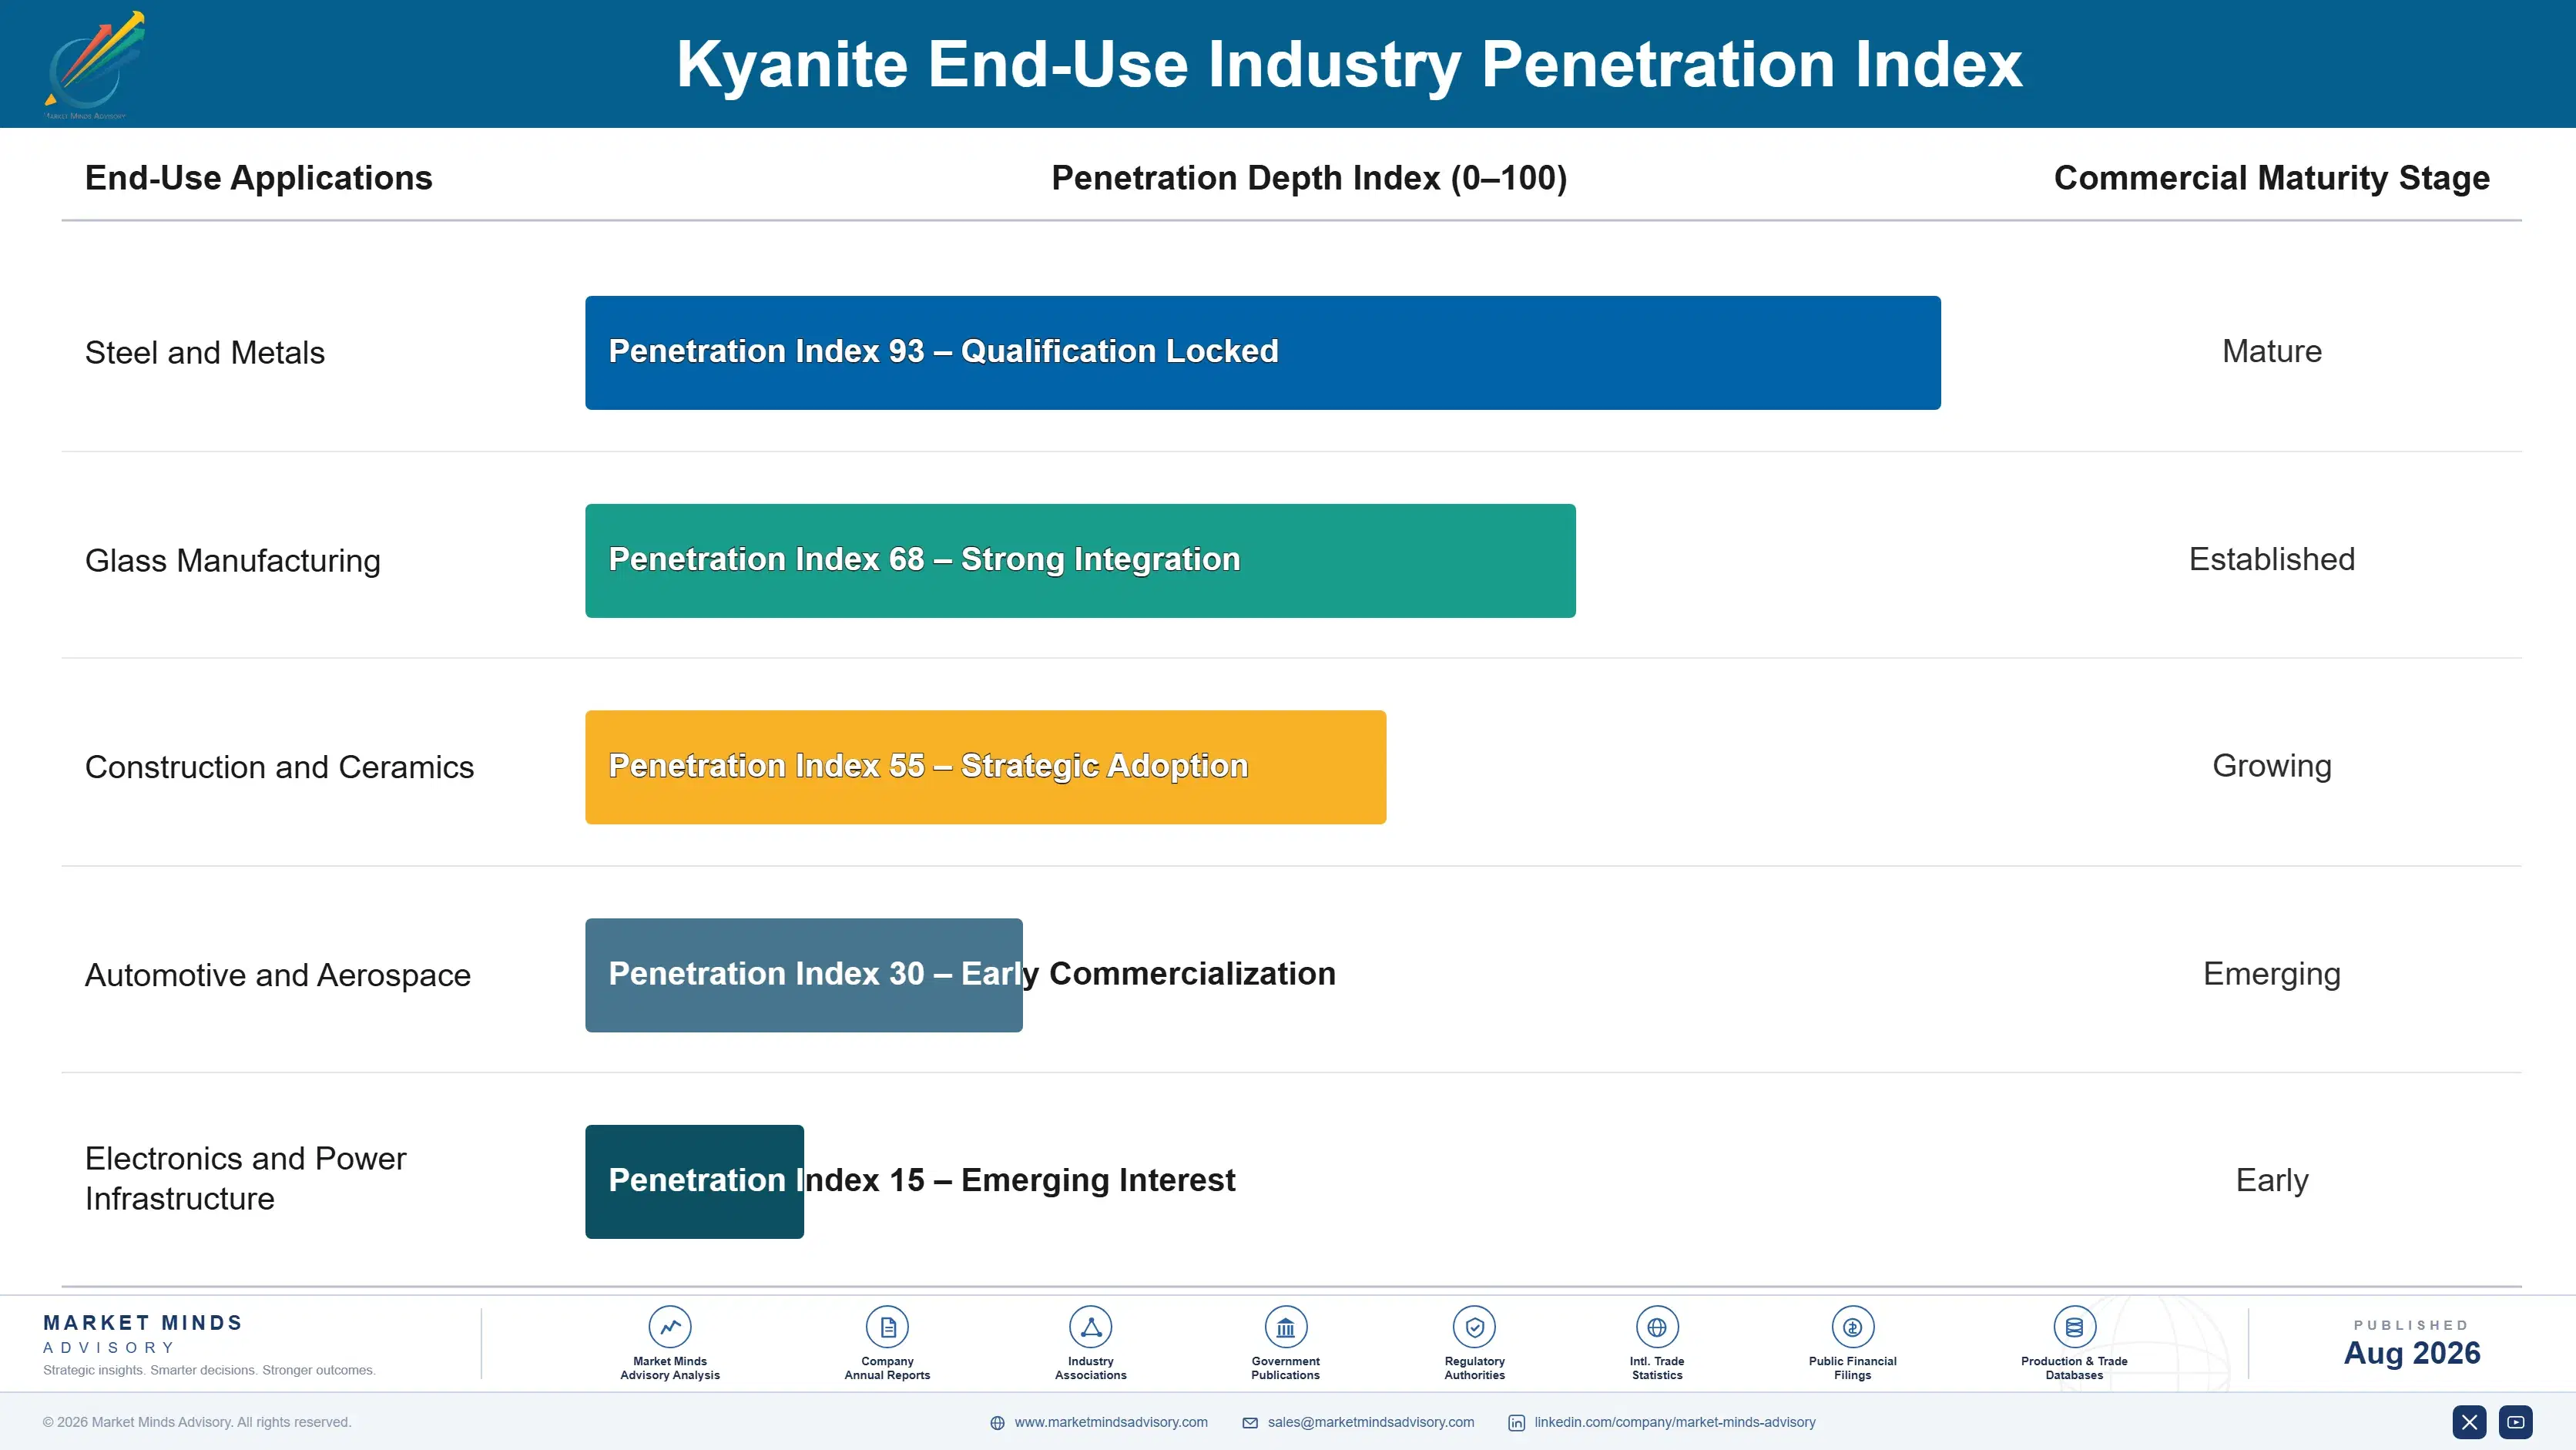
Demand here runs on multi-year contracts rather than repeat spot purchases. Refractory buyers commit to relining schedules tied to furnace campaign life, typically eighteen months to three years, and switching suppliers mid-contract risks a chemistry mismatch that can shorten that campaign unexpectedly. Electrical-grade buyers commit even longer, since qualification takes twelve to eighteen months and manufacturers rarely revisit an approved supplier once validated.
Adoption depth varies sharply by end-use vertical. Steel and glass manufacturers treat kyanite as a safety-critical input, since refractory failure halts production entirely, making them reluctant to switch even for modest price advantages. Electronics and insulator manufacturers show the deepest stickiness, given requalification costs that can exceed any plausible saving. Ceramics and sanitaryware producers sit at the other end, treating kyanite more as a substitutable commodity input.

Buyer profiles are shifting generationally as procurement moves from purely cost-driven purchasing toward supply-security-weighted decision-making. Younger procurement teams increasingly factor in geographic sourcing concentration and regulatory exposure, not just delivered price, following India's 2023 export licensing changes. That shift favors processors who demonstrate diversified sourcing over those competing purely on unit cost across the buyer base.
global-kyanite-market-trends-end-use-penetration-index-1787552945776

Where MMA Sees Kyanite Diverging

These are among the four positions where our research anticipates prominent divergence between winners and laggards over the coming forecast period. Each is grounded in the demand model, the regulatory perimeter, and the announced capacity pipeline.
01 / PROCESSING INVESTMENT PRIORITY

Beneficiation capability will separate winners from commodity ore sellers

Reserve size no longer determines competitive position in this market the way it once did. Processors capable of consistently hitting sub-0.5% iron content for electrical-grade buyers are capturing margin that dwarfs anything available from crude ore sales, regardless of how large their underlying deposit is. Over the next decade, we expect capital to flow disproportionately toward beneficiation and calcination technology rather than new mine development, and producers who delay that investment risk becoming volume suppliers to better-capitalized competitors within a fairly short window.
02 / SOURCING GEOGRAPHIC DIVERSIFICATION

Single-country reserve exposure is becoming a priced-in risk factor

India and South Africa together supply most of the world's usable kyanite-group ore, and both face distinct forms of supply disruption, export licensing changes in one case, grid instability in the other. Buyers who concentrated sourcing with a single country or single mine during the past decade have already felt the consequences through longer lead times and unplanned cost increases. We expect qualified buyers to increasingly demand multi-country supply qualification as standard procurement practice, rewarding processors with geographically diversified operations over single-site producers regardless of their historical pricing advantage.
03 / ELECTRICAL-GRADE MARGIN CAPTURE

The electrical insulator channel will outgrow refractory tonnage sharply

Electrical and electronic insulators already grow at roughly 1.4 times the overall market rate, and that gap should widen rather than close as EV and 5G infrastructure buildout continues through the forecast period. Refractory demand remains dependable but consistently slower, growing with steel capacity additions that are themselves decelerating in mature markets even as they continue in India and Southeast Asia. Producers positioned to serve both channels, but with genuine capability in the higher-margin electrical-grade specification, will command pricing power that pure refractory-grade suppliers increasingly cannot match.
04 / ENERGY COST EXPOSURE

European calcination competitiveness depends on captive power access

European calciners remain directly exposed to natural gas price volatility that competitors in India and the United States, with captive or contracted power, do not share. That exposure has already compressed margins since 2022 and shows no sign of fully reversing even as spot gas prices normalize. We expect processing capacity to continue migrating toward lower-energy-cost regions over the coming decade, leaving European operations increasingly dependent on premium ceramics and aerospace customers willing to pay for proximity rather than on cost-competitive basic refractory-grade volume.

Engagement Snapshot From the Field

A live engagement with an industry participant carrying material or product regulatory and market exposure ahead of a defining policy shift, showing how our research translates into a defensible multi-year portfolio strategy.
MARKET MINDS ADVISORY · CLIENT ENGAGEMENT SUMMARY
Kyanite Producer Strategic Portfolio Review and Transition Roadmap 2026·Investment Scenario on Kyanite Exposure Evaluation 2025-26
CLIENT PROFILE
A large integrated steel producer operating multiple blast furnaces across South and Southeast Asia approached MMA after experiencing a near six-week supply delay following India's 2023 kyanite export licensing changes. The client reported annual refractory procurement spend exceeding USD 40 million, with roughly 60% of its kyanite-group material historically sourced from a single Indian trading intermediary rather than direct mine or calciner relationships (client-reported, unverified by MMA).
STRATEGIC CHALLENGE
Management needed to understand how exposed the company's furnace-relining schedule was to further Indian regulatory action, and whether shifting toward direct calciner relationships or diversifying into South African andalusite could reduce that exposure without disrupting a relining calendar that could not be delayed without halting production entirely. No internal team had modeled realistic switching costs or timelines.
MMA APPROACH
MMA mapped the client's full kyanite-group supply chain from mine to furnace, benchmarked lead times and pricing across Indian, South African, and American sourcing options, and modeled the switching cost and qualification timeline for direct calciner relationships against continued reliance on intermediary traders. We also assessed the client's contract terms against industry-standard multi-year supply agreements to identify negotiation leverage the client had not previously used.
KEY FINDINGS
  1. Roughly 60% of the client's kyanite-group volume flowed through a single intermediary whose own sourcing depended entirely on Indian export licensing that the client had no direct visibility into (client-reported, unverified by MMA).
  2. Direct calciner relationships in India could be qualified within nine months given the client's existing furnace chemistry specifications, well inside the eighteen-month worst-case delay the disrupted 2023 shipment had already demonstrated.
  3. South African andalusite offered a viable secondary sourcing option, but current grid instability made single-sourcing from that region alone a comparable rather than lower overall risk.
  4. Existing contract terms contained no volume guarantee or price escalation cap, leaving the client fully exposed to spot price spikes during any future regulatory disruption event.
CLIENT PROFILE
A large integrated steel producer operating multiple blast furnaces across South and Southeast Asia approached MMA after experiencing a near six-week supply delay following India's 2023 kyanite export licensing changes. The client reported annual refractory procurement spend exceeding USD 40 million, with roughly 60% of its kyanite-group material historically sourced from a single Indian trading intermediary rather than direct mine or calciner relationships (client-reported, unverified by MMA).
STRATEGIC CHALLENGE
Management needed to understand how exposed the company's furnace-relining schedule was to further Indian regulatory action, and whether shifting toward direct calciner relationships or diversifying into South African andalusite could reduce that exposure without disrupting a relining calendar that could not be delayed without halting production entirely. No internal team had modeled realistic switching costs or timelines.
MMA APPROACH
MMA mapped the client's full kyanite-group supply chain from mine to furnace, benchmarked lead times and pricing across Indian, South African, and American sourcing options, and modeled the switching cost and qualification timeline for direct calciner relationships against continued reliance on intermediary traders. We also assessed the client's contract terms against industry-standard multi-year supply agreements to identify negotiation leverage the client had not previously used.
KEY FINDINGS
  1. Roughly 60% of the client's kyanite-group volume flowed through a single intermediary whose own sourcing depended entirely on Indian export licensing that the client had no direct visibility into (client-reported, unverified by MMA).
  2. Direct calciner relationships in India could be qualified within nine months given the client's existing furnace chemistry specifications, well inside the eighteen-month worst-case delay the disrupted 2023 shipment had already demonstrated.
  3. South African andalusite offered a viable secondary sourcing option, but current grid instability made single-sourcing from that region alone a comparable rather than lower overall risk.
  4. Existing contract terms contained no volume guarantee or price escalation cap, leaving the client fully exposed to spot price spikes during any future regulatory disruption event.
RECOMMENDED STRATEGY
Phase 1: Phase 1 (0 to 6 months): Diversify immediate volume by qualifying a second Indian calciner and initiating South African andalusite sampling to reduce single-intermediary dependence. Phase 2: Phase 2 (6 to 18 months): Negotiate direct multi-year contracts with two qualified calciners, incorporating volume guarantees and price escalation caps tied to energy cost indices. Phase 3: Phase 3 (18 to 36 months): Build permanent dual-source qualification across India and South Africa, formalizing a standing supplier scorecard reviewed annually against delivery and chemistry performance.
OUTCOME
The client diversified away from single-intermediary dependence within eight months, qualifying two direct calciner relationships that eliminated the trading margin previously embedded in pricing. Reported annual procurement savings reached approximately 6%, alongside a reported reduction in unplanned relining delays (client-reported, unverified by MMA). The dual-sourcing framework has since been extended to other refractory mineral categories.

Frequently Asked Questions

Foundational context covering the market sizes, CAGR, scope, country, region and competition that inform every finding below. This section is provided to cover basics and most often pre-purchase conversations, answered from the MMA Primary Research Dataset.

What is the current size of the Kyanite Market?

The global kyanite market stands at USD 1.1 billion in 2025, according to MMA Primary Research. Refractory and ceramics applications together account for most of that value.

How large will the Kyanite Market be by 2036?

MMA projects the market will reach USD 1.75 billion by 2036, up from USD 1.15 billion in 2026, an expansion multiple of roughly 1.52 times over the forecast period.

What is the CAGR for the Kyanite Market 2026 to 2036?

The base case CAGR is 4.3% across 2026 to 2036. MMA's bull scenario reaches 5.5% and the bear scenario falls to 3.2%, depending on Chinese export policy and steel demand.

Which segment is growing fastest?

Electrical and electronic insulators grow fastest at 6.1% CAGR, roughly 1.4 times the overall market rate, driven by EV inverter housings and 5G base-station ceramic components.

Who are the major companies in the Kyanite Market?

Leading producers include Kyanite Mining Corporation, IREL (India) Limited, Thelo DMS, Imerys, and Sinosteel Corporation. Together these five account for an estimated 47% of global processing capacity.

Which country is growing fastest?

India posts the fastest national growth at approximately 7.4% CAGR, supported by continued steel capacity additions and construction activity broadening beyond established metro ceramics and sanitaryware markets.

Report Segmentation Architecture

The full report scope spans multiple orthogonal segmentation dimensions, with cross-tabulated demand data provided for each dimension pair. Coverage extends further to regional breakdowns, trend trajectories, and the competitive detail needed to support segment-level decision-making.

By Application

  • Refractories and Kiln Furniture
  • Ceramics and Sanitaryware
  • Abrasives and Grinding Media
  • Foundry and Metal Casting
  • Electrical and Electronic Insulators
  • Fiberglass and Specialty Pigments

By End-Use Industry

  • Steel and Metals
  • Glass Manufacturing
  • Construction and Ceramics
  • Automotive and Aerospace
  • Electronics and Power Infrastructure

By Commercial Dimension

  • Direct Mine-to-Calciner Contracts
  • Ore Trader Intermediated Sales
  • Long-Term Offtake Agreements
  • Spot Market Transactions

By Region

  • North America
  • Western Europe
  • East Asia
  • South Asia and Pacific
  • Latin America
  • Middle East and Africa
  • Eastern Europe

Scope, Methodology, and Coverage

Every figure in this report is reproducible from documented input assumptions. The scope below maps the historical period, the forecast horizon, the segmentation dimensions, and the countries covered, alongside the underlying primary and qualitative methodology.
Historical Period
2020 to 2025
Forecast Period
2026 to 2036
Base Year
2025 (USD billions; MMA Primary Research Dataset, August 2026)
Market Definition
The kyanite market covers the mining, beneficiation, and calcination of kyanite-group aluminosilicate minerals, kyanite, andalusite, and sillimanite, sold as crude ore, beneficiated concentrate, or calcined and mullite-converted grades for refractory, ceramic, abrasive, foundry, and electrical insulator use. It excludes downstream finished refractory brick, ceramic ware, and insulator manufacturing, which are separate markets that merely consume this mineral input.
Quantitative Units
USD billions (current prices); metric tonnes of finished concentrate where applicable
Segmentation Dimensions
By Application; By End-Use Industry; By Commercial Dimension; By Region
Regions Covered
North America, Western Europe, East Asia, South Asia and Pacific, Latin America, Middle East and Africa, Eastern Europe
Countries Covered
USA, China, Germany, France, UK, Japan, South Korea, India, Australia, Canada, Brazil, Mexico, Indonesia, Vietnam, Thailand, Malaysia, UAE, Saudi Arabia, South Africa, Nigeria, Turkey, Poland, Netherlands, Italy, Spain, Sweden, Switzerland, Argentina, Colombia, Singapore, and additional markets relevant to this sector
Key Companies Profiled
Kyanite Mining Corporation, IREL (India) Limited, Thelo DMS, Imerys, Sinosteel Corporation, RHI Magnesita N.V., Minerals Technologies Inc., Orissa Minerals Development Company Limited, Kerala Minerals and Metals Limited, Calderys, Vesuvius plc, LKAB Minerals AB, Haicheng Refractories Group, Puyang Refractories Group, Jiangsu Xuzhou Minerals Group, Assam Sillimanite Limited, Trans-Hex Group, Xiangyang Refractory Materials Co., Saint-Gobain Ceramic Materials, Hoganas Borgestad Group
Quantitative Methodology
Primary survey, n=3,800 respondents, Q4 2025, six countries; demand-side model with trade association cross-validation
Qualitative Methodology
47 expert interviews, Q4 2025; applied to validate demand model assumptions, identify emerging dynamics, and assess competitive positioning
Report Format
PDF and XLSX data workbook (Word format preview document)
Publisher
Market Minds Advisory
Report Code
MMA-2026-CHM-101
Published
August 2026
Contact
sales@marketmindsadvisory.com | www.marketmindsadvisory.com

Purchase the full Kyanite Market Report (2026 to 2036).

The full MMA Kyanite Market report sizes global demand across six application segments, five end-use industries, four commercial contracting models, and seven regions through 2036. It profiles twenty participants on a consistent processing-capacity basis, scoring each on beneficiation capability, reserve access, and export policy exposure. Scenario models quantify how Indian export licensing, South African grid reliability, and EV or 5G-driven electrical-grade demand move both volume and realizable price across the forecast period. The report also includes delivered-cost modelling by application, a country supply-risk screen, energy cost sensitivity analysis, and byproduct monetization benchmarks built for procurement, strategy, and investment teams.
Application-Level Demand Sizing Across Six Segments
Twenty-Company Competitive Benchmarking On Processing Capacity
India Export Policy And Supply-Risk Scenario Modelling
Energy Cost Sensitivity And Calcination Margin Analysis
Regional Trade Flow And Country-Level Growth Mapping
Electrical-Grade Qualification Pipeline And Byproduct Benchmarks

Built For The People Who Decide

From boardroom strategy to bench-side execution, this report is read cover-to-cover by leaders shaping the next decade of their industry, turning demand scenarios, market dynamics and valuation benchmarks into decisions.
CXOs/ Presidents/ VPs/ Managers
M&A and Corporate Development
Strategy Teams and R&D Heads
Procurement and Product Directors
Regulatory and Compliance Leaders
Investor Relations and Equity Analysts