Market Minds Advisory
Global Hypochlorite Bleaches Market

Global Hypochlorite Bleaches Market: decay economics, freight radius and chlor-alkali integration

The product loses strength in the drum while it waits to be used, which caps how far anybody ships it and explains why a business this large has almost no global players.

Lead Analyst

Bilal Shaikh

Published

September 2026

Make Smarter Decisions with Customized Research Insights

Request a free sample report and evaluate market opportunities, growth trends, and competitive dynamics relevant to your business needs.

2025 MARKET VALUE$4.3BMarket Size 2025
2036 FORECAST VALUE$6.9BBase Case , 2026 to 2036
CAGR 2026 TO 20364.4 %Bull 5.6% / Bear 3.2%
INCREMENTAL OPPORTUNITY$2.4BNet 10- year value creation
EXPANSION MULTIPLE1.54x2036 value over 2026 base
Strategic Levers
M&A Pipeline
Regional Outlook
Country Rankings
Competitive Intelligence
Segmental Deep-dive
Call-Us : 91 93563 13602

Executive Snapshot and Market Trajectory

Hypochlorite bleach decays in storage, losing roughly three percent of its available chlorine a month, and that single property governs the entire commercial structure of the business. Nobody ships dilute solution far, so the market is really a collection of regional franchises rather than anything much resembling a global industry.
Growth concentrates in tableted calcium hypochlorite, expanding at 6.6%, where a solid form removes both the decay problem and the freight penalty and reaches customers that liquid supply simply cannot serve economically at all. East Asia holds 32% of value, the largest regional share, because Chinese chlor-alkali capacity is the world's largest and because municipal water treatment investment across the region consumes disinfectant at a scale no other market matches.
The supplier base is remarkably fragmented for a chemical business of this size, with the top five holding only 19% of production volume, and it divides between integrated chlor-alkali producers, regional bleach packagers, and pool and institutional hygiene brand owners. Competition runs on delivered available chlorine rather than on chemistry. Chlor-alkali integration is the cost position that separates genuine margin from ordinary regional packaging trade.
Market Definition
Hypochlorite bleaches comprise sodium and calcium hypochlorite products across dilute household solution, industrial and high-strength sodium hypochlorite, granular and tableted calcium hypochlorite, and stabilised or specialty hypochlorite formulations. Sizing covers product sold to municipal, industrial, institutional and consumer channels at realised delivered price. Chlorine gas and chlorine dioxide, chlorinated isocyanurates, hydrogen peroxide and peracetic acid, on-site generation equipment sold as capital goods, and formulated cleaning products containing hypochlorite as one ingredient all fall outside scope.
Base Year Value
$4.3B in 2025 (MMA Primary Research Dataset, August 2026)
Forecast Period
2026 to 2036, eleven discrete annual values
CAGR
4.4% base case. Bull 5.6%. Bear 3.2%.
Fastest Growth Segment
Calcium Hypochlorite Tableted Forms: 6.6% CAGR
Fastest Growth Country
India: 7.2% CAGR
Fastest Growth Region
South Asia and Pacific: 6.7% CAGR
Largest Region
East Asia: 32% of 2025 global value
Market Leaders
Olin, Westlake, Occidental Chemical, Tosoh and Nouryon lead on hypochlorite production volume across sodium and calcium product classes. Source: MMA Primary Research Dataset, July 2026.
Primary Survey
n=3,800 procurement and R&D decision-makers, Q4 2025, six countries
Methodology
Demand-side build-up, cross-validated against public data, 47 expert interviews

Global Hypochlorite Bleaches Market Forecast Scenarios

global-hypochlorite-bleaches-market-size-forecast-scenario-1787310860428
Growth of 3.6% across 2020 to 2025 was distorted at both ends by events nobody modelled. Household and institutional disinfectant demand spiked violently through 2020 and then fell below trend as inventories cleared through 2022. Chlor-alkali supply disruption in early 2021, documented by the EIA following the Texas winter storm, removed chlorine availability across the Gulf Coast and pushed hypochlorite pricing to levels that took two years to unwind.
The base case at 4.4% rests on three mechanisms. Municipal water treatment investment keeps expanding across South Asia, Southeast Asia and Africa, and hypochlorite remains the default disinfectant wherever chlorine gas handling is impractical. Tableted calcium hypochlorite keeps taking share from liquid supply in remote duty on plain freight arithmetic. And institutional hygiene standards in healthcare and food processing keep tightening, which raises consumption per facility rather than adding facilities.
The bull case at 5.6% turns on municipal disinfection investment across Africa and South Asia accelerating faster than currently modelled, since each new treatment works adds a recurring hypochlorite charge for its operating life. The bear case at 3.2% turns on substitution. Ultraviolet disinfection and chlorine dioxide keep improving on cost, and both remove hypochlorite from the applications they reach.

Hypochlorite: decay, freight and chlorine integration

Two physical facts govern this market and no amount of commercial ingenuity gets around either. Hypochlorite solution loses about three percent of its available chlorine every month in storage, and it is mostly water, so freight beyond roughly 250 kilometres destroys the delivered economics entirely. Together those facts explain why a business worth several billion dollars has a top five holding under a fifth of it.
TOP FIVE CONCENTRATION19%Share of global hypochlorite production volume held collectively
CHLOR-ALKALI INPUT SHARE52% of COGSPortion of delivered cost tied to chlorine inputs
WATER TREATMENT SHARE38% of volumeLargest single application by consumed product tonnage globally
AVAILABLE CHLORINE DECAY3% monthlyStrength lost during storage before the customer uses it
ECONOMIC DELIVERY RADIUS250 kmDistance beyond which delivered economics simply stop working
INTEGRATED PRODUCTION SHARE68%Portion of output made by integrated chlorine producers
Cost structure sits almost entirely upstream. Chlorine and caustic soda together account for roughly 52% of delivered cost, and 68% of global output is made by producers who generate their own chlorine rather than buying it merchant. That integration gap is the single largest determinant of who earns money here, and it cannot be closed by anybody without a chlor-alkali unit.
Applications divide by whether the customer values residual disinfection or simply bleaching. Municipal and industrial water treatment takes 38% of volume and pays for available chlorine delivered reliably. Household, institutional and pool duty sits in a different commercial world, where brand, packaging and shelf stability all matter considerably more than the cost per kilogram of chlorine ever does.
"Buyers in this market still order by the litre, which means they pay for water and then discover the drum has lost a tenth of its strength by the time it reaches the dosing pump. The suppliers worth dealing with sell available chlorine at the point of use, and there are surprisingly few of them."
Director, Inorganic Chemicals and Water Treatment Practice · MMA Chemicals and M

Market Trends

Tableted calcium hypochlorite displacing liquid in remote duty

A tablet carries roughly ten times the available chlorine per unit shipped weight that dilute solution does and does not decay meaningfully in storage, which changes the arithmetic completely for any customer beyond easy tanker reach. Small municipal systems, remote industrial sites and pool operators across dispersed geographies are converting steadily, and the dosing equipment required is neither expensive nor complicated. Producers with tableting capability capture demand that liquid supply cannot economically serve. Those without it simply watch the fastest growing part of the market develop entirely beyond their commercial reach.
Market Impact: Drives 38% of global volume
On-site generation encroaching on delivered bleach at utilities

Large water utilities increasingly generate dilute hypochlorite on site from salt and electricity, which removes both the decay problem and the freight burden from their operating model altogether. The capital cost is meaningful but the operating economics work well at scale, and the safety case against handling delivered chemical is straightforward to make internally. Delivered bleach suppliers lose those accounts permanently once the equipment is installed. The commercial response that works is selling the generation service rather than resisting it, though very few chemical suppliers have organised themselves to do that.
Market Impact: Raises consumption 12% per facility

Market Opportunities and Growth Drivers

Municipal water treatment investment expanding across South Asia and Africa

Municipal water and wastewater treatment capacity keeps being commissioned across India, Southeast Asia and East and West Africa, and hypochlorite remains the default disinfectant wherever chlorine gas handling is impractical on safety or regulatory grounds. Each new treatment works adds a recurring chemical charge that continues for the whole operating life of the plant, which makes this the most durable demand in the market. Indian municipal investment under national water programmes is comfortably the single largest contributor to that growth. Water treatment already accounts for 38% of global hypochlorite volume.
Market Impact: Caps delivery radius at 250 kilomet

Institutional hygiene standards raising consumption per healthcare facility

Healthcare, food processing and institutional cleaning protocols have tightened progressively since 2020, and hypochlorite remains the reference disinfectant against spore-forming organisms where alternatives underperform. Standards now specify contact time, concentration and verification rather than simply requiring disinfection, which raises consumption per facility considerably even where facility numbers are flat. Food processing sanitation is particularly demanding, since verification requirements mean documented available chlorine at point of use rather than at delivery. Shelf stability and packaging integrity therefore matter a great deal more in this channel than delivered price per litre ever does.
Market Impact: Removes 4% of addressable volume

Market Restraints and Challenges

Available chlorine decay limiting shelf life and delivery radius

Sodium hypochlorite solution loses roughly three percent of available chlorine monthly under ordinary storage, faster at elevated temperature or in the presence of trace metals. The root cause is thermodynamic rather than a formulation defect: hypochlorite is genuinely unstable, and stabilisation additives slow the decomposition without stopping it. Commercially this caps delivery radius near 250 kilometres and it forces customers to hold buffer stock that they will then partly waste. Producers are responding with higher initial strength, tableted calcium hypochlorite for distant duty, stabilised formulations and on-site generation service offerings.
Market Impact: Grows 6.6% annually through 2036

Alternative disinfection technologies removing established application volume

Ultraviolet disinfection, chlorine dioxide and ozone all take applications where hypochlorite once had no serious competitor, particularly in municipal treatment where disinfection by-product limits have tightened. The root cause is regulatory rather than commercial: trihalomethane and chlorate limits penalise hypochlorite specifically, and the alternatives do not generate the same by-products. Commercially this removes volume permanently rather than merely repricing it downward. Participants are responding by positioning hypochlorite for residual disinfection where the alternatives cannot substitute, and by supplying lower chlorate grades that meet the tightened municipal specifications now being written.
Market Impact: Threatens 38% of demand volume
4 additional market trends, 3 additional growth drivers, and 2 additional restraints and challenges are covered in the full report. Contact sales@marketmindsadvisory.com to access the complete intelligence.

Segment CAGR and Growth Architecture

Segmentation follows product form and concentration class, because the form chosen governs decay behaviour, freight economics, dosing equipment requirements and the channel that can be served at all. Six classes cover the whole market, running from dilute household solution through industrial and high-strength liquid grades to the granular, tableted and stabilised solid product forms.
global-hypochlorite-bleaches-market-market-share-analysis-1787310861366

Calcium Hypochlorite Tableted Forms

Expanding at 6.6%, a full 1.50 times the market rate, because a tablet carries roughly ten times the available chlorine per unit shipped weight that dilute solution manages and it does not decay meaningfully in ordinary warehouse storage conditions. That combination reaches customers whom liquid supply cannot serve economically at any price: small municipal systems, remote industrial sites and pool operators spread across genuinely dispersed geographies. Dosing equipment is neither costly nor complicated to install, which removes the usual barrier to conversion entirely. Producers holding tableting capability capture this demand outright, while those without it simply watch the fastest growing part of this market develop entirely beyond their commercial reach.
CAGR 6.6%

Stabilised and Specialty Hypochlorite Formulations

Growing at 6.0% annually on formulations engineered for extended shelf life, reduced chlorate content or specific institutional and food processing duty where verification requirements govern the specification. Lower chlorate grades matter here because municipal by-product limits have now tightened considerably and standard commercial product no longer passes at all in several jurisdictions. Food processing sanitation demands documented available chlorine at point of use rather than at delivery, which puts a real premium on the stability that ordinary commercial solution cannot provide. Formulation and packaging capability rather than upstream chlorine access is what defines this segment, which is exactly why specialty hygiene companies compete here successfully against chlor-alkali producers many times their size.
CAGR 6.0%
Full segment breakdown across 6 segments available in the complete report.

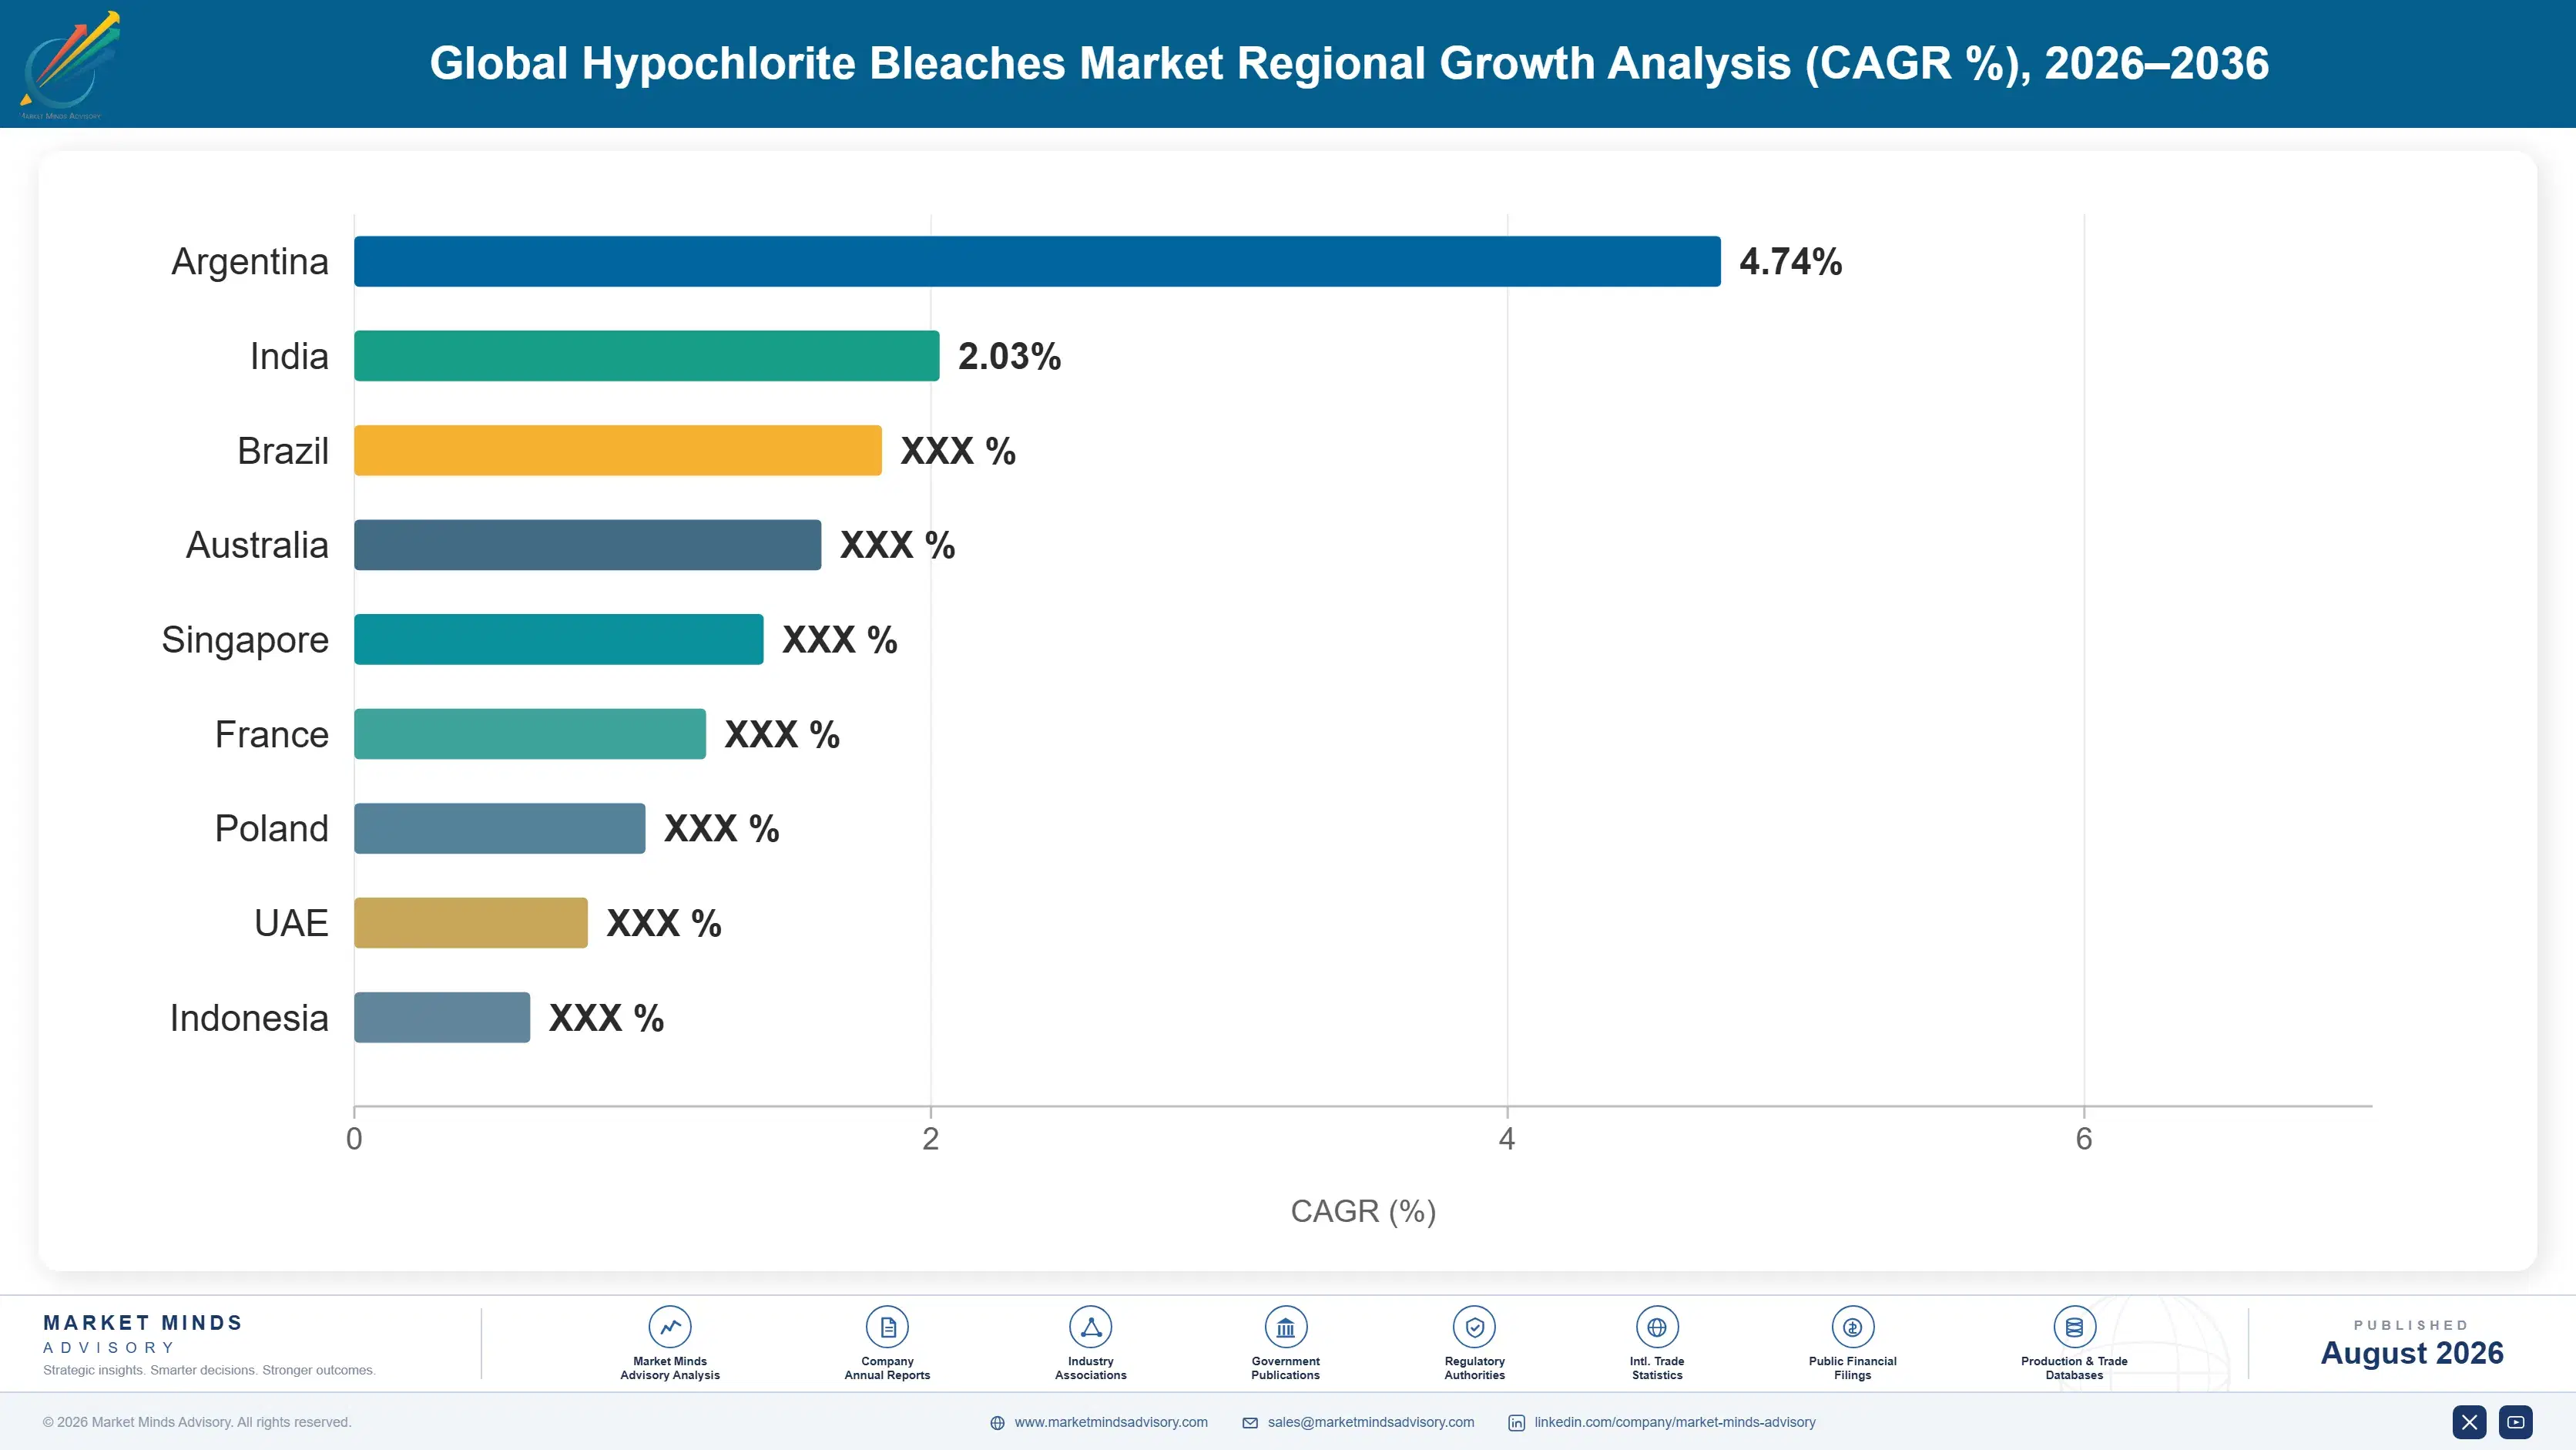
Regional Architecture and Country Demand Map

Hypochlorite production has to sit inside a tight delivery radius of roughly 250 kilometres from every customer it serves, so the regional picture simply reflects where chlor-alkali capacity and treated water demand happen to coincide rather than reflecting any pattern of international trade at all.

East Asia

Thirty-two percent of global value here, comfortably the largest regional share, because Chinese chlor-alkali capacity is the world's largest by a wide margin and because municipal water treatment investment right across the region consumes disinfectant at a scale that no other market comes close to matching. Note: this exceeds the standard regional band because chlorine capacity and treated water volume coincide here far more completely than anywhere else in the world. Japanese and Korean producers hold specialty and low-chlorate grade positions serving demanding electronics and food processing customers. Growth of 5.3% runs above the global rate, supported by continued Chinese wastewater treatment commissioning and by rising institutional hygiene demand together.
Share: 32% | CAGR: 5.3% (2026 to 2036)

North America

Twenty-four percent of global value here, weighted heavily toward municipal water treatment, a very large pool and spa channel, and institutional hygiene supply moving through specialist distribution channels. Gulf Coast chlor-alkali integration gives producers here comfortably the best cost position anywhere in the market, though the 2021 Texas winter storm demonstrated quite how concentrated that chlorine capacity actually is in practice. Regional bleach packagers operate inside tight delivery radii and they compete on service and responsiveness rather than on delivered price alone, doing so remarkably successfully. Growth of 3.8% here reflects mature municipal demand alongside pool channel volumes that track housing formation and discretionary spending far more than anything chemical.
Share: 24% | CAGR: 3.8% (2026 to 2036)
Regional intelligence for 5 additional markets available in the complete report: Western Europe, South Asia and Pacific, Latin America, Middle East and Africa, Eastern Europe. Contact sales@marketmindsadvisory.com.
global-hypochlorite-bleaches-market-country-cagr-analysis-1787310862232

Where hypochlorite margin genuinely survives

Four commercial positions separate the producers earning something real from those simply delivering water with chlorine in it inside a 250 kilometre circle. Each one of them rests on something a regional packager cannot easily copy: measurement discipline, a solid product form, real service capability at the utility, or an integrated chlorine position upstream.

Contract on delivered available chlorine at point of use

Customers order by the litre, pay freight on water and then find the drum has lost a tenth of its strength before it reaches the dosing pump, so they over-order and waste the difference. Producers contracting on available chlorine measured at point of use, with strength guarantees rather than shipment-date assays, realise roughly 22% above competitors quoting per litre. The measurement involved is straightforward and most of the data already exists inside the business. Almost nobody presents it commercially, which makes this the cheapest repricing available in the entire business.
Market Impact: Realises roughly 22% above litre-qu

Build tableting capability for distant and small system duty

A tablet carries roughly ten times the available chlorine per unit shipped weight and does not decay meaningfully in storage, which reaches customers that liquid supply cannot serve at any price. Producers with tableting capability earn roughly 40% more per unit of delivered available chlorine than they achieve on liquid supply into the same geography. The capital is modest against a chlor-alkali unit and the dosing equipment customers need is neither expensive nor complicated. Liquid-only producers simply cannot compete for that demand at all, whatever price they choose to offer.
Market Impact: Earns roughly 40% more per delivere

Sell the on-site generation service rather than fighting it

Large utilities installing on-site generation remove themselves from delivered bleach demand permanently, and resisting that outcome has cost suppliers accounts they will never recover. Producers offering the generation equipment supply, salt provision, maintenance and performance guarantees together as a service capture roughly 4 times the lifetime value of the delivered chemical contract they would otherwise lose entirely. It requires building a service organisation rather than running a tanker fleet. Very few chemical companies have been willing to reorganise themselves around that requirement, which leaves the commercial position remarkably open today.
Market Impact: Captures roughly 4 times the lifeti

Secure integrated chlorine supply before adding capacity

Chlorine and caustic together carry roughly 52% of delivered cost, and 68% of global output comes from producers generating their own chlorine rather than buying it merchant. Integrated producers run roughly 26% below merchant buyers on delivered cost, and that gap widens very sharply whenever chlor-alkali supply tightens, as it did right across the Gulf Coast in 2021. Adding packaging capacity without first securing the chlorine position has been the recurring mistake right across this industry. Merchant buyers end up as pure price takers in every tight market that arrives.
Market Impact: Runs roughly 26% below merchant chl

Who Controls the Margin Pool

Concentration is unusually low, with the top five holding just 19% of global hypochlorite production volume, the basis on which every participant here is assessed. Olin and Westlake lead through chlor-alkali integration and Gulf Coast scale rather than through any brand or technology position, while the remaining field spans regional bleach packagers operating inside tight delivery radii, pool and hygiene brand owners, and integrated producers in every major chlorine-producing country.
Competition currently runs on delivered cost inside a freight radius, service reliability and product form rather than on chemistry, which is identical everywhere. Regional packagers compete successfully against integrated majors on service and responsiveness, provided they can secure chlorine at a workable price. Product form capability, and tableting in particular, has become a genuine competitive dimension rather than a niche activity.

Emerging pressure comes from two directions at once. On-site generation removes large utility accounts permanently and favours whoever organises a service business around it rather than defending tanker deliveries. And tightened disinfection by-product limits reward producers able to supply low-chlorate grades, which shifts advantage toward those with better process control rather than the lowest delivered cost.
global-hypochlorite-bleaches-market-company-positioning-matrix-1787310863059

Competitive Moat and Risk Dimensions

OLIN

Moat: Chlor-alkali integration and scale

Ownership of substantial chlor-alkali capacity gives Olin chlorine at production cost while regional packagers buy it merchant, and that gap carries roughly a quarter of delivered cost in a market where nothing else differentiates the product. The advantage widens precisely when chlorine supply tightens, which is when merchant buyers become price takers with no alternative available.
OLIN

Risk: Delivery radius constrains reach

An integrated cost advantage travels only about 250 kilometres before decay and freight on dilute solution erase it entirely, which limits how much of the market that advantage can actually address. Regional packagers closer to distant customers win on delivered economics without any comparable chlorine position, and no amount of upstream scale changes that arithmetic.
WESTLAKE

Moat: Integrated chlorine and vinyls position

Chlorine production integrated across vinyls and chlor-alkali gives Westlake flexibility to direct chlorine toward whichever derivative earns most in a given period, which few hypochlorite producers can do. That optionality is worth a great deal in a market where hypochlorite pricing moves with chlorine availability rather than with any independent demand signal.
WESTLAKE

Risk: Limited product form breadth

A position weighted toward liquid sodium hypochlorite leaves the company exposed as tableted calcium hypochlorite takes the fastest growing demand in remote and small system duty, which liquid supply cannot serve economically. Tableting capability is modest capital rather than a technical barrier, but the commercial organisation required to sell into dispersed small accounts is quite different.

Players Tracked

Prominent Players

Olin
Westlake
Occidental Chemical
Tosoh
Nouryon

Other Key Players

Formosa Plastics
Hawkins
Kuehne Chemical Company
Arxada
Innovative Water Care
KIK Consumer Products
Nippon Soda
Nankai Chemical
Aditya Birla Chemicals
DCM Shriram
Gujarat Alkalies and Chemicals
AGC Chemicals
Ercros
Vynova
Syensqo

Recent Developments

JANUARY 2025

Utility replaces delivered bleach with on-site generation

A large municipal water utility commissioned on-site hypochlorite generation equipment across several of its treatment works, removing itself permanently from delivered chemical demand on the combined grounds of chemical handling safety, measured storage decay losses and the recurring operating cost of tanker deliveries across several sites.
Signal: On-site generation removes large utility a
MAY 2025

Producer commissions calcium hypochlorite tableting capacity

A hypochlorite producer commissioned new calcium hypochlorite tableting capacity aimed squarely at small municipal systems and remote industrial duty, targeting customers whose distance from any liquid supply point made delivered solution economics entirely unworkable regardless of the price offered at the plant gate itself instead.
Signal: Solid product form is now reaching demand
OCTOBER 2025

Tightened chlorate limits force low-chlorate grade qualification

Tightened municipal disinfection by-product limits introduced across several jurisdictions required affected water utilities to qualify low-chlorate hypochlorite grades specifically, which favoured producers holding sufficient process control to keep chlorate levels well below what standard commercial product typically delivers at the point of sale to utilities.
Signal: Process control rather than delivered cost

Chlorine and caustic cost exposure

Chlorine and caustic soda together account for roughly 52% of delivered hypochlorite cost, sourced either from integrated chlor-alkali units or bought merchant from a supplier base that is regionally concentrated everywhere. Packaging and containers contribute about 14%, freight around 13% given the water content shipped, conversion labour and utilities 9%, quality testing 4%, with working capital and decay losses carrying the remaining 8%.
Chlorine availability rather than price was the defining event of the forecast history. The February 2021 Texas winter storm, documented by the EIA, removed a large share of Gulf Coast chlor-alkali output for weeks and pushed derivative pricing to levels merchant buyers could not pass through. Olin Annual Report 2022 recorded the resulting chlor-alkali margin expansion directly, and Westlake Annual Report 2022 noted the same dynamic across its chlorovinyls business.

The competitive disadvantage mechanism runs entirely through chlorine access. Merchant buyers pay whatever integrated producers charge and become pure price takers whenever supply tightens, which is precisely when hypochlorite pricing rises. Producers without tableting capability additionally cannot reach the demand where freight economics favour solid product. Small regional packagers typically carry both limitations, which confines them to short-radius liquid supply where service is their only real defence.
global-hypochlorite-bleaches-market-cost-volatility-analysis-1787310863418

Secure chlorine supply agreements before adding packaging capacity

Adding bleach packaging capacity without a contracted chlorine position has been the recurring error in this industry, because the new asset then depends on merchant supply that tightens exactly when the market is worth serving. Negotiating a multi-year chlorine arrangement costs nothing beyond commercial discipline and it determines whether the investment ever earns anything at all.

Reduce shipped water through higher initial strength grades

Freight and decay losses together carry around a fifth of delivered cost, and both scale directly with how much water leaves the plant. Supplying higher initial strength solution, where the customer's dosing equipment can handle it, extends the profitable delivery radius meaningfully and requires no capital beyond dilution control discipline at the filling point.

Add tableting capability for demand beyond liquid reach

Tableted calcium hypochlorite reaches customers whose distance from any supply point defeats liquid economics regardless of price, which is a demand pool that liquid-only producers cannot address at all. Tableting capital is modest measured against a chlor-alkali unit, and it converts freight distance from an absolute commercial barrier into an ordinary cost line instead.

Portfolio Architecture for Margin Defence

Margin architecture separates by product form and by chlorine position rather than by customer type, which is not at all how most producers in this market organise their internal reporting. Dilute liquid sodium hypochlorite sold inside a tight delivery radius earns whatever the nearest competing packager allows, because the chemistry is identical between producers and service reliability is the only variable actually available.
Value climbs wherever the product form solves a problem that liquid supply cannot solve. Higher strength and stabilised grades defend modest premiums through extended shelf life and materially reduced customer waste. Tableted calcium hypochlorite sits considerably higher, since it reaches demand that liquid supply cannot address economically at all, and therefore competes against nothing except other tablets.

The highest value pools now concentrate where solid product form meets remote or small system duty, and where low-chlorate process control meets tightened municipal specifications. Those pools are modest measured in tonnage and quite disproportionate in realised margin terms. The commercial tension is that liquid volume keeps filling lines and tanker fleets loaded while contributing almost nothing toward the capability that actually opens anything above it.

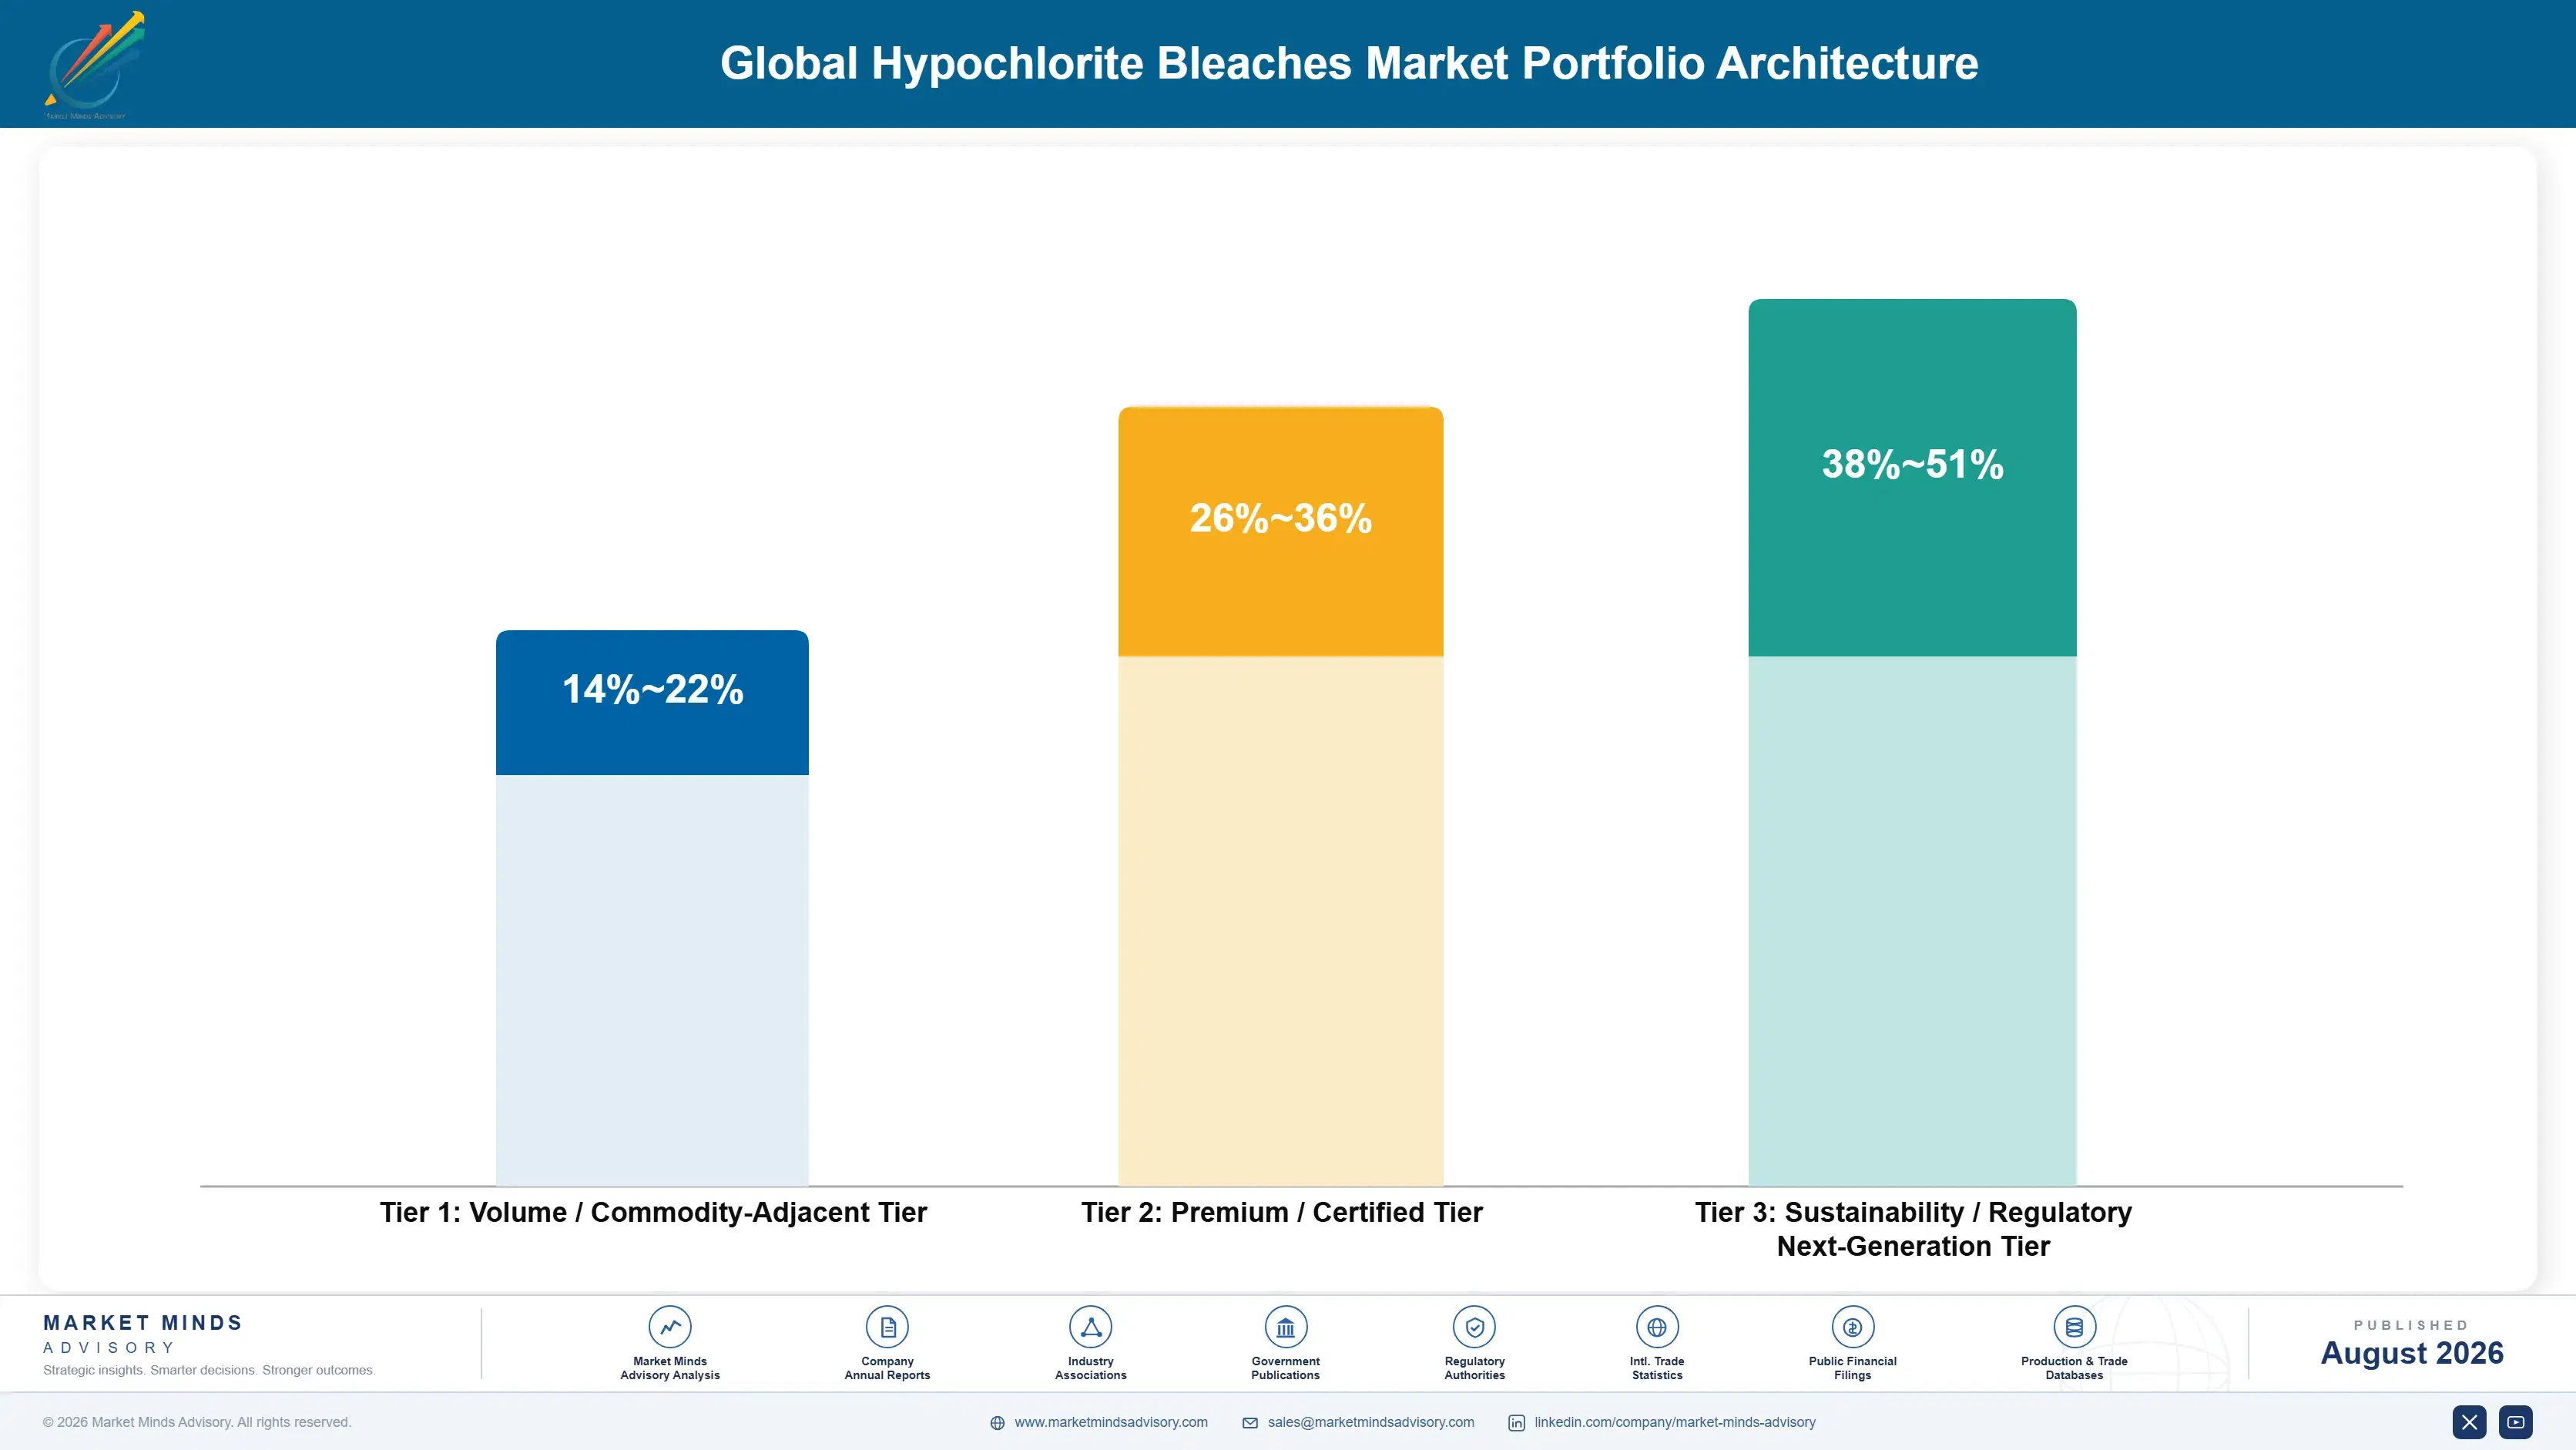
Volume / Commodity-Adjacent Tier

Dilute and industrial sodium hypochlorite solution supplied inside tight delivery radii into municipal, industrial and household duty, where chemistry is identical between producers and delivered service decides nearly every award made.
Gross Margin: 14-22%

Premium / Certified Tier

High-strength solution, granular calcium hypochlorite and branded institutional and pool product supplied with packaging and shelf life guarantees. Form and reliability defend pricing here. The ten-point range reflects bulk supply against packaged branded positions.
Gross Margin: 26-36%

Sustainability / Regulatory / Next-Generation Tier

Tableted calcium hypochlorite, low-chlorate grades and stabilised specialty formulations serving remote duty and tightened municipal specifications. Form advantage and process control defend pricing strongly. The thirteen-point range reflects established tablets against emerging low-chlorate economics.
Gross Margin: 38-51%
global-hypochlorite-bleaches-market-portfolio-architecture-1787310864288

High-value Sub-segments and Strategic Watch-out

Tableted calcium hypochlorite for remote duty

High value and genuinely high growth together here, because a tablet reaches customers whose distance from any liquid supply point makes solution economics unworkable at any price, so it competes against nothing at all except other tablets. Realised margin reflects that position very directly indeed.
Gross Margin: 38-51%

Low-chlorate grades for municipal specification

Strong realised value on genuinely steady underlying growth, because the tightened disinfection by-product limits now exclude standard commercial product outright in several jurisdictions, and holding the chlorate low across a full commercial batch demands process control that a great many producers simply do not have today.
Gross Margin: 34-46%

Dilute liquid sodium hypochlorite supply

The volume core of this entire market, keeping filling lines and tanker fleets properly loaded while earning whatever the nearest competing packager happens to permit on chemistry identical everywhere. Necessary for basic operating scale, but this tier funds nothing whatsoever above itself and never will.
Gross Margin: 14-22%

On-site generation displacement across utility accounts

The strategic watch-out running right across this whole market, given that utilities installing their own generation equipment leave the delivered demand pool permanently rather than temporarily, and that those accounts between them represent much of the largest single application found in the entire market today.
Gross Margin: 10-30%

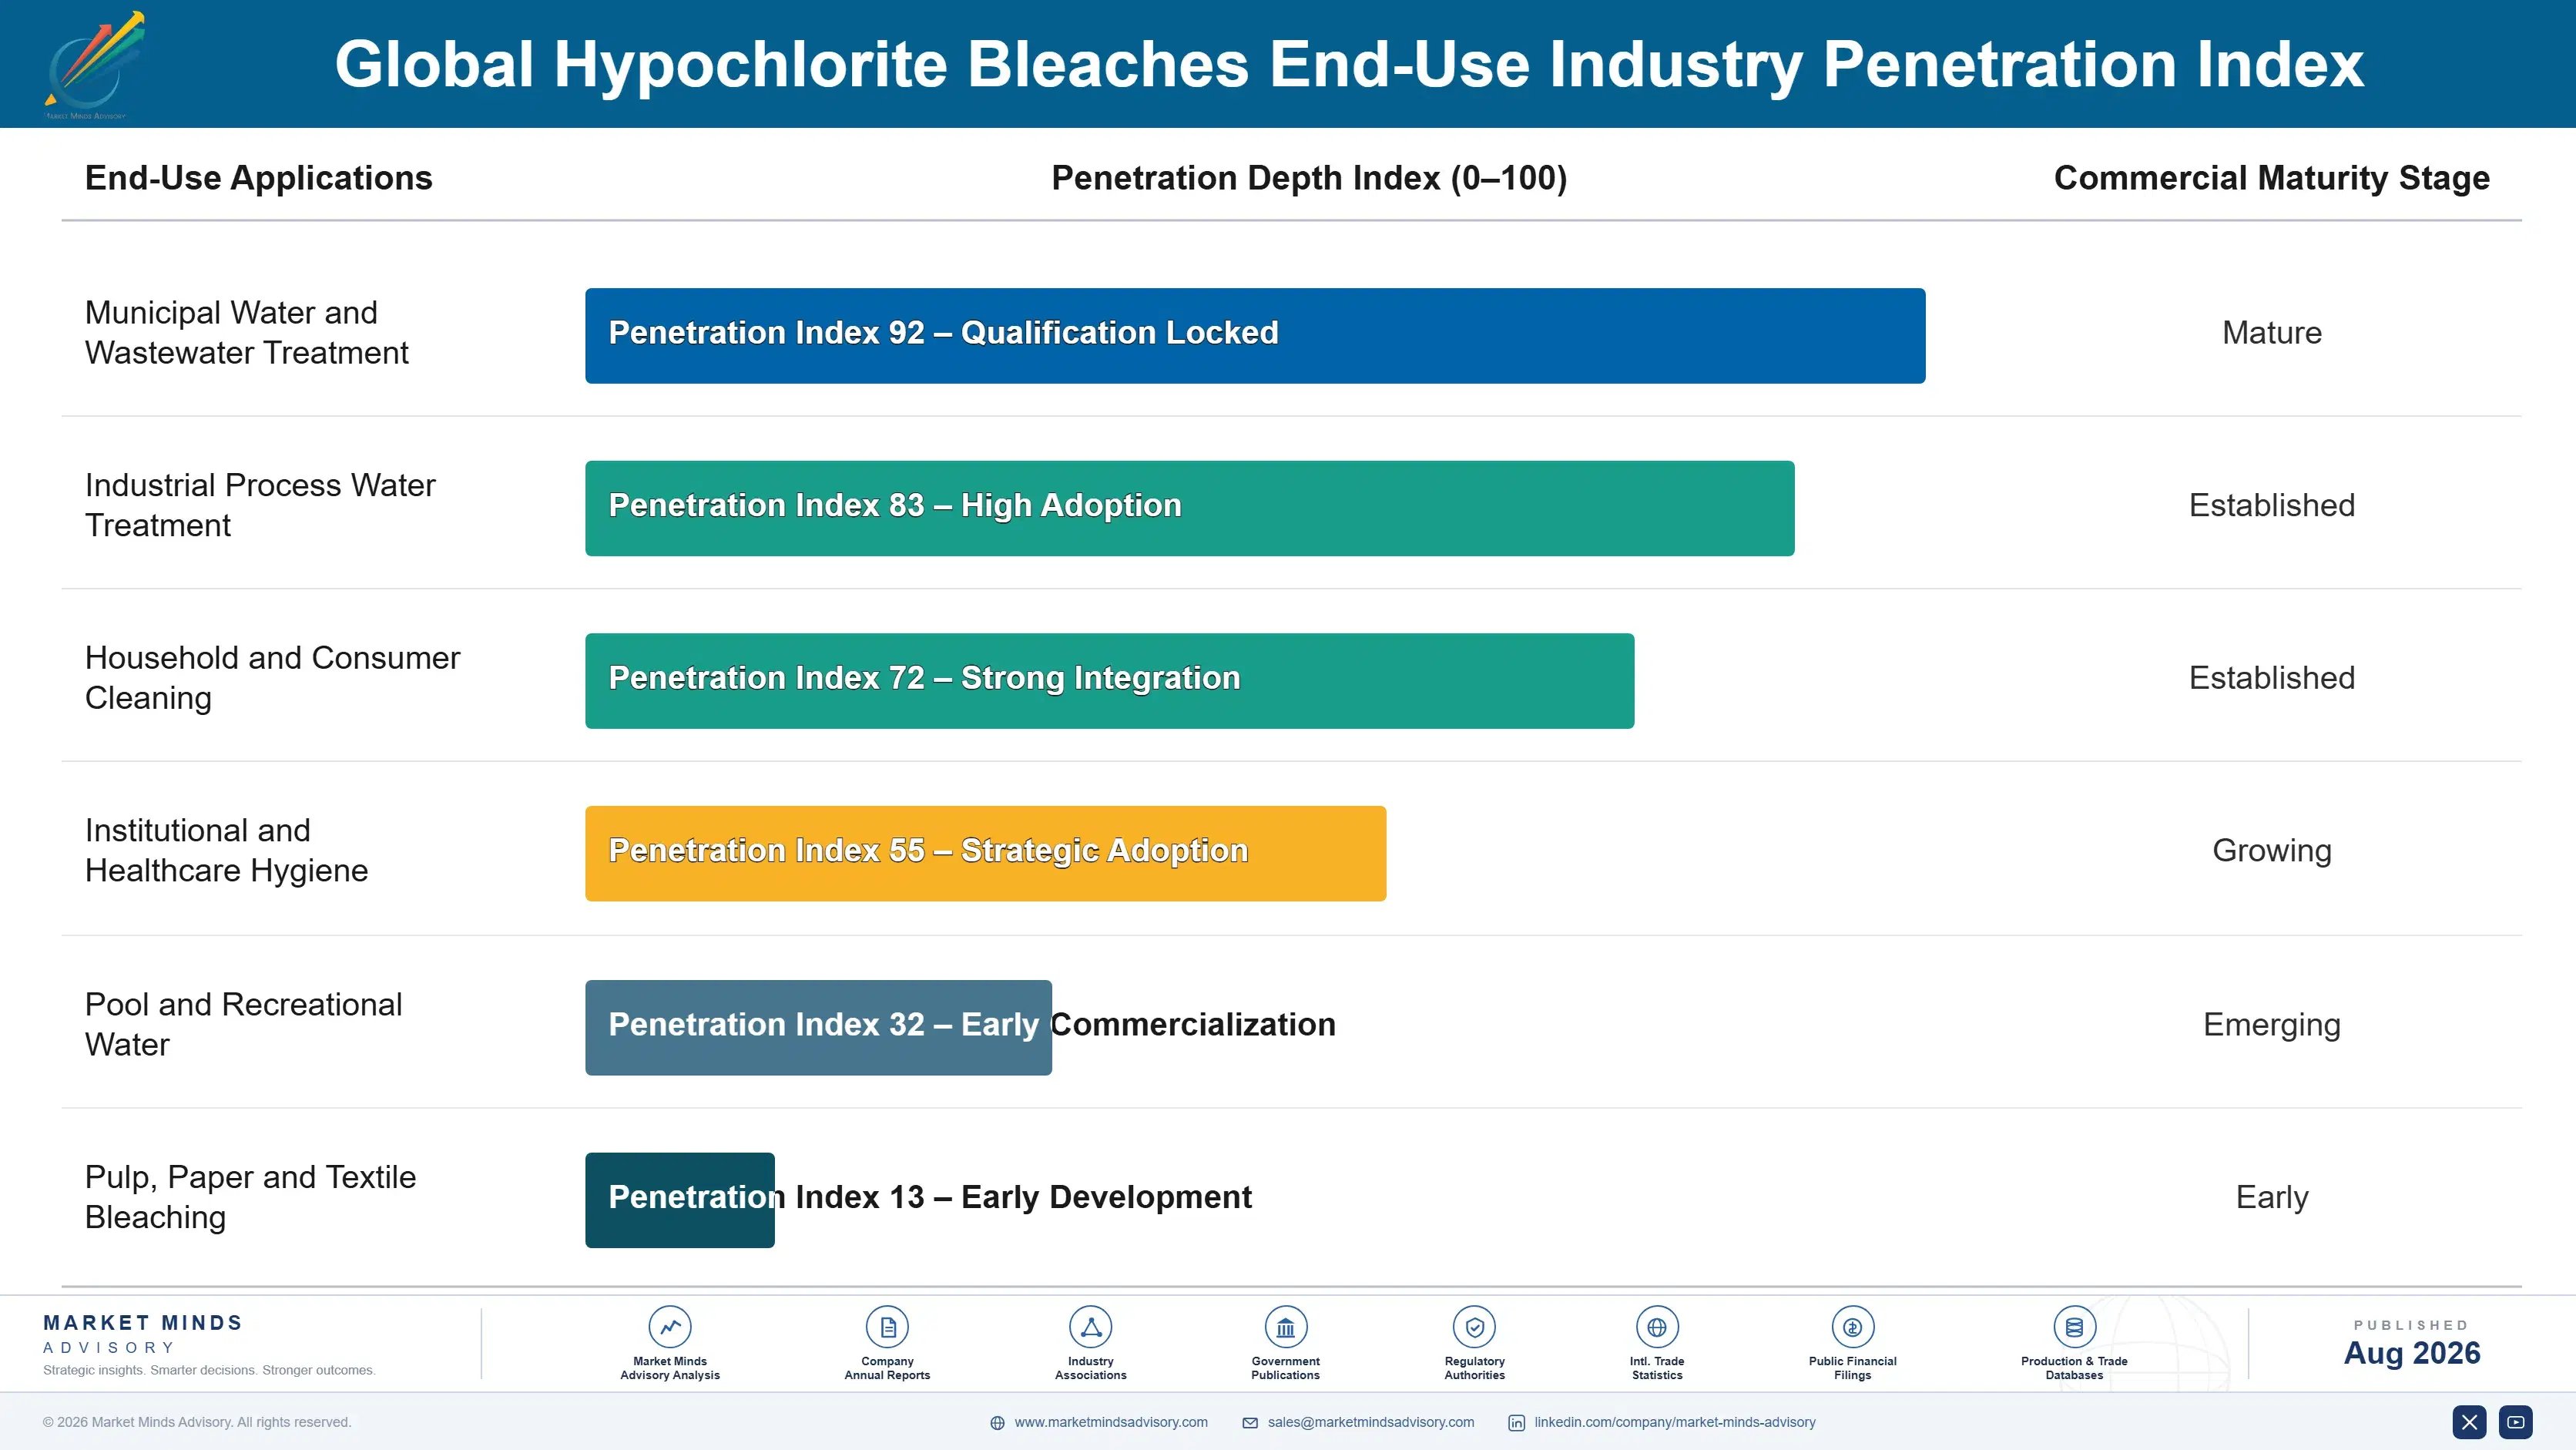
How hypochlorite demand actually behaves

Demand is continuous, non-discretionary and geographically captive, which sounds excellent until you notice everybody else inside the delivery radius holds exactly the same position. A water utility doses every day and cannot stop, so volumes are genuinely predictable, but the product is identical between the three or four producers who can reach the site economically. That leaves service reliability and measurement credibility as the only real differentiators.
Stickiness varies with what the customer has invested in. Bulk liquid supply is loosest, switched on a delivered price comparison with no cost beyond a new purchase order. Branded institutional and pool product sits tighter, because packaging, dosing systems and specification documentation sit inside the customer's procedures. On-site generation is the extreme case in reverse, since a utility installing it leaves the delivered market permanently rather than switching suppliers.

The buyer profile splits between institutional and consumer channels in ways that defeat any single commercial model. Municipal and industrial buyers tender on delivered cost per unit of available chlorine and evaluate service records over multi-year contracts. Institutional and consumer channels buy on brand, packaging convenience and shelf presence, where the chlorine cost inside the product is close to irrelevant to the purchasing decision.
global-hypochlorite-bleaches-market-end-use-penetration-index-1787310865061

What we would actually do here

These are among the four positions where our research anticipates prominent divergence between winners and laggards over the coming forecast period. Each is grounded in the demand model, the regulatory perimeter, and the announced capacity pipeline.
01 / AVAILABLE CHLORINE CONTRACTING

Sell measured strength at the dosing pump instead

Customers order by the litre, pay freight on water and then discover the drum has lost a tenth of its strength before reaching the dosing pump, so they over-order and waste the difference every time. Producers contracting on available chlorine measured at point of use realise roughly 22% above competitors quoting per litre delivered. The measurement involved is straightforward and most of the data already exists inside the business, which makes this comfortably the cheapest repricing available anywhere in the whole business.
02 / TABLETED FORM CONVERSION

Reach the customers liquid supply cannot serve at all

A tablet carries roughly ten times the available chlorine per unit shipped weight and does not decay meaningfully in storage, which together reach demand that dilute solution cannot address at any offered price at all. Producers with tableting capability earn roughly 40% more per unit of delivered available chlorine than they achieve on liquid into the same geography. The capital involved is modest measured against a chlor-alkali unit, and liquid-only producers simply cannot compete for that demand whatever price they offer.
03 / ON-SITE GENERATION SERVICE

Own the technology that is taking your accounts

Large utilities installing their own on-site generation leave delivered bleach demand permanently, and resisting that outcome has already cost suppliers accounts they will never win back again. Producers offering equipment supply, salt provision, maintenance and performance guarantees as a service capture roughly 4 times the lifetime value of the delivered chemical contract they would otherwise lose outright. It needs building a service organisation rather than running a tanker fleet, which is precisely why the position remains so remarkably open today.
04 / CHLOR-ALKALI INTEGRATION POSITION

Contract the chlorine before building anything else

Chlorine and caustic carry roughly 52% of delivered cost, and 68% of global output comes from producers generating their own rather than buying merchant. Integrated producers run roughly 26% below merchant buyers, and the gap widens sharply whenever chlor-alkali supply tightens as it did across the Gulf Coast in 2021. Adding packaging capacity without securing the chlorine position first is the recurring mistake in this industry, because merchant buyers end up as pure price takers in every tight market that arrives.

Engagement Snapshot From the Field

A live engagement with an industry participant carrying material or product regulatory and market exposure ahead of a defining policy shift, showing how our research translates into a defensible multi-year portfolio strategy.
MARKET MINDS ADVISORY · CLIENT ENGAGEMENT SUMMARY
Global Hypochlorite Bleaches Producer Strategic Portfolio Review and Transition Roadmap 2026·Investment Scenario on Global Hypochlorite Bleaches Exposure Evaluation 2025-26
CLIENT PROFILE
A regional hypochlorite producer operating three filling and blending sites, supplying municipal water utilities, industrial process water accounts and a packaged institutional and pool business through distribution across a single large geography. Hypochlorite revenue approached USD 118 million annually (client-reported, unverified by MMA), roughly eighty percent of it bulk liquid sodium hypochlorite sold per litre delivered against competing packager quotations.
STRATEGIC CHALLENGE
Two large municipal accounts had been lost to on-site generation within eighteen months and management treated both as isolated events rather than a pattern. Margins on bulk liquid had compressed steadily and were attributed to competitor pricing. Chlorine was bought merchant under an annual arrangement that had never been examined against the delivered cost position of integrated competitors.
MMA APPROACH
We rebuilt delivered economics per unit of available chlorine at point of use rather than per litre at dispatch, quantified decay losses across the customer base, and reconstructed the two lost utility accounts through interviews with the utilities' operations managers rather than the procurement contacts the client normally dealt with. Merchant chlorine cost was benchmarked against integrated competitor positions independently.
KEY FINDINGS
  1. Customers were losing roughly a tenth of purchased available chlorine to decay before dosing, and neither party had ever measured or priced that loss.
  2. Both lost utility accounts cited chemical handling safety and storage losses rather than delivered price, which the client's account reviews had never recorded at all.
  3. Merchant chlorine cost sat well above integrated competitor positions and the annual purchase arrangement contained no protection whatsoever against a supply tightening event.
  4. No tableting capability existed anywhere in the business despite a third of the served geography sitting beyond workable liquid delivery economics entirely.
CLIENT PROFILE
A regional hypochlorite producer operating three filling and blending sites, supplying municipal water utilities, industrial process water accounts and a packaged institutional and pool business through distribution across a single large geography. Hypochlorite revenue approached USD 118 million annually (client-reported, unverified by MMA), roughly eighty percent of it bulk liquid sodium hypochlorite sold per litre delivered against competing packager quotations.
STRATEGIC CHALLENGE
Two large municipal accounts had been lost to on-site generation within eighteen months and management treated both as isolated events rather than a pattern. Margins on bulk liquid had compressed steadily and were attributed to competitor pricing. Chlorine was bought merchant under an annual arrangement that had never been examined against the delivered cost position of integrated competitors.
MMA APPROACH
We rebuilt delivered economics per unit of available chlorine at point of use rather than per litre at dispatch, quantified decay losses across the customer base, and reconstructed the two lost utility accounts through interviews with the utilities' operations managers rather than the procurement contacts the client normally dealt with. Merchant chlorine cost was benchmarked against integrated competitor positions independently.
KEY FINDINGS
  1. Customers were losing roughly a tenth of purchased available chlorine to decay before dosing, and neither party had ever measured or priced that loss.
  2. Both lost utility accounts cited chemical handling safety and storage losses rather than delivered price, which the client's account reviews had never recorded at all.
  3. Merchant chlorine cost sat well above integrated competitor positions and the annual purchase arrangement contained no protection whatsoever against a supply tightening event.
  4. No tableting capability existed anywhere in the business despite a third of the served geography sitting beyond workable liquid delivery economics entirely.
RECOMMENDED STRATEGY
Phase 1: Phase one: reprice every municipal and industrial contract on available chlorine measured at point of use rather than litres delivered at dispatch. Phase 2: Phase two: establish an on-site generation service offering, targeting the four largest remaining utility accounts before they reach the same decision independently. Phase 3: Phase three: commission tableting capacity aimed at the remote geography that current liquid delivery economics cannot profitably reach at all.
OUTCOME
The client repriced its municipal contracts on available chlorine and won a generation service agreement with its largest remaining utility. Realised margin on municipal volume improved by 18% (client-reported, unverified by MMA) against the prior year, and no further utility accounts were lost to generation during the period.

Frequently Asked Questions

Foundational context covering the market sizes, CAGR, scope, country, region and competition that inform every finding below. This section is provided to cover basics and most often pre-purchase conversations, answered from the MMA Primary Research Dataset.

What is the current size of the Global Hypochlorite Bleaches Market?

The market is valued at USD 4.3 billion in 2025, rising to USD 4.49 billion in 2026. Sizing covers product sold to municipal, industrial, institutional and consumer channels at realised delivered price.

How large will the Global Hypochlorite Bleaches Market be by 2036?

The market reaches USD 6.91 billion by 2036, an increase of USD 2.42 billion across the forecast period. That represents an expansion multiple of 1.54 times the 2026 base.

What is the CAGR for the Global Hypochlorite Bleaches Market 2026 to 2036?

The base case CAGR is 4.4% across 2026 to 2036. The bull case reaches 5.6% on faster municipal investment, while the bear case sits at 3.2% under alternative disinfection substitution.

Which segment is growing fastest?

Tableted calcium hypochlorite grows fastest at 6.6%, a full 1.50 times the market rate. A tablet carries roughly ten times the available chlorine per shipped weight and does not decay in storage.

Who are the major companies in the Global Hypochlorite Bleaches Market?

Olin, Westlake, Occidental Chemical, Tosoh and Nouryon lead on production volume, holding just 19% collectively. The remaining field is mostly regional packagers and hygiene brand owners.

Which country is growing fastest?

India grows fastest at 7.2%, driven by municipal water and wastewater investment under national programmes alongside industrial process water demand rising steadily with regional manufacturing output.

Report Segmentation Architecture

The full report scope spans multiple orthogonal segmentation dimensions, with cross-tabulated demand data provided for each dimension pair. Coverage extends further to regional breakdowns, trend trajectories, and the competitive detail needed to support segment-level decision-making.

By Product Form and Concentration Class

  • Dilute Sodium Hypochlorite Solution
  • Industrial Sodium Hypochlorite Solution
  • High-Strength Sodium Hypochlorite
  • Calcium Hypochlorite Granular and Powder
  • Calcium Hypochlorite Tableted Forms
  • Stabilised and Specialty Formulations

By End-Use Industry

  • Municipal Water and Wastewater Treatment
  • Industrial Process Water Treatment
  • Household and Consumer Cleaning
  • Institutional and Healthcare Hygiene
  • Pool and Recreational Water
  • Pulp, Paper and Textile Bleaching

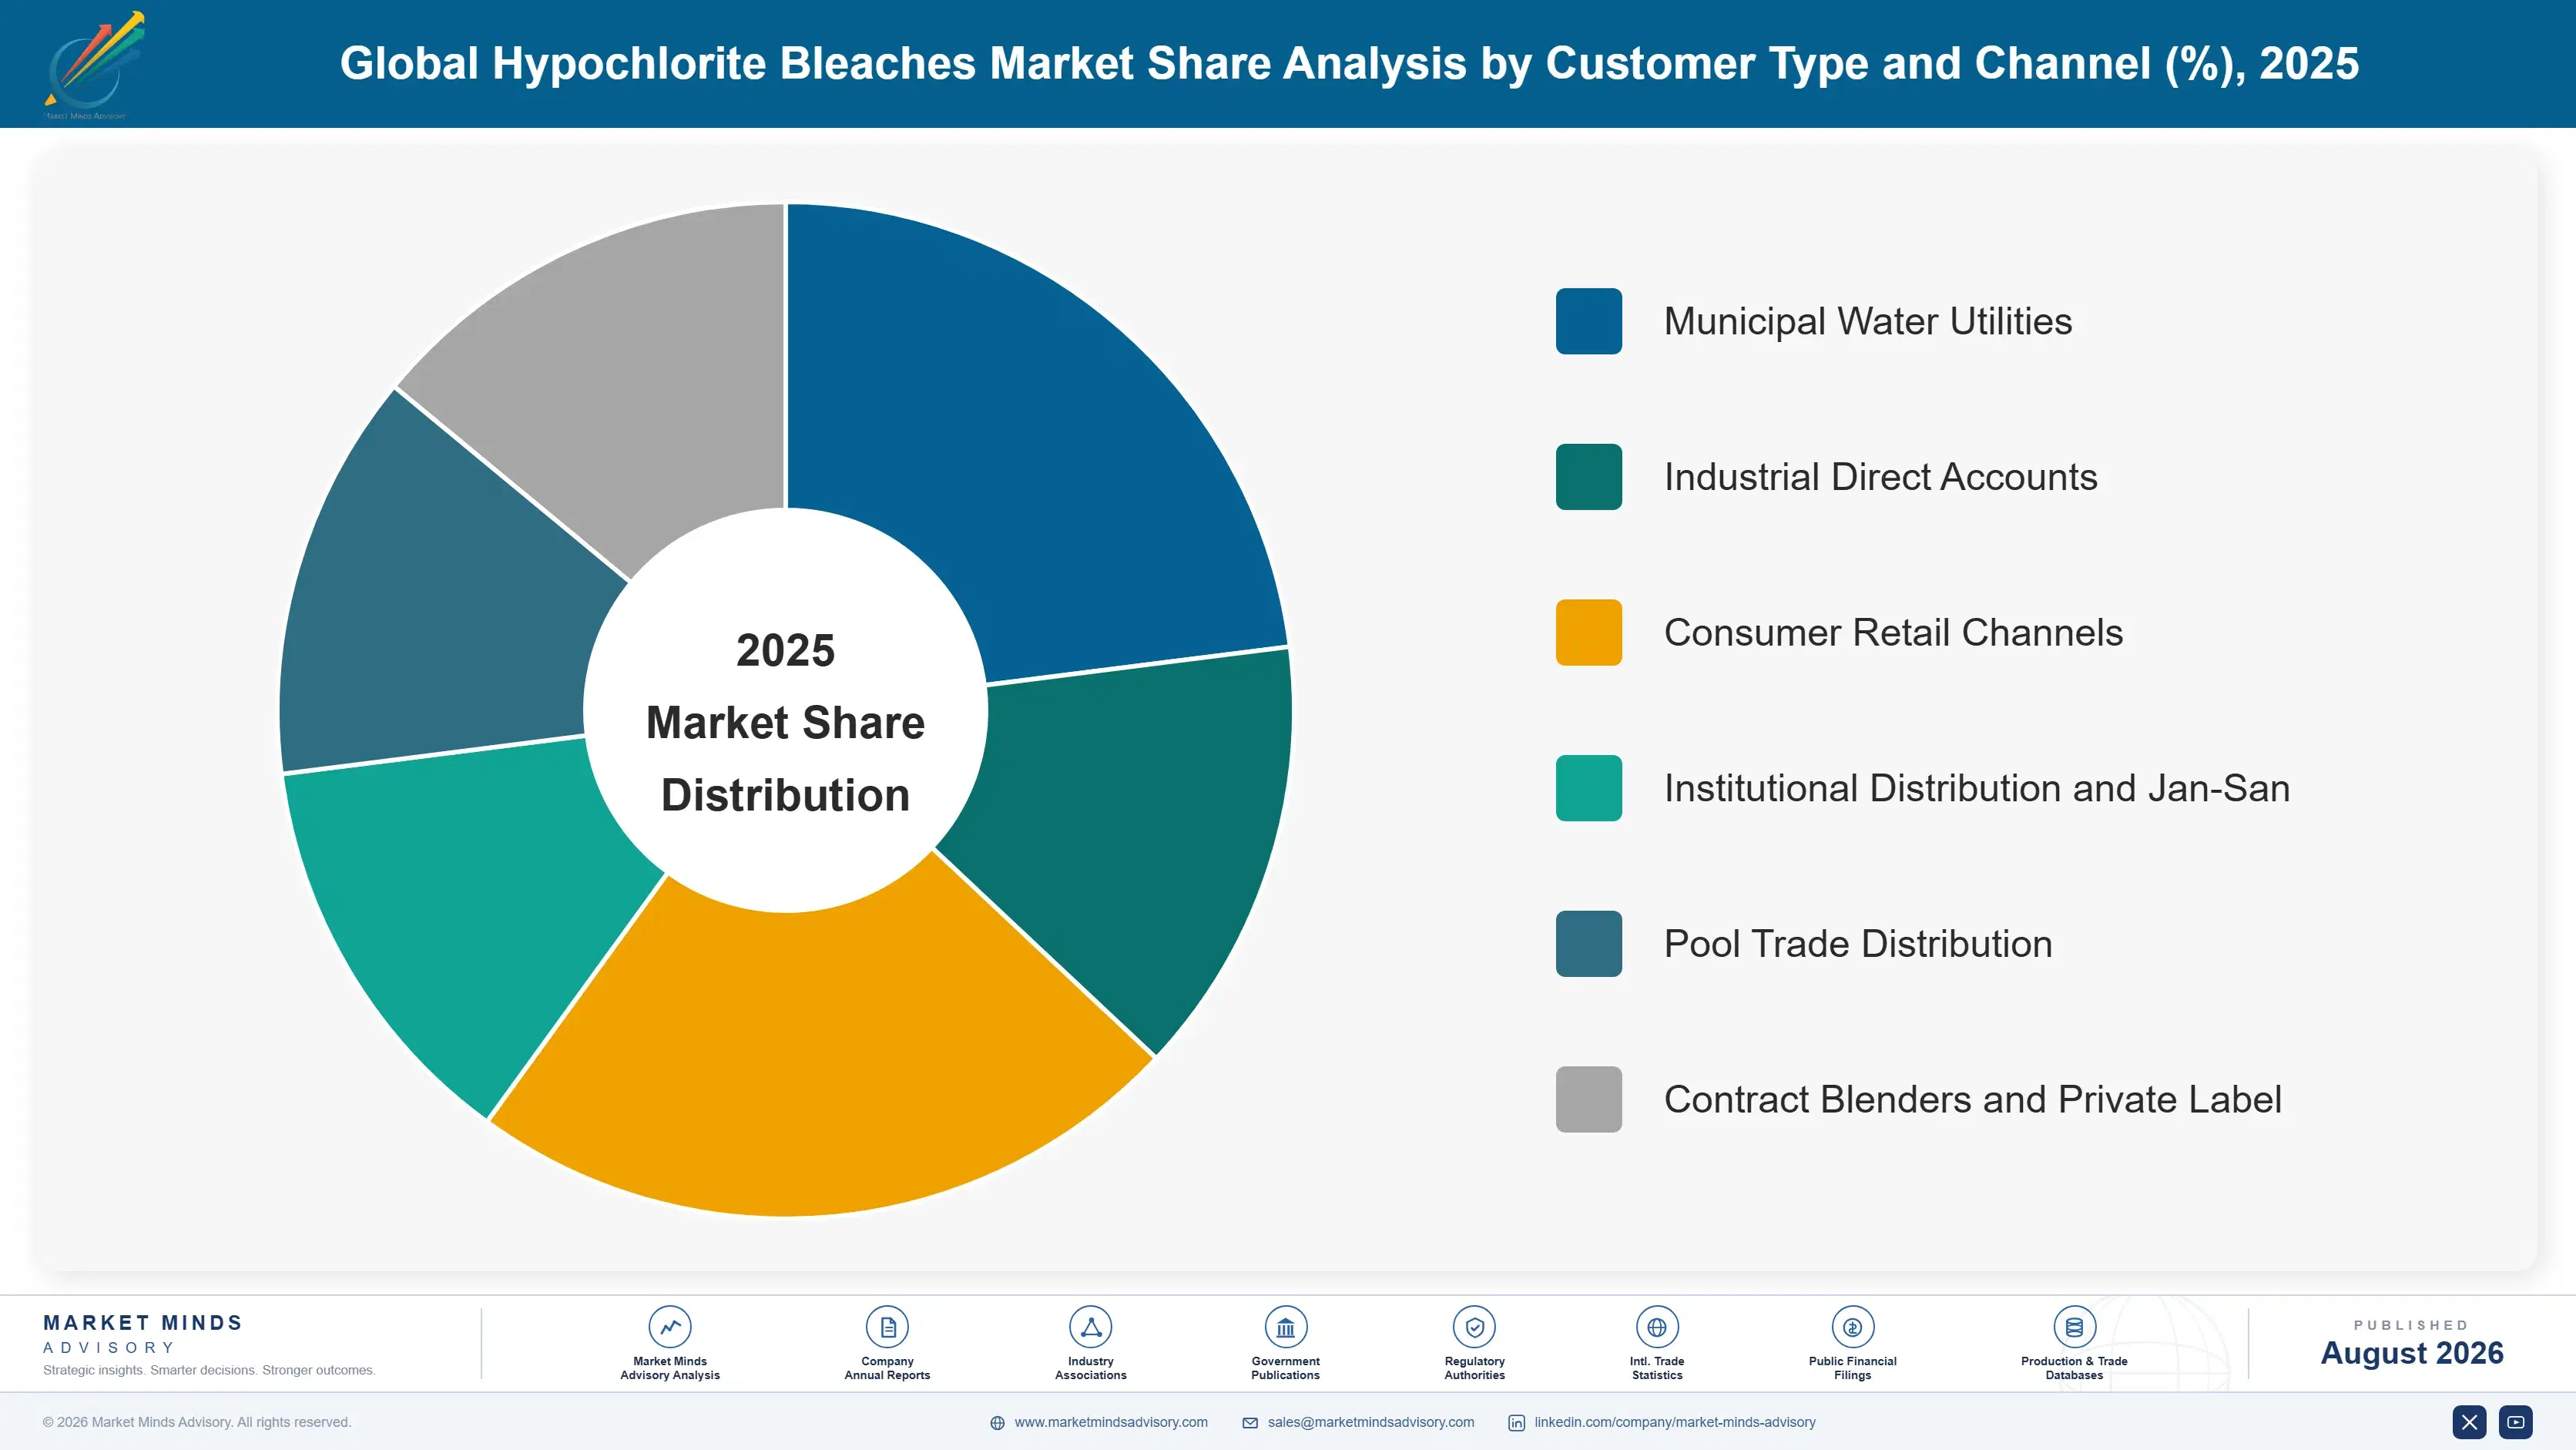
By Customer Type and Channel

  • Municipal Water Utilities
  • Industrial Direct Accounts
  • Consumer Retail Channels
  • Institutional Distribution and Jan-San
  • Pool Trade Distribution
  • Contract Blenders and Private Label

By Region

  • North America
  • Western Europe
  • East Asia
  • South Asia and Pacific
  • Latin America
  • Middle East and Africa
  • Eastern Europe

Scope, Methodology, and Coverage

Every figure in this report is reproducible from documented input assumptions. The scope below maps the historical period, the forecast horizon, the segmentation dimensions, and the countries covered, alongside the underlying primary and qualitative methodology.
Historical Period
2020 to 2025
Forecast Period
2026 to 2036
Base Year
2025 (USD billions; MMA Primary Research Dataset, August 2026)
Market Definition
The market comprises sodium and calcium hypochlorite bleach products, spanning dilute sodium hypochlorite solution, industrial sodium hypochlorite solution, high-strength sodium hypochlorite, granular and powdered calcium hypochlorite, tableted calcium hypochlorite, and stabilised or specialty hypochlorite formulations. Sizing captures product revenue at realised delivered price across municipal water and wastewater treatment, industrial process water treatment, household and consumer cleaning, institutional and healthcare hygiene, pool and recreational water, and pulp, paper and textile bleaching applications. Chlorine gas and chlorine dioxide, chlorinated isocyanurates, hydrogen peroxide and peracetic acid, on-site generation equipment sold as capital goods, and formulated cleaning products containing hypochlorite as one ingredient all fall outside scope.
Quantitative Units
USD billions (current prices); product shipped annually in millions of tonnes; USD per tonne at realised delivered price on an available chlorine basis
Segmentation Dimensions
By Product Form and Concentration Class; By End-Use Industry; By Customer Type and Channel; By Region
Regions Covered
North America, Western Europe, East Asia, South Asia and Pacific, Latin America, Middle East and Africa, Eastern Europe
Countries Covered
USA, Canada, Mexico, UK, Germany, France, Italy, Spain, Netherlands, Belgium, Poland, Romania, Hungary, Turkey, China, Japan, South Korea, Taiwan, India, Singapore, Malaysia, Thailand, Vietnam, Indonesia, Australia, Brazil, Argentina, Colombia, Chile, Saudi Arabia, UAE, Egypt, Nigeria, Kenya, South Africa, and additional markets relevant to this sector
Key Companies Profiled
Olin, Westlake, Occidental Chemical, Tosoh, Nouryon, Formosa Plastics, Hawkins, Kuehne Chemical Company, Arxada, Innovative Water Care, KIK Consumer Products, Nippon Soda, Nankai Chemical, Aditya Birla Chemicals, DCM Shriram, Gujarat Alkalies and Chemicals, AGC Chemicals, Ercros, Vynova, Syensqo.
Quantitative Methodology
Primary survey, n=3,800 respondents, Q4 2025, six countries; demand-side model with trade association cross-validation
Qualitative Methodology
47 expert interviews, Q4 2025; applied to validate demand model assumptions, identify emerging dynamics, and assess competitive positioning
Report Format
PDF and XLSX data workbook (Word format preview document)
Publisher
Market Minds Advisory
Report Code
MMA-2026-CHM-578
Published
August 2026
Contact
sales@marketmindsadvisory.com | www.marketmindsadvisory.com

Purchase the full Global Hypochlorite Bleaches Market Report (2026 to 2036).

The full report sizes the global hypochlorite bleaches market across six product forms and concentration classes, six end-use industries, six customer channels and seven regions, with annual forecasts to 2036 in revenue and tonnage shipped. It rebuilds delivered economics per unit of available chlorine at point of use rather than per litre at dispatch, which is the analysis that establishes what decay losses are actually costing both parties. Twenty participants are assessed on a consistent production volume basis, with chlor-alkali integration mapped separately from filling capacity. On-site generation displacement is quantified utility market by utility market.
Six product forms sized and forecast annually to 2036
Delivered economics rebuilt on available chlorine at use
Twenty participants assessed on consistent production volume basis
Chlor-alkali integration mapped separately from filling capacity
On-site generation displacement quantified across utility markets
Decay losses measured across storage and delivery conditions

Built For The People Who Decide

From boardroom strategy to bench-side execution, this report is read cover-to-cover by leaders shaping the next decade of their industry, turning demand scenarios, market dynamics and valuation benchmarks into decisions.
CXOs/ Presidents/ VPs/ Managers
M&A and Corporate Development
Strategy Teams and R&D Heads
Procurement and Product Directors
Regulatory and Compliance Leaders
Investor Relations and Equity Analysts