Market Minds Advisory
Global High Temperature Ceramics Market

Global High Temperature Ceramics Market: Structural and Thermal Materials Across Industrial and Aerospace Applications, 2026 to 2036

Firing a ceramic consumes 22% of what it costs to make and grinding it afterwards takes another 24%, which is why the industry's real economics sit in yield rather than in materials science.

Lead Analyst

Bilal Shaikh

Published

September 2026

Make Smarter Decisions with Customized Research Insights

Request a free sample report and evaluate market opportunities, growth trends, and competitive dynamics relevant to your business needs.

2025 MARKET VALUE$12.8BMarket Size 2025
2036 FORECAST VALUE$27.5BBase Case , 2026 to 2036
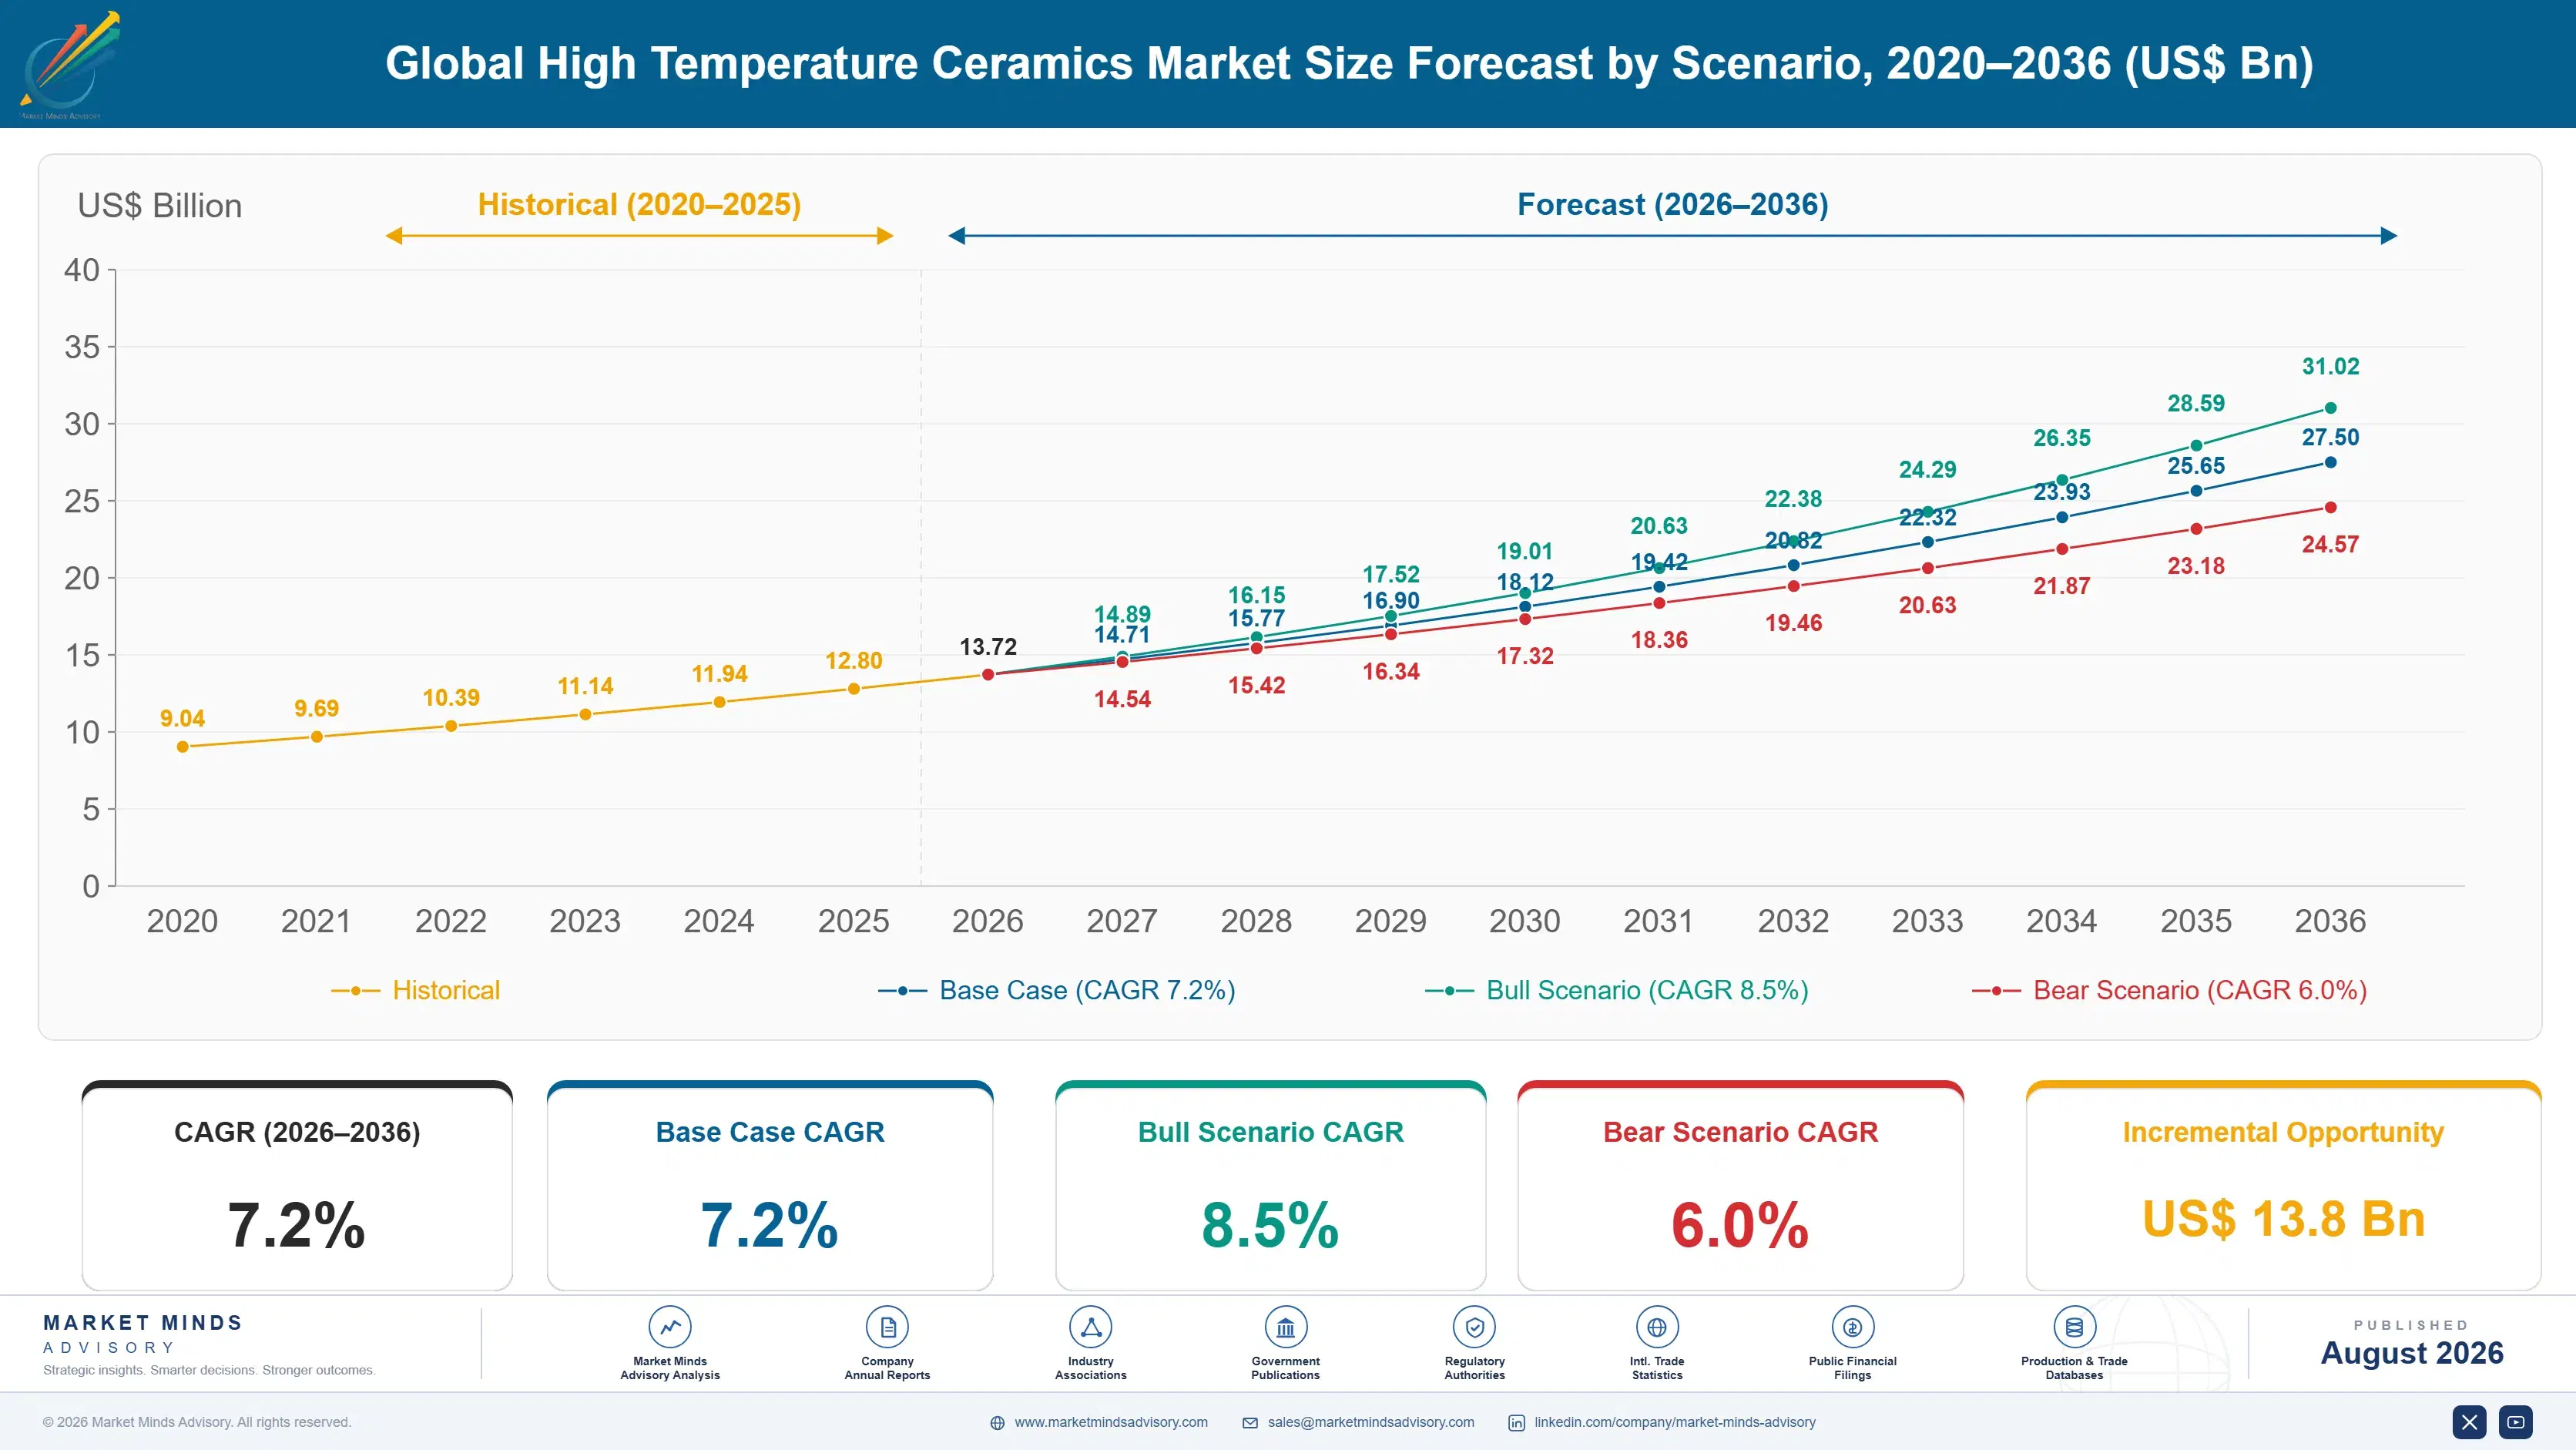
CAGR 2026 TO 20367.2 %Bull 8.5% / Bear 6.0%
INCREMENTAL OPPORTUNITY$13.8BNet 10- year value creation
EXPANSION MULTIPLE2.00x2036 value over 2026 base
Strategic Levers
M&A Pipeline
Regional Outlook
Country Rankings
Competitive Intelligence
Segmental Deep-dive
Call-Us : 91 93563 13602

Executive Snapshot and Market Trajectory

Advanced ceramics are sold as a materials science business and run as a manufacturing yield business. Only 82% of formed parts survive sintering and finishing, furnace energy takes 22% of cost and diamond grinding another 24%, so the money is made or lost long after the chemistry is settled.
Growth concentrates in ceramic matrix composites, expanding at 10.8%, where silicon carbide fibre reinforcement delivers the fracture toughness that monolithic ceramics never had and lets turbine hot sections run hotter than any superalloy permits. East Asia holds 34% of value, above the band this report applies elsewhere, because Japanese semiconductor and electronic ceramics capability sits alongside Chinese production scale in a combination no other region matches.
The supplier base is moderately concentrated, with the top five holding 39% of component revenue, and positions are defended by qualification history rather than by any formulation secret. Competition runs on yield, dimensional capability and delivered reliability rather than on material composition, which is largely published and freely available. Energy cost is what decides which producing regions remain viable at all, and it has already relocated the volume end of this industry.
Market Definition
The market comprises advanced technical ceramics engineered for service above conventional metallic temperature limits, spanning ceramic matrix composites, silicon carbide and silicon nitride structural ceramics, aluminium nitride and thermal management ceramics, zirconia and toughened ceramics, alumina technical ceramics, and refractory oxide and monolithic ceramics. Sizing captures finished component and shape revenue at realised delivered price across aerospace, energy, semiconductor, industrial processing, automotive and medical applications. Ceramic raw powders sold as material, glass and glass-ceramics, traditional whiteware and sanitaryware, ceramic coatings applied as thin films, and forming and sintering equipment fall outside scope.
Base Year Value
$12.8B in 2025 (MMA Primary Research Dataset, August 2026)
Forecast Period
2026 to 2036, eleven discrete annual values
CAGR
7.2% base case. Bull 8.5%. Bear 6.0%.
Fastest Growth Segment
Ceramic Matrix Composites: 10.8% CAGR
Fastest Growth Country
India: 9.8% CAGR
Fastest Growth Region
South Asia and Pacific: 9.3% CAGR
Largest Region
East Asia: 34% of 2025 global value
Market Leaders
Kyocera, CoorsTek, CeramTec, Morgan Advanced Materials, NGK Insulators. Source: MMA Analysis based on company annual reports.
Primary Survey
n=3,800 procurement and R&D decision-makers, Q4 2025, six countries
Methodology
Demand-side build-up, cross-validated against public data, 47 expert interviews

Global High Temperature Ceramics Market Forecast Scenarios

global-high-temperature-ceramics-market-size-forecast-scenario-1787310500967
Growth of 5.9% across 2020 to 2025 was held down by energy rather than by demand. European sintering costs rose to levels that made several product lines uneconomic through 2022 and 2023, and producers rationed furnace time toward higher-value work. Semiconductor ceramics demand meanwhile swung violently with the wafer cycle, reaching records in 2022 before falling sharply, which disguised steady underlying growth across aerospace and energy applications.
The base case at 7.2% rests on three mechanisms. Ceramic matrix composites move from limited hot section applications into broader turbine deployment as qualification programmes conclude and manufacturing cost falls with volume. Semiconductor equipment demand for high-purity ceramic components rises with the wafer capacity additions now underway across four separate regions. And industrial electrification of process heat requires ceramics that tolerate temperatures and thermal cycling no metallic solution survives economically.
The bull case at 8.5% turns on ceramic matrix composites entering commercial aviation at scale, which would multiply volume in a segment currently constrained by qualification rather than by demand. The bear case at 6.0% turns on energy. Sustained high industrial power prices in Europe would push production toward Asia permanently and remove capacity that regional aerospace and industrial customers currently depend on.

What Actually Determines Ceramic Component Value

The commercial reality of this industry sits downstream of everything that makes it interesting. Compositions are published, powders are purchasable, and forming methods are taught in materials engineering courses. What separates producers is that only 82% of formed parts survive sintering and finishing, and every part lost carries the full cost of powder, forming, furnace time and often several hours of diamond grinding before the defect appears. Yield is the whole business.
TOP FIVE SHARE39%Concentration of finished ceramic component revenue across largest producers
PEAK SERVICE TEMPERATURE1,650 degrees CelsiusContinuous operating ceiling for advanced structural ceramic components
SINTERING ENERGY SHARE22%Furnace energy share of finished component cost of goods
GREEN TO FIRED YIELD82%Share of formed parts surviving sintering and finishing without defects
DIAMOND MACHINING SHARE24%Post-sinter grinding and finishing share of component cost
AEROSPACE QUALIFICATION CYCLE26 monthsTime from material submission to flight hardware release approval
Energy and machining dominate the cost structure in a way few outside the industry appreciate. Sintering takes 22% of component cost and diamond grinding a further 24%, because a fired ceramic is too hard to machine by any conventional method and tolerances still have to be held. Near-net-shape forming is therefore worth far more than its technical description suggests.
Qualification decides who supplies the applications that pay properly. Aerospace hardware takes 26 months from material submission to flight release, semiconductor chamber components require particle and purity validation against tool performance, and both create positions that survive price competition entirely. Industrial refractory work has no equivalent barrier, which is exactly why it earns so much less.
"Every producer in this industry will talk about their material properties and almost none will tell you their yield, which is the only number that determines whether they make money. I have seen two plants running identical compositions on identical equipment thirty points apart on yield, and only one of them was profitable."
Director, Advanced Ceramics and Industrial Materials Practice · MMA Chemicals an

Market Trends

Ceramic Matrix Composites Move Into Turbine Hot Sections

Silicon carbide fibre reinforced composites solve the brittleness that kept monolithic ceramics out of rotating and load-bearing turbine hardware, and they operate several hundred degrees above the superalloys they replace while weighing roughly a third as much. Around 340 engine programmes now specify composite components in shrouds, liners and nozzles. Manufacturing remains slow and expensive, since fibre production, preform layup and melt infiltration each take a considerable amount of time. Cost falls steadily with volume, and qualification rather than demand is what currently limits how quickly this segment can scale.
Market Impact: Covers 2,700 furnace conversions co

Semiconductor Equipment Drives High-Purity Ceramic Demand

Plasma etch and deposition chambers require ceramic components with purity, particle performance and plasma erosion resistance that determine tool uptime directly, and each node transition tightens those requirements further. Semiconductor applications now account for roughly 19% of advanced ceramic component value. The demand is unusually profitable and unusually cyclical, swinging with wafer fab equipment spending in ways that make capacity planning difficult. Qualification at tool manufacturers is demanding and durable, and yttria and rare earth coated components command particularly strong pricing within it. Each node transition tightens the requirements again.
Market Impact: Operates at 1,650 degrees continuou

Market Opportunities and Growth Drivers

Industrial Process Heat Electrification Requires Ceramic Solutions

Electrifying industrial heat means heating elements, insulation and containment operating at temperatures and thermal cycling rates that metallic components simply do not survive economically. Roughly 2,700 industrial furnace conversions are underway or committed across chemicals, glass, metals and ceramics production. Each requires high temperature ceramic elements, insulation and structural components, and the specification work favours suppliers who understand furnace engineering rather than those who merely supply parts. This demand is genuinely new rather than a substitution of existing ceramic consumption, which makes it additive to everything else in the forecast.
Market Impact: Yield sits at 82% fired

Aerospace Programmes Qualify Ceramics For Weight Reduction

Engine efficiency improvements have exhausted what superalloy metallurgy can deliver, which leaves ceramics and composites as the remaining route to higher operating temperatures and lower weight. Components running at 1,650 degrees Celsius continuously are achievable in ceramic and not in metal at any cost. Qualification takes 26 months and costs a great deal, which is why programme positions once won are held for the entire airframe production life. Defence and commercial aviation programmes both push in the same direction, and neither is remotely price sensitive when weight is at stake.
Market Impact: Sintering is 22% of cost

Market Restraints and Challenges

Sintering Yield Losses Absorb Fully Committed Cost

Only 82% of formed parts survive sintering and finishing, and a part lost after firing and grinding carries every cost the process has already spent on it. The root cause is that ceramics fail from defects introduced during powder handling and forming that only become visible after densification, when nothing can be corrected. Commercially this decides which producers earn anything at all on a given part. Participants are responding with automated forming that removes handling variability, in-process inspection before firing, and near-net-shape forming methods that cut the grinding operations where late failures concentrate.
Market Impact: Covers 340 engine programmes specif

Energy Intensity Determines Regional Production Viability

Sintering takes 22% of component cost and runs furnaces at high temperature for extended cycles, which makes industrial electricity price a permanent competitive factor rather than a passing one. The root cause is thermodynamic: densifying a ceramic requires sustained energy that no process improvement removes entirely. Commercially it decides where production can survive, and European producers rationed furnace time toward high-value work through 2022 and 2023. Mitigation runs through furnace efficiency and heat recovery, campaign scheduling that fills kilns properly, and siting any new capacity where industrial power is genuinely cheap.
Market Impact: Reaches 19% of component value
3 additional market trends, 2 additional growth drivers, and 4 additional restraints and challenges are covered in the full report. Contact sales@marketmindsadvisory.com to access the complete intelligence.

Segment CAGR and Growth Architecture

Segmentation follows ceramic material class, which is the dimension determining achievable service temperature, fracture behaviour, processing route and realised component price together. End-use application cuts across most material classes without separating them commercially, since silicon carbide serves semiconductor and industrial customers alike, so end-use application belongs in demand analysis rather than in this primary hierarchy.
global-high-temperature-ceramics-market-market-share-analysis-1787310501501

Ceramic Matrix Composites

Growing at 10.8%, exactly 1.50 times the market rate, and the only ceramic class that solved the brittleness problem which kept the others out of load-bearing hot section hardware. Silicon carbide fibres in a silicon carbide matrix arrest crack propagation rather than allowing it, which delivers damage tolerance metals engineers will accept and permits operation several hundred degrees above superalloy limits at roughly a third the weight. Manufacturing remains slow and capital intensive across fibre production, preform layup and melt infiltration alike. Qualification running to 26 months rather than demand is what constrains growth here, and positions once won last for a programme's entire production life, which is measured in decades.
CAGR 10.8%

Silicon Carbide and Silicon Nitride Structural Ceramics

Expanding at 9.0% across semiconductor chamber components, bearings, seals, cutting tools and increasingly power electronics substrates, on a combination of hardness, thermal conductivity and thermal shock resistance that no oxide ceramic comes anywhere near matching. Silicon nitride bearings in electric vehicle motors have become a genuine volume application, since ceramic rolling elements avoid the electrical erosion that current passage causes in conventional steel bearings. Processing is genuinely demanding, requiring pressure-assisted sintering for the highest grades, and diamond finishing costs are heavy on every part produced. Qualification at semiconductor tool makers and bearing manufacturers is genuinely difficult, which keeps the competitive set narrow and the realised pricing well above oxide ceramics.
CAGR 9.0%
Full segment breakdown across 6 segments available in the complete report.

Regional Architecture and Country Demand Map

Regional value follows two quite separate things: where energy is affordable enough to fire ceramics economically, and where the qualified applications that pay properly happen to be located. The two coincide considerably less often than the industry would like, and that gap has been widening for several years.

East Asia

Thirty-four percent of value sits here, above the band this report applies to global markets. Note: the deviation is genuine, since Japanese electronic and semiconductor ceramics capability sits alongside Chinese production scale in a combination that no other region can match at present. Japanese producers hold the most demanding positions in semiconductor chamber components, aluminium nitride substrates and silicon nitride bearings, built on decades of qualification with tool and bearing manufacturers. Chinese capacity dominates alumina and silicon carbide volume production on energy costs that European producers cannot begin to approach. Korean demand serves semiconductor and display manufacture directly and at considerable scale. Growth of 8.2% runs above the global rate.
Share: 34% | CAGR: 8.2% (2026 to 2036)

North America

Twenty-four percent of value, weighted heavily toward aerospace, defence and semiconductor applications rather than toward industrial volume. Ceramic matrix composite development and qualification work is heavily concentrated here, tied to engine programmes that carry component positions for decades once they are approved, and defence funding sustains development work that commercial economics alone would never support. Semiconductor equipment manufacture consumes high-purity chamber and handling components at demanding specifications, and that business has grown alongside domestic fab construction. Industrial refractory and alumina volume has been declining for years as heavy manufacturing moved offshore. Growth of 7.5% reflects composite qualification concluding and semiconductor capacity additions rather than any recovery in industrial ceramic demand.
Share: 24% | CAGR: 7.5% (2026 to 2036)
Regional intelligence for 5 additional markets available in the complete report: Western Europe, South Asia and Pacific, Latin America, Middle East and Africa, Eastern Europe. Contact sales@marketmindsadvisory.com.
global-high-temperature-ceramics-market-country-cagr-analysis-1787310502012

Where Ceramic Producers Can Earn More

Competing on material specification in a market where compositions are published and powders are purchasable earns a producer very little indeed. The value available sits in yield, in near-net-shape forming that removes grinding cost, in the qualified applications that resist price competition, and in the furnace utilisation that most producers still manage remarkably poorly.

Attack Sintering And Finishing Yield Systematically

Industry yield sits at 82%, and every part lost after firing carries powder, forming, furnace time and often hours of diamond grinding already spent on it. Automated forming, in-process inspection before firing and tighter powder handling have together lifted yield by 6 to 9 points at producers who invested properly, and each point drops almost entirely to margin. The capital involved is modest against the value being scrapped. Most producers cannot state their own yield by product line at all, which is precisely where any improvement programme has to begin.
Market Impact: Lifts fired yield by 6 to 9 points

Invest In Near-Net-Shape Forming To Remove Grinding

Diamond machining takes 24% of component cost because fired ceramic resists every conventional cutting method and tolerances must still be held to microns. Injection moulding, additive forming and improved isostatic pressing cut post-sinter grinding by roughly 40% where geometry permits, which removes both the cost and the late-stage yield losses that grinding itself causes. The tooling investment involved is real and pays back comfortably across programme volumes. Producers habitually treat grinding as an unavoidable property of ceramics rather than as the largest single addressable cost anywhere in their own process.
Market Impact: Cuts grinding cost by roughly 40% w

Pursue Qualified Applications Rather Than Industrial Volume

Aerospace hardware takes 26 months to qualify and semiconductor chamber components require validation against tool performance, and both create positions that survive price competition for the whole of a programme's life. Those applications realise roughly 2.7 times the margin of industrial refractory and wear components on comparable tonnage. Qualification is expensive and slow to complete, which is exactly why it works so well as a barrier. Producers chasing industrial volume simply to fill kilns end up funding technical capability from margins that industrial tendering has never supported and never will.
Market Impact: Realises roughly 2.7 times the indu

Schedule Furnace Campaigns To Cut Energy Per Part

Sintering takes 22% of cost and kilns are frequently fired part-loaded because scheduling follows order arrival rather than any furnace economics at all. Campaign scheduling that groups compatible firing profiles and fills kilns properly cuts energy per part by roughly 18% without any capital investment at all. Heat recovery from cooling cycles adds further savings wherever the furnace design permits it. This is comfortably the cheapest available cost improvement in most ceramic plants and it is routinely neglected because production planning reports to operations rather than to anybody accountable for energy cost.
Market Impact: Cuts energy per part by roughly 18%

Who Controls the Margin Pool

Concentration is moderate and follows application rather than geography. The top five participants hold 39% of finished ceramic component revenue, the basis used throughout this section, and the gap between Kyocera and the challenger group reflects breadth across electronic, semiconductor and industrial ceramics rather than dominance in any single application. Below the leaders sits a long tail of regional producers serving industrial and refractory demand where qualification barriers are minima
Competition currently runs on three dimensions and material composition is not among them, since compositions are published and powders are commercially available. Yield and dimensional capability decide who earns anything on a given part. Qualification history decides access to aerospace and semiconductor applications entirely. Energy cost position decides which producers can compete for industrial volume at all.

Pressure is building from two directions. Chinese producers are moving from alumina and silicon carbide volume into higher-specification components on cost positions European producers cannot match. Composite specialists are entering hot section applications that monolithic ceramic producers cannot serve. Rankings shift first in industrial and refractory ceramics, where energy cost rather than technical capability determines the outcome of almost every tender.
global-high-temperature-ceramics-market-company-positioning-matrix-1787310502537

Competitive Moat and Risk Dimensions

KYOCERA

Moat: Breadth across ceramic applications

Positions spanning semiconductor chamber components, electronic packages, cutting tools, medical ceramics and industrial parts spread process development and furnace investment across applications that no specialist can match. Decades of qualification with semiconductor tool manufacturers and bearing producers create relationships built on demonstrated yield and consistency rather than on any proprietary composition.
KYOCERA

Risk: Semiconductor cycle exposure

A substantial share of the most profitable business depends on wafer fab equipment spending, which swings violently and without much warning, as the collapse after 2022 demonstrated across the industry. Capacity planned against peak demand runs badly underloaded through a downturn, and furnace assets cannot be idled cheaply given their thermal cycling costs.
COORSTEK

Moat: Precision manufacturing and qualification

Manufacturing capability across demanding tolerances and difficult geometries, supported by qualification positions in semiconductor, aerospace and defence applications, defends business that competes on delivered reliability rather than on price. Private ownership permits investment horizons matched to qualification cycles measured in years rather than to quarterly reporting pressures.
COORSTEK

Risk: Energy and industrial exposure

Sintering-intensive production carries energy cost exposure that Asian competitors with cheaper power do not face, and the industrial and general technical ceramics portion of the portfolio competes directly against that disadvantage. Defending it requires either yield superiority or migration toward qualified applications, and both take considerable time to achieve.

Players Tracked

Prominent Players

Kyocera
CoorsTek
CeramTec
Morgan Advanced Materials
NGK Insulators

Other Key Players

Saint-Gobain
3M
Rauschert
Ferrotec
Toshiba Materials
Maruwa
Ibiden
Vesuvius
RHI Magnesita
Imerys
Applied Ceramics
Superior Technical Ceramics
Sinoma Advanced Materials
Krosaki Harima
Shinagawa Refractories

Recent Developments

APRIL 2025

Ceramic matrix composite capacity expanded for engine programmes

Additional silicon carbide fibre and composite component manufacturing capacity entered commercial operation in order to serve turbine hot section programmes moving from qualification into production ramp, with output committed under long-term agreements covering shroud, liner and nozzle hardware across several distinct engine families and their derivatives.
Signal: Capacity built against qualified programme
SEPTEMBER 2025

European producer closes lower-margin sintering capacity

A European advanced ceramics producer permanently closed sintering capacity that had served industrial and refractory applications, redirecting the remaining furnace time toward medical, semiconductor and precision component work, after sustained industrial electricity costs had made those lower-value lines uneconomic against imported material from Asian producers.
Signal: Energy cost is quietly relocating the volu
JANUARY 2025

Silicon nitride bearing qualification completed for electric motors

Ceramic rolling element bearings completed full qualification for use in electric vehicle traction motor applications, addressing the electrical erosion that current passage causes in conventional steel bearings, with volume supply agreements now in place covering a number of vehicle platforms across multiple manufacturers and regions.
Signal: Electrification is creating genuine cerami

What Sits Inside Component Cost

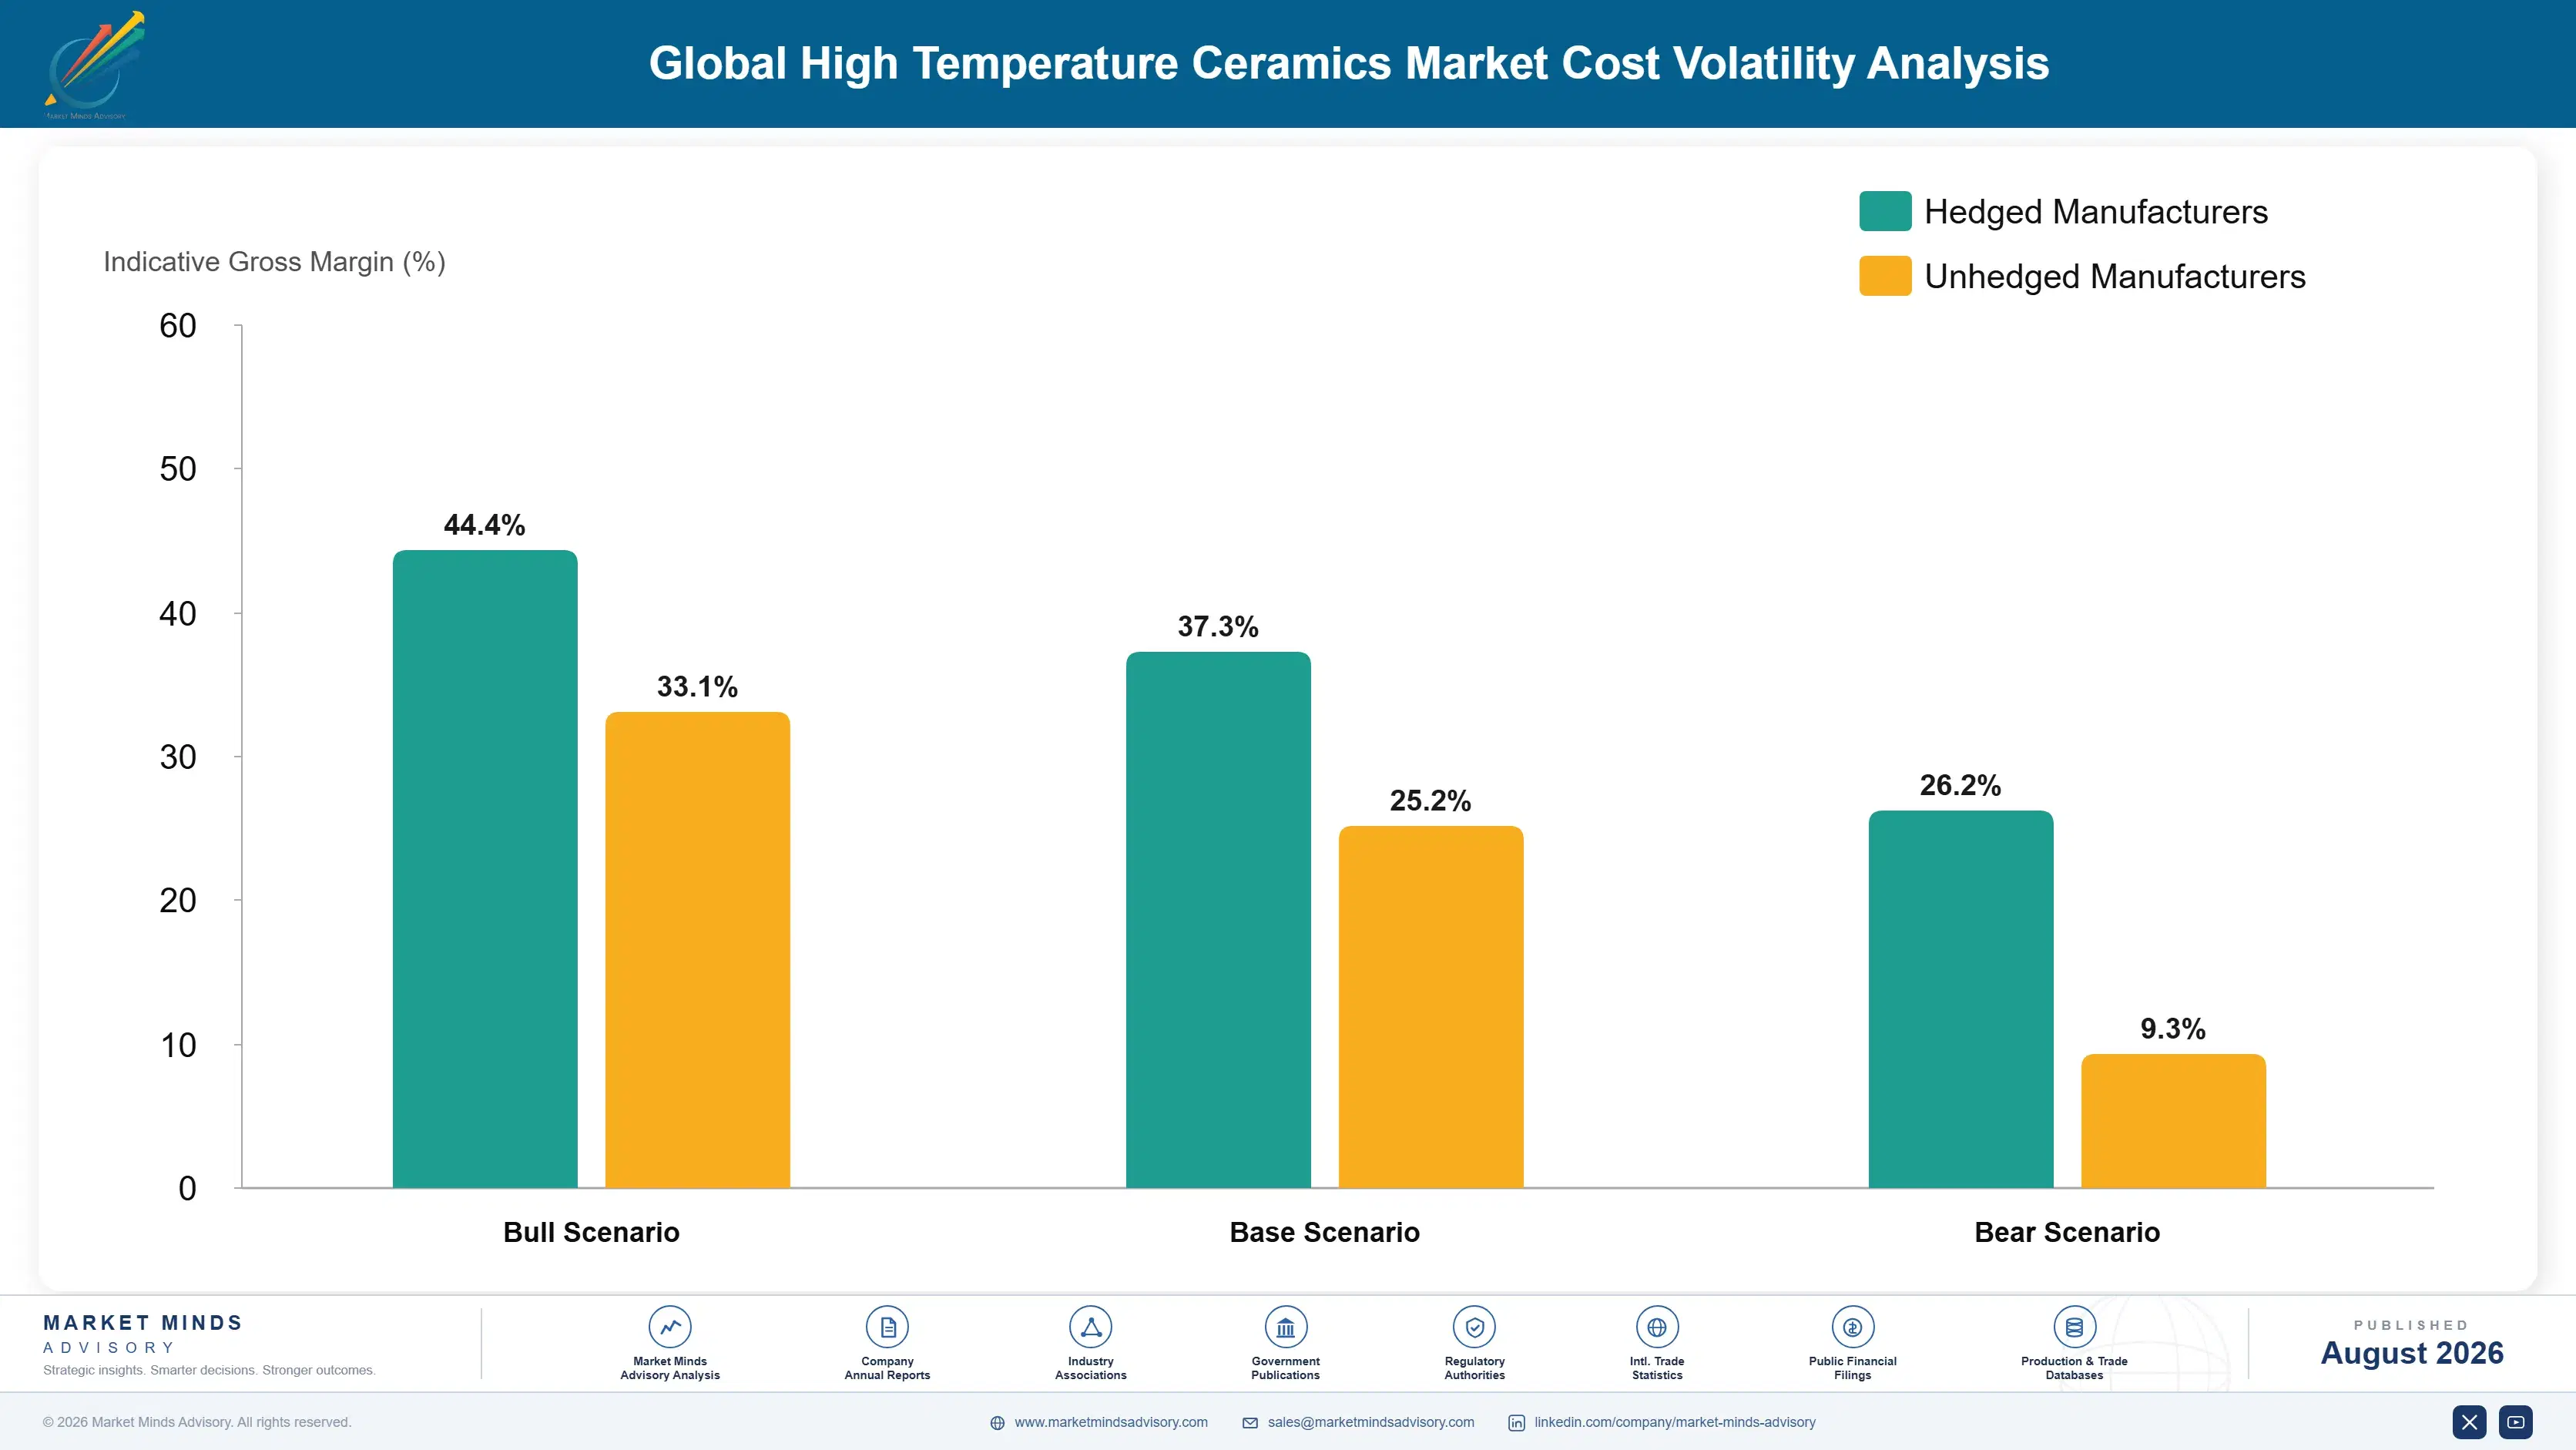
High-purity ceramic powders account for roughly 34% of finished component cost, spanning alumina, silicon carbide, silicon nitride, aluminium nitride and stabilised zirconia, sourced from a specialist powder supply base concentrated in Japan, Germany and China. Sintering furnace energy takes about 22%. Diamond grinding and finishing adds a further 24%, tooling and dies around 8%, and inspection, testing and documentation the remaining 6%.
Energy costs moved violently through 2021 and 2022 and hit this industry harder than most. European industrial electricity and gas prices reached levels the IEA documented as unprecedented, and sintering furnaces running extended high-temperature cycles could not be operated economically on several lines. Morgan Advanced Materials Annual Report 2022 recorded elevated energy costs across its manufacturing base, and Chinese provincial power rationing during late 2021 simultaneously constrained silicon carbide and alumina powder output.

The competitive disadvantage mechanism runs through energy price and yield together rather than through powder purchasing. A producer paying European power rates at 75% yield competes against one paying Asian rates at 88%, and no commercial skill closes that gap. Yield is at least addressable through investment. Energy price is not, which is why European producers migrated toward applications where qualification rather than cost decides.
global-high-temperature-ceramics-market-cost-volatility-analysis-1787310502732

Recover furnace heat and schedule firing campaigns properly

Kilns fired part-loaded because scheduling follows order arrival rather than furnace economics waste energy on every cycle, and campaign grouping of compatible firing profiles costs nothing but planning discipline. Heat recovery from cooling cycles adds further savings where the furnace design permits it, and both of those improvements are permanent rather than cyclical in nature.

Qualify alternative powder sources ahead of disruption

Specialist ceramic powders frequently come from a single supplier because nobody examined the dependency until output was constrained, and requalifying a powder means requalifying every single component made from it. Mapping the supply base and qualifying alternatives in advance costs far less than the requalification that a genuine disruption forces on everybody at once.

Migrate portfolio toward qualification-defended applications

Where energy cost cannot be matched, the answer is to compete somewhere energy cost is not the deciding factor, which means aerospace, semiconductor and medical applications defended by qualification. The migration takes years and requires investment that industrial margins will not fund, so it has to begin well before the industrial business becomes untenable.

Portfolio Architecture for Margin Defence

Margin architecture separates by qualification barrier rather than by material sophistication, which surprises people who expect the most advanced chemistry to earn the most. Industrial refractory and wear components earn what energy cost and regional competition permit, regardless of how demanding the material happens to be, because any competent producer can supply them. Value rises steeply where a customer has qualified a part against their own equipment and will not repeat the exercise.
The volume versus premium tension runs directly through furnace utilisation, which is unusual. Industrial and refractory volume fills kilns and spreads fixed cost across tonnage, at margins that imported material compresses continuously. Aerospace, semiconductor and medical components earn several times better on far smaller volumes that leave furnaces underloaded. Producers therefore face a genuine operational conflict rather than merely a commercial preference, and the ones handling it well schedule around it deliberately.

High-value pools concentrate in three places. Ceramic matrix composites for turbine hot sections command price because qualification takes 26 months and nothing else survives the temperature. Semiconductor chamber components earn on tool uptime rather than on part cost. And medical zirconia and precision ceramics earn on regulatory qualification that no industrial producer will undertake.

Volume / Commodity-Adjacent Tier

Refractory shapes, monolithics, wear components and general alumina parts supplied into steel, cement, glass and mining, where any competent producer can qualify and energy cost decides who wins the tonnage.
Gross Margin: 16-24%

Premium / Certified Tier

Precision technical ceramics, silicon nitride bearings and thermal management substrates qualified against customer equipment performance. Dimensional capability and demonstrated reliability defend pricing. The nine-point range reflects standard against high-precision component economics.
Gross Margin: 31-40%

Sustainability / Regulatory / Next-Generation Tier

Ceramic matrix composites, semiconductor chamber components and medical implant ceramics where qualification cycles run into years. Regulatory and programme qualification defends pricing almost absolutely. The twelve-point range reflects established against ramping programme positions.
Gross Margin: 44-56%
global-high-temperature-ceramics-market-portfolio-architecture-1787310503238

High-value Sub-segments and Strategic Watch-out

Ceramic matrix composite turbine hardware

High value and high growth together, because nothing metallic survives the temperatures involved and qualification running 26 months keeps the competitive set extremely narrow. Positions won on an engine programme last for the airframe production life, which is measured in decades rather than contract years.
Gross Margin: 44-56%

Semiconductor chamber and plasma components

Strong realised value on cyclical growth, because purity, particle performance and erosion resistance determine tool uptime directly and customers qualify components against their own equipment before release. The cyclicality is severe enough to make capacity planning genuinely difficult for every single producer serving the segment.
Gross Margin: 42-54%

Refractory and industrial wear components

The volume core, filling kilns and spreading fixed cost across tonnage while earning whatever energy position and regional competition permit after imports have set the price. Necessary for furnace utilisation, but this tier will never fund composite or medical development work out of its own margin.
Gross Margin: 16-24%

Silicon nitride bearings for electric traction

The strategic watch-out, because ceramic rolling elements solve the electrical erosion that current passage causes in steel bearings, and vehicle platform qualification is under way right now across several manufacturers. Volumes could eventually reach a scale this industry has rarely seen from any single application.
Gross Margin: 34-46%

How Ceramic Component Demand Behaves

Demand is drawing-locked rather than transactional. A ceramic component qualified into an engine, a tool or an implant is bought against that programme's build rate for its production life, reordered on a schedule the customer controls, and displaced only when the programme ends or a redesign forces requalification. Winning a position is slow and expensive; holding it costs a periodic audit. That asymmetry explains why producers defend qualified positions so fiercely.
Stickiness varies enormously by qualification burden. Refractory and industrial wear components are loosest, retendered against price where any producer meeting the specification can supply. Precision technical components sit tighter, because dimensional capability and demonstrated reliability take time to establish with a customer. Aerospace and medical components are stickiest of all, where requalification means repeating a 26 month programme that nobody undertakes without a compelling engineering reason to do so.

The buyer profile has shifted toward engineering integration. A decade ago ceramic components were specified by design engineers and bought by procurement against a drawing. Increasingly customers expect the producer to participate in component design, propose geometry that improves manufacturability and yield, and take responsibility for delivered function rather than for meeting a print somebody else drew.
global-high-temperature-ceramics-market-end-use-penetration-index-1787310503726

Where We Land On This

These are among the four positions where our research anticipates prominent divergence between winners and laggards over the coming forecast period. Each is grounded in the demand model, the regulatory perimeter, and the announced capacity pipeline.
01 / YIELD IMPROVEMENT DISCIPLINE

Treat sintering yield as the primary commercial variable

Industry yield sits at 82%, and every part lost after firing carries powder, forming, furnace time and frequently hours of diamond grinding already committed to it before the defect became visible. Automated forming, pre-fire inspection and tighter powder handling have lifted yield 6 to 9 points where producers invested properly, and each point falls almost entirely through to margin. Most producers cannot state their own yield by product line, which is precisely where any serious improvement programme has to begin.
02 / NEAR-NET-SHAPE FORMING INVESTMENT

Remove diamond grinding rather than accepting it

Post-sinter machining takes 24% of component cost because fired ceramic defeats every conventional cutting method and micron tolerances must still be held on the finished part. Injection moulding, additive forming and improved isostatic pressing cut grinding by roughly 40% where geometry permits, removing both the cost and the late-stage yield losses that the grinding process itself causes. Producers habitually treat grinding as an unavoidable property of ceramics rather than as the largest single addressable cost sitting inside their own manufacturing process.
03 / QUALIFIED APPLICATION MIGRATION

Move deliberately toward qualification-defended applications

Aerospace hardware takes 26 months to qualify and semiconductor chamber components require full validation against tool performance, and both produce commercial positions that survive price competition for an entire programme life. Those applications realise roughly 2.7 times the margin that industrial refractory work delivers on a comparable tonnage of product shipped. Producers chasing industrial volume purely to fill kilns end up funding technical capability from margins that industrial tendering has never supported and shows no sign whatsoever of ever supporting.
04 / FURNACE SCHEDULING ECONOMICS

Schedule kilns for energy, not for order arrival

Sintering represents 22% of component cost and kilns are frequently fired part-loaded because production planning follows order arrival rather than furnace economics or firing profile compatibility. Campaign scheduling that groups compatible profiles and fills kilns properly cuts energy per part by roughly 18%, with no capital investment required at all. It is comfortably the cheapest improvement available in most ceramic plants, and it is routinely neglected because production planning reports to operations rather than to anybody accountable for the energy bill.

Engagement Snapshot From the Field

A live engagement with an industry participant carrying material or product regulatory and market exposure ahead of a defining policy shift, showing how our research translates into a defensible multi-year portfolio strategy.
MARKET MINDS ADVISORY · CLIENT ENGAGEMENT SUMMARY
Global High Temperature Ceramics Producer Strategic Portfolio Review and Transition Roadmap 2026·Investment Scenario on Global High Temperature Ceramics Exposure Evaluation 2025-26
CLIENT PROFILE
An advanced ceramics manufacturer operating four plants across Western Europe and North America, supplying industrial wear components, precision technical ceramics and a small semiconductor component business through direct sales and distribution. Component revenue approached EUR 260 million annually (client-reported, unverified by MMA), roughly two thirds of it in industrial and refractory work sold against competitive tender.
STRATEGIC CHALLENGE
European margins had collapsed since 2022 and management attributed the decline entirely to energy prices, responding with a proposed furnace replacement programme at two sites. The semiconductor business earned far better but had not grown, and nobody had established why. Yield was reported as a single plant-level figure that concealed enormous variation between product lines.
MMA APPROACH
MMA interviewed forty-seven customers, plant managers, qualification engineers and powder suppliers across five markets, reconstructing how component decisions and qualifications are actually reached. We rebuilt yield by product line from production records, modelled energy per part against furnace loading, and benchmarked the client's qualification pipeline against competitors in semiconductor and aerospace applications.
KEY FINDINGS
  1. Yield varied from 68% to 91% between product lines at the same plant, and the worst performers were the industrial products management had assumed were simplest to make.
  2. Kilns ran at an average 61% loading because scheduling followed order arrival, and campaign grouping alone would have cut energy per part substantially without any furnace replacement at all.
  3. Semiconductor business had not grown because the client had never approached a tool manufacturer directly, selling instead through distributors who could not support qualification work.
  4. Industrial tender margins had fallen below the level that could fund technical development (client-reported, unverified by MMA), while the qualified portfolio was earning several times more per kiln hour consumed.
CLIENT PROFILE
An advanced ceramics manufacturer operating four plants across Western Europe and North America, supplying industrial wear components, precision technical ceramics and a small semiconductor component business through direct sales and distribution. Component revenue approached EUR 260 million annually (client-reported, unverified by MMA), roughly two thirds of it in industrial and refractory work sold against competitive tender.
STRATEGIC CHALLENGE
European margins had collapsed since 2022 and management attributed the decline entirely to energy prices, responding with a proposed furnace replacement programme at two sites. The semiconductor business earned far better but had not grown, and nobody had established why. Yield was reported as a single plant-level figure that concealed enormous variation between product lines.
MMA APPROACH
MMA interviewed forty-seven customers, plant managers, qualification engineers and powder suppliers across five markets, reconstructing how component decisions and qualifications are actually reached. We rebuilt yield by product line from production records, modelled energy per part against furnace loading, and benchmarked the client's qualification pipeline against competitors in semiconductor and aerospace applications.
KEY FINDINGS
  1. Yield varied from 68% to 91% between product lines at the same plant, and the worst performers were the industrial products management had assumed were simplest to make.
  2. Kilns ran at an average 61% loading because scheduling followed order arrival, and campaign grouping alone would have cut energy per part substantially without any furnace replacement at all.
  3. Semiconductor business had not grown because the client had never approached a tool manufacturer directly, selling instead through distributors who could not support qualification work.
  4. Industrial tender margins had fallen below the level that could fund technical development (client-reported, unverified by MMA), while the qualified portfolio was earning several times more per kiln hour consumed.
RECOMMENDED STRATEGY
Phase 1: Phase 1 (0 to 6 months): Defer the furnace replacement and implement campaign scheduling with yield measurement reported by product line rather than by plant. Phase 2: Phase 2 (6 to 18 months): Exit the worst-yielding industrial lines deliberately and redirect freed kiln hours toward precision and semiconductor components. Phase 3: Phase 3 (18 to 36 months): Build direct qualification relationships with semiconductor tool manufacturers and enter one aerospace programme at material submission stage.
OUTCOME
The client deferred roughly EUR 45 million of furnace investment (client-reported, unverified by MMA) and implemented campaign scheduling within months. Energy per part fell measurably, three industrial lines were exited, and the first direct semiconductor tool manufacturer qualification opened eighteen months into the programme rather than through distribution.

Frequently Asked Questions

Foundational context covering the market sizes, CAGR, scope, country, region and competition that inform every finding below. This section is provided to cover basics and most often pre-purchase conversations, answered from the MMA Primary Research Dataset.

What is the current size of the Global High Temperature Ceramics Market?

The market reached USD 12.8 billion in 2025, measured as finished component and shape revenue at realised delivered price. Industrial and refractory applications account for the largest share of tonnage.

How large will the Global High Temperature Ceramics Market be by 2036?

MMA forecasts USD 27.5 billion by 2036, an expansion of 2.00 times the 2026 level. Incremental value across the forecast period reaches USD 13.78 billion.

What is the CAGR for the Global High Temperature Ceramics Market 2026 to 2036?

The base case compound annual growth rate is 7.2%, with a bull case of 8.5% and a bear case of 6.0%. Composite aviation adoption and European energy costs separate those scenarios.

Which segment is growing fastest?

Ceramic matrix composites grow fastest at 10.8%, exactly 1.50 times the overall market rate. Fibre reinforcement solves the brittleness that kept monolithic ceramics out of load-bearing hot sections.

Who are the major companies in the Global High Temperature Ceramics Market?

Kyocera, CoorsTek, CeramTec, Morgan Advanced Materials and NGK Insulators lead, holding 39% of component revenue between them. Qualification history rather than proprietary composition explains most competitive positions.

Which country is growing fastest?

India grows fastest at 9.8%, where refractory and technical ceramic production serves expanding steel, cement and glass sectors. Electronics investment is beginning to pull higher-specification demand as well.

Report Segmentation Architecture

The full report scope spans multiple orthogonal segmentation dimensions, with cross-tabulated demand data provided for each dimension pair. Coverage extends further to regional breakdowns, trend trajectories, and the competitive detail needed to support segment-level decision-making.

By Ceramic Material Class

  • Ceramic Matrix Composites
  • Silicon Carbide and Silicon Nitride Structural Ceramics
  • Aluminium Nitride and Thermal Management Ceramics
  • Zirconia and Toughened Ceramics
  • Alumina Technical Ceramics
  • Refractory Oxide and Monolithic Ceramics

By End-Use Industry

  • Aerospace, Defence and Propulsion
  • Semiconductor and Electronics Manufacturing
  • Energy, Power Generation and Process Heat
  • Steel, Glass, Cement and Heavy Industry
  • Automotive, Medical and Precision Engineering

By Customer Type and Channel

  • Original Equipment Manufacturers
  • Semiconductor Tool Builders
  • Industrial Plant Operators
  • Engineering and Maintenance Contractors
  • Technical Distributors and Fabricators

By Region

  • North America
  • Western Europe
  • East Asia
  • South Asia and Pacific
  • Latin America
  • Middle East and Africa
  • Eastern Europe

Scope, Methodology, and Coverage

Every figure in this report is reproducible from documented input assumptions. The scope below maps the historical period, the forecast horizon, the segmentation dimensions, and the countries covered, alongside the underlying primary and qualitative methodology.
Historical Period
2020 to 2025
Forecast Period
2026 to 2036
Base Year
2025 (USD billions; MMA Primary Research Dataset, August 2026)
Market Definition
The market comprises advanced technical ceramics engineered for service above conventional metallic temperature limits, spanning ceramic matrix composites, silicon carbide and silicon nitride structural ceramics, aluminium nitride and thermal management ceramics, zirconia and toughened ceramics, alumina technical ceramics, and refractory oxide and monolithic ceramics. Sizing captures finished component and shape revenue at realised delivered price across aerospace and defence, semiconductor and electronics, energy and process heat, heavy industry, automotive, medical and precision engineering applications, including captive component production valued at transfer price. Ceramic raw powders sold as material, glass and glass-ceramics, traditional whiteware, thin-film ceramic coatings, and forming and sintering equipment fall outside scope.
Quantitative Units
USD billions (current prices); finished component tonnage shipped annually; USD per kilogram of finished component at delivered price
Segmentation Dimensions
By Ceramic Material Class; By End-Use Industry; By Customer Type and Channel; By Region
Regions Covered
North America, Western Europe, East Asia, South Asia and Pacific, Latin America, Middle East and Africa, Eastern Europe
Countries Covered
USA, Canada, Mexico, Germany, France, UK, Italy, Spain, Switzerland, Austria, Netherlands, Poland, Czech Republic, Turkey, China, Japan, South Korea, Taiwan, India, Singapore, Malaysia, Thailand, Australia, Brazil, Argentina, Chile, Saudi Arabia, UAE, South Africa, and additional markets relevant to this sector
Key Companies Profiled
Kyocera, CoorsTek, CeramTec, Morgan Advanced Materials, NGK Insulators, Saint-Gobain, 3M, Rauschert, Ferrotec, Toshiba Materials, Maruwa, Ibiden, Vesuvius, RHI Magnesita, Imerys, Applied Ceramics, Superior Technical Ceramics, Sinoma Advanced Materials, Krosaki Harima, Shinagawa Refractories.
Quantitative Methodology
Primary survey, n=3,800 respondents, Q4 2025, six countries; demand-side model with trade association cross-validation
Qualitative Methodology
47 expert interviews, Q4 2025; applied to validate demand model assumptions, identify emerging dynamics, and assess competitive positioning
Report Format
PDF and XLSX data workbook (Word format preview document)
Publisher
Market Minds Advisory
Report Code
MMA-2026-CHM-466
Published
August 2026
Contact
sales@marketmindsadvisory.com | www.marketmindsadvisory.com

Purchase the full Global High Temperature Ceramics Market Report (2026 to 2036).

The full report sizes the global high temperature ceramics market across six material classes, five end-use industries, five customer channels and seven regions, with annual forecasts to 2036 in revenue and component tonnage shipped. It models delivered component cost by production site including energy tariffs, yield and machining content, which is the analysis that establishes which producers can compete for which work. Twenty participants are assessed on a consistent component revenue basis, with qualification positions mapped separately from manufacturing capacity. Furnace utilisation and yield are benchmarked plant by plant across the industry.
Six ceramic material classes sized and forecast annually
Delivered component cost modelled by site and energy tariff
Twenty participants on consistent component revenue basis
Qualification positions mapped separately from manufacturing capacity
Furnace utilisation and fired yield benchmarked plant by plant
Composite programme qualification tracked engine family by family

Built For The People Who Decide

From boardroom strategy to bench-side execution, this report is read cover-to-cover by leaders shaping the next decade of their industry, turning demand scenarios, market dynamics and valuation benchmarks into decisions.
CXOs/ Presidents/ VPs/ Managers
M&A and Corporate Development
Strategy Teams and R&D Heads
Procurement and Product Directors
Regulatory and Compliance Leaders
Investor Relations and Equity Analysts