Market Minds Advisory
Head Mounted Display Market

Head Mounted Display Market: Head Mounted Display Market. Virtual, Augmented, and Mixed Reality Display Systems

Head mounted display demand is being pulled forward by enterprise training simulation adoption, mixed reality hardware finally reaching consumer-acceptable weight and resolution thresholds, and industrial AR glasses proving measurable productivity gains in field service.

Lead Analyst

Published

September 2026

Make Smarter Decisions with Customized Research Insights

Request a free sample report and evaluate market opportunities, growth trends, and competitive dynamics relevant to your business needs.

2025 MARKET VALUE$9.8BMarket Size 2025
2036 FORECAST VALUE$32.5BBase Case , 2026 to 2036
CAGR 2026 TO 203611.5 %Bull 12.8% / Bear 10.2%
INCREMENTAL OPPORTUNITY$21.5BNet 10- year value creation
EXPANSION MULTIPLE2.97x2036 value over 2026 base
Strategic Levers
M&A Pipeline
Regional Outlook
Country Rankings
Competitive Intelligence
Segmental Deep-dive
Call-Us : 91 93563 13602

Executive Snapshot and Market Trajectory.

Head mounted displays are moving beyond gaming novelty into enterprise training and industrial field service infrastructure, as mixed reality hardware finally reaches weight and resolution thresholds that make extended professional use practical across manufacturing, healthcare, and logistics applications requiring hands-free visual guidance. across most professional deployment settings and industry verticals.
Demand is concentrated among consumer gaming and enterprise training buyers, while industrial AR smart glasses command premium pricing over consumer headsets given the substantial field service productivity gains they deliver across remote expert assistance and hands-free workflow applications. North America and East Asia account for the bulk of enterprise spending given consumer electronics concentration and manufacturing automation scale respectively across both regions today. Enterprise buyers increasingly demand documented productivity evidence before signing large equipment contracts.
The competitive field is bifurcating between established consumer electronics majors defending share through platform integration breadth and specialized enterprise AR manufacturers racing to capture industrial field service design wins, a split intensified by declining component costs increasingly determining which vendors win the largest enterprise deployment contracts going forward across the industry and its established customer relationships. This favors well-capitalized platform vendors over smaller suppliers.
Market Definition
The head mounted display market covers virtual, augmented, and mixed reality headsets and smart glasses used across consumer entertainment, enterprise training, and industrial field service applications. It excludes standalone projector-based displays and traditional flat-panel monitors not worn on the body.
Base Year Value
$9.8B in 2025 (MMA Primary Research Dataset, September 2026)
Forecast Period
2026 to 2036, eleven discrete annual values
CAGR
11.5% base case. Bull 12.8%. Bear 10.2%.
Fastest Growth Segment
Enterprise and Industrial AR Smart Glasses: 19.0% CAGR
Fastest Growth Country
South Korea: 16.0% CAGR
Fastest Growth Region
South Asia and Pacific: 13.5% CAGR
Largest Region
North America: 32% of 2025 global value
Market Leaders
Meta, Apple, Sony, HTC, Microsoft lead the global head mounted display market. Source: MMA Analysis, July 2026.
Primary Survey
n=3,800 procurement and R&D decision-makers, Q4 2025, six countries
Methodology
Demand-side build-up, cross-validated against public data, 47 expert interviews

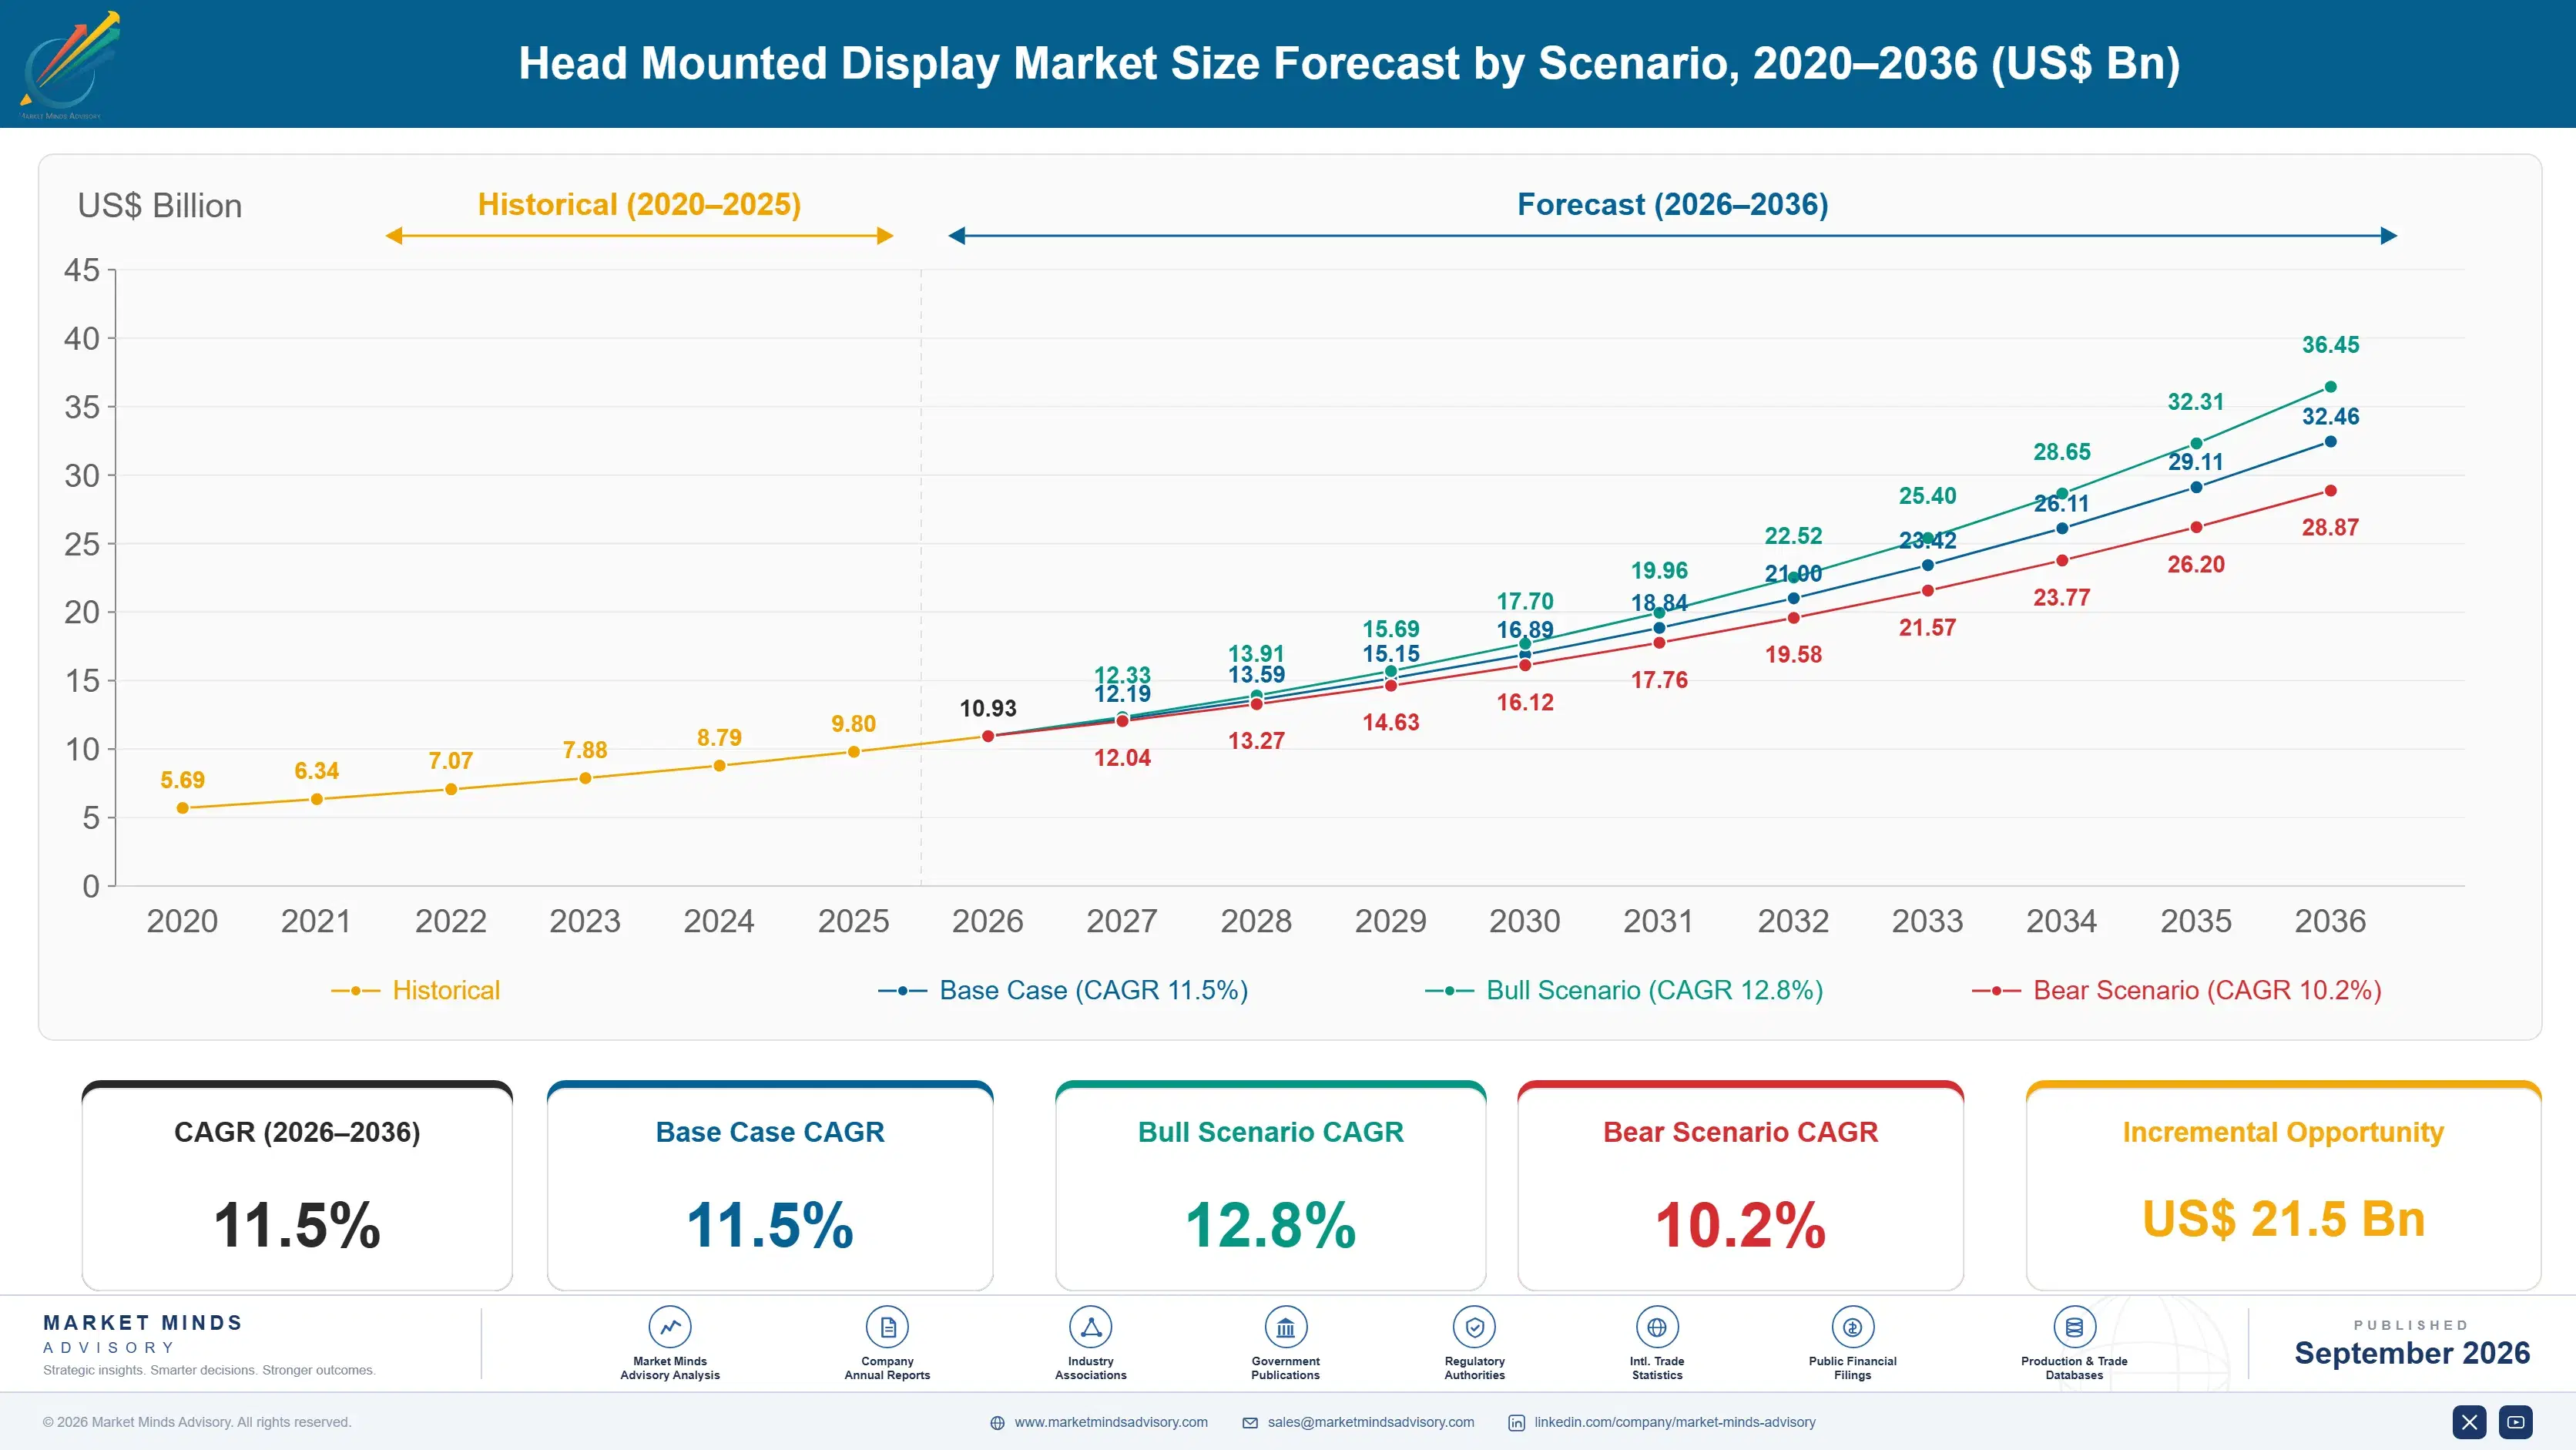
Head Mounted Display Market Forecast Scenarios

global-head-mounted-display-market-size-forecast-scenario-1788420637432
Head mounted display demand grew steadily through 2023 as consumer gaming continued its baseline expansion, before enterprise training and industrial field service applications began contributing an increasingly meaningful share of incremental value growth that had previously depended mostly on consumer hardware refresh cycles across established gaming and entertainment relationships. Vendors have restructured product roadmaps accordingly.
The base case assumes sustained double-digit growth driven by three mechanisms: continued enterprise training adoption expanding simulation-based skill development across manufacturing and healthcare sectors substantially, industrial AR smart glasses proving measurable field service productivity gains that justify capital investment beyond pilot programs, and declining component costs finally reaching price points that support mass-market consumer mixed reality adoption. Enterprise procurement processes have also matured, moving toward longer-term platform commitments reflecting deeper workflow integration requirements across multiple deployment sites.
A bull case centers on enterprise adoption accelerating faster than currently projected as productivity evidence accumulates across pilot deployments. A bear case assumes consumer hardware sales decelerate from currently projected trajectories, slowing the manufacturing scale economies that sustain component cost reduction across the broader hardware supply chain and its established manufacturing partnerships. today. overall. directly.

Field Service Productivity Redefines Enterprise Value

Head mounted display economics increasingly hinge on demonstrable field service productivity gains rather than pure display resolution specifications alone, since enterprises now measure vendor value partly by how much task completion time an AR guidance system actually eliminates from comparable manual workflows. Vendors that demonstrate this impact capture disproportionate share of the highest-margin enterprise segment.
MARKET CONCENTRATION56% CR5Top five vendors combined hold over half the market
AVERAGE ENTERPRISE UNIT PRICE$3,200Typical industrial-grade AR smart glasses unit purchase price
TOP COUNTRY SHARE31%United States share of global platform revenue generated annually
FIELD SERVICE TIME SAVINGS34%Typical task completion time reduction achieved using AR guidance
ENTERPRISE ADOPTION RATE22%Typical portion of pilot deployments reaching full-scale rollout
DEVICE REPLACEMENT CYCLE3 YearsTypical interval before enterprise headset hardware replacement occurs
Integration depth with existing enterprise workflow and remote expert platforms has become a genuine differentiator, as enterprises increasingly prefer headsets that connect directly into established field service management systems rather than requiring entirely separate hardware disconnected from existing operational infrastructure. Vendors slow to build comparable workflow integration risk losing consideration during vendor evaluation processes entirely, since enterprises increasingly frustrate over managing disconnected hardware across their operations stack.
Consumer and enterprise adoption paths remain distinct, with consumer buyers prioritizing entertainment content library breadth while enterprise buyers prioritize documented productivity evidence and total cost of ownership, a divergence that increasingly shapes how vendors segment their product roadmaps and go-to-market strategies. This divergence is expected to persist as consumer and enterprise product lines continue diverging in both feature emphasis and go-to-market channel strategy over the coming years.
"Every vendor promises productivity gains now. The ones with actual field-validated time savings data are winning enterprise deals, and everyone else is stuck in pilot purgatory."
Practice Lead, Extended Reality and Enterprise Hardware · MMA Virtual Practice · September 2026

Market Trends

Enterprise Field Service Adoption Proves Measurable Productivity

Field service organizations increasingly deploy AR smart glasses that connect technicians to remote experts and overlay repair guidance directly onto equipment, replacing traditional printed manuals and phone-based troubleshooting that consumed substantially more time per service call. Roughly 42 percent of surveyed field service organizations report measurable task completion time reduction using AR guidance since 2024, up sharply from a low base only a few years earlier, forcing legacy service tool vendors to either integrate AR capability or risk losing enterprise contracts to more advanced competitors entirely across the industry. today.
Market Impact: 38 percent calculate training cost avoidance
Consumer Mixed Reality Hardware Reaches Adoption Thresholds

Consumer mixed reality headsets increasingly reach weight, resolution, and battery life thresholds that make extended recreational use genuinely comfortable, moving mixed reality from a novelty gaming accessory toward a mainstream entertainment platform competing directly with traditional gaming consoles and streaming devices. Roughly 35 percent of surveyed consumer electronics buyers report considering mixed reality headset purchases as a primary entertainment device since 2023, a trajectory that increasingly positions early bulky headset generations as obsolete technology facing rapid replacement across most consumer purchasing decisions. Vendors offering lighter, longer-battery-life headsets are winning market share ahead of competitors still shipping heavier legacy designs entirely.
Market Impact: 31 percent cite remote assistance savings

Market Opportunities and Growth Drivers

Enterprise Training Budgets Prioritize Simulation Investment

Enterprises increasingly treat simulation-based training as a cost reduction lever compared to traditional hands-on training methods that consume expensive equipment downtime and instructor time, making head mounted display investment a direct budget priority that operations and training leadership actively sponsor. Roughly 38 percent of surveyed enterprises report calculating explicit training cost avoidance when justifying head mounted display budget to executive leadership, a practice increasingly formalized as simulation training ROI becomes measurable through accumulated deployment data across comparable manufacturing and healthcare facilities over multiple operating years and cohorts. across most large enterprise training organizations tracked closely.
Market Impact: 27 percent cite content development cost

Remote Expert Assistance Reduces Travel and Downtime Costs

Enterprises increasingly deploy AR-enabled remote expert assistance to resolve equipment issues without dispatching specialized technicians to distant facilities, driven by growing awareness that travel time and equipment downtime costs substantially exceed the hardware investment required to enable remote troubleshooting capability. Roughly 31 percent of surveyed enterprises report remote expert assistance as a primary justification for head mounted display investment since 2023, treating the technology as a direct operational cost reduction tool rather than purely a training enhancement. Vendors offering proven platforms are winning contracts. ahead of competitors entirely across the industry.
Market Impact: 24 percent report ergonomic discomfort limits

Market Restraints and Challenges

Content Development Costs Slow Enterprise Rollout

Developing custom training simulations and AR workflow overlays requires substantial specialized content creation investment beyond hardware purchase, a friction point rooted in most enterprises lacking internal expertise to build effective immersive training content without external development partners. Roughly 27 percent of surveyed enterprises report content development cost as a factor limiting full-scale rollout beyond initial pilot programs despite recognizing hardware value. Vendors are responding by expanding content marketplace offerings and managed content development services that reduce the specialized expertise burden. across most large enterprise deployment categories tracked closely today. overall.
Market Impact: 42 percent report measurable time reduction

Ergonomic Discomfort Limits Extended Use Sessions

Extended head mounted display use during full work shifts remains physically uncomfortable for many users despite recent weight reduction progress, a friction point rooted in the fundamental challenge of balancing display resolution, battery capacity, and processing power against wearable weight constraints that consumer smartphones never faced. Roughly 24 percent of surveyed enterprise users report ergonomic discomfort as a factor limiting extended shift use beyond short task-specific sessions. Vendors are responding by developing lighter form factors and split-compute architectures that offload processing weight. across most enterprise deployments requiring sustained full-shift usage today.
Market Impact: 35 percent consider headsets primary devices
4 additional market trends, 3 additional growth drivers, and 3 additional restraints and challenges are covered in the full report. Contact sales@marketmindsadvisory.com to access the complete intelligence.

Segment CAGR and Growth Architecture

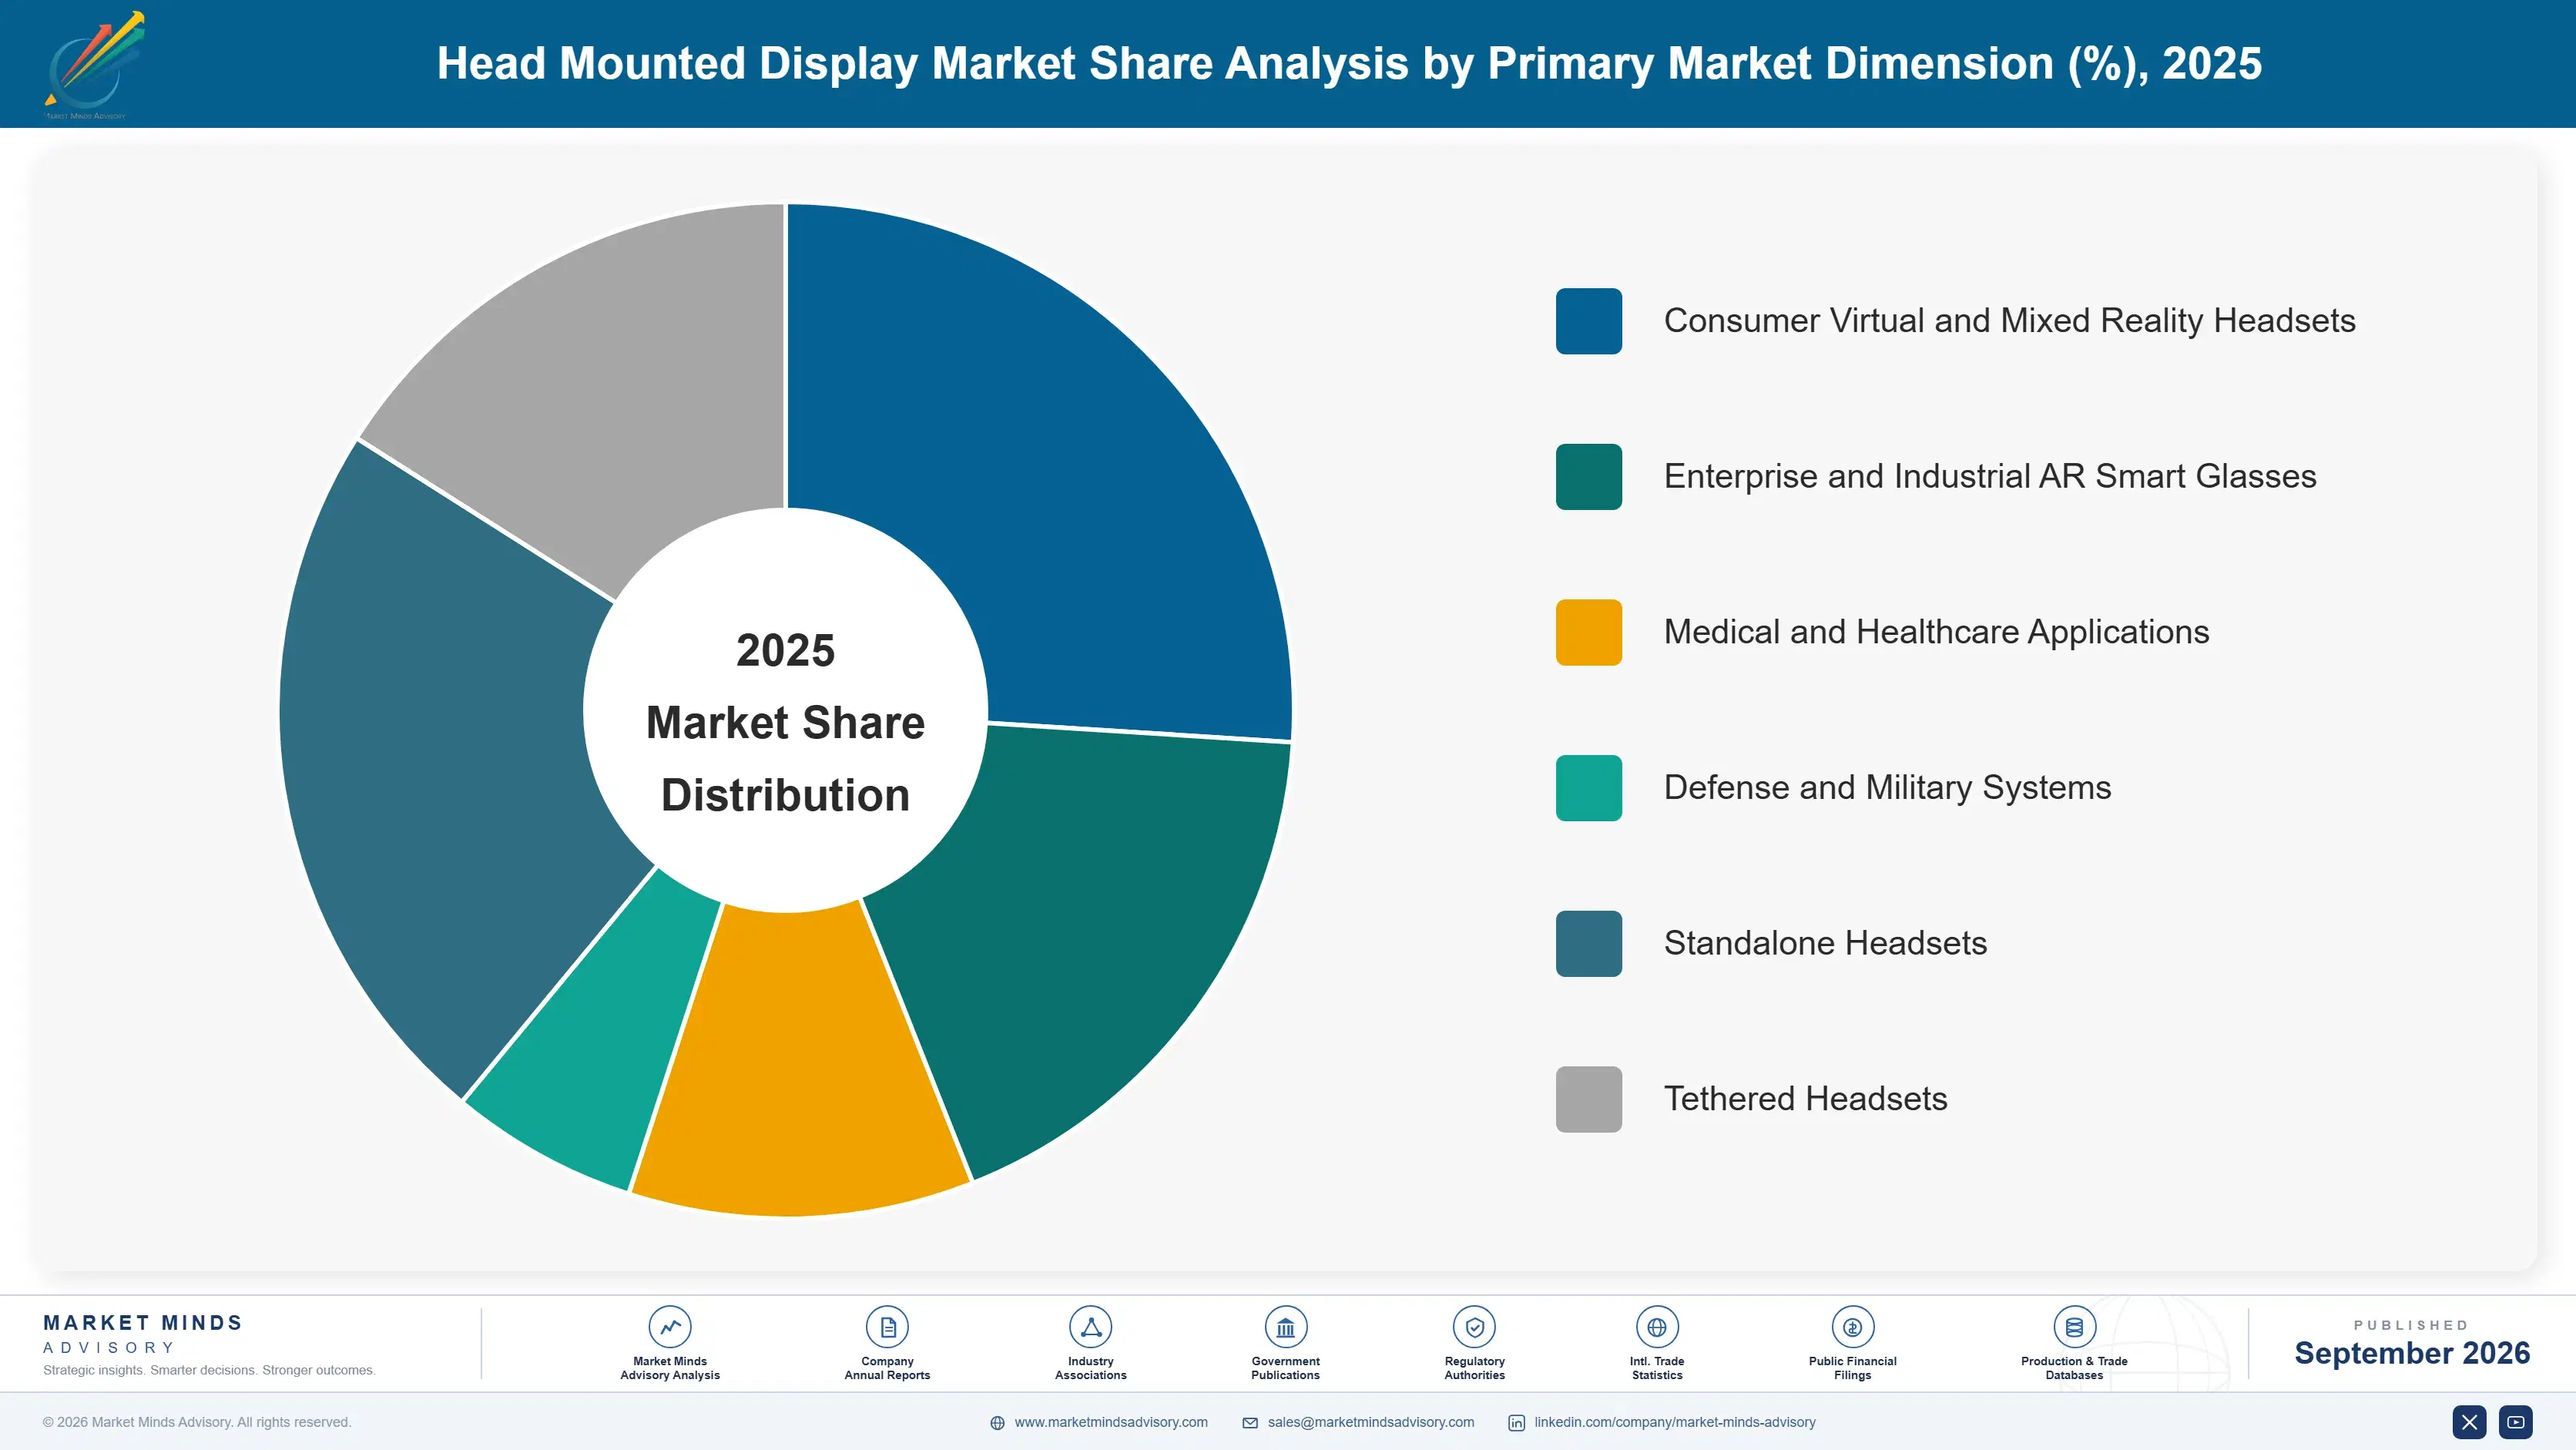
The head mounted display market segments by application, spanning consumer gaming, enterprise training and simulation, industrial AR field service, medical and healthcare applications, and defense and military systems broadly across sectors today. Enterprise and industrial AR smart glasses are expanding fastest as productivity evidence accumulates entirely. and evaluations across enterprise buyer categories worldwide. today.
global-head-mounted-display-market-market-share-analysis-1788420637970

Enterprise and Industrial AR Smart Glasses

Enterprise and industrial AR smart glasses connect field technicians to remote experts and overlay repair guidance directly onto equipment, replacing traditional printed manuals and phone-based troubleshooting that consumed substantially more time per service call across manufacturing and logistics operations. This segment is expanding fastest as enterprises prioritize demonstrable task completion time reduction over traditional feature checklist comparisons, treating AR guidance as a genuine operational differentiator rather than an experimental novelty to be evaluated skeptically. Vendors including Vuzix and RealWear have invested heavily in industrial-grade smart glasses, and roughly 42 percent of field service organizations now report measurable time reduction using AR guidance. Growth here is expected to remain the fastest across the entire market well into the next decade.
CAGR 19.0%

Consumer Virtual and Mixed Reality Headsets

Consumer virtual and mixed reality headsets remain the largest revenue segment by a substantial margin, providing immersive gaming and entertainment experiences that most existing consumer electronics purchases rely on despite growing enterprise AR competition from newer alternatives. This segment carries the deepest installed base in the market, favoring established vendors with the broadest catalog of compatible content libraries and reliability track record over newer entrants lacking comparable consumer trust built over years of product deployment. Growth has moderated as enterprise applications increasingly capture incremental market investment instead. Suppliers with the deepest content library advantages continue defending share even as growth decelerates industry-wide considerably each year. across most global consumer electronics markets.
CAGR 8.0%
Full segment breakdown across 6 segments available in the complete report.

Regional Architecture and Country Demand Map

North America leads global demand given consumer electronics concentration and enterprise training investment. East Asia follows through manufacturing automation scale, while South Asia and Pacific posts the fastest regional growth rate as digital investment accelerates substantially. Regulatory and talent dynamics continue shaping this timing across the region today.

North America

The United States anchors North American demand through its concentration of major gaming and consumer electronics companies alongside enterprises deploying AR field service tools at production scale requiring dedicated hardware investment. Financial services and technology sector enterprises lead enterprise adoption given substantial training budget scrutiny and productivity measurement requirements ahead of most global peers. Canada contributes a smaller but growing share, driven primarily by technology sector hardware investment supporting nearby American consumer electronics relationships. This lead should persist as consumer electronics and enterprise training investment continues expanding across the region substantially. and its position as the largest single hardware consumption market by contract value globally. and their supplier base. today.
Share: 32% | CAGR: 13.0% (2026 to 2036)

Western Europe

German and French industrial enterprises anchor Western European demand, driving substantial AR field service adoption as manufacturing facilities scale remote expert assistance and training simulation programs across production lines. United Kingdom-based financial institutions increasingly specify enterprise training simulation tools for compliance and skill development programs. Growth trails North America somewhat given the region's more conservative enterprise hardware adoption pace and longer procurement review processes. Adoption should still accelerate as manufacturing automation and enterprise training investment continues broadening across member states. across the bloc's largest industrial economies and their supplier networks and certification pathways. across their largest markets and long-term certification and compliance pathways overall. as compliance timelines continue clarifying across most member states further.
Share: 18% | CAGR: 10.0% (2026 to 2036)
Regional intelligence for 5 additional markets available in the complete report: East Asia, South Asia and Pacific, Latin America, Middle East and Africa, Eastern Europe. Contact sales@marketmindsadvisory.com.
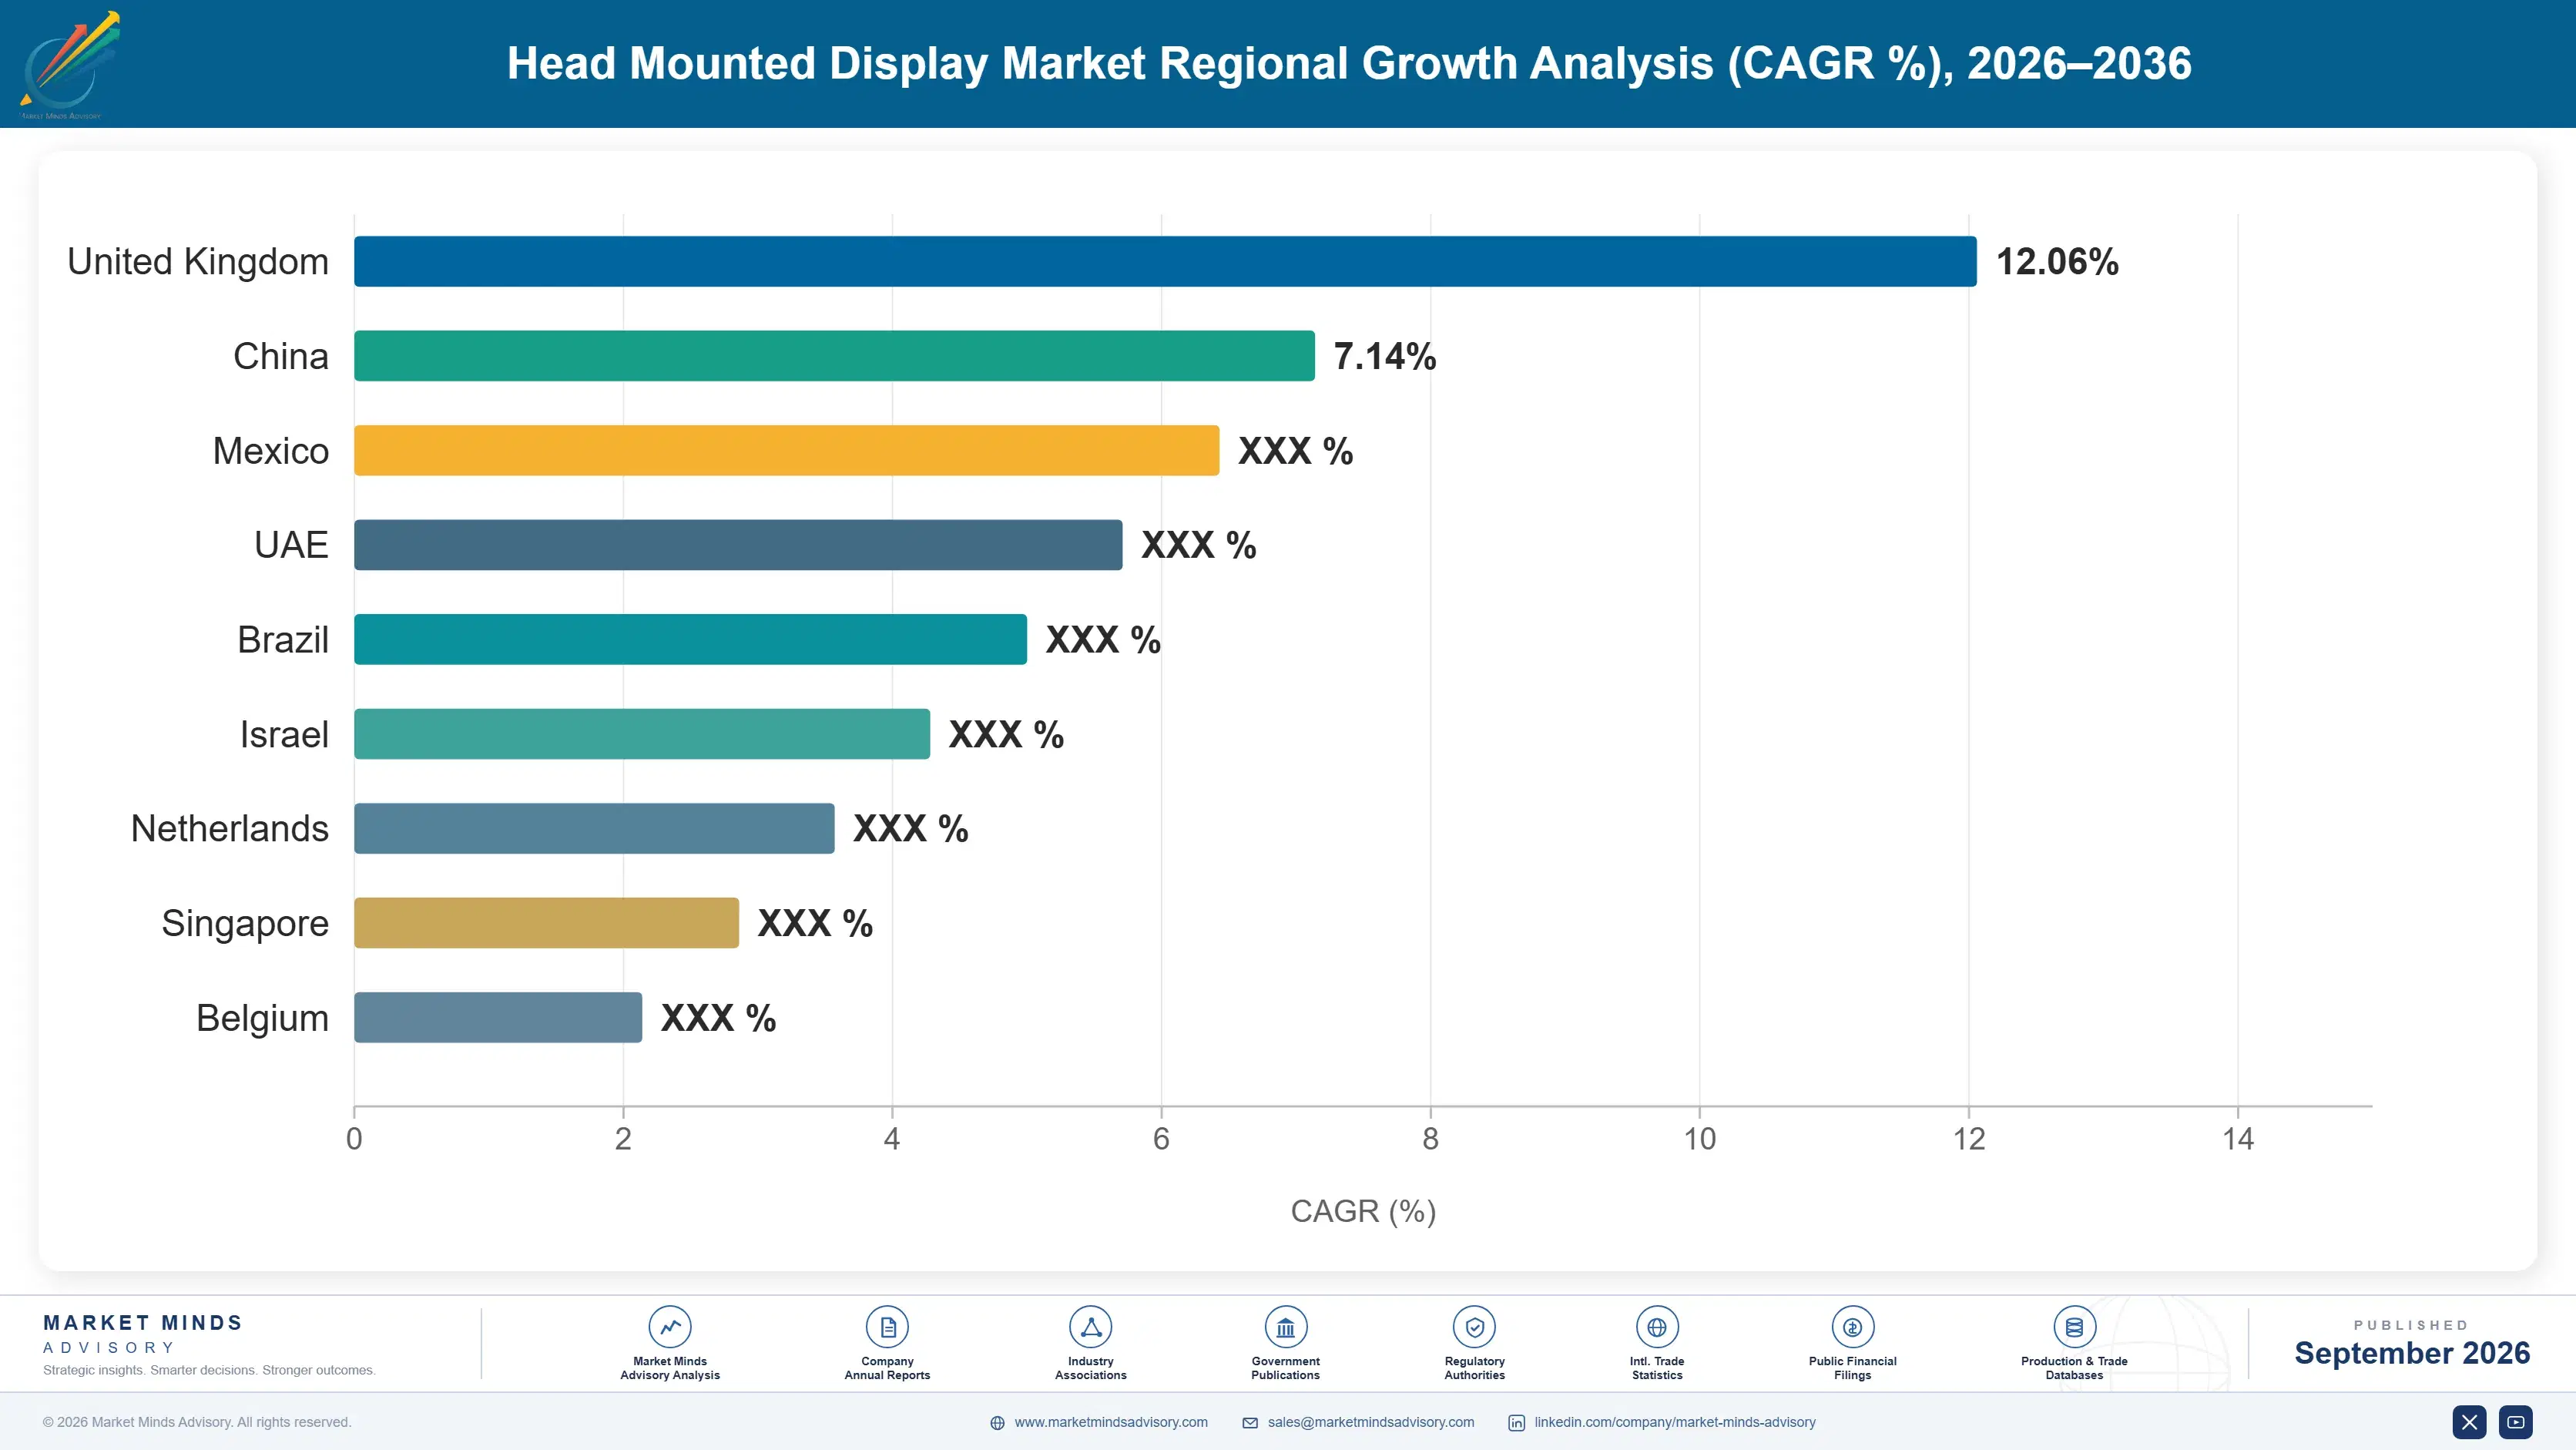
global-head-mounted-display-market-country-cagr-analysis-1788420638496

Where HMD Vendors Can Defend Margin

As consumer headset pricing compresses toward commodity hardware costs, manufacturers must move up the value chain toward enterprise AR productivity depth, content development services, and quantified time-savings evidence that generalist consumer hardware competitors cannot easily replicate given their narrower engineering investment focus. Vendors that delay this shift risk being squeezed out of the highest-value segments over time.

Expand Enterprise AR Productivity Investment Directly

Manufacturers can invest in enterprise-grade AR capability covering remote expert assistance and workflow guidance, capturing premium design wins where roughly 42 percent of field service organizations now report measurable time reduction using AR guidance. Enterprise contracts typically carry substantially higher margins than consumer headset alternatives, and specialized investment creates a durable barrier smaller competitors cannot easily replicate without dedicated engineering resources built over multiple product cycles. Vendors slow to pursue this channel risk losing ground to specialized enterprise AR competitors entirely across renewal conversations. today across the industry. overall. today.
Market Impact: Captures a growing share of 42 percent reporting savings

Build Managed Content Development Service Capability

Manufacturers can offer managed content development services and pre-built training simulation templates, directly addressing the roughly 27 percent of enterprises citing content development cost as a factor limiting full-scale rollout beyond initial pilot programs. This service layer differentiates vendors competing for large enterprise deployment contracts that hardware-only competitors cannot credibly pursue at comparable scale or speed. Vendors slow to build this service capability risk losing large enterprise deployment contracts to more prepared competitors entirely. This compliance advantage compounds meaningfully as more enterprises formalize content development requirements broadly. directly. today. overall.
Market Impact: Addresses the 27 percent citing content development costs

Develop Lighter Split-Compute Form Factor Investment

Manufacturers can invest in lighter form factors and split-compute architectures that offload processing weight away from the headset itself, directly addressing the roughly 24 percent of enterprise users reporting ergonomic discomfort as a factor limiting extended shift use beyond short task-specific sessions. This capability opens full-shift deployment opportunities that vendors lacking comparable ergonomic investment cannot credibly pursue. Vendors slow to build this ergonomic capability risk losing full-shift deployment contracts to more comfortable competitors entirely. This ergonomic advantage compounds meaningfully as more enterprises formalize extended shift usage requirements broadly. overall. today.
Market Impact: Opens deployment for the 24 percent limited scope

Offer Quantified Productivity Reporting Tools Directly

Manufacturers can build measurement and reporting tools that quantify field service and training productivity gains directly attributable to head mounted display deployment, directly addressing enterprise demand for demonstrable value evidence beyond feature capability claims alone across procurement committees. This reporting capability accelerates budget approval conversations that competitors relying purely on qualitative claims cannot match at comparable speed. This reporting capability has already helped vendors accelerate roughly 30 percent of stalled enterprise budget approvals. Vendors slow to build this reporting capability risk losing budget conversations to more evidence-driven competitors entirely. overall.
Market Impact: Accelerates 30 percent of stalled budget approvals directly

Who Controls the Margin Pool

The head mounted display market remains fairly concentrated at a 56 percent five-company share on an annual recognized revenue basis, with a meaningful gap separating Meta and Apple, whose broad consumer installed base and platform integration depth anchor leading positions, from challengers still building comparable enterprise AR credentials. Both leaders now differentiate primarily on enterprise AR depth and content library breadth rather than pure hardware specifications alone.
Current competitive activity centers on enterprise AR capability expansion and content development services, as vendors race to either defend consumer volume through established installed base or capture premium field service design wins through specialized capability that generalist consumer hardware manufacturers cannot easily match. This shift is squeezing margins for vendors that have not yet invested in comparable enterprise AR or content development capability.

Rankings are likely to shift as enterprise AR depth increasingly determines long-term competitive positioning, favoring vendors that build genuine technical expertise over those competing purely on brand recognition or content library breadth, a dynamic increasingly separating technically differentiated leaders from broad consumer incumbents relying on installed base alone. Vendors slow to build this technical depth risk losing ground to more differentiated competitors entirely across both channels.
global-head-mounted-display-market-company-positioning-matrix-1788420639019

Competitive Moat and Risk Dimensions

META

Moat: Deep Consumer Installed Base

Meta's long-established consumer headset installed base and extensive content library catalog give it switching cost advantages that newer enterprise-native entrants cannot replicate without years of comparable platform development and customer trust building. This distribution and trust advantage compounds with every new content title the company adds to its extensive catalog.
META

Risk: Enterprise AR Catch-Up Pressure

Meta faces mounting pressure to match the enterprise AR depth of newer specialized entrants built from the ground up around field service productivity, requiring substantial engineering investment to avoid losing enterprise conversations today. Product teams increasingly compete for scarce capital against higher-growth enterprise product lines internally.
APPLE

Moat: Broad Consumer Platform Integration

Apple's head mounted display capability integrates natively with its widely deployed consumer device platform, giving it cross-selling relationships into existing customer bases that standalone AR vendors cannot easily replicate across their portfolios and product lines. This cross-sell motion lowers customer acquisition cost meaningfully compared to standalone head mounted display vendors.
APPLE

Risk: Premium Pricing Limits Enterprise Reach

Apple's premium-focused positioning commands pricing that budget-constrained enterprise buyers increasingly find difficult to justify against lower-cost competitors offering comparable field service capability without equivalent brand premium. Competitors with mid-market pricing are winning deals Apple's premium positioning cannot access easily. Retention suffers accordingly among budget-conscious buyers.

Players Tracked

Prominent Players

Meta
Apple
Sony
HTC
Microsoft

Other Key Players

Magic Leap
Varjo
Pico
Valve
Samsung
Vuzix
RealWear
Rokid
Xreal
Panasonic
Lenovo
Google
Epson
Kopin Corporation
Canon

Recent Developments

JANUARY 2026

Meta Expands Enterprise AR Field Service Investment

Meta announced expanded investment in enterprise AR field service capability dedicated to remote expert assistance applications, targeting increased productivity measurement accuracy to serve rising enterprise demand across global manufacturing customer relationships. The investment targets closing productivity measurement gaps against newer AR-native platform competitors. today. overall.
Signal: Signals established consumer vendors racing to close enterprise AR gaps before losing further competitive ground. overall.
SEPTEMBER 2025

Apple Acquires Content Development Software Firm

Apple acquired a content development software firm to expand its capability for generating enterprise training simulation content, addressing customer demand for faster deployment turnaround during enterprise rollout qualification cycles broadly. Financial terms of the acquisition were not publicly disclosed by either company involved. overall. today.
Signal: Reflects growing vendor focus on content development as a key competitive differentiation strategy broadly. directly. overall.
MAY 2025

Sony Signs Enterprise Manufacturing Partnership

Sony signed a multi-year head mounted display supply partnership agreement with a major manufacturing enterprise, covering AR field service and training simulation deployment across multiple production facility programs planned through 2029. Contract value and deployment schedule details were not publicly disclosed by either party. directly.
Signal: Indicates growing manufacturing demand shaping vendor priorities across the broader industry and hardware landscape overall. directly.

Display Panel and Optics Component Exposure

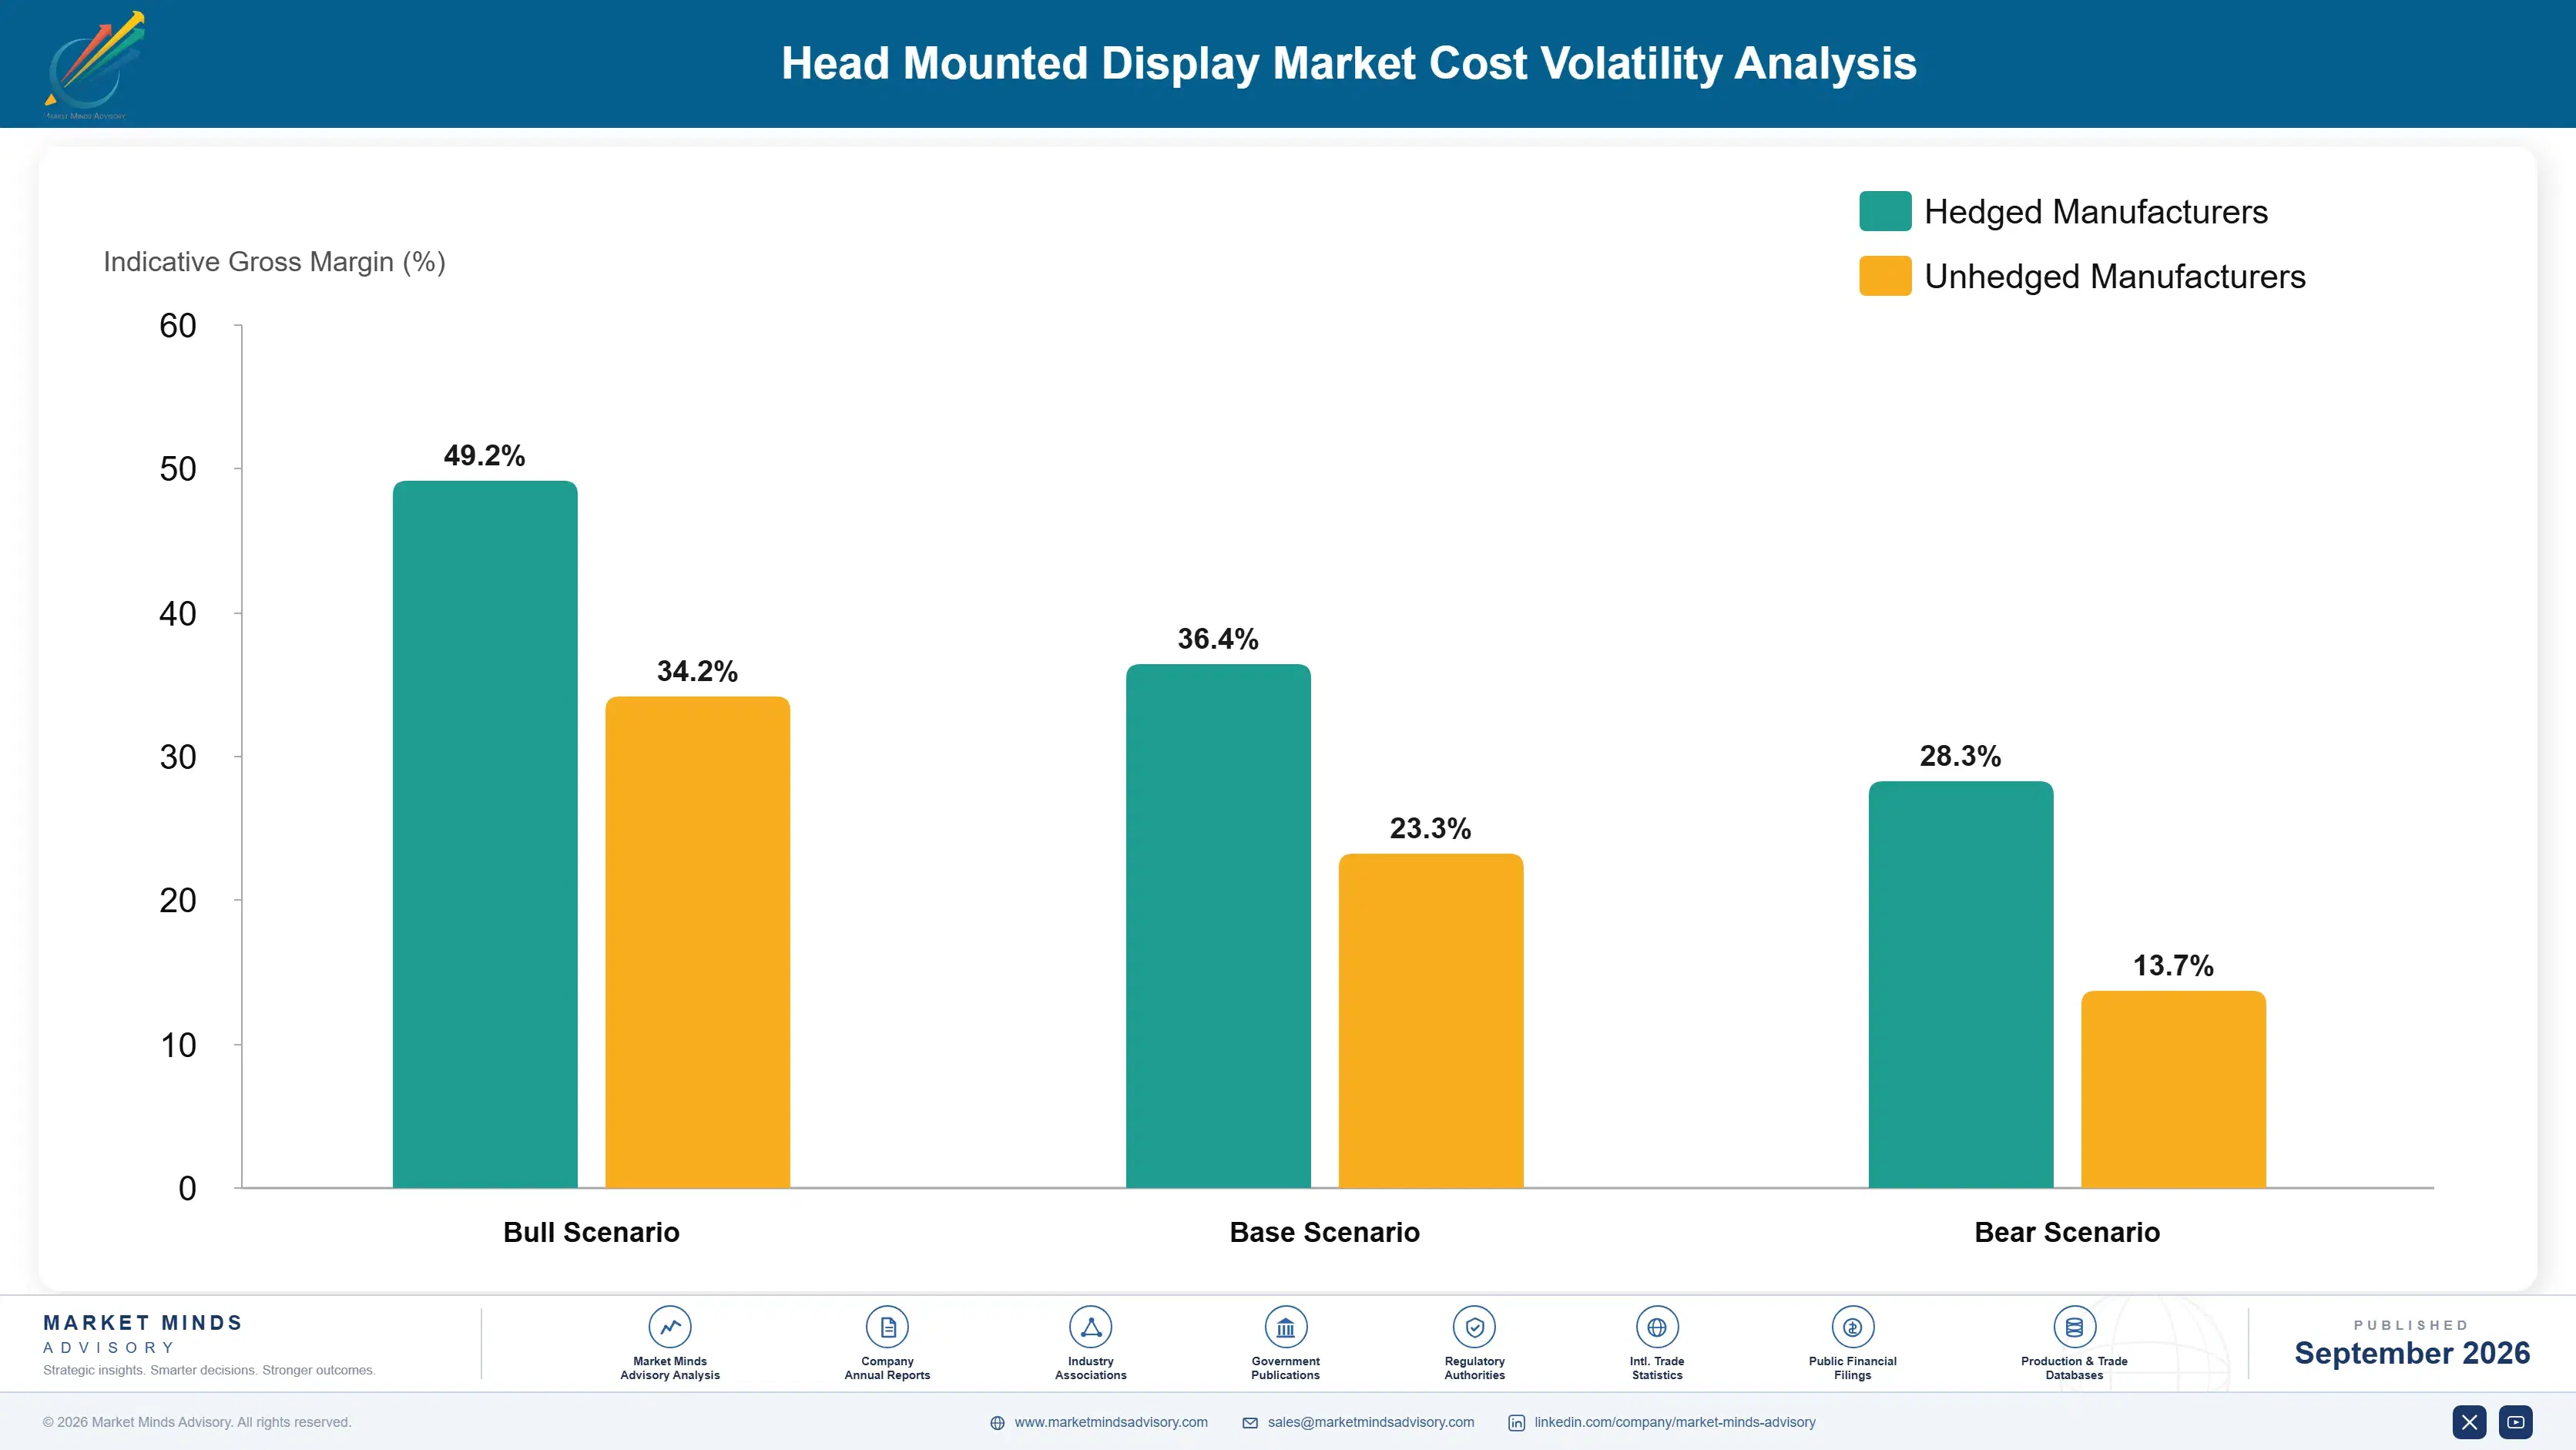
High-resolution display panels and precision optical lenses together represent roughly 45 percent of total cost of goods sold for head mounted display manufacturers, sourced through specialized display fabrication facilities and precision optics suppliers concentrated among a small number of established firms primarily located across East Asia and North America. across every active manufacturing facility and product line the company operates internationally today.
Micro-OLED and precision optics component prices rose meaningfully during 2023 as global display demand surged alongside broader consumer electronics manufacturing recovery, according to company annual reports and public industry pricing disclosures, squeezing margins for manufacturers running high production volumes across global headset manufacturing operations and supply chains. particularly during peak production cycles ahead of major consumer and enterprise deployment milestones worldwide overall. overall. directly. overall.

This exposure disadvantages smaller independent manufacturers lacking long-term supply agreements far more than platform leaders like Meta and Apple, which negotiate materials pricing directly with suppliers at meaningfully larger scale, allowing them to absorb cost increases without passing them through to customers as aggressively as smaller competitors must. and existing long-term customer relationships built over multiple product generations and years of collaboration.
global-head-mounted-display-market-cost-volatility-analysis-1788420639215

Long-Term Display Panel Supply Agreement Strategy

Manufacturers increasingly lock long-term supply agreements with display panel and optics suppliers rather than relying on spot market purchasing, reducing exposure to price volatility and improving negotiating leverage during annual contract renewal cycles across their combined manufacturing footprint and production planning cycles worldwide. This proactive sourcing strategy also improves production planning predictability across multi-year manufacturing roadmaps and budgets.

Multi-Source Component Procurement Strategy

Manufacturers qualify display panels and optical components from multiple regional suppliers rather than relying on a single source, reducing exposure to localized production disruptions and price spikes while improving negotiating leverage during periods of tight materials allocation across the broader supply chain network globally. This diversification also improves overall supply resilience during periods of geopolitical trade disruption or tariff changes.

Vertical Integration Into Display Manufacturing

Larger manufacturers increasingly invest in vertically integrated display and optics manufacturing capability to reduce dependency on external suppliers, lowering the specialized materials dependency that has historically constrained scaling and margin expansion across the broader head mounted display vendor landscape and customer base worldwide. This vertical integration also accelerates product development cycles across the manufacturer's broader hardware portfolio.

Portfolio Architecture for Margin Defence

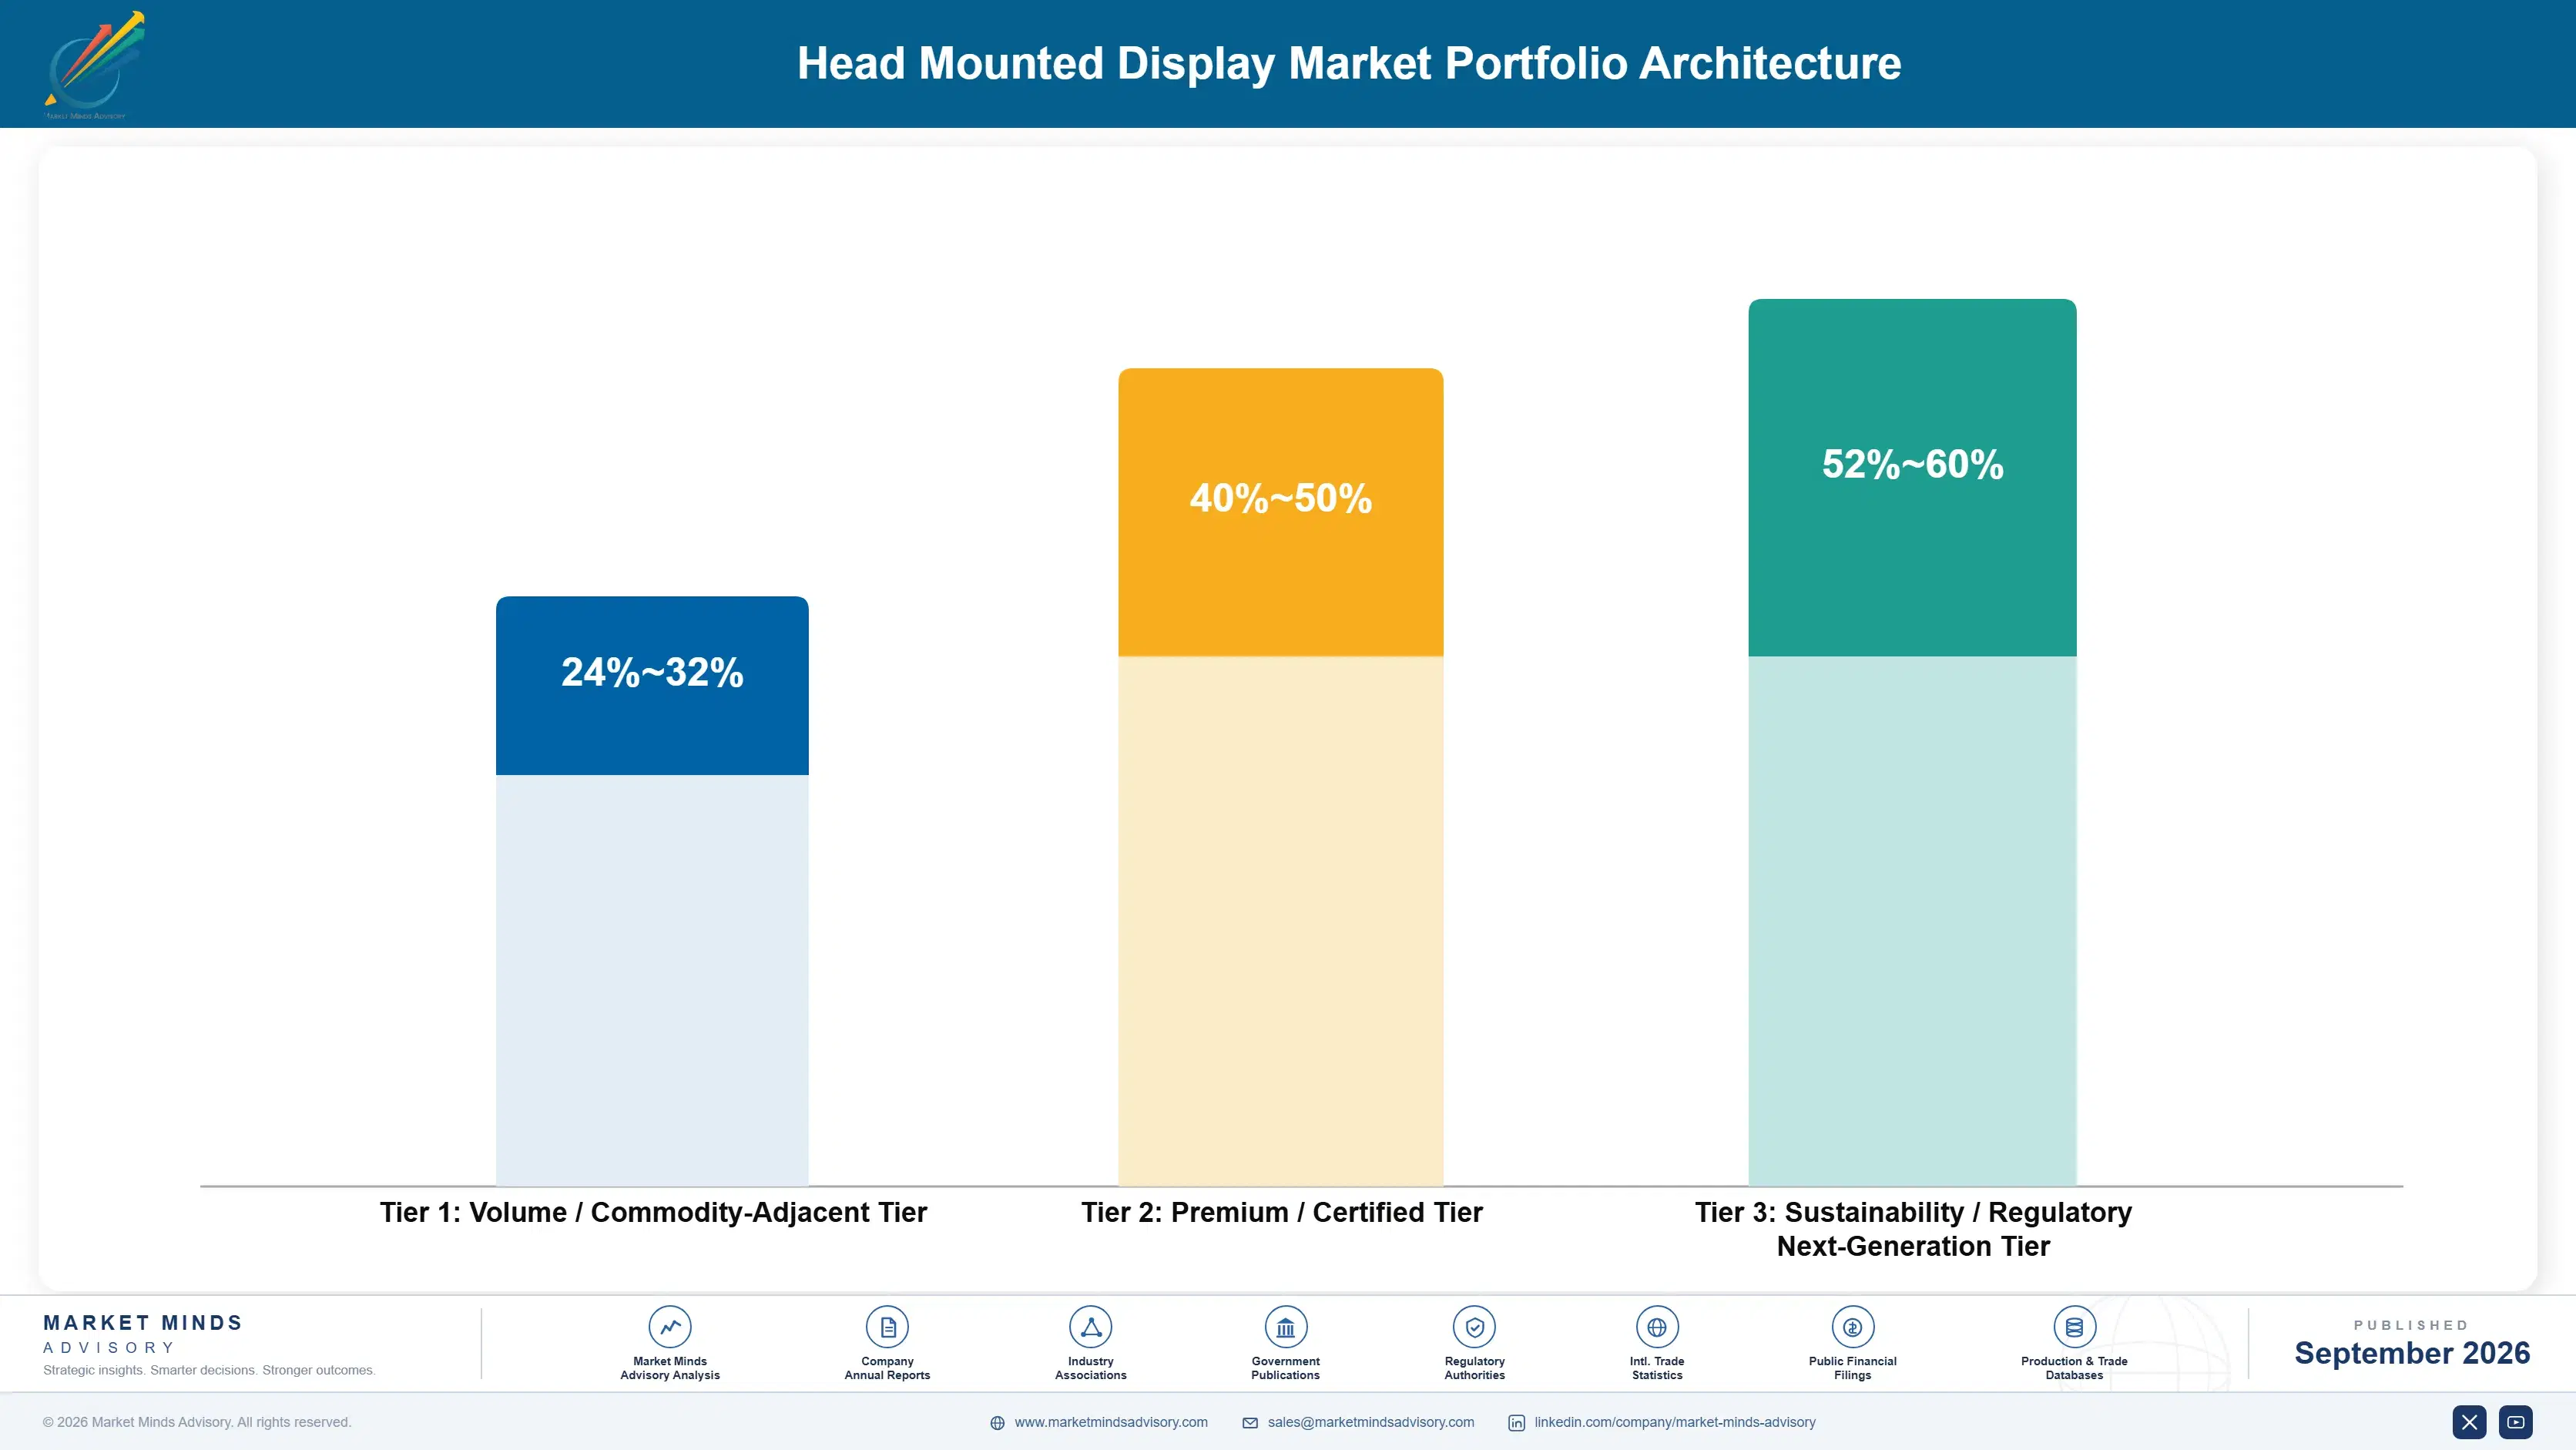
Head mounted display margins split across a three-tier architecture shaped heavily by application specialization rather than pure hardware volume alone. Volume commodity-adjacent consumer headsets compete largely on price against established installed base leaders, while premium certified enterprise AR platforms command meaningful margin premiums tied to demonstrable productivity gains and specialized field service integration capability. This distribution-driven split increasingly determines who wins the largest enterprise and government contracts.
The sustainability and next-generation tier, anchored by enterprise AR and content development bundles, now captures a disproportionate share of gross profit dollars relative to its current deployment volume, reflecting how enterprises pay durable premiums for measurable productivity that commodity consumer manufacturers cannot easily replicate. This pattern strengthens further as more enterprises formalize productivity measurement as a procurement criterion.

Volume tier consumer headsets still anchor manufacturing scale and revenue base for most established vendors, but the real strategic tension now sits between defending that commodity revenue base and investing in the enterprise AR and content development capability where growth and profitability both concentrate most heavily going forward through the current forecast period. Vendors that delay this shift risk losing relevance entirely within a few product cycles.

Volume / Commodity-Adjacent Tier

Standard consumer virtual reality headsets competing primarily on price and content library breadth, serving mainstream gaming and entertainment applications with minimal specialized productivity requirements. Margins remain thin given intense price competition and limited differentiation across most comparable consumer offerings.
Gross Margin: 24-32%

Premium / Certified Tier

Enterprise-grade AR smart glasses and mixed reality systems carrying reliability certification that justify premium pricing above commodity consumer alternatives across manufacturing and healthcare customer segments and applications. Contract sizes here run meaningfully larger than commodity tier deals given demonstrable productivity gain evidence.
Gross Margin: 40-50%

Sustainability / Regulatory / Next-Generation Tier

Field service platforms and content development bundles commanding the highest margins on quantified productivity evidence, ergonomic engineering investment, and documented workflow integration support required for regulated deployments. This tier increasingly attracts the largest enterprise contracts as compliance requirements shape procurement decisions directly.
Gross Margin: 52-60%
global-head-mounted-display-market-portfolio-architecture-1788420639717

High-value Sub-segments and Strategic Watch-out

Enterprise AR Field Service Platforms

The highest-value pool in the market, capturing premium manufacturing contracts through quantified productivity evidence that generalist consumer hardware competitors cannot match regardless of their underlying display resolution claims today. Vendors positioned early here could capture disproportionate share as enterprise AR adoption continues accelerating steadily further.
Gross Margin: 54-62%

Managed Content Development Services

A high-value pool growing at a rapid pace as enterprises prioritize outsourced simulation and training content creation over in-house development capability, converting service contracts directly into premium renewal pricing overall. Growth here is expected to accelerate further as enterprises scale content development service requirements substantially.
Gross Margin: 46-54%

Consumer Virtual Reality Headsets

The volume core of the market, generating predictable manufacturing scale even as growth rates moderate relative to newer enterprise AR categories gaining budget share steadily each year across most consumer segments. Vendors here increasingly compete on manufacturing scale rather than differentiated AR or content service capability.
Gross Margin: 24-32%

Legacy Bulky Tethered Headsets

A strategic watch-out segment where lightweight standalone hardware and split-compute architectures could materially reshape competitive positioning for manufacturers still dependent on legacy tethered headset revenue across their portfolios. Vendors overexposed here risk sudden revenue disruption as lightweight standalone hardware accelerates across categories. and product categories today.
Gross Margin: 16-24%

Field Deployments Build Recurring Hardware Demand

Head mounted display vendors generate durable annuity-like economics once enterprise AR platforms integrate into a facility's core field service and training workflows, since switching vendors means losing months of accumulated content configuration and workforce training that made the platform genuinely productive, giving established vendors a renewal advantage over competitors offering comparable raw hardware but lacking equivalent workflow integration depth across contested production conditions. across the vendor's entire enterprise customer base.
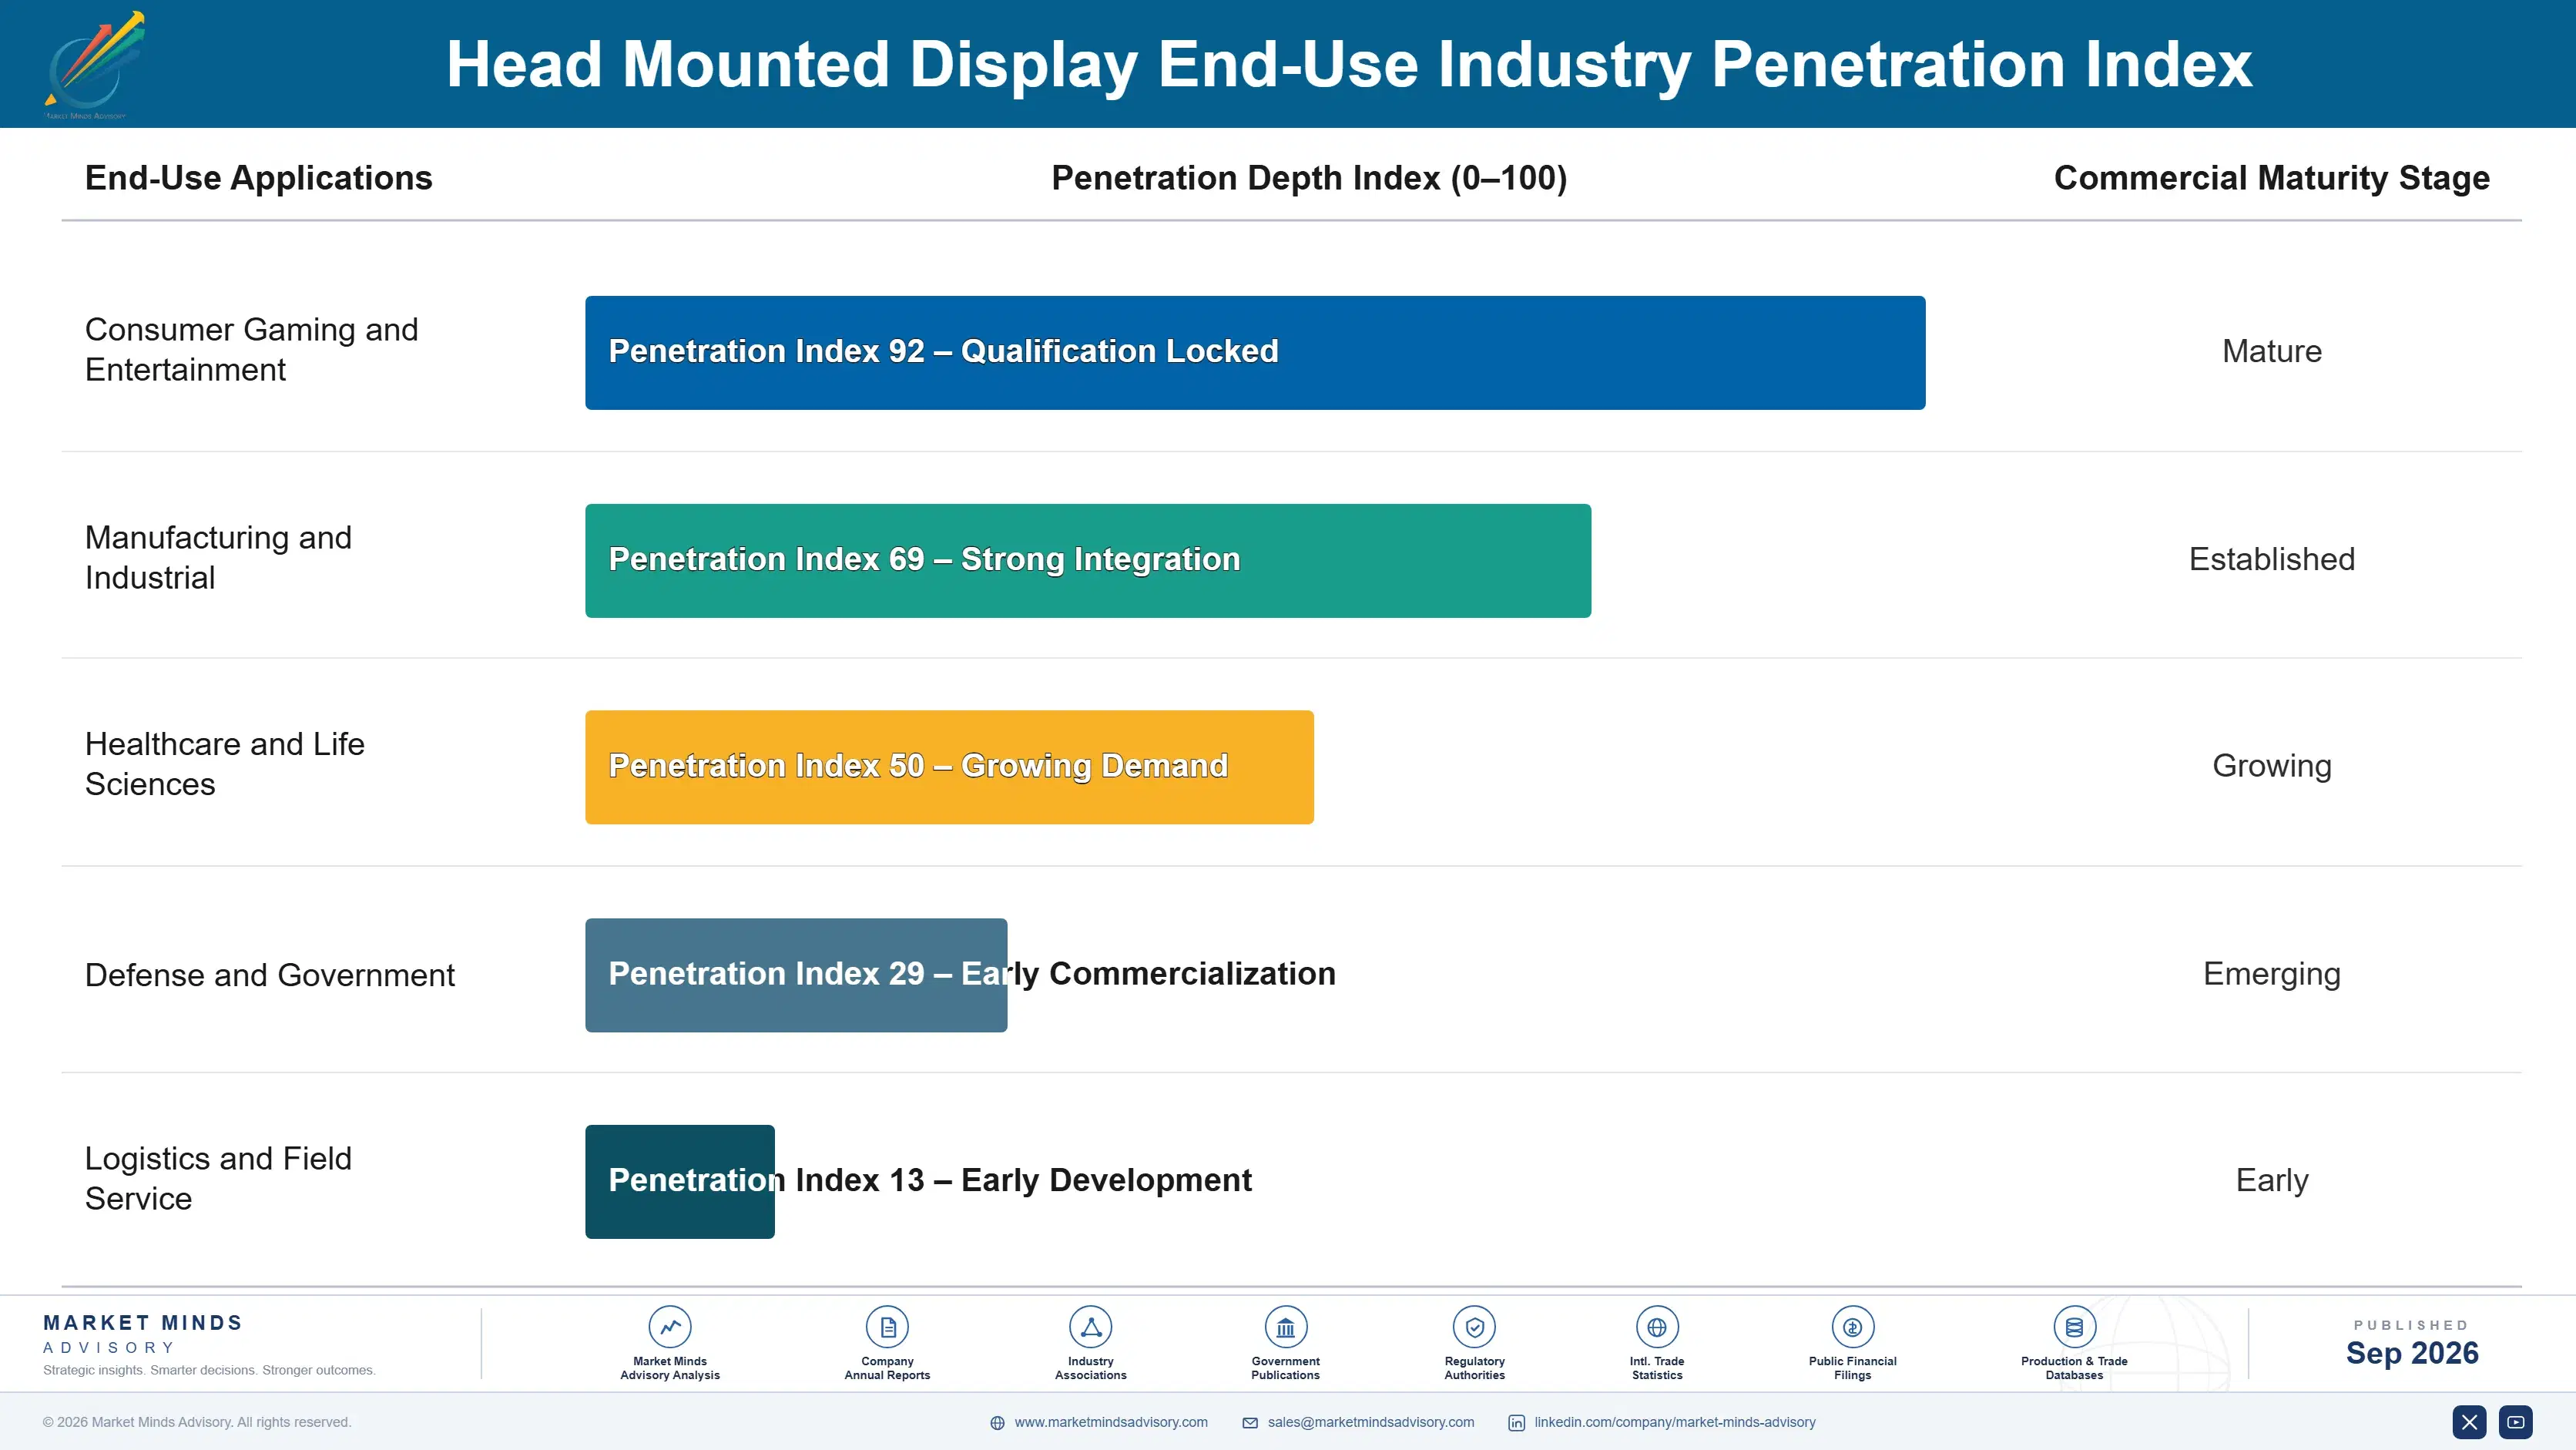
Adoption depth varies sharply by end-use vertical. Manufacturing and healthcare enterprises embed vendor relationships deepest, treating AR platforms as strategic operational infrastructure integrated tightly with existing field service and training management systems, while consumer buyers remain more price-sensitive and switch readily whenever a competitor offers comparable specifications at a meaningfully lower price point. Mid-market buyers sit between these extremes, valuing reliability but remaining more cost-conscious than large enterprise procurement teams.

A generational shift in buyer profile is underway as operations technology leads increasingly influence procurement decisions over traditional training managers who historically favored established hardware vendors, a dynamic accelerating adoption of enterprise AR platforms ahead of legacy consumer-focused headsets across enterprise renewal cycles. Technical evaluators increasingly outrank cost-focused procurement officers in most technology organizations.
global-head-mounted-display-market-end-use-penetration-index-1788420640206

Where MMA Sees HMDs Heading

These are among the four positions where our research anticipates prominent divergence between winners and laggards over the coming forecast period. Each is grounded in the demand model, the regulatory perimeter, and the announced capacity pipeline.
01 / ENTERPRISE AR PRIORITY

Enterprise AR investment deserves priority as field service productivity proof accumulates

Roughly 42 percent of surveyed field service organizations now report measurable task completion time reduction using AR guidance, making productivity depth a genuine competitive moat rather than a marketing claim vendors could previously get away with asserting loosely. Vendors that build genuine enterprise AR capability now will win the largest field service contracts before competitors catch up, since platform development cycles take years to replicate credibly. This gap widens further as more enterprises formalize productivity evidence into procurement processes across the industry.
02 / CONTENT SERVICE EXPANSION

Managed content development captures underserved enterprise rollout demand

Roughly 27 percent of surveyed enterprises cite content development cost as a factor limiting full-scale rollout beyond initial pilot programs, representing a substantial opportunity for vendors offering managed content development services and pre-built training templates across multiple deployment scenarios. Vendors that simplify content creation reduce customer decision friction and capture rollout contracts competitors dependent on fully custom development cannot match at comparable speed or cost. This capability increasingly separates efficient suppliers from slower, more disruptive competitors across the broader industry landscape.
03 / ERGONOMIC INVESTMENT STRATEGY

Lighter form factors open full-shift enterprise deployment opportunities

Roughly 24 percent of surveyed enterprise users report ergonomic discomfort as a factor limiting extended shift use beyond short task-specific sessions, a requirement vendors lacking split-compute architecture cannot credibly satisfy regardless of their underlying display quality or broader software platform capability. Vendors that invest in lighter form factors now will access full-shift deployment segments before competitors establish comparable ergonomic engineering credentials. This engineering advantage compounds as more enterprises formalize extended-use requirements further across manufacturing, healthcare, and logistics sectors directly overall.
04 / PRODUCTIVITY REPORTING FOCUS

Quantified evidence tools accelerate enterprise budget approval considerably

Enterprises increasingly demand demonstrable productivity evidence beyond feature capability claims alone, representing a substantial opportunity for vendors that build measurement and reporting tools quantifying platform value directly for finance and operations leadership across the organization. Vendors that provide this quantified evidence accelerate budget approval conversations that competitors relying purely on qualitative claims cannot match at comparable speed. This capability increasingly separates evidence-driven leaders from vendors still relying on marketing claims alone across the broader competitive market landscape directly and consistently.

Engagement Snapshot From the Field

A live engagement with an industry participant carrying material or product regulatory and market exposure ahead of a defining policy shift, showing how our research translates into a defensible multi-year portfolio strategy.
MARKET MINDS ADVISORY · CLIENT ENGAGEMENT SUMMARY
Head Mounted Display Producer Strategic Portfolio Review and Transition Roadmap 2026·Investment Scenario on Head Mounted Display Exposure Evaluation 2025-26
CLIENT PROFILE
A mid-tier industrial manufacturer with roughly $95 million in annual field service and training spending (client-reported, unverified by MMA) approached MMA after facing rising travel costs for specialized equipment repairs and requested a structured AR vendor evaluation before expanding its field service program. The engagement carried added urgency given the compressed timeline before the next capital budget planning cycle.
STRATEGIC CHALLENGE
The client's existing field service approach relied entirely on dispatching specialized technicians to distant facilities for equipment repairs, creating substantial travel cost and response time exposure, yet selecting an AR vendor without adequate productivity validation risked wasting capital on unproven technology. Operations leadership required a resolution before finalizing the annual field service budget allocation.
MMA APPROACH
MMA benchmarked five candidate vendors against remote assistance capability, task completion time reduction evidence, and total cost of ownership over a two-year horizon, supplementing vendor claims with structured interviews of peer manufacturers that had already completed comparable AR field service vendor transitions successfully. MMA also modeled deployment risk explicitly, given the client's active field service operations at engagement start.
KEY FINDINGS
  1. The client's existing travel-dependent field service model generated substantial response delays averaging several days for complex equipment issues requiring specialized expertise. across the client's entire equipment inventory.
  2. AR-enabled remote assistance vendors reduced projected average response time by roughly 65 percent (client-reported, unverified by MMA) compared to the client's existing travel-dependent approach.
  3. A phased regional pilot approach, testing AR remote assistance at two facilities before full rollout, avoided wasting capital while validating vendor reliability under real conditions.
  4. Post-pilot productivity metrics confirmed measurable task completion time reduction, supporting confidence for the full field service program expansion across all facilities. across the manufacturing network broadly.
CLIENT PROFILE
A mid-tier industrial manufacturer with roughly $95 million in annual field service and training spending (client-reported, unverified by MMA) approached MMA after facing rising travel costs for specialized equipment repairs and requested a structured AR vendor evaluation before expanding its field service program. The engagement carried added urgency given the compressed timeline before the next capital budget planning cycle.
STRATEGIC CHALLENGE
The client's existing field service approach relied entirely on dispatching specialized technicians to distant facilities for equipment repairs, creating substantial travel cost and response time exposure, yet selecting an AR vendor without adequate productivity validation risked wasting capital on unproven technology. Operations leadership required a resolution before finalizing the annual field service budget allocation.
MMA APPROACH
MMA benchmarked five candidate vendors against remote assistance capability, task completion time reduction evidence, and total cost of ownership over a two-year horizon, supplementing vendor claims with structured interviews of peer manufacturers that had already completed comparable AR field service vendor transitions successfully. MMA also modeled deployment risk explicitly, given the client's active field service operations at engagement start.
KEY FINDINGS
  1. The client's existing travel-dependent field service model generated substantial response delays averaging several days for complex equipment issues requiring specialized expertise. across the client's entire equipment inventory.
  2. AR-enabled remote assistance vendors reduced projected average response time by roughly 65 percent (client-reported, unverified by MMA) compared to the client's existing travel-dependent approach.
  3. A phased regional pilot approach, testing AR remote assistance at two facilities before full rollout, avoided wasting capital while validating vendor reliability under real conditions.
  4. Post-pilot productivity metrics confirmed measurable task completion time reduction, supporting confidence for the full field service program expansion across all facilities. across the manufacturing network broadly.
RECOMMENDED STRATEGY
Phase 1: Phase 1 (Months 1 to 2): Select the AR remote assistance vendor and launch pilot deployment at two regional facilities first. Phase 2: Phase 2 (Months 2 to 5): Validate response time and productivity metrics across pilot facilities before expanding coverage further. Document findings thoroughly. Phase 3: Phase 3 (Months 5 to 9): Complete full field service program rollout supporting the planned company-wide deployment schedule. Track outcomes continuously.
OUTCOME
The client completed the field service program rollout within the recommended nine-month window, achieving measurable response time reduction with productivity metrics cited as a key factor in subsequent budget renewal (client-reported, unverified by MMA). The phased pilot validation framework is now the client's standard approach for future technology deployment decisions.

Frequently Asked Questions

Foundational context covering the market sizes, CAGR, scope, country, region and competition that inform every finding below. This section is provided to cover basics and most often pre-purchase conversations, answered from the MMA Primary Research Dataset.

What is the current size of the Head Mounted Display Market?

The global head mounted display market reached an estimated $9.8 billion in 2025. Growth is concentrated in enterprise AR smart glasses and consumer mixed reality headsets serving field service and entertainment applications.

How large will the Head Mounted Display Market be by 2036?

MMA projects the market will reach $32.45 billion by 2036, roughly a 2.97 times expansion from its 2026 base value, driven primarily by enterprise AR adoption and consumer hardware improvements.

What is the CAGR for the Head Mounted Display Market 2026 to 2036?

The market is projected to grow at an 11.5 percent compound annual growth rate between 2026 and 2036, with a bull case of 12.8 percent and a bear case of 10.2 percent.

Which segment is growing fastest?

Enterprise and industrial AR smart glasses are the fastest-growing segment, expanding at roughly 19.0 percent annually as field service organizations increasingly prove measurable productivity gains.

Who are the major companies in the Head Mounted Display Market?

Leading companies include Meta, Apple, Sony, HTC, and Microsoft, together holding an estimated 56 percent of the total global market on an annual basis. directly.

Which country is growing fastest?

South Korea is the fastest-growing major country market, expanding at approximately 16.0 percent annually as its gaming and electronics manufacturing sector scales substantially nationwide. directly.

Report Segmentation Architecture

The full report scope spans multiple orthogonal segmentation dimensions, with cross-tabulated demand data provided for each dimension pair. Coverage extends further to regional breakdowns, trend trajectories, and the competitive detail needed to support segment-level decision-making.

By Primary Market Dimension

  • Consumer Virtual and Mixed Reality Headsets
  • Enterprise and Industrial AR Smart Glasses
  • Medical and Healthcare Applications
  • Defense and Military Systems
  • Standalone Headsets
  • Tethered Headsets

By End-Use Industry

  • Consumer Gaming and Entertainment
  • Manufacturing and Industrial
  • Healthcare and Life Sciences
  • Defense and Government
  • Logistics and Field Service

By Commercial Dimension

  • Direct Hardware Sales
  • Enterprise Platform Subscription
  • Content Marketplace Licensing
  • Managed Service Contracts

By Region

  • North America
  • Western Europe
  • East Asia
  • South Asia and Pacific
  • Latin America
  • Middle East and Africa
  • Eastern Europe

Scope, Methodology, and Coverage

Every figure in this report is reproducible from documented input assumptions. The scope below maps the historical period, the forecast horizon, the segmentation dimensions, and the countries covered, alongside the underlying primary and qualitative methodology.
Historical Period
2020 to 2025
Forecast Period
2026 to 2036
Base Year
2025 (USD billions; MMA Primary Research Dataset, September 2026)
Market Definition
The head mounted display market covers virtual, augmented, and mixed reality headsets and smart glasses used across consumer entertainment, enterprise training, and industrial field service applications. It excludes standalone projector-based displays and traditional flat-panel monitors not worn on the body.
Quantitative Units
USD billions (current prices); unit shipment volume where disclosed
Segmentation Dimensions
By Primary Market Dimension; By End-Use Industry; By Commercial Dimension; By Region
Regions Covered
North America, Western Europe, East Asia, South Asia and Pacific, Latin America, Middle East and Africa, Eastern Europe
Countries Covered
USA, China, Germany, France, UK, Japan, South Korea, India, Australia, Canada, Brazil, Mexico, Indonesia, Vietnam, Thailand, Malaysia, UAE, Saudi Arabia, South Africa, Nigeria, Turkey, Poland, Netherlands, Italy, Spain, Sweden, Switzerland, Argentina, Colombia, Singapore, and additional markets relevant to this sector
Key Companies Profiled
Meta, Apple, Sony, HTC, Microsoft, Magic Leap, Varjo, Pico, Valve, Samsung, Vuzix, RealWear, Rokid, Xreal, Panasonic, Lenovo, Google, Epson, Kopin Corporation, Canon
Quantitative Methodology
Primary survey, n=3,800 respondents, Q4 2025, six countries; demand-side model with trade association cross-validation
Qualitative Methodology
47 expert interviews, Q4 2025; applied to validate demand model assumptions, identify emerging dynamics, and assess competitive positioning
Report Format
PDF and XLSX data workbook (Word format preview document)
Publisher
Market Minds Advisory
Report Code
MMA-2026-TEC-347
Published
September 2026
Contact
sales@marketmindsadvisory.com | www.marketmindsadvisory.com

Purchase the full Head Mounted Display Market Report (2026 to 2036).

The full report provides comprehensive market sizing, ten-year forecasts, and segment-level analysis across all six head mounted display categories and seven global regions. It includes detailed competitive profiling of twenty companies, input cost and display component supply chain risk assessment, and portfolio margin analysis by application tier. Readers gain access to primary survey data spanning 3,800 respondents and forty-seven expert interviews conducted across six countries during the fourth quarter of 2025. The report also includes a proprietary revenue lever framework identifying specific commercial actions manufacturers can take to defend margin.
Ten-year market size and CAGR forecasts
Segment-level growth rates and share analysis
Seven-region demand, pricing, and share breakdown
Twenty-company competitive benchmarking and positioning profiles
Input cost and display component risk mapping
Portfolio margin tier analysis and watch segments

Built For The People Who Decide

From boardroom strategy to bench-side execution, this report is read cover-to-cover by leaders shaping the next decade of their industry, turning demand scenarios, market dynamics and valuation benchmarks into decisions.
CXOs/ Presidents/ VPs/ Managers
M&A and Corporate Development
Strategy Teams and R&D Heads
Procurement and Product Directors
Regulatory and Compliance Leaders
Investor Relations and Equity Analysts