Market Minds Advisory
Gaming Gadgets Market

Gaming Gadgets Market: Gaming Gadgets Market. Streaming Economy Growth and VR Adoption Reshape Peripheral Demand

The streamer economy and mainstream VR adoption are pulling gaming peripheral spending well beyond hardcore enthusiasts, forcing manufacturers to compete on content creation capability as much as raw hardware performance today

Lead Analyst

Published

September 2026

Make Smarter Decisions with Customized Research Insights

Request a free sample report and evaluate market opportunities, growth trends, and competitive dynamics relevant to your business needs.

2025 MARKET VALUE$12.5BMarket Size 2025
2036 FORECAST VALUE$32.3BBase Case , 2026 to 2036
CAGR 2026 TO 20369.0 %Bull 10.3% / Bear 7.7%
INCREMENTAL OPPORTUNITY$18.6BNet 10- year value creation
EXPANSION MULTIPLE2.37x2036 value over 2026 base
Strategic Levers
M&A Pipeline
Regional Outlook
Country Rankings
Competitive Intelligence
Segmental Deep-dive
Call-Us : 91 93563 13602

Executive Snapshot and Market Trajectory.

Gaming peripheral spending is broadening well beyond hardcore enthusiasts, as streaming culture and mainstream VR adoption pull casual buyers into a category once defined narrowly by competitive performance specifications alone. Manufacturers increasingly design for content creators as a distinct buyer segment now.
Headsets and keyboards drive the bulk of unit volume, with North America and East Asia together accounting for the largest share of demand as streaming platform growth and esports viewership both continue expanding across most major regional markets and demographic segments worldwide today. Retailers report growing crossover between gaming and content creation buyers, who often purchase premium microphones and capture cards alongside traditional peripherals as their streaming ambitions expand beyond casual play into semi-professional territory.
Competition spans established peripheral specialists, console manufacturers entering through licensed accessories, and VR headset makers building entirely new hardware categories, while component cost pressure and streaming platform algorithm changes both increasingly shape product design and marketing strategy across the industry. Manufacturers with strong software platforms supporting customization and cross-device integration are increasingly favored by buyers seeking a unified setup across desks, consoles, and mobile devices rather than fragmented single-purpose hardware purchases.
Market Definition
The Gaming Gadgets Market covers headsets, keyboards, mice, controllers, VR and AR devices, and streaming peripherals sold for gaming and content creation use. It excludes bundled console hardware, general-purpose computing accessories, and standalone game software.
Base Year Value
$12.5B in 2025 (MMA Primary Research Dataset, September 2026)
Forecast Period
2026 to 2036, eleven discrete annual values
CAGR
9.0% base case. Bull 10.3%. Bear 7.7%.
Fastest Growth Segment
VR and AR Gaming Devices: 14.5% CAGR
Fastest Growth Country
India: 11.5% CAGR
Fastest Growth Region
South Asia and Pacific: 11.0% CAGR
Largest Region
North America: 28% of 2025 global value
Market Leaders
Leading players: Logitech, Razer, Corsair, SteelSeries, HyperX. Source: MMA Primary Research Dataset, July 2026.
Primary Survey
n=3,800 procurement and R&D decision-makers, Q4 2025, six countries
Methodology
Demand-side build-up, cross-validated against public data, 47 expert interviews

Gaming Gadgets Market Forecast Scenarios

global-gaming-gadgets-market-size-forecast-scenario-1790021926709
Peripheral demand grew steadily between 2020 and 2025 as remote work and stay-at-home entertainment consumption both expanded gaming participation broadly, with growth continuing after normalization as streaming culture sustained elevated engagement. Historical growth of 8.0 percent annually reflected sustained mainstream participation rather than a single breakthrough launch. Manufacturers used this period to expand distribution into general electronics retail beyond specialty gaming channels.
The base case assumes continued streaming platform growth, expanding VR headset adoption as prices decline, and rising content creator gear spending that together sustain steady growth as manufacturers balance component cost pressure against premium feature differentiation. Manufacturers increasingly treat content creation capability as a core requirement rather than a niche feature. This reflects the growing overlap between competitive gaming and semi-professional streaming as distinct but connected buyer motivations across most major markets and demographic segments worldwide.
A bull scenario assumes VR adoption accelerates faster than expected as headset prices and form factors improve meaningfully, while a bear scenario assumes streaming platform algorithm changes reduce creator monetization enough to dampen premium gear spending among semi-professional buyers. Manufacturers investing early in VR hardware are best positioned to capture upside while limiting downside exposure from cost volatility.

Content Creation Reshapes Peripheral Design

Content creation capability, not raw performance specifications, increasingly separates category leaders from commodity competitors. Manufacturers building integrated software supporting streaming overlays, lighting synchronization, and multi-device profiles are capturing disproportionate share among buyers who game and stream simultaneously. This shift is prompting manufacturers to hire content and software teams alongside traditional hardware engineers, reflecting a meaningful change in how peripheral companies allocate research and development investment.
MARKET CONCENTRATIONCR5 38%Fragmented competitive field spanning specialists and platform manufacturers
AVERAGE SELLING PRICE$65Blended average across headsets, keyboards, and mice categories
TOP SOURCING COUNTRYChina 45% shareLargest share of global peripheral production volume tracked
WIRELESS PENETRATION58%Share of category revenue from wireless connected devices
CONTENT CREATOR ATTACH RATE24%Share of buyers purchasing dedicated streaming equipment too
AVERAGE REPLACEMENT CYCLE3.5 yearsTypical span between successive peripheral hardware purchase decisions
Wireless connectivity has crossed the majority threshold as latency concerns that once favored wired peripherals have largely resolved through improved signal processing technology, removing a longstanding barrier to premium wireless adoption among competitive buyers. Manufacturers with strong wireless signal processing patents increasingly command premium pricing that wired-only competitors struggle to match among competitive and professional buyers seeking tournament-grade responsiveness.
VR hardware is emerging as a distinct high-growth category within the broader peripheral market, as declining headset prices and expanding content libraries pull mainstream buyers beyond the early enthusiast segment that once defined the category exclusively. Manufacturers with established software platforms and existing distribution relationships are best positioned to capture this expansion, since VR hardware increasingly requires the same retail and marketing infrastructure as traditional peripherals.
"Nobody buys a mouse for the mouse anymore. They buy into a whole setup, and manufacturers who understand that are the ones winning shelf space."
Practice Lead, Interactive Entertainment Hardware · MMA Gaming Headsets Practice · September 2026

Market Trends

Content Creator Gear Becomes Distinct Product Category

Manufacturers increasingly design dedicated product lines targeting semi-professional streamers and content creators, bundling capture cards, ring lights, and premium microphones alongside traditional gaming peripherals into unified setup packages. This shift reflects growing recognition that streaming and competitive gaming, while overlapping, represent distinct buyer motivations with different feature priorities and willingness to pay for specialized equipment. Manufacturers building software that integrates lighting synchronization, overlay graphics, and multi-device profiles into a single control panel are capturing disproportionate share among this expanding buyer segment. Retailers report meaningfully strong sell-through for bundled creator packages compared with individual component purchases made separately.
Market Impact: Expands buyer base 18 percent

VR Hardware Prices Decline Toward Mainstream Adoption

VR headset manufacturers have achieved meaningful cost reduction through component standardization and improved manufacturing scale, pulling retail pricing down toward levels that mainstream buyers increasingly find accessible rather than prohibitive. This price decline is expanding the addressable market well beyond the early enthusiast segment that historically defined VR gaming, drawing casual buyers previously deterred by premium pricing and limited content libraries. Expanding game and application libraries further support this transition, giving new buyers meaningful reasons to justify the purchase beyond novelty appeal alone. Manufacturers investing early in accessible pricing are building durable brand loyalty among first-time VR buyers.
Market Impact: Sustains 15 percent price premium

Market Opportunities and Growth Drivers

Streaming Platform Growth Expands Buyer Base

Continued growth in live streaming platform viewership and creator participation is expanding the addressable buyer base for gaming peripherals well beyond traditional competitive players into a broader semi-professional content creation segment. This audience increasingly views premium equipment as a business investment rather than a discretionary hobby purchase, supporting willingness to pay for features that improve production quality and viewer engagement. Platform monetization programs that reward consistent, high-quality content are reinforcing this investment mindset among aspiring creators. Manufacturers targeting this segment specifically are seeing measurably higher average order values than those selling purely to casual gamers.
Market Impact: Raises component costs by 20 percent

Esports Viewership Sustains Competitive Gear Demand

Sustained esports viewership and prize pool growth continue reinforcing demand for competitive-grade peripherals among aspiring and amateur players seeking to replicate professional setups they watch during tournament broadcasts and streaming content. Sponsorship deals between peripheral manufacturers and professional esports organizations further reinforce brand visibility among this influential buyer segment, translating tournament exposure directly into retail sales. Manufacturers with strong professional player endorsements report meaningfully higher conversion among aspirational amateur buyers seeking comparable performance. This dynamic sustains premium pricing power that budget competitors struggle to match convincingly. Amateur leagues are also expanding rapidly.
Market Impact: Extends replacement cycles to 3.5 years

Market Restraints and Challenges

Component Cost Volatility Pressures Peripheral Margins

Gaming peripheral manufacturers remain exposed to semiconductor, sensor, and battery component pricing cycles, which represent a substantial share of unit production cost and periodically spike amid global supply chain disruption beyond manufacturer control entirely. The root cause is dependence on a concentrated group of component suppliers capable of producing the precision sensors and wireless chips modern peripherals require, leaving manufacturers with limited negotiating leverage during constrained periods. This exposure disproportionately affects smaller manufacturers lacking long-term supply agreements that larger competitors have secured through years of relationship investment and volume commitments. Manufacturers are increasingly diversifying component sourcing to mitigate future volatility.
Market Impact: Grows creator revenue 24 percent

Market Saturation Limits Casual Buyer Upgrade Frequency

Casual gaming buyers increasingly view current peripheral performance as adequate for their needs, reducing the upgrade frequency that once drove steady replacement demand across the broader consumer base beyond competitive enthusiasts. The root cause is genuine technical maturity in core categories like keyboards and mice, where incremental performance improvements deliver diminishing perceived value to buyers who are not competing professionally. This dynamic disproportionately affects mid-tier manufacturers lacking either premium differentiation or budget price leadership to anchor purchase decisions. Manufacturers are responding with subscription software features and platform lock-in strategies to sustain engagement between hardware upgrade cycles.
Market Impact: Expands VR base 30 percent
3 additional market trends, 4 additional growth drivers, and 2 additional restraints and challenges are covered in the full report. Contact sales@marketmindsadvisory.com to access the complete intelligence.

Segment CAGR and Growth Architecture

Gaming gadgets span six product categories with distinct commercial economics, ranging from mature keyboards and mice to nascent VR devices. VR and streaming gear are expanding fastest as pricing and creator economy growth resolve historical adoption barriers. Headsets remain the largest revenue contributor overall. Keyboards and mice also contribute steadily, while controllers provide replacement demand across generations.
global-gaming-gadgets-market-market-share-analysis-1790021927301

VR and AR Gaming Devices

VR and AR gaming devices is expanding fastest among all segments as component cost reduction and manufacturing scale pull retail pricing down toward levels mainstream buyers increasingly find accessible rather than prohibitive. Expanding game and application libraries further support this transition, giving new buyers meaningful reasons to justify the purchase beyond early novelty appeal alone. Standalone headsets requiring no separate console or computer have removed a significant adoption barrier that once limited the category to dedicated enthusiasts with existing gaming setups. Manufacturers with established software platforms and existing retail distribution relationships are best positioned to capture this rapid expansion. Several major manufacturers have announced dedicated standalone VR product lines specifically targeting this segment's rapidly expanding mainstream buyer base.
CAGR 14.5%

Streaming and Content Creation Gear

Streaming and content creation gear, spanning capture cards, ring lights, and premium microphones, benefits from the growing overlap between competitive gaming and semi-professional content creation as distinct but connected buyer motivations. Platform monetization programs that reward consistent, high-quality content are reinforcing an investment mindset among aspiring creators willing to pay premium prices for equipment that improves production quality. Bundled creator packages combining multiple product categories into unified setups are driving meaningfully higher average order values than individual component purchases. Growth here also benefits from strong word-of-mouth marketing through creator content itself. Average holding periods before equipment upgrade are shortening as creators respond to evolving platform requirements, further accelerating category turnover relative to more traditional peripheral segments.
CAGR 11.5%
Full segment breakdown across 6 segments available in the complete report.

Regional Architecture and Country Demand Map

North America leads global gaming gadget demand through deep esports culture and dense specialty retail infrastructure, while South Asia and Pacific accelerates fastest on rising disposable income and mobile-to-PC gaming crossover. East Asia and Western Europe add substantial further share. Manufacturing capacity continues expanding across these regions.

North America

The United States drives the overwhelming majority of North American demand, supported by dense specialty gaming retail infrastructure and deep esports viewership culture spanning multiple professional league franchises headquartered domestically across major metropolitan markets. Canada contributes a smaller but steadily growing share, particularly within premium peripheral categories favored by competitive gaming communities. Mexico's proximity to American distribution networks increasingly supports efficient regional logistics and after-sales service coverage across the broader continental market. Household penetration of premium wireless peripherals now exceeds most other regions tracked, reflecting deep-rooted competitive gaming culture built over decades. Border-adjacent manufacturing in Mexico increasingly supplies finished peripherals to distribution centers serving the broader continental market efficiently. specifically.
Share: 28% | CAGR: 8.0% (2026 to 2036)

Western Europe

Germany and the United Kingdom lead Western European demand, supported by strong esports viewership and mature specialty retail infrastructure comparable to North American standards across most peripheral categories tracked. France contributes meaningful demand within both competitive gaming and emerging content creation categories specifically. Growth trails the global average as category penetration is already comparatively mature relative to faster-adopting emerging regions still building initial buyer awareness. Scandinavian markets have moved fastest toward integrating streaming culture into mainstream youth media consumption, setting a template other national markets are gradually following. Regulatory attention to electronic waste recycling is also gradually reshaping product design choices across the region's major national retail markets. nationwide. specifically.
Share: 20% | CAGR: 7.5% (2026 to 2036)
Regional intelligence for 5 additional markets available in the complete report: East Asia, South Asia and Pacific, Latin America, Middle East and Africa, Eastern Europe. Contact sales@marketmindsadvisory.com.
global-gaming-gadgets-market-country-cagr-analysis-1790021927810

Capturing Value Beyond Raw Hardware Specs

Manufacturer economics increasingly reward brands who move beyond raw performance specifications into software platforms, content creator partnerships, and VR hardware where integration depth and creator relevance command durable revenue premiums over commodity peripheral sales. The four levers below concentrate gains among early movers. Investing ahead of software, creator economy, and VR demand shifts concentrates disproportionate gains for early movers.

Integrated Software Platform Subscription Tier Development

Manufacturers offering premium software subscriptions bundling lighting synchronization, macro customization, and cloud profile storage capture meaningfully higher lifetime revenue per customer than one-time hardware sales alone could ever generate, with premium tiers commanding pricing roughly 25 percent above free-tier equivalents. This recurring revenue stream proves far more resilient across hardware replacement cycles than one-time purchases, since subscribers often continue paying even between peripheral upgrades. Manufacturers investing in exclusive software features are seeing measurably higher retention among premium subscribers. This dynamic strengthens further as manufacturers expand exclusive software features available only through premium subscription access.
Market Impact: Commands 25 percent premium tier pricing overall each

Content Creator Sponsorship and Endorsement Programs

Manufacturers sponsoring recognized streamers and professional esports players capture measurably higher conversion among aspirational amateur buyers seeking to replicate professional setups, often justifying pricing 20 percent above unsponsored competing products. This marketing approach proves more durable than traditional advertising since creator audiences view sponsored gear as an authentic recommendation rather than pure promotional content. Manufacturers with the strongest creator relationships increasingly command premium shelf placement and retailer negotiating leverage as a direct result. Manufacturers increasingly track sponsorship return on investment through direct sales attribution rather than pure brand awareness metrics alone.
Market Impact: Commands 20 percent premium via endorsement overall each

Bundled Creator Package Cross-Selling Strategy Development

Manufacturers bundling capture cards, microphones, lighting, and traditional peripherals into unified creator packages capture meaningfully higher average order values than individual component sales, with bundled packages commanding roughly 30 percent more revenue per transaction than equivalent items purchased separately. This bundling approach also reduces customer acquisition cost per unit sold, since a single marketing campaign can drive multiple product category purchases simultaneously. Manufacturers building comprehensive creator product lines around a single brand increasingly capture disproportionate wallet share from serious content creators. Retailers increasingly favor manufacturers offering comprehensive bundled solutions over single-category specialists lacking breadth.
Market Impact: Lifts average order value by 30 percent overall each

Standalone VR Hardware Premium Positioning Strategy

Manufacturers entering the standalone VR hardware category can command average selling prices roughly 40 percent above traditional peripheral categories, reflecting the premium positioning justified by genuinely new hardware capability rather than incremental performance improvement. Early movers in this category are building durable brand association with VR gaming itself, a positioning advantage that becomes harder for later entrants to overcome as the category matures and buyer loyalty solidifies. Component cost curves are improving steadily, expanding margin even as retail pricing remains competitive. Manufacturers slow to enter this category risk ceding an entire generation of early VR adopters to competitors permanently.
Market Impact: Commands 40 percent premium over peripherals overall each

Who Controls the Margin Pool

Gaming gadget competition remains moderately fragmented, with the top five manufacturers holding roughly 38 percent of revenue evaluated on a consistent global brand and hardware revenue basis across categories. Logitech and Razer lead through decades of peripheral brand equity and broad retail distribution, while the gap to smaller challengers has widened as software integration and creator partnerships increasingly separate serious competitors from commodity entrants.
Current competitive activity centers on software platform expansion, content creator sponsorship investment, and standalone VR hardware development, evaluated here consistently on brand and hardware revenue across participants. Corsair continues investing in bundled creator packages, while SteelSeries and HyperX compete directly for esports-endorsed premium positioning with successive product refreshes. Mid-tier specialists increasingly compete on niche formulation rather than broad category breadth alone.

Emerging pressure comes from VR-focused hardware makers and mobile gaming accessory brands whose accessible pricing threatens to pull casual buyers away from traditional peripheral categories entirely over time. Software-first challengers building cross-device platforms are also gaining share, positioning them to climb the rankings as buyers increasingly value integration depth over standalone hardware specifications. Established leaders are responding with expanded VR and software investment of their own to defend share.
global-gaming-gadgets-market-company-positioning-matrix-1790021928340

Competitive Moat and Risk Dimensions

LOGITECH

Moat: Broad Portfolio Distribution Scale

Logitech's decades-long investment across multiple peripheral categories gives it retail shelf presence and distribution relationships that smaller specialists cannot easily replicate without comparable scale and category breadth built over generations of hardware development. Few competitors can match this combined scale of distribution reach and category breadth built over decades of hardware development.
LOGITECH

Risk: Premium Enthusiast Brand Perception

Logitech's broad mainstream positioning can limit its credibility among hardcore competitive buyers who increasingly favor specialist brands perceived as more deeply focused on tournament-grade performance rather than mass-market accessibility. Specialist brands capturing this credibility first may build lasting loyalty that proves difficult to reverse. over time
RAZER

Moat: Strong Enthusiast Brand Identity

Razer's distinctive design language and deep community engagement give it brand loyalty among enthusiast and competitive buyers that mainstream generalist competitors struggle to match, sustaining premium pricing power across most product categories consistently. This loyalty translates directly into pricing power that mainstream competitors cannot easily command.
RAZER

Risk: Premium Pricing Limits Reach

Razer's premium positioning limits its appeal among budget-conscious casual buyers increasingly entering the category through streaming culture, potentially ceding volume share to more accessibly priced mainstream competitors over time. Competitors capturing this broader casual segment first may build lasting volume advantage difficult to overcome later.

Players Tracked

Prominent Players

Logitech
Razer
Corsair
SteelSeries
HyperX

Other Key Players

Turtle Beach
HORI
PowerA
8BitDo
Cooler Master
Thrustmaster
Meta
HTC
JBL
EPOS
ASUS ROG
MSI
Fnatic Gear
GameSir
Trust Gaming

Recent Developments

FEBRUARY 2025

Logitech Expands Content Creator Software Suite

Logitech announced an expanded software suite integrating streaming overlay controls and multi-device lighting synchronization, aiming to strengthen its position among content creators ahead of broader rollout across its full peripheral product line later in the year. Analysts view this as a direct response to competitive pressure from creator-focused challengers.
Signal: Signals traditional peripheral manufacturers prioritizing software integration increasingly ahead of broader category-wide expansion further overall too
JUNE 2025

Razer Signs Esports Team Sponsorship Agreement

Razer signed a multi-year sponsorship agreement with a leading professional esports organization to outfit its full roster with branded peripherals, extending its visibility among aspirational amateur buyers ahead of the upcoming competitive season across multiple regions. Early results showed strong retailer interest in bundled sponsorship merchandising nationwide.
Signal: Reflects manufacturers deepening esports investment to reach amateur buyers as amateur competitive participation keeps growing overall
OCTOBER 2025

Corsair Acquires Streaming Hardware Startup

Corsair completed an acquisition of a small streaming hardware startup specializing in capture cards, integrating its technology directly into Corsair's creator product line to strengthen its position ahead of expanding into additional content categories next year. The deal follows a broader pattern of streaming hardware consolidation among peripheral manufacturers.
Signal: Confirms streaming hardware becoming a key acquisition target industrywide as manufacturers race toward creator parity overall

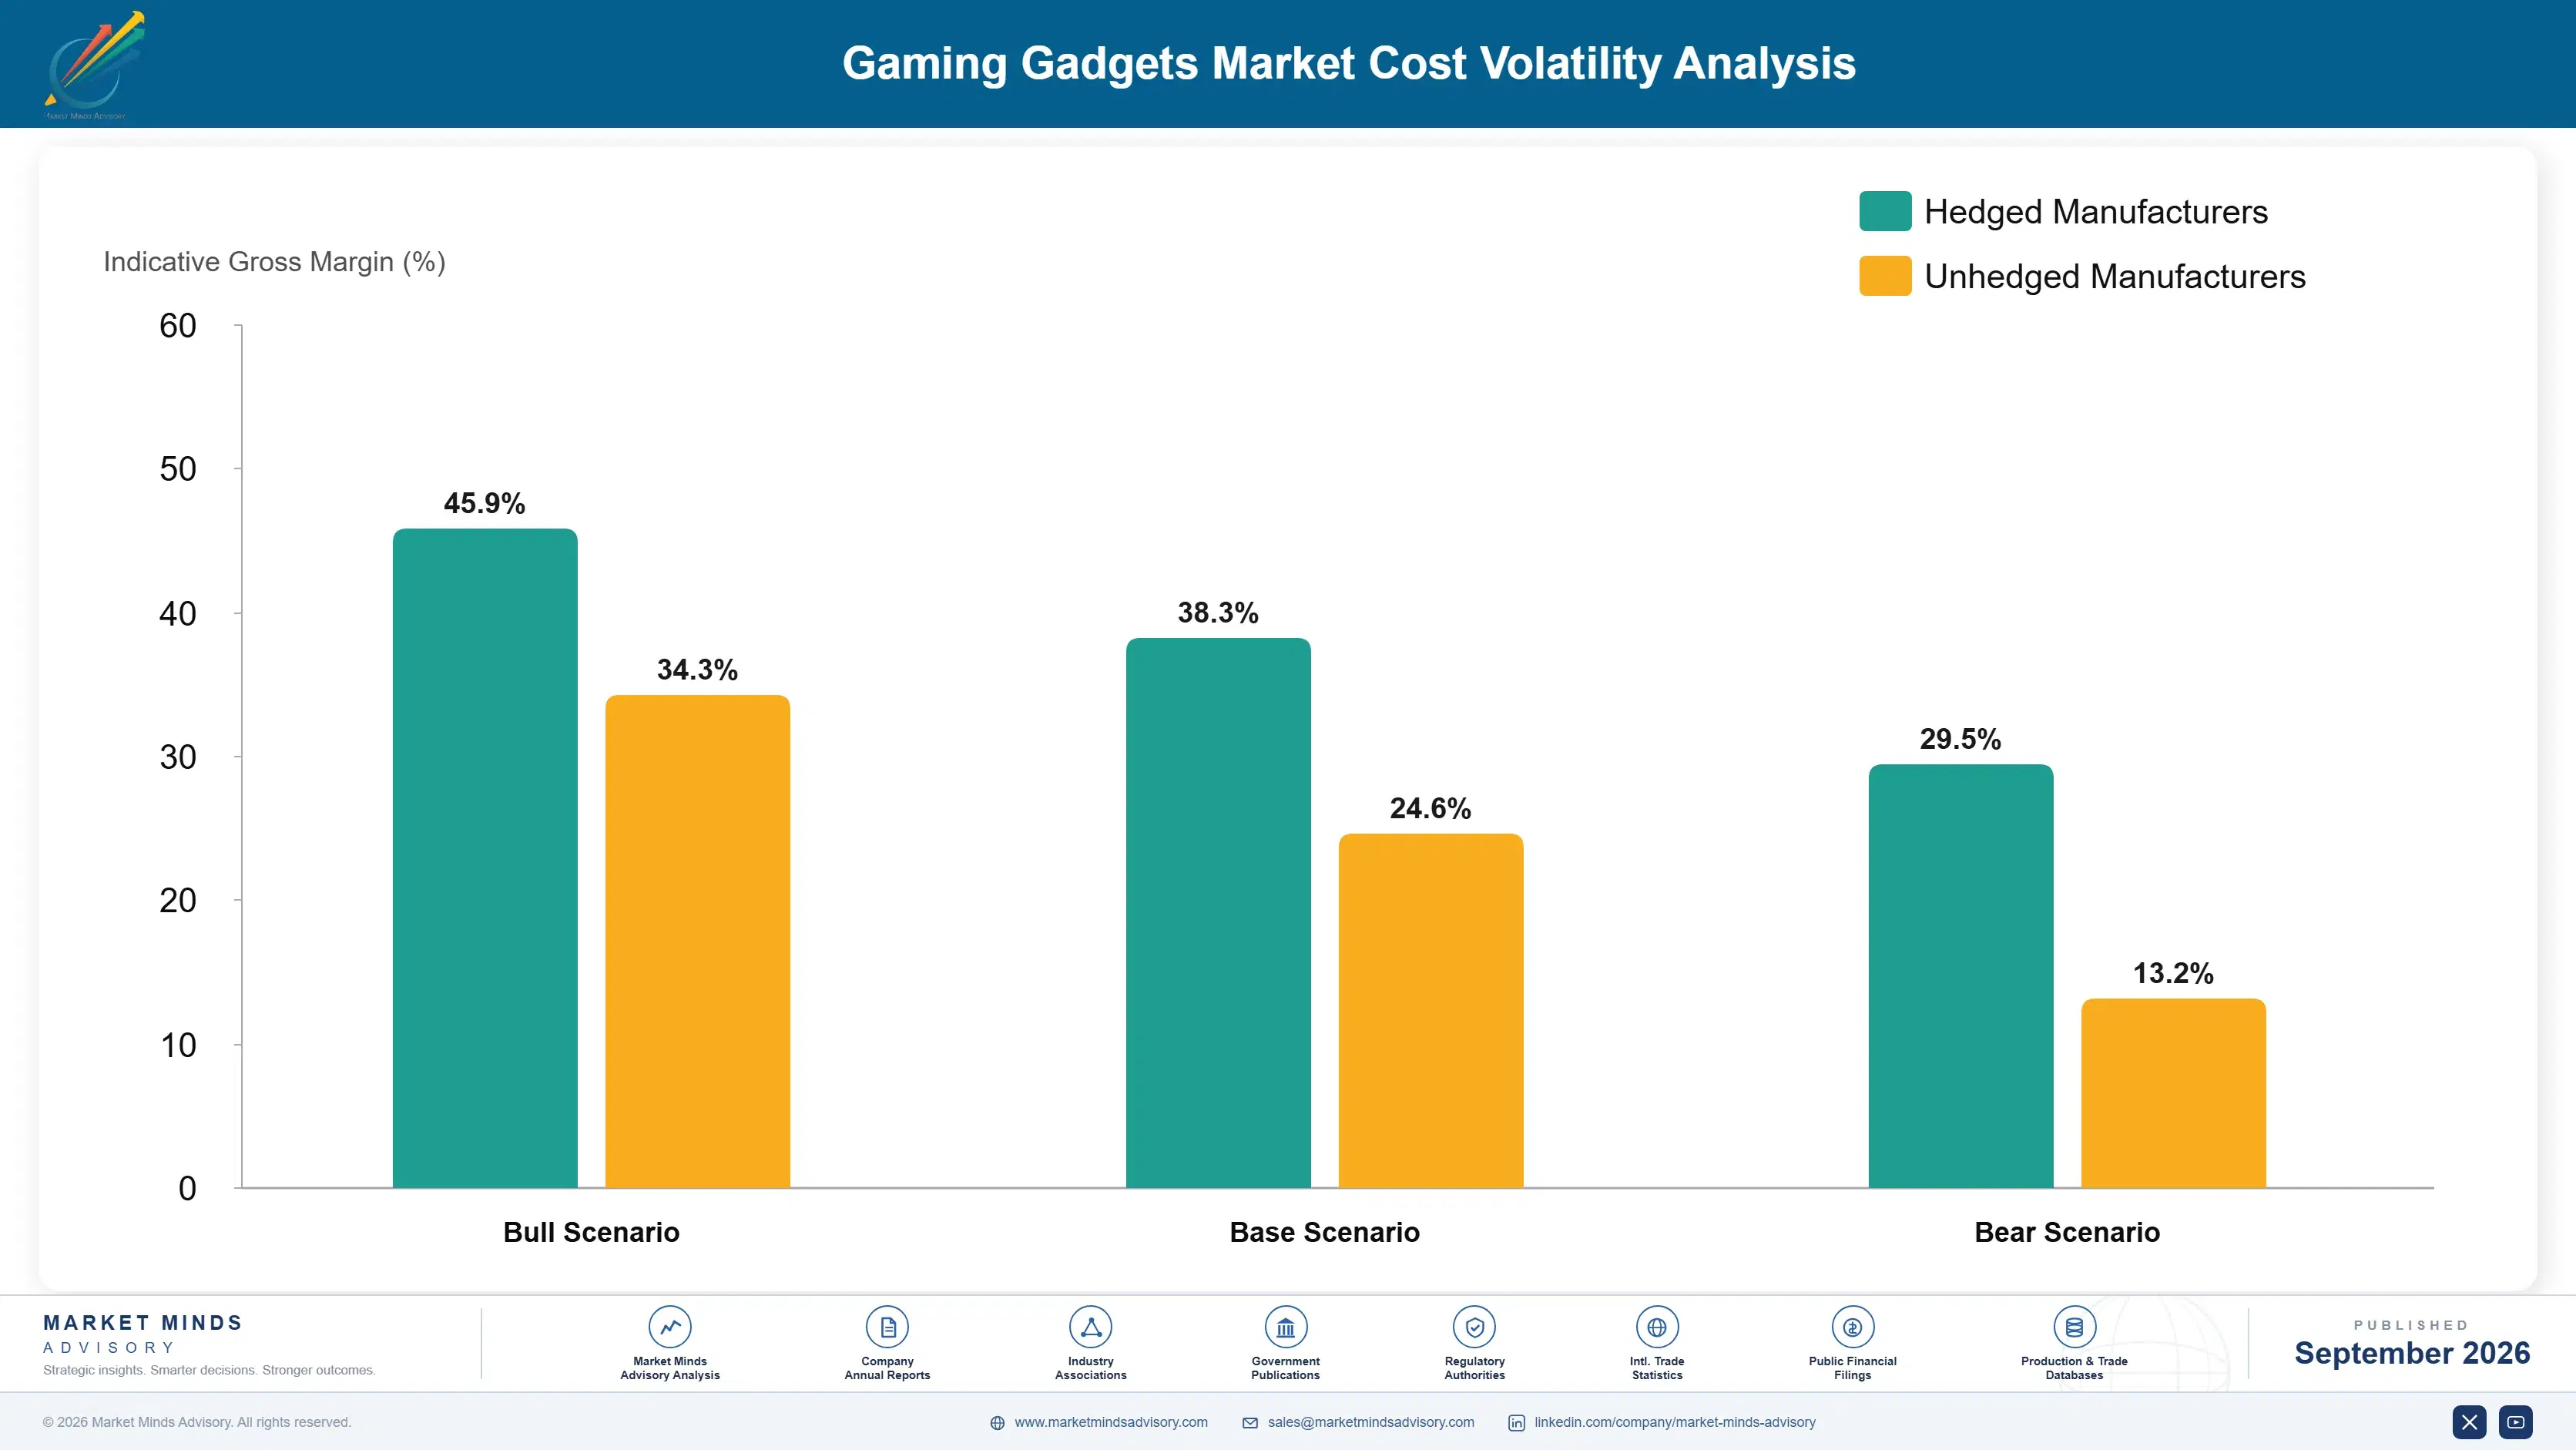
Sensor and Wireless Chip Cost Exposure

Precision sensors and wireless communication chips together account for roughly 45 percent of finished peripheral cost of goods sold, sourced predominantly from a concentrated group of specialty semiconductor suppliers based in East Asian production hubs. Battery and casing components add a further meaningful share, while assembly labor and packaging fill out the remainder of typical manufacturing cost structures.
Semiconductor prices spiked sharply during the 2021 to 2022 global chip shortage, a disruption NIST and industry supply chain data documented across multiple downstream electronics manufacturing sectors dependent on advanced processor and sensor components. Peripheral manufacturers absorbed extended production delays and compressed launch-window margin before capacity expansion and diversified sourcing restored more typical component availability. Pricing has since stabilized, but manufacturers report continued vigilance around allocation risk heading into future high-demand product launch windows.

Smaller manufacturers lacking long-term component allocation agreements face materially higher spot-market exposure than scaled manufacturers with dedicated capacity reservations negotiated years in advance. This gap widens further for manufacturers concentrated in single-supplier relationships, since they cannot shift sourcing toward better terms. Scaled manufacturers with multi-year agreements largely avoided this exposure. during the worst of the shortage period.
global-gaming-gadgets-market-cost-volatility-analysis-1790021928542

Multi-Supplier Component Sourcing Agreements

Manufacturers increasingly diversify sensor and wireless chip sourcing across multiple regional suppliers to reduce exposure to any single supplier's pricing power or availability constraints. This approach has already delivered measurably improved supply reliability for several scaled manufacturers. Several manufacturers report measurable supply reliability improvement from adopting this approach over the past two years. further.

Custom Sensor Co-Design Partnerships

Partnering directly with chip designers on custom peripheral-specific sensors reduces dependence on off-the-shelf components while optimizing performance per dollar of silicon cost. Adoption remains concentrated among the largest manufacturers given substantial upfront engineering investment requirements. Several manufacturers report measurable supply reliability improvement from adopting this approach over the past two years. further across manufacturers.

Component Inventory Buffering Strategies

Manufacturers are building larger safety stock inventories of critical components to smooth production continuity through future supply disruptions, accepting higher carrying costs in exchange for reduced launch delay risk. This approach improves predictability across variable global supply conditions. Several manufacturers report measurable supply reliability improvement from adopting this approach over the past two years.

Portfolio Architecture for Margin Defence

Gaming gadget portfolios split across three distinct margin tiers, with volume-oriented basic keyboards and mice competing primarily on price and retail distribution reach rather than software differentiation. Premium esports-endorsed and creator-oriented peripherals occupy the middle tier, commanding meaningfully higher margins through brand association and integrated software features that justify pricing above commodity equivalents. Volume-tier profit contribution keeps shrinking as buyers migrate toward software-integrated alternatives.
Standalone VR hardware and premium software subscription revenue sit at the top of the margin hierarchy, reflecting genuine hardware innovation and near-zero marginal cost once platform infrastructure is built. This tension between volume reach and premium differentiation defines portfolio strategy across nearly every major manufacturer competing in the category today. Manufacturers unable to build compelling software platforms risk remaining trapped in a commodity hardware model that generates thin, easily replicated margin.

High-value margin pools concentrate disproportionately in VR hardware and subscription software revenue, where innovation barriers and recurring revenue limit direct price competition. Manufacturers increasingly allocate investment toward these tiers, recognizing that volume-tier growth alone cannot offset compressing margins on commodity peripherals over the coming decade. Regional manufacturers concentrated solely in commodity hardware sales face the steepest margin compression as software-focused competition intensifies further.

Volume / Commodity-Adjacent

Basic keyboards, mice, and headsets competing primarily on price and retail distribution reach against comparable commodity products. Manufacturers compete primarily on manufacturing efficiency and shelf placement rather than software differentiation, leaving margins persistently thin across the segment.
Gross Margin: 18-25%

Premium / Certified

Esports-endorsed and creator-oriented peripherals commanding higher margins through brand association and integrated software feature differentiation. Buyers accept premium pricing for brand association and integrated features that commodity products, lacking comparable software depth, cannot credibly replicate.
Gross Margin: 30-38%

Sustainability / Regulatory / Next-Generation

Standalone VR hardware and subscription software revenue capturing top-tier margin as innovation barriers limit near-term competition. Manufacturers investing early in hardware innovation and subscription revenue capture disproportionate margin as slower competitors remain dependent on hardware sales alone.
Gross Margin: 45-55%
global-gaming-gadgets-market-portfolio-architecture-1790021929050

High-value Sub-segments and Strategic Watch-out

VR and AR Gaming Devices

The fastest-growing, highest-value segment, combining hardware innovation with strong software subscription attach as pricing declines broaden addressable reach among mainstream buyers. Manufacturers with established software platforms are best positioned to capture this durable shift toward immersive gaming access. Adoption continues broadening steadily as content libraries and hardware capability improve.
Gross Margin: 40-50%

Streaming and Content Creation Gear

A high-value segment growing quickly as creator economy expansion drives bundled package purchases commanding meaningfully higher average order values than standalone items. Manufacturers building comprehensive creator product lines are capturing disproportionate wallet share from serious content creators over time. Impulse purchase behavior and creator word-of-mouth continue reinforcing this pattern industrywide.
Gross Margin: 32-40%

Gaming Headsets and Audio

The volume core of the category, defended through brand recognition and esports endorsement rather than pricing power against private-label competitors. Manufacturers defend this segment through continuous sponsorship investment rather than aggressive hardware price discounting against rivals. This defense strategy has proven durable across multiple competitive cycles to date.
Gross Margin: 20-26%

Gaming Keyboards and Mice

A strategic watch-out segment where technical maturity and diminishing perceived value compress margin as competition from budget manufacturers intensifies steadily. Manufacturers increasingly bundle this segment with higher-margin software subscriptions to offset thin standalone hardware economics. Bundling helps offset thin standalone economics as competition intensifies steadily.
Gross Margin: 16-22%

Setup Investment and Upgrade Economics

Gaming gadget demand increasingly functions on setup investment economics rather than isolated purchase decisions, since buyers building a cohesive gaming or streaming setup tend to expand purchases across multiple product categories from a single trusted brand over time. This pattern gives manufacturers meaningfully predictable cross-category revenue visibility, provided initial trust holds through the first purchase. Retailers value this cross-category predictability highly when planning shelf allocation around bundled setup promotions.
Adoption depth varies considerably by end-use vertical. Competitive and esports-oriented players show the deepest engagement, frequently upgrading peripherals ahead of major tournaments to match evolving performance standards, while casual buyers exhibit far less frequent replacement driven mainly by hardware failure rather than performance dissatisfaction. Content creators show intermediate stickiness, anchored primarily to platforms supporting their specific production workflow. Manufacturers increasingly tailor retention strategy differently across these verticals rather than applying a single loyalty program uniformly across all buyer types.

Generational shifts are reshaping the buyer profile meaningfully. Younger buyers increasingly prioritize software integration and content creation capability over raw competitive performance specifications, a behavior less common among older players who grew up prioritizing pure hardware responsiveness. This shift compresses the loyalty advantage legacy brands built over decades.
global-gaming-gadgets-market-end-use-penetration-index-1790021929542

Where Peripheral Manufacturers Should Focus

These are among the four positions where our research anticipates prominent divergence between winners and laggards over the coming forecast period. Each is grounded in the demand model, the regulatory perimeter, and the announced capacity pipeline.
01 / SOFTWARE PLATFORM INVESTMENT

Build integrated software as a core product pillar

Software integration increasingly determines category leadership more than raw hardware specifications, and manufacturers that delay building compelling platforms risk losing buyers to competitors already offering smooth cross-device customization. Investors and retailers increasingly evaluate manufacturers on software depth alongside hardware performance metrics. Manufacturers slow to build these capabilities risk falling behind competitors already monetizing installed base far more effectively across every buyer segment, and industry benchmarking suggests this gap will widen further over the next several forecast years as software adoption continues climbing among buyers.
02 / CONTENT CREATOR SEGMENT DEVELOPMENT

Develop dedicated creator product lines before rivals scale

Content creators represent a distinct, high-value buyer segment willing to pay premium prices for equipment that improves production quality, and manufacturers absent from this category risk ceding an entire generation of aspiring streamers to more responsive competitors. Bundled creator packages are already proving more profitable than individual component sales across the industry. Early movers are building brand association that will grow harder to dislodge as the segment matures further, giving early movers a durable positioning advantage that becomes increasingly difficult for late entrants to overcome as creator loyalty solidifies.
03 / VR HARDWARE CATEGORY ENTRY

Enter standalone VR hardware ahead of mainstream adoption

VR hardware pricing continues declining toward mainstream accessibility, and manufacturers who enter this category early position themselves to capture demand as the addressable buyer base expands well beyond early enthusiasts. This capability also extends brand relevance into an entirely new hardware category rather than incremental peripheral improvement. Manufacturers delaying this investment risk ceding an entirely new customer segment to dedicated VR specialists permanently, a durable commercial advantage that compounds further with every additional forecast year as VR content libraries continue expanding globally.
04 / ESPORTS SPONSORSHIP STRATEGY

Deepen esports partnerships to reach aspirational buyers

Esports sponsorship translates tournament exposure directly into retail sales among aspirational amateur buyers seeking to replicate professional setups they watch during competitive broadcasts and streaming content. Manufacturers with the strongest professional player endorsements report meaningfully higher conversion than competitors relying purely on traditional advertising channels. This advantage compounds further as esports viewership and amateur league participation continue expanding across most major regional markets, reinforcing a durable commercial edge that strengthens further with each additional sponsorship season that passes across the category.

Engagement Snapshot From the Field

A live engagement with an industry participant carrying material or product regulatory and market exposure ahead of a defining policy shift, showing how our research translates into a defensible multi-year portfolio strategy.
MARKET MINDS ADVISORY · CLIENT ENGAGEMENT SUMMARY
Gaming Gadgets Producer Strategic Portfolio Review and Transition Roadmap 2026·Investment Scenario on Gaming Gadgets Exposure Evaluation 2025-26
CLIENT PROFILE
A mid-sized regional electronics retail chain operating dozens of stores sought guidance on rebalancing its gaming peripheral floor space as content creator gear and VR hardware reshaped customer purchase patterns. Leadership wanted a clear framework for allocating limited shelf space across traditional peripherals, creator equipment, and emerging VR categories. The chief merchandising officer sponsored the engagement directly.
STRATEGIC CHALLENGE
The retailer lacked internal data on how content creator and VR demand was shifting relative to traditional gaming peripherals within its specific regional footprint. Leadership also needed guidance on structuring bundled promotions without eroding margin on core hardware categories the business still depended on. Store staff also needed clear guidance on positioning new categories to existing loyal customers.
MMA APPROACH
MMA conducted a structured analysis of regional sales data against MMA's proprietary primary research dataset covering gaming gadget category trends, benchmarking the retailer's creator and VR attach rates against comparable regional chains. The engagement included a phased floor space reallocation recommendation and bundling framework designed to protect core margin while accelerating creator category growth.
KEY FINDINGS
  1. Content creator gear sales at the retailer's stores were growing meaningfully faster than traditional peripheral sales, though from a smaller overall base than national trends suggested.
  2. Bundled creator package promotions increased average transaction value by 26 percent when paired with existing peripheral purchases (client-reported, unverified by MMA). across the pilot stores.
  3. Stores with dedicated VR demonstration units saw meaningfully higher conversion rates than stores displaying VR hardware in standard shelf configurations only. during peak shopping periods.
  4. Cross-selling between headsets and streaming gear proved strongest among first-time creator category buyers, suggesting an underexploited entry-point opportunity. across most store locations.
CLIENT PROFILE
A mid-sized regional electronics retail chain operating dozens of stores sought guidance on rebalancing its gaming peripheral floor space as content creator gear and VR hardware reshaped customer purchase patterns. Leadership wanted a clear framework for allocating limited shelf space across traditional peripherals, creator equipment, and emerging VR categories. The chief merchandising officer sponsored the engagement directly.
STRATEGIC CHALLENGE
The retailer lacked internal data on how content creator and VR demand was shifting relative to traditional gaming peripherals within its specific regional footprint. Leadership also needed guidance on structuring bundled promotions without eroding margin on core hardware categories the business still depended on. Store staff also needed clear guidance on positioning new categories to existing loyal customers.
MMA APPROACH
MMA conducted a structured analysis of regional sales data against MMA's proprietary primary research dataset covering gaming gadget category trends, benchmarking the retailer's creator and VR attach rates against comparable regional chains. The engagement included a phased floor space reallocation recommendation and bundling framework designed to protect core margin while accelerating creator category growth.
KEY FINDINGS
  1. Content creator gear sales at the retailer's stores were growing meaningfully faster than traditional peripheral sales, though from a smaller overall base than national trends suggested.
  2. Bundled creator package promotions increased average transaction value by 26 percent when paired with existing peripheral purchases (client-reported, unverified by MMA). across the pilot stores.
  3. Stores with dedicated VR demonstration units saw meaningfully higher conversion rates than stores displaying VR hardware in standard shelf configurations only. during peak shopping periods.
  4. Cross-selling between headsets and streaming gear proved strongest among first-time creator category buyers, suggesting an underexploited entry-point opportunity. across most store locations.
RECOMMENDED STRATEGY
Phase 1: Phase one: reallocate floor space toward dedicated creator and VR demonstration zones across the ten highest-volume store locations within ninety days. Phase 2: Phase two: roll out standardized bundled promotions across the full store network, incorporating pilot learnings on messaging and pricing. gathered during the pilot. Phase 3: Phase three: expand staff training on creator equipment specifically targeting first-time category buyers within six months of rollout. completing the rollout.
OUTCOME
The retailer implemented the phased recommendations across its pilot store group, reporting a 20 percent increase in creator category revenue during the first two quarters following rollout (client-reported, unverified by MMA). Leadership approved full network expansion ahead of schedule. Store staff reported stronger customer engagement across newly expanded categories.

Frequently Asked Questions

Foundational context covering the market sizes, CAGR, scope, country, region and competition that inform every finding below. This section is provided to cover basics and most often pre-purchase conversations, answered from the MMA Primary Research Dataset.

What is the current size of the Gaming Gadgets Market?

The Gaming Gadgets Market was valued at 12.5 billion dollars in 2025. This figure covers headsets, keyboards, mice, controllers, VR devices, and streaming peripherals sold globally.

How large will the Gaming Gadgets Market be by 2036?

The market is projected to reach 32.26 billion dollars by 2036. This reflects sustained streaming culture growth and expanding VR hardware adoption across most major regions.

What is the CAGR for the Gaming Gadgets Market 2026 to 2036?

The market is projected to grow at a compound annual rate of 9.0 percent between 2026 and 2036. Bull and bear scenarios range from 7.7 to 10.3 percent depending on component cost and adoption outcomes.

Which segment is growing fastest?

VR and AR Gaming Devices is the fastest-growing segment, expanding at a 14.5 percent CAGR. This is 1.61 times the overall market rate, driven by declining headset pricing.

Who are the major companies in the Gaming Gadgets Market?

Logitech, Razer, Corsair, SteelSeries, and HyperX lead the market, together holding roughly 38 percent of global category revenue across brands. Specialized VR and creator brands continue expanding their reach.

Which country is growing fastest?

India is the fastest-growing major market, expanding at roughly an 11.5 percent CAGR. Rising disposable income and mobile-to-PC gaming crossover are driving first-time purchases across urban centers.

Report Segmentation Architecture

The full report scope spans multiple orthogonal segmentation dimensions, with cross-tabulated demand data provided for each dimension pair. Coverage extends further to regional breakdowns, trend trajectories, and the competitive detail needed to support segment-level decision-making.

By Primary Market Dimension

  • Gaming Headsets and Audio
  • Gaming Keyboards and Mice
  • Gaming Controllers and Peripherals
  • VR and AR Gaming Devices
  • Streaming and Content Creation Gear
  • Smart Gaming Accessories

By End-Use Industry

  • Residential and Household Gaming
  • Esports and Competitive Gaming
  • Content Creation and Streaming
  • Internet Cafes and Gaming Lounges

By Commercial Dimension

  • Retail and E-Commerce Distribution
  • Direct Manufacturer Sales
  • Subscription and Digital Services
  • Sponsorship and Endorsement Channels

By Region

  • North America
  • Western Europe
  • East Asia
  • South Asia and Pacific
  • Latin America
  • Middle East and Africa
  • Eastern Europe

Scope, Methodology, and Coverage

Every figure in this report is reproducible from documented input assumptions. The scope below maps the historical period, the forecast horizon, the segmentation dimensions, and the countries covered, alongside the underlying primary and qualitative methodology.
Historical Period
2020 to 2025
Forecast Period
2026 to 2036
Base Year
2025 (USD billions; MMA Primary Research Dataset, September 2026)
Market Definition
The Gaming Gadgets Market covers headsets, keyboards, mice, controllers, VR and AR devices, and streaming peripherals sold for gaming and content creation use. It excludes bundled console hardware, general-purpose computing accessories, and standalone game software.
Quantitative Units
USD billions, market share percentage, CAGR percentage
Segmentation Dimensions
Product type, end-use industry, commercial and distribution dimension
Regions Covered
North America, Western Europe, East Asia, South Asia and Pacific, Latin America, Middle East and Africa, Eastern Europe
Countries Covered
United States, Canada, Mexico, Germany, United Kingdom, France, China, Japan, South Korea, India, Australia, Indonesia, Vietnam, Brazil, Argentina, Colombia, United Arab Emirates, Saudi Arabia, South Africa, Poland, Czech Republic, Russia
Key Companies Profiled
Logitech, Razer, Corsair, SteelSeries, HyperX, Turtle Beach, HORI, PowerA, 8BitDo, Cooler Master, Thrustmaster, Meta, HTC, JBL, EPOS, ASUS ROG, MSI, Fnatic Gear, GameSir, Trust Gaming
Quantitative Methodology
Primary survey, n=3,800 respondents, Q4 2025, six countries; demand-side model with trade association cross-validation
Qualitative Methodology
47 expert interviews, Q4 2025; applied to validate demand model assumptions, identify emerging dynamics, and assess competitive positioning
Report Format
PDF and XLSX data workbook (Word format preview document)
Publisher
Market Minds Advisory
Report Code
MMA-2026-TEC-857
Published
September 2026
Contact
sales@marketmindsadvisory.com | www.marketmindsadvisory.com

Purchase the full Gaming Gadgets Market Report (2026 to 2036).

This report delivers a complete analysis of the global Gaming Gadgets Market, covering historical performance from 2020 through 2025 and forecasts through 2036 across every major hardware category and region. It combines primary survey data from 3,800 respondents with 47 expert interviews to quantify segment growth, regional demand shifts, and competitive dynamics. Analysts detail component cost exposure, portfolio margin architecture, and content creation trends reshaping manufacturer strategy. The report is designed for strategy, product planning, and investment teams evaluating this category. Findings support pricing, sourcing, and portfolio decisions.
Ten-year historical and forecast data series
Seven-region demand and growth breakdown Detail
Competitive benchmarking of twenty companies Overview
Segment-level CAGR and market share detail
Component cost and margin sensitivity analysis
Creator economy and platform trend tracking

Built For The People Who Decide

From boardroom strategy to bench-side execution, this report is read cover-to-cover by leaders shaping the next decade of their industry, turning demand scenarios, market dynamics and valuation benchmarks into decisions.
CXOs/ Presidents/ VPs/ Managers
M&A and Corporate Development
Strategy Teams and R&D Heads
Procurement and Product Directors
Regulatory and Compliance Leaders
Investor Relations and Equity Analysts