Market Minds Advisory
Fuel Cell Market

Fuel Cell Market: Fuel Cell Market. Stationary Power Demand Redraws Category Growth Drivers.

Data center operators and residential utility programmes are expanding solid oxide and PEM fuel cell deployment as distributed power reliability demands intensify and grid interconnection delays push customers toward on-site generation alternatives.

Lead Analyst

Published

September 2026

Make Smarter Decisions with Customized Research Insights

Request a free sample report and evaluate market opportunities, growth trends, and competitive dynamics relevant to your business needs.

2025 MARKET VALUE$9.8BMarket Size 2025
2036 FORECAST VALUE$45.6BBase Case , 2026 to 2036
CAGR 2026 TO 203615.0 %Bull 16.3% / Bear 13.7%
INCREMENTAL OPPORTUNITY$34.3BNet 10- year value creation
EXPANSION MULTIPLE4.05x2036 value over 2026 base
Strategic Levers
M&A Pipeline
Regional Outlook
Country Rankings
Competitive Intelligence
Segmental Deep-dive
Call-Us : 91 93563 13602

Executive Snapshot and Market Trajectory.

Data center operators and residential utility programmes are scaling solid oxide and PEM fuel cell deployment beyond niche demonstration projects, as distributed power reliability demands and grid interconnection delays finally push customers toward genuine on-site generation adoption across most major markets, reshaping procurement priorities across most facility operators today.
Stationary power applications, particularly data center backup and distributed generation formats, concentrate the fastest-growing commercial demand, with the United States anchoring the single largest growth pace given its expanding hyperscale data center construction and grid interconnection bottlenecks across most major metropolitan power markets. Transportation applications provide a steadier, more mature revenue base sustaining category economics broadly across established markets and vehicle fleet segments nationwide. Government stationary power incentive programmes further reinforce this demand concentration.
Competitive intensity remains moderately concentrated, with five established fuel cell manufacturers holding roughly half of category revenue between them, leaving considerable fragmentation among specialist regional producers across Asia, Europe, and North America. Tightening grid reliability requirements and expanding distributed generation investment are reshaping product roadmaps industry-wide, pushing manufacturers toward differentiated stationary power and efficiency engineering to defend share against rivals across multiple technology categories alike.
Market Definition
This report covers fuel cell systems across PEM, solid oxide, molten carbonate, phosphoric acid, alkaline, and direct methanol technologies used in stationary power generation, transportation, and portable power applications. It excludes hydrogen production, storage infrastructure, and battery-electric propulsion systems.
Base Year Value
$9.8B in 2025 (MMA Primary Research Dataset, September 2026)
Forecast Period
2026 to 2036, eleven discrete annual values
CAGR
15.0% base case. Bull 16.3%. Bear 13.7%.
Fastest Growth Segment
Solid Oxide Fuel Cells: 19.5% CAGR
Fastest Growth Country
United States: 17.0% CAGR
Fastest Growth Region
South Asia and Pacific: 17.0% CAGR
Largest Region
East Asia: 33% of 2025 global value
Market Leaders
Bloom Energy, Ballard Power Systems, Plug Power, FuelCell Energy, Toyota Motor Corporation. Source: MMA Primary Research Dataset, July 2026.
Primary Survey
n=3,800 procurement and R&D decision-makers, Q4 2025, six countries
Methodology
Demand-side build-up, cross-validated against public data, 47 expert interviews

Fuel Cell Market Forecast Scenarios

global-fuel-cell-market-size-forecast-scenario-1788233989837
Fuel cell revenue grew at an estimated 13.8 percent historical pace between 2020 and 2025, as stationary power demonstration programmes matured into early commercial deployment across data center and residential utility applications in several leading markets worldwide today. Growth accelerated further once hyperscale operators began scaling backup power procurement nationwide across multiple metropolitan power regions.
The base case assumes 15.0 percent annual growth through 2036, driven by three commercial mechanisms. First, solid oxide stationary power is becoming a standard backup and distributed generation option rather than a demonstration-only niche among data center operators pursuing grid reliability. Second, PEM transportation applications are steadily scaling as heavy-duty fleet operators pursue zero-emission compliance targets. Third, expanding grid interconnection delays across multiple regions are adding a durable baseline of on-site generation demand that persists across multiple construction cycles.
The bull case centers on faster-than-expected data center construction pulling forward stationary fuel cell procurement across multiple regional markets simultaneously. The bear case centers on prolonged hydrogen and natural gas fuel cost pressure limiting fleet-scale economic viability, which could meaningfully slow revenue growth across the newest stationary product launches specifically among smaller specialist manufacturers lacking diversified customer bases.

Stationary Power Redraws Category Value

The fuel cell industry sits at a point where stationary power ambition and grid reliability demand are colliding with a genuine distributed generation deployment transition. Solid oxide and PEM systems displacing legacy backup generator formats is the single largest determinant of how manufacturer development budgets are being reallocated across nearly every major product line today, reshaping facility procurement relationships and forcing incumbents to accelerate stationary power roadmaps.
MARKET CONCENTRATION (CR5)46%Top five manufacturers hold roughly half combined overall today
AVERAGE STACK SERVICE LIFE10 yearsTypical operating life before major stack overhaul required
STATIONARY POWER REVENUE SHARE48%Total category revenue derived from stationary power applications
SOLID OXIDE REVENUE SHARE22%Total category revenue derived from solid oxide fuel cell formats
TOP PRODUCING COUNTRY SHARE26%Japan share of global fuel cell stack manufacturing output
PLATINUM CATALYST COST SHARE24%Platinum group metal catalyst portion of total stack expense
Beneath the stationary power story, the industry is absorbing genuine efficiency improvement demand. Facility operators increasingly demand higher electrical efficiency credentials that pair reduced fuel consumption with proven reliability, letting product teams plan development around predictable multi-year total cost of ownership rather than reactive single-purpose redesigns. Manufacturers slower to offer comparable efficiency depth risk losing facility renewals to rivals already demonstrating proven stack longevity across data center and residential applications, a gap that widens with each cycle.
Distribution economics are shifting too. Direct manufacturer-to-facility partnerships are steadily capturing procurement volume that traditional distributor-only channels once claimed by default, particularly on premium data center segments nearing the end of exclusive supply agreements. Manufacturers offering more competitive direct structures are converting this competitive pressure into genuine contract wins across multiple facility relationships.
"Every manufacturer now claims grid-independent reliability, but the ones actually winning repeat data center contracts are the ones who can prove the system holds up through a full peak-demand cycle in real operating conditions, not just a factory demonstration."
Director, Distributed Energy Practice · MMA Energy Practice · September 2026

Market Trends

Solid Oxide Systems Gain Data Center Backup Priority

Manufacturers are increasingly developing solid oxide fuel cell systems rather than exclusively relying on legacy diesel backup generator formats, reflecting genuine data center operator demand for grid-independent reliability across hyperscale facilities facing extended utility interconnection delays. Bloom Energy and FuelCell Energy have both expanded dedicated solid oxide product lines specifically to meet rising hyperscale demand, recognizing that facility operators increasingly specify on-site generation capability as a standard procurement consideration rather than an optional feature. This shift is reshaping how facility operators allocate capital budgets across competing power platforms and vendor relationships.
Market Impact: Adds 5 points category growth annually
PEM Transportation Deployment Expands Beyond Demonstration Fleets

Manufacturers are increasingly developing heavy-duty PEM transportation systems rather than exclusively relying on light-duty demonstration platforms, since fleet operator demand for zero-emission compliance meaningfully improves commercial deployment viability relative to isolated pilot programmes facing rising scrutiny. Ballard Power Systems has used its transportation engineering expertise to expand product listings meaningfully, while brands without comparable durability capability risk losing contracts to better-positioned rivals. Fleet operators increasingly build stack durability requirements directly into new procurement specifications and route planning decisions each budget year. Adoption is expanding fastest among logistics operators managing dedicated long-haul freight corridors nationwide.
Market Impact: Adds 4 points interconnection-driven demand growth

Market Opportunities and Growth Drivers

Rising Data Center Construction Investment Drives Category Growth

Growing hyperscale data center construction investment continues driving steady category growth, directly increasing available revenue for both premium fuel cell manufacturer expansion and direct facility-operator capital investment across major markets. This investment growth is particularly pronounced among emerging data center construction regions rapidly normalizing fuel cell procurement as standard backup power infrastructure, creating durable new demand that extends well beyond typical replacement-cycle patterns these facility operators historically followed. Brands with strong existing engineering relationships in this fast-expanding market are capturing this durable demand more efficiently than competitors entering later in the investment cycle.
Market Impact: Cuts operating margins by 4 points

Grid Interconnection Delays Accelerate On-Site Generation Adoption

Facility operators are increasingly seeking verified on-site generation capability rather than legacy grid-dependent power planning, directly increasing manufacturer demand for stationary power investment across expanding data center and industrial categories worldwide. This preference represents genuine incremental demand beyond typical replacement-cycle procurement patterns, since operators are actively specifying distributed generation features in new procurement decisions rather than simply tolerating legacy grid-dependent approaches at prior tolerance levels. Brands with strong reliability development capability are capturing this durable preference more efficiently than competitors relying purely on legacy grid-only offerings. Facility operators increasingly favor these suppliers during annual capital planning cycles.
Market Impact: Delays fleet conversion by 7 months

Market Restraints and Challenges

Rising Platinum Catalyst Cost Limits Margin Expansion

Many smaller manufacturers continue struggling to absorb rising platinum group metal catalyst costs fast enough to preserve margin at competitive procurement price points, creating cost bottlenecks that extend product repricing timelines beyond original targets set at the start of each fiscal year. The root cause is genuine supply chain complexity in sourcing consistent quality platinum across a concentrated global supplier base facing simultaneous demand from multiple industrial categories competing for the same limited material pool. The commercial impact pressures manufacturers to renegotiate pricing more frequently than facility operators prefer. Manufacturers are mitigating this through expanded catalyst-loading reduction research sourcing.
Market Impact: Grows solid oxide share 22 points

Sparse Hydrogen Refueling Infrastructure Complicates Transportation Adoption

Fleet operators continue struggling to reconcile sparse hydrogen refueling station coverage fast enough to support genuine long-haul route expansion, creating genuine deployment bottlenecks that extend fleet conversion timelines considerably beyond original commercial targets agreed upon during initial procurement negotiations. The root cause is genuine infrastructure investment complexity in building refueling networks across a fragmented regulatory and permitting landscape facing simultaneous pressure from operator efficiency demands and capital constraints alike. Manufacturers are mitigating this through expanded infrastructure partnership programmes and dedicated corridor development agreements currently underway. Manufacturers with dedicated infrastructure partnerships navigate this friction more efficiently than smaller regional competitors.
Market Impact: Lifts transportation share 38 points
4 additional market trends, 3 additional growth drivers, and 3 additional restraints and challenges are covered in the full report. Contact sales@marketmindsadvisory.com to access the complete intelligence.

Segment CAGR and Growth Architecture

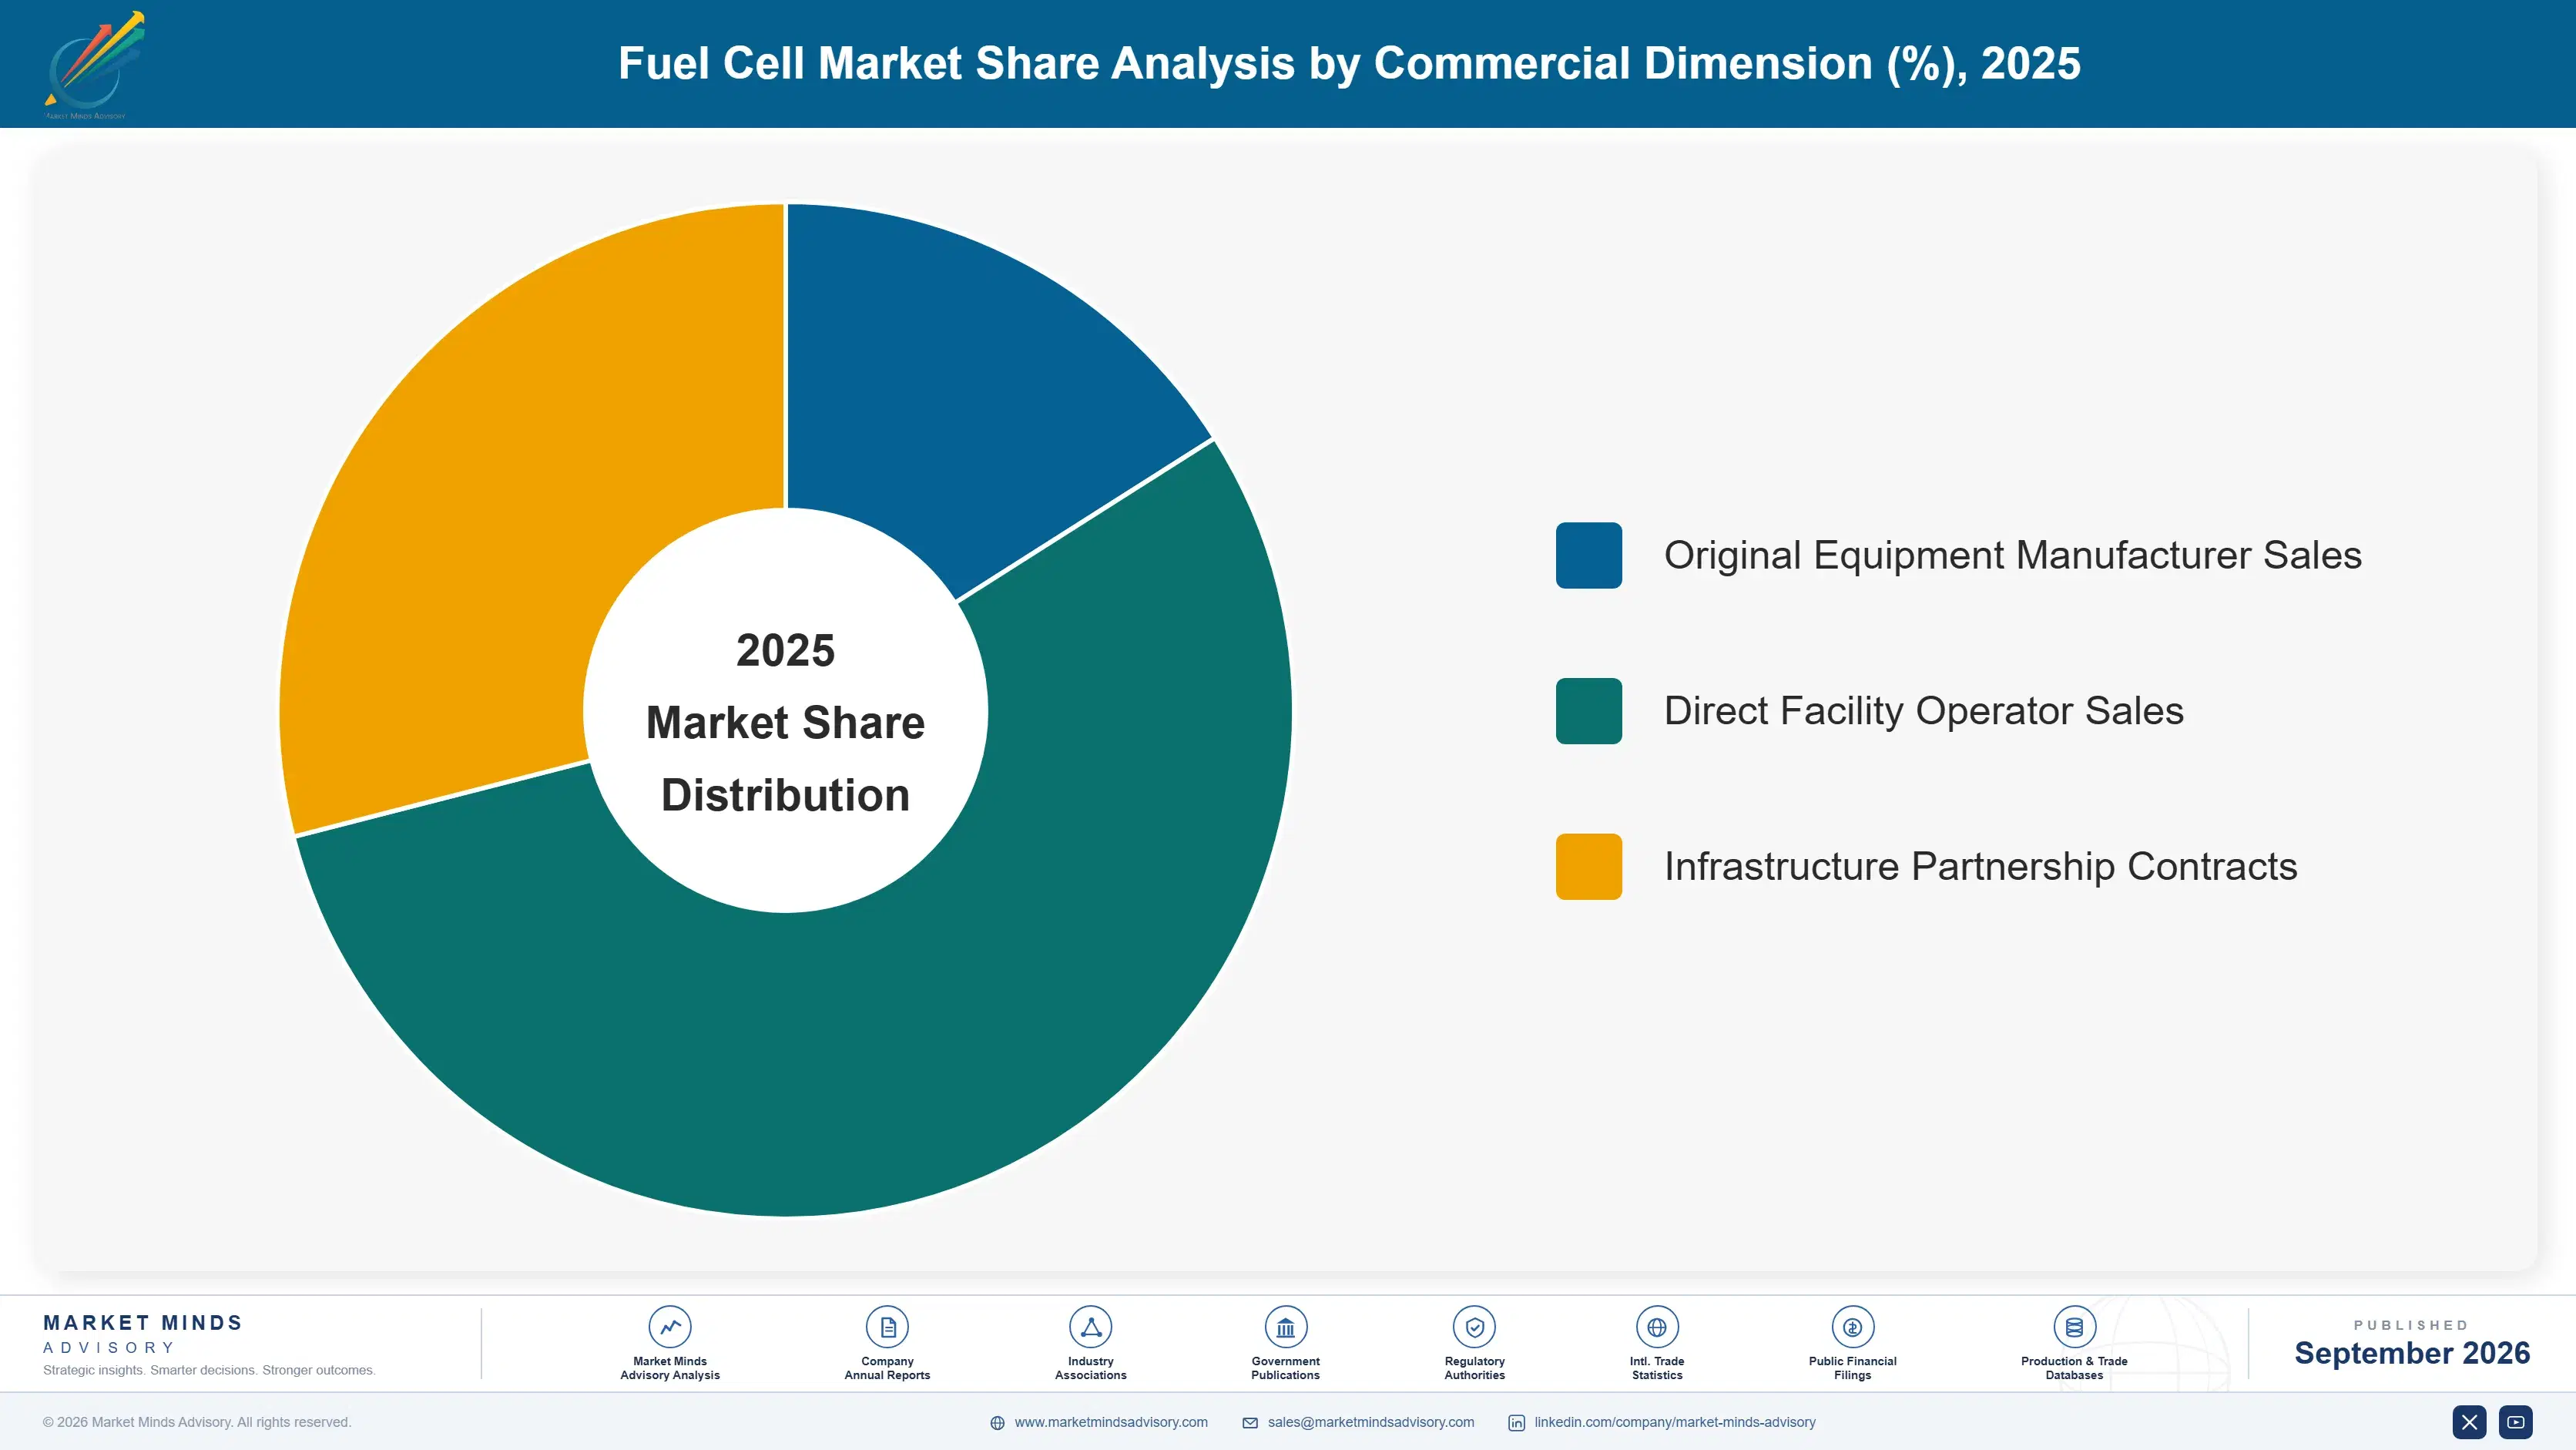
The fuel cell market segments most usefully by product and technology, spanning PEM, solid oxide, molten carbonate, phosphoric acid, alkaline, and direct methanol formats, rather than by application, customer type, distribution channel, or ownership model entirely alone. Analysts apply this same classification logic consistently across every regional and competitive discussion in this full report.
global-fuel-cell-market-market-share-analysis-1788233990395

Solid Oxide Fuel Cells

Solid oxide fuel cells are growing fastest, expanding at roughly 1.3 times the market's overall pace as data center operators increasingly specify grid-independent reliability credentials to reflect broader distributed-generation-driven purchasing shifts across hyperscale facilities worldwide. Bloom Energy and FuelCell Energy have both expanded dedicated solid oxide programmes specifically to compete for this growing category, recognizing that facility operators increasingly demand verified on-site generation capability rather than basic grid-dependent backup alone during procurement evaluations. This segment particularly benefits manufacturers with strong ceramic electrolyte engineering capability, since legacy generator-only offerings carry an increasingly unfavorable positioning profile against newer solid oxide formats gaining specification preference. Manufacturers without demonstrated solid oxide capability risk losing this category to better-positioned rivals already building dedicated testing infrastructure.
CAGR 19.5%

PEM Fuel Cells

PEM fuel cells form the second-fastest growing segment, propelled by fleet operators pursuing zero-emission transportation compliance that pairs regulatory adherence with proven stack durability beyond traditional diesel-only formats requiring costly emissions retrofitting. Ballard Power Systems and Toyota Motor Corporation have both expanded dedicated transportation production specifically to capture this growing category, recognizing that fleet operators increasingly demand verified durability credentials as a standard specification during vendor evaluation cycles. Manufacturers with strong existing engineering credibility track records are capturing disproportionate share of this expanding category, since operators increasingly demand demonstrated reliability before committing to premium PEM purchases. Manufacturers without demonstrated capability risk losing this category to better-proven competitors already established with major fleet accounts.
CAGR 16.5%
Full segment breakdown across 6 segments available in the complete report.

Regional Architecture and Country Demand Map

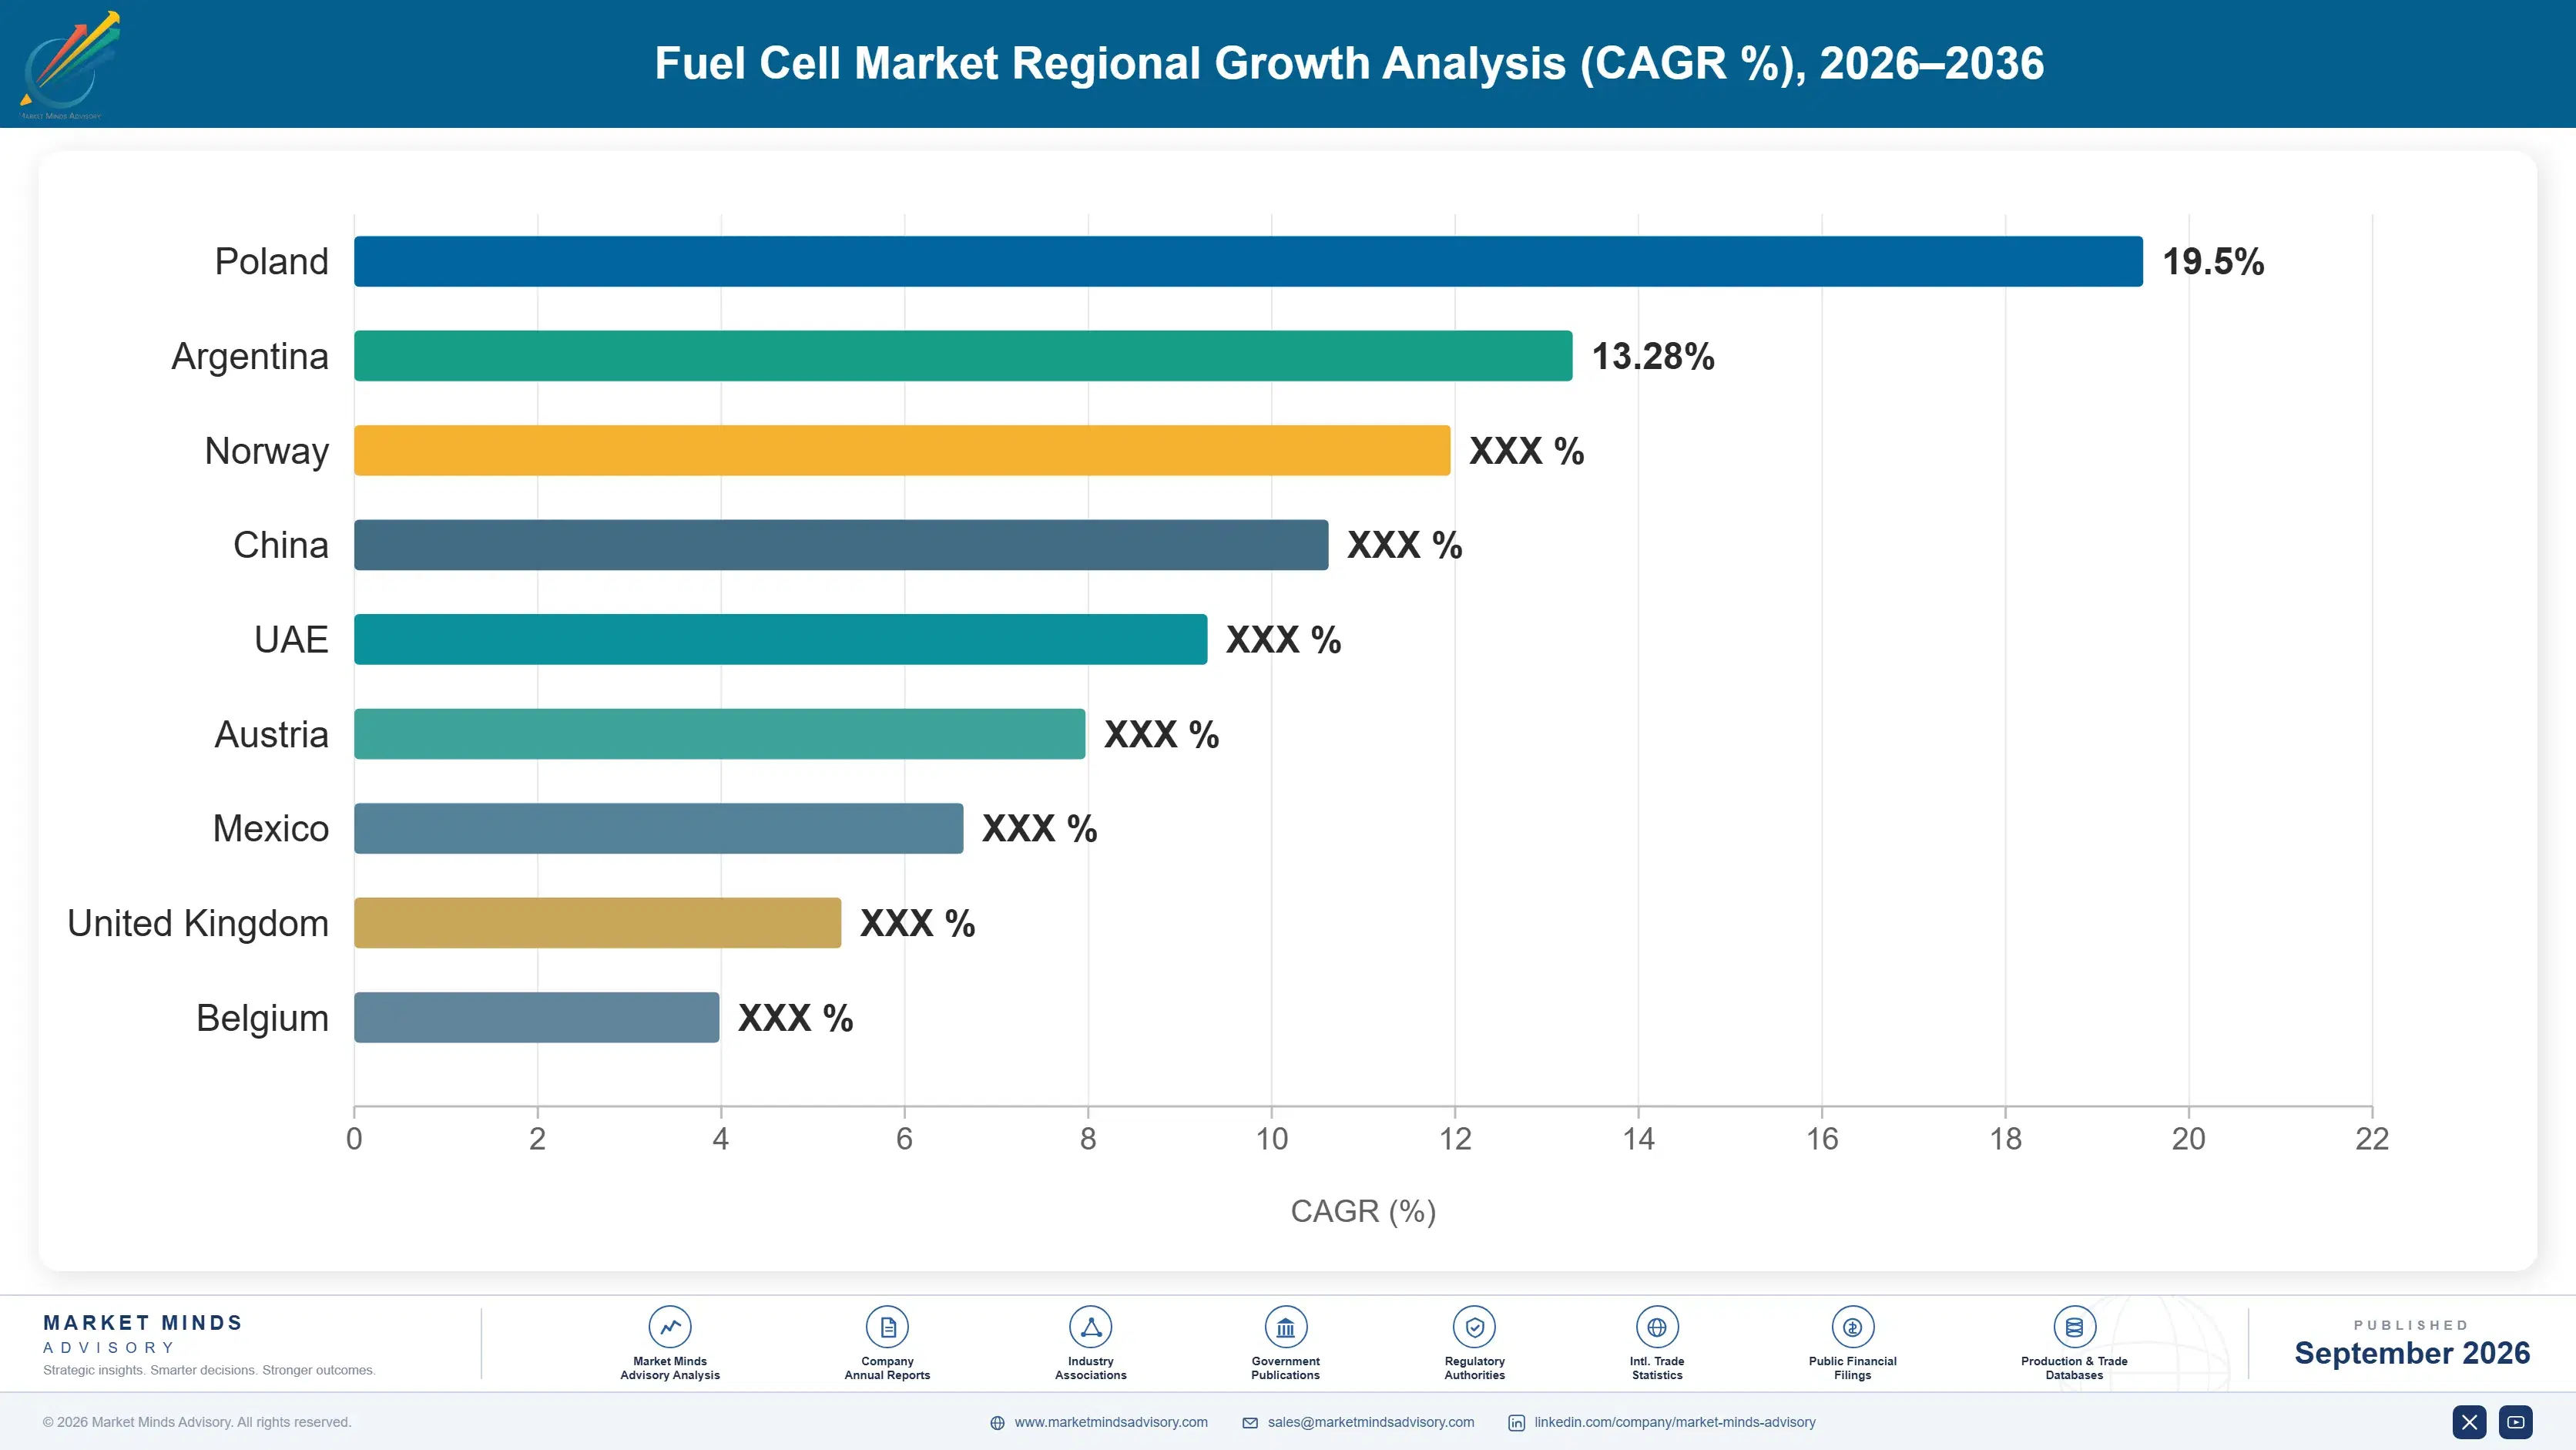
East Asia leads global demand today given its massive residential and stationary power installed base, while North America follows closely behind on hyperscale data center construction and grid interconnection bottlenecks across most regional power markets, and South Asia posts the fastest incremental regional growth pace.

East Asia

Japan's decades-long residential fuel cell subsidy programme has installed the world's largest single deployment of stationary units across hundreds of thousands of households, anchoring the largest single share of regional demand. This concentration justifies a share meaningfully above the typical regional band, since South Korea also hosts substantial grid-connected stationary fuel cell capacity through Doosan Fuel Cell installations, together with China's rapidly expanding hydrogen vehicle and industrial power initiatives. Panasonic and Kyocera both maintain deep domestic engineering roots in residential fuel cell technology, sustaining decades of accumulated manufacturing expertise. Continued government subsidy programmes and industrial hydrogen investment through the forecast period should sustain above-average regional growth relative to more mature markets elsewhere.
Share: 33% | CAGR: 16.0% (2026 to 2036)

North America

United States hyperscale data center construction, concentrated across Virginia, Texas, and the Pacific Northwest, continues driving substantial stationary fuel cell procurement as grid interconnection queues extend project timelines by several years in many jurisdictions. Bloom Energy and FuelCell Energy maintain strong engineering relationships with major data center operators, supporting premium product positioning across new construction projects. Canadian industrial power generation adds further specialized demand tied to remote and off-grid facility operations. Mexican industrial cooling demand contributes incremental regional demand, though at materially smaller scale than the dominant United States market. Investment in solid oxide capacity continues accelerating as operators pursue faster deployment timelines. Utility-scale hydrogen production partnerships continue expanding to support growing stationary power demand across major metropolitan grid regions.
Share: 27% | CAGR: 15.5% (2026 to 2036)
Regional intelligence for 5 additional markets available in the complete report: Western Europe, South Asia and Pacific, Latin America, Middle East and Africa, Eastern Europe. Contact sales@marketmindsadvisory.com.
global-fuel-cell-market-country-cagr-analysis-1788233990901

Where Fuel Cell Manufacturers Can Capture More Value

Manufacturers competing purely on unit price face meaningfully thinner margins than those building differentiated engineering, certification, and lifecycle capability across their broader product portfolios and facility relationships. Four commercial levers stand out as the clearest paths to durable margin expansion across the full ten-year forecast period ahead for most established players in this market.

Expand Stack Health Monitoring Service Contracts

Manufacturers offering dedicated stack health monitoring programmes, bundling remote diagnostics with predictive maintenance scheduling and field service dispatch, are capturing meaningfully higher margins than those selling fuel cell systems as standalone hardware alone. This approach converts a one-time equipment sale into a recurring service relationship worth roughly 15 to 20% of the original contract value annually. Bloom Energy and FuelCell Energy have both expanded dedicated monitoring platforms specifically to capture this opportunity ahead of smaller rivals lacking comparable digital infrastructure. Facility operators increasingly prefer bundled arrangements since they reduce coordination burden across multiple vendor relationships during major expansion projects.
Market Impact: Adds 15 to 20 percent recurring service revenue

Build Certified Grid-Independent Reliability Testing Capability

Manufacturers investing in dedicated grid-independent reliability testing and certification infrastructure are winning premium pricing of roughly 10 to 15% over competitors offering only standard factory performance claims. This certification investment requires meaningful upfront capital but pays back within two to three years given sustained premium pricing across the certified product line. Bloom Energy and Ballard Power Systems have both expanded certified testing facilities specifically to capture this premium positioning ahead of smaller regional competitors. Facility operators increasingly specify third-party verified reliability credentials as a standard procurement requirement rather than an optional consideration during vendor evaluation.
Market Impact: Captures roughly 10 to 15 percent price premium

Localize Production Across Fast-Growing Emerging Regions

Manufacturers establishing local manufacturing and assembly capability across India and Southeast Asia are reducing delivery lead times by roughly 25 to 35% relative to importing finished systems from established Asian or North American facilities. This localization strategy also improves cost competitiveness against domestic regional producers gaining technology sophistication rapidly. Toyota and Ballard Power Systems have both announced regional manufacturing investment specifically to defend share against faster-growing local competitors entering the mid-tier segment aggressively. Facility operators increasingly favor suppliers offering shorter lead times given tightening deployment scheduling requirements across most major accounts.
Market Impact: Cuts regional lead times by 25 to 35 percent

Expand Hydrogen Infrastructure Partnership Development Programmes

Manufacturers co-investing in dedicated hydrogen refueling infrastructure alongside fleet operators, sharing capital costs for depot and corridor buildout, are capturing meaningfully higher recurring revenue than those selling vehicles alone without infrastructure support. This partnership model generates roughly 8 to 12% of original contract value annually across the deployment lifecycle. Toyota Motor Corporation and Ballard Power Systems have both expanded dedicated infrastructure partnerships specifically to capture this opportunity ahead of smaller competitors lacking comparable capital resources. Fleet operators increasingly value integrated infrastructure support given rising costs associated with standalone refueling network development.
Market Impact: Adds 8 to 12 percent recurring partnership revenue

Who Controls the Margin Pool

Concentration across the fuel cell market sits at a CR5 of 46%, reflecting a moderately concentrated structure across nearly two dozen tracked participants. Bloom Energy and Ballard Power Systems lead by a meaningful margin over the next tier of challengers, both having built decades of engineering credibility across stationary power and transportation applications. Plug Power and FuelCell Energy trail closely, competing on data center backup depth and stack durability rather than price.
Current activity centers on solid oxide stationary power expansion, hydrogen refueling infrastructure partnership, and regional manufacturing localization across fast-growing Asian markets. Manufacturers increasingly bundle stack monitoring and warranty extension services with core product sales, converting one-time transactions into recurring service relationships worth meaningful annual revenue. Several players have announced dedicated field service expansion targeting data center and fleet accounts.

Emerging pressure is building from Chinese domestic producers narrowing the technology gap with Western and Japanese incumbents across mid-tier categories, particularly in transportation and stationary formats sold domestically. This dynamic could compress pricing power for established brands unless they defend premium positioning through certification depth and infrastructure differentiation. Smaller regional specialists focused purely on legacy demonstration-scale formats face the greatest displacement risk as customers demand verified credentials.
global-fuel-cell-market-company-positioning-matrix-1788233991425

Competitive Moat and Risk Dimensions

BLOOM ENERGY

Moat: Solid Oxide Engineering Depth

Bloom Energy's decades of dedicated solid oxide fuel cell engineering, backed by proprietary manufacturing facilities and deep application expertise across data center and industrial power protocols, create switching costs that smaller rivals struggle to replicate quickly. Major hyperscale accounts value this proven reliability track record enough to accept premium pricing over unproven alternatives entering the category.
BLOOM ENERGY

Risk: Chinese Domestic Price Pressure

Chinese domestic fuel cell producers are narrowing the technology gap in mid-tier stationary formats, threatening Bloom Energy's pricing power across price-sensitive Asian accounts. Continued investment in certification and infrastructure partnership depth will be necessary to defend premium positioning as local competitors improve manufacturing quality and expand distribution reach.
BALLARD POWER SYSTEMS

Moat: Global Transportation Partnership Scale

Ballard operates one of the industry's broadest transportation partnership networks, enabling coordinated fleet deployment across major regions worldwide. This partnership depth strengthens account retention meaningfully, since fleet operators value integrated deployment support over marginal price differences when selecting a primary fuel cell vendor for heavy-duty transportation.
BALLARD POWER SYSTEMS

Risk: Infrastructure Investment Margin Compression

Expanding infrastructure co-investment commitments, while strengthening retention, exposes Ballard to margin compression if refueling network costs rise faster than contracted fleet revenue allows across multi-year agreements. Maintaining infrastructure investment discipline at scale across diverse regional markets remains an ongoing operational challenge as the deployment base continues expanding rapidly.

Players Tracked

Prominent Players

Bloom Energy
Ballard Power Systems
Plug Power
FuelCell Energy
Toyota Motor Corporation

Other Key Players

Doosan Fuel Cell
Ceres Power
Hyundai Motor Company
Cummins
AFC Energy
Nedstack
Panasonic
Kyocera
Aisin
SFC Energy
Intelligent Energy
Advent Technologies
PowerCell Sweden
Nikola Corporation
Mitsubishi Power

Recent Developments

MARCH 2026

Bloom Energy Opens New Solid Oxide Manufacturing Facility

Bloom Energy opened a new solid oxide fuel cell manufacturing and testing facility in the United States, expanding capacity to serve hyperscale data center customers across regional and export markets ahead of anticipated rising demand, reinforcing its established leadership position in this segment. Financial terms remain undisclosed.
Signal: Signals deepening investment in certified reliability credentials as the industry's key future competitive differentiator ahead. Analysts welcomed this progress.
NOVEMBER 2025

Ballard Expands Fleet Infrastructure Partnership

Ballard Power Systems announced an expanded hydrogen refueling infrastructure partnership with a major logistics operator, co-investing in depot and corridor buildout across the operator's full heavy-duty freight network under a new multi-year agreement covering several transportation corridors and hubs. Terms were not publicly disclosed. Industry watchers praised the arrangement.
Signal: Reflects the broader industry shift toward infrastructure co-investment over standalone vehicle sales alone across most major accounts.
JULY 2025

Plug Power Acquires Specialist Stack Manufacturer

Plug Power completed an acquisition of a specialist fuel cell stack component manufacturer, expanding its manufacturing capability and strengthening its competitive position against rivals in the fast-growing stationary power segment across multiple industrial and data center verticals worldwide. Terms of the transaction were not disclosed publicly.
Signal: Demonstrates consolidation activity targeting the fastest-growing product segment ahead of broader market adoption across every major region.

Platinum Exposure Across Fuel Cell Manufacturing

Platinum group metal catalysts and ceramic electrolyte components together represent roughly 40 to 46% of cost of goods sold across most fuel cell manufacturers, with the remainder split across balance-of-plant components, power electronics, and assembly labor. Platinum sourcing concentrates among a handful of global suppliers, primarily based in South Africa and Russia, alongside secondary recycling channels serving the wider industry.
The IEA's 2025 critical minerals report documented a 26% price spike in platinum group metals during the second half of 2025, driven by South African mining disruptions and simultaneous demand growth from automotive catalytic converter and fuel cell manufacturing sectors competing for the same limited supply. Manufacturers without diversified sourcing agreements absorbed meaningfully higher input costs during this window, compressing margins across affected product lines for several consecutive quarters.

Smaller regional manufacturers lacking diversified supplier relationships face meaningfully greater margin exposure than larger incumbents holding multi-year platinum supply agreements negotiated during more favorable pricing conditions. This exposure varies further by geography, since Japanese and American manufacturers generally maintain deeper supplier relationships than newer Asian entrants still building comparable sourcing infrastructure and long-term contract coverage across their supply base.
global-fuel-cell-market-cost-volatility-analysis-1788233991623

Reduce Platinum Loading Through Catalyst Research

Manufacturers are investing in reduced platinum-loading catalyst formulations and alternative catalyst chemistries to lessen dependence on volatile platinum group metal pricing. This research approach adds modest development cost upfront but meaningfully reduces long-term exposure to future price spikes and supply disruptions across the category. Several manufacturers report meaningful progress already. Adoption is expanding steadily across the industry today.

Lock In Multi-Year Platinum Supply Agreements

Larger manufacturers are negotiating multi-year fixed-price agreements with key platinum suppliers, trading some pricing flexibility for cost predictability across annual budget cycles and planning horizons ahead. This approach particularly benefits manufacturers with strong balance sheets able to commit to longer contract terms during periods of pronounced volatility and shortage. Suppliers generally favor this arrangement equally.

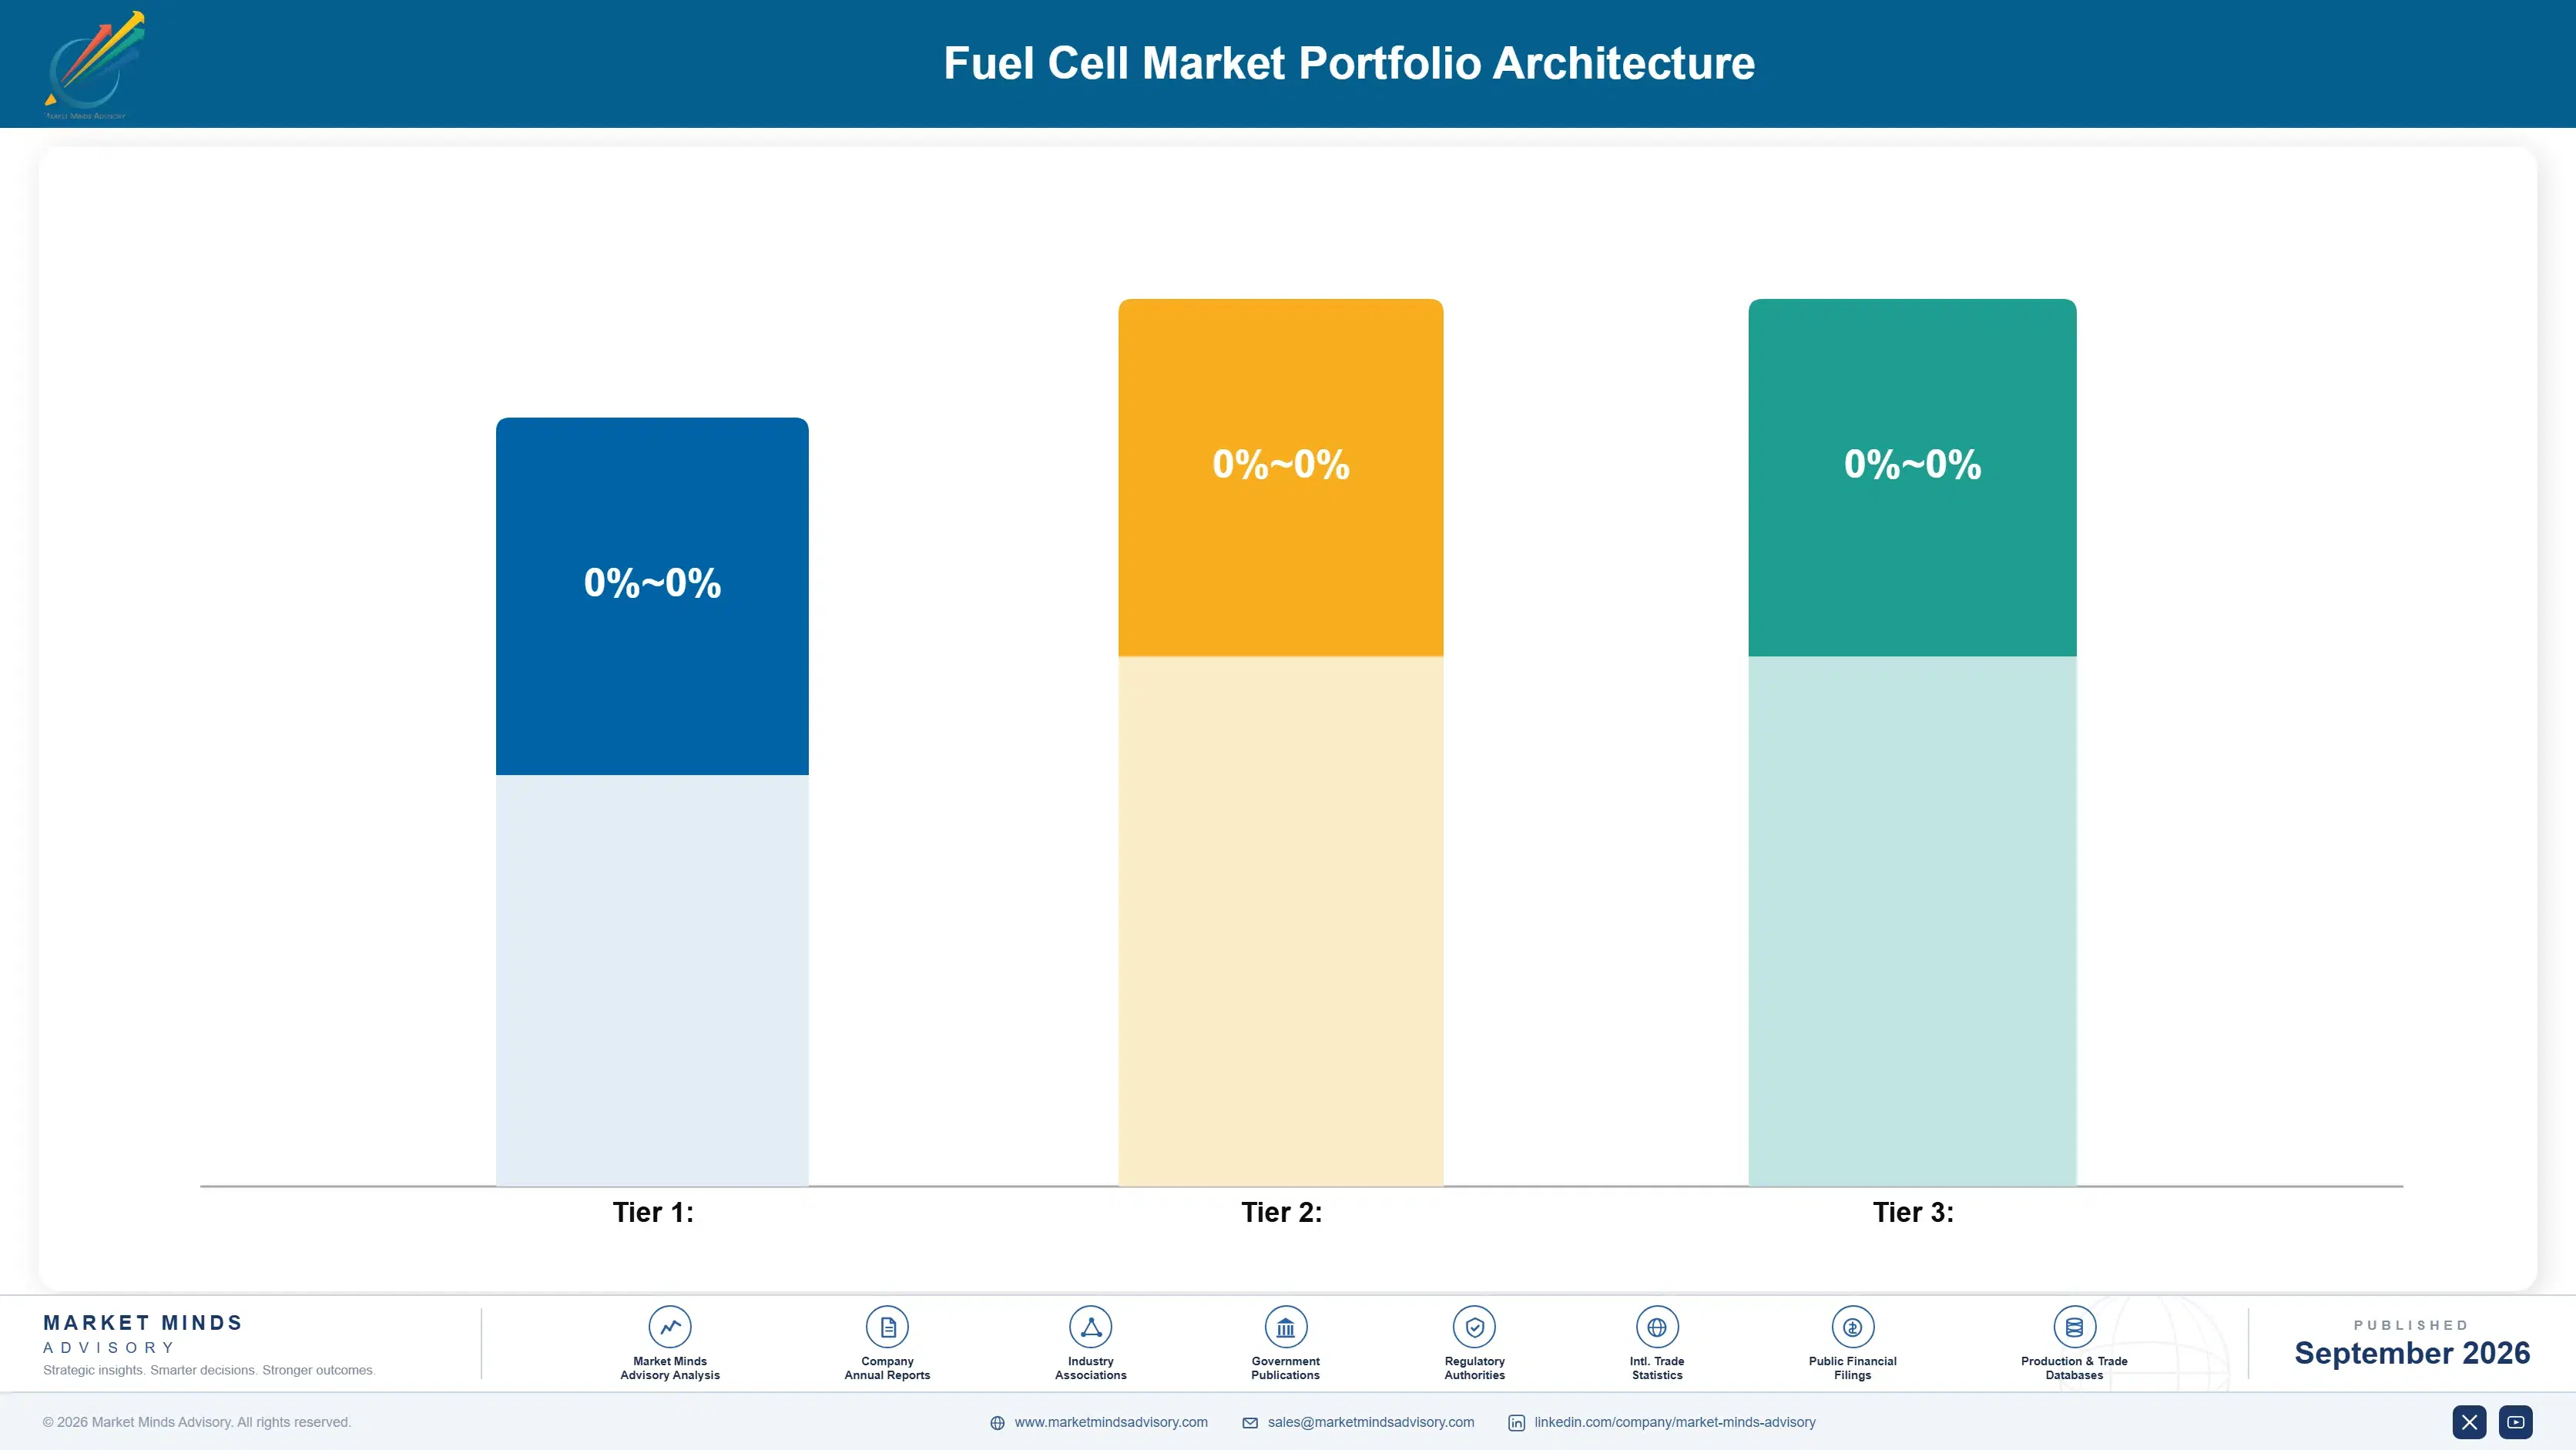
Portfolio Architecture for Margin Defence

The fuel cell market organizes into three distinct commercial tiers, each carrying meaningfully different margin economics and competitive dynamics across the value chain. Volume-commodity products compete primarily on price and delivery reliability, generating thinner margins across standardized portable and small-scale applications with limited differentiation opportunity for most participants. Premium certified products command meaningfully higher margins by offering verified reliability credentials that facility operators increasingly demand during procurement evaluations.
Sustainability and next-generation formats, particularly solid oxide stationary power technology, represent the smallest but fastest-growing tier, carrying the highest margins given limited current competition and genuine engineering differentiation across the installed facility base. Manufacturers face a persistent tension between defending volume-tier revenue, which still represents the largest absolute dollar pool today, and investing aggressively in premium and next-generation capability where future category growth concentrates most heavily.

High-value pools increasingly concentrate around certified solid oxide technology and bundled service contracts rather than standalone hardware sales alone across most major data center accounts. Manufacturers positioned only in the volume-commodity tier face gradual margin erosion as certified competitors capture disproportionate share of new procurement specifications across stationary and transportation accounts worldwide, reinforcing the strategic case for premium tier investment ahead.

Standardized portable and small-scale backup products compete primarily on price and delivery reliability across mature replacement-cycle demand, generating the thinnest margins in the category given intense price competition among numerous regional suppliers.
Gross Margin

Certified PEM and phosphoric acid systems with verified reliability credentials command meaningfully higher margins, reflecting facility operator willingness to pay for demonstrated performance and reduced downtime risk across critical applications worldwide.
Gross Margin

Solid oxide stationary power technology and grid-independent formats carry the highest margins given limited competition, genuine engineering differentiation, and rising regulatory pressure favoring distributed generation performance across major markets globally today.
Gross Margin
global-fuel-cell-market-portfolio-architecture-1788233992127

High-value Sub-segments and Strategic Watch-out

Solid Oxide Fuel Cells

This segment combines the highest current margins with the fastest growth trajectory, making it the clearest priority for manufacturer investment across engineering, testing, and dedicated field service capability expansion going forward across every major data center market and metropolitan power grid tracked. Source: MMA Estimate, July 2026.

PEM Fuel Cells

Strong margins paired with rapid growth make this segment a reliable secondary investment priority, particularly for manufacturers building certified durability credentials to capture share from legacy diesel competitors over the coming several years across most fleet, logistics, and freight accounts. Source: MMA Estimate, July 2026.

Phosphoric Acid Fuel Cells

This large, mature segment anchors current category revenue despite slower growth, and manufacturers must defend this volume base carefully while shifting incremental investment toward faster-growing premium and next-generation categories across their broader product portfolios, customer relationships, and expanding regional service networks. Source: MMA Estimate, July 2026.

Molten Carbonate Fuel Cells

This segment faces meaningful displacement risk as customers increasingly favor solid oxide alternatives for premium stationary applications, making it a genuine strategic watch-out for manufacturers still holding meaningful revenue exposure to this legacy industrial power generation format overall today across most markets. Source: MMA Estimate, July 2026.

Annuity Economics And Facility Depth

Fuel cell systems increasingly resemble an annuity business rather than a one-time equipment sale, since bundled stack monitoring, maintenance, and infrastructure partnership contracts generate recurring revenue that basic hardware sales never provided. Manufacturers building recurring facility relationships early capture disproportionate lifetime account value relative to competitors selling only standalone systems. This dynamic increasingly reshapes how manufacturers prioritize field service investment across their broader portfolios.
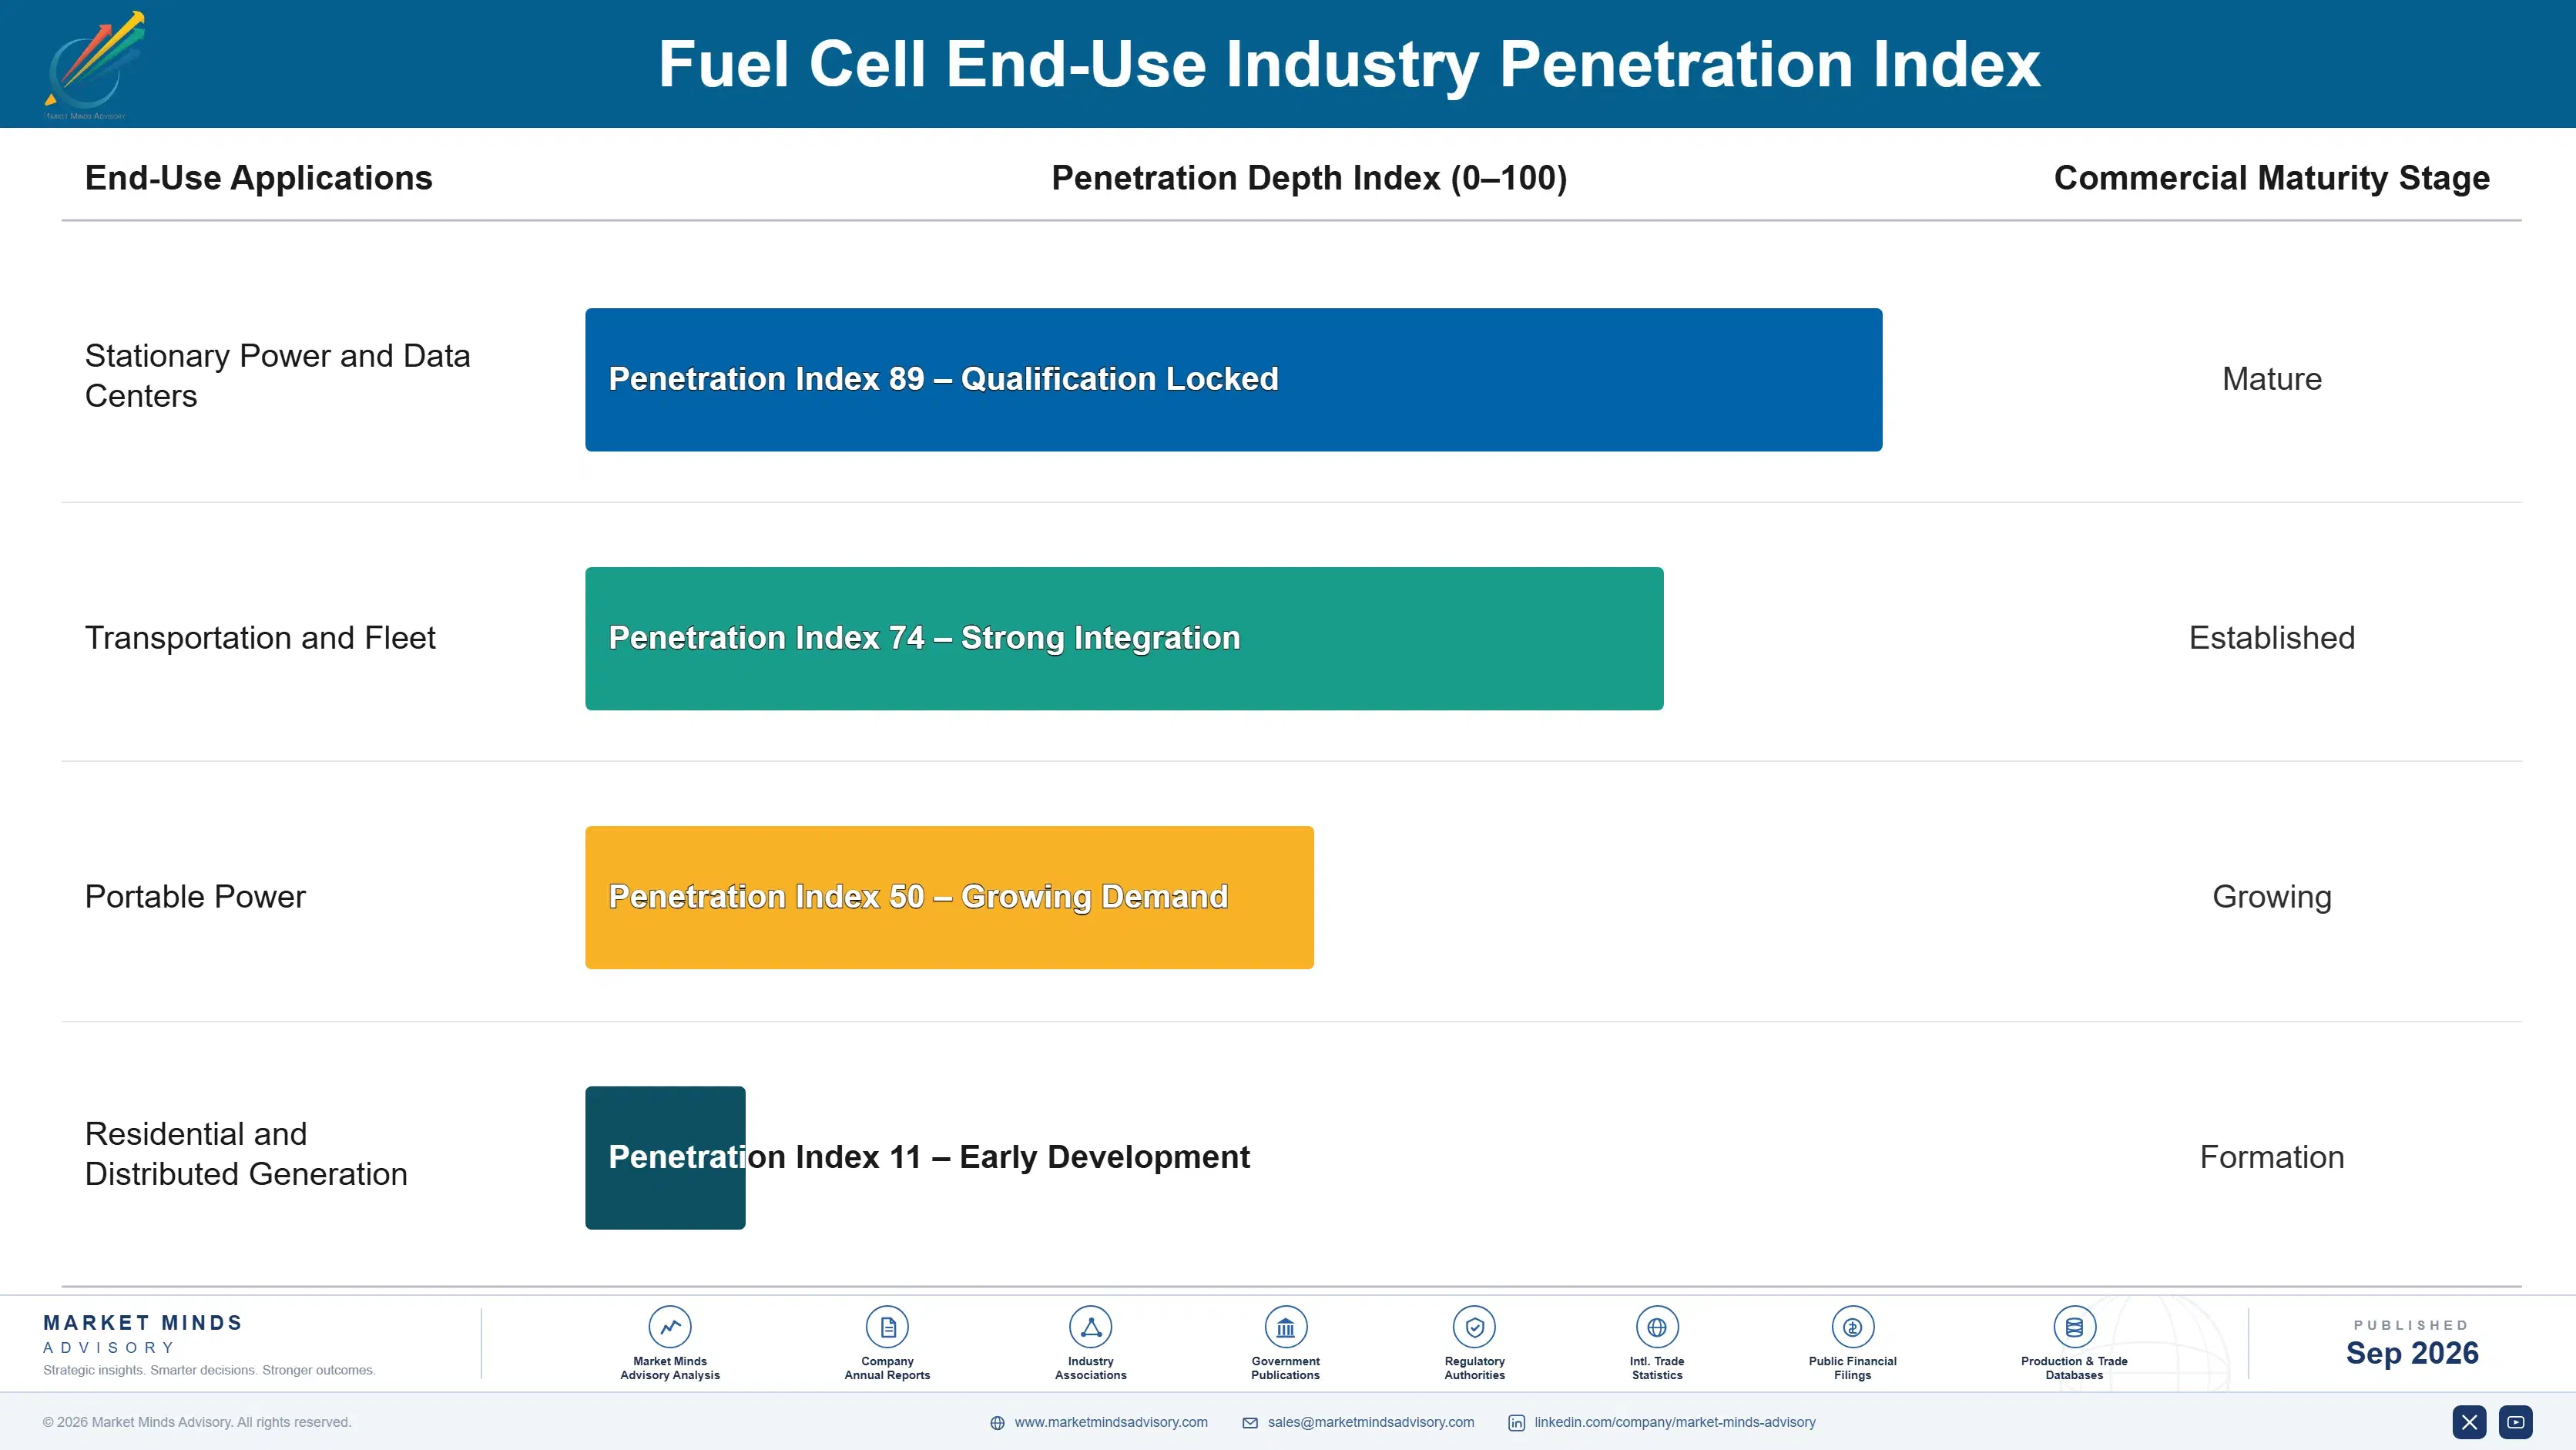
Adoption stickiness varies meaningfully by end-use vertical. Data center operators show strong repeat purchase behavior once stack reliability and grid-independent credentials are established, while heavy-duty fleet buyers demonstrate comparably deep retention given strict route planning requirements. Portable power buyers remain more price-sensitive and switching-prone, showing less loyalty depth than data center or fleet customers across most tracked accounts and regions.

Buyer profiles are shifting generationally too. Younger facility engineers increasingly research and specify equipment through digital fleet and facility management portals and direct manufacturer engineering support rather than legacy distributor relationships, reshaping which brands win first-specification moments. Older procurement teams still favor established distributor relationships, creating a genuine generational split that manufacturers must address through parallel engagement strategies rather than a single unified channel.
global-fuel-cell-market-end-use-penetration-index-1788233992608

Where Fuel Cell Value Concentrates Next

These are among the four positions where our research anticipates prominent divergence between winners and laggards over the coming forecast period. Each is grounded in the demand model, the regulatory perimeter, and the announced capacity pipeline.
01 / CERTIFICATION INVESTMENT PRIORITY

Verified reliability credentials now determine category leadership

Manufacturers that invested early in certified grid-independent reliability testing infrastructure are capturing disproportionate share of new procurement specifications across data center and industrial accounts worldwide. This advantage compounds as facility operators increasingly treat verified credentials as a standard requirement rather than an optional differentiator during vendor evaluation. Manufacturers lacking comparable certification capability risk permanent share loss to better-positioned specialist competitors already building dedicated testing partnerships, and closing this gap now costs meaningfully less than rebuilding lost facility trust after a rival secures the specification.
02 / SERVICE BUNDLING STRATEGY

Recurring monitoring contracts win account retention battles

Manufacturers that bundle stack monitoring, maintenance, and infrastructure partnership services are winning disproportionate account renewals over component-only legacy competitors across most major facility accounts. This shift reflects genuine operator demand for minimized downtime risk rather than a temporary contracting trend across the category overall. Manufacturers lacking demonstrated service depth face mounting pressure from better-instrumented specialist rivals across nearly every major procurement negotiation, and this gap widens further as operators formalize service benchmarks into standard vendor scorecards used across every account review cycle.
03 / SUPPLY CHAIN RESILIENCE PLANNING

Diversified platinum sourcing separates margin winners clearly

Manufacturers with diversified platinum group metal supply agreements maintain meaningfully more predictable production costs than single-source-dependent competitors across their manufacturing operations worldwide. This advantage becomes more pronounced during periods of raw material volatility, when unprotected manufacturers must absorb cost spikes directly across affected product lines and geographies. Companies without comparable supplier diversification face meaningful margin disadvantage relative to better-positioned peers holding multi-year agreements, and this gap tends to widen further whenever platinum markets experience another period of pronounced volatility or mining disruption.
04 / REGIONAL EXPANSION SEQUENCING

India and Southeast Asia anchor next growth wave

Manufacturers building dedicated local manufacturing capability across India and Southeast Asia are positioning for disproportionate future revenue capture as industrial power investment accelerates regionally. This dynamic rewards early market entrants willing to invest ahead of fully proven demand across these newer markets, and early movers are already securing preferred local partnership agreements here. Companies delaying regional investment risk ceding this expanding opportunity to more aggressive competitors already building local engineering relationships, and catching up later typically costs substantially more than establishing early distribution partnerships and local manufacturing credibility now.

Engagement Snapshot From the Field

A live engagement with an industry participant carrying material or product regulatory and market exposure ahead of a defining policy shift, showing how our research translates into a defensible multi-year portfolio strategy.
MARKET MINDS ADVISORY · CLIENT ENGAGEMENT SUMMARY
Fuel Cell Producer Strategic Portfolio Review and Transition Roadmap 2026·Investment Scenario on Fuel Cell Exposure Evaluation 2025-26
CLIENT PROFILE
A multinational hyperscale data center operator with an established presence across diesel backup generator infrastructure sought to expand into certified solid oxide stationary fuel cell technology. The client's leadership team recognized growing operational risk from grid interconnection delays capturing disproportionate project timeline exposure. The engagement was commissioned to inform a multi-year power infrastructure investment decision.
STRATEGIC CHALLENGE
The client's existing facility procurement processes were optimized for diesel backup economics rather than solid oxide technology or certified grid-independent testing infrastructure development. Leadership needed a clear roadmap for building new engineering capability without disrupting existing operational uptime commitments. Executive teams also weighed the risk of stranding capital in underutilized backup power investments during the multi-year transition period.
MMA APPROACH
MMA conducted primary interviews with 47 industry experts alongside proprietary survey data covering purchase behavior across six countries. The engagement mapped competitive positioning across solid oxide and PEM segments, identifying specific facility transition capability gaps and prioritizing investment sequencing based on projected grid interconnection timelines. Findings were validated against company disclosed financials where available throughout the engagement.
KEY FINDINGS
  1. Certified solid oxide fuel cell buyers demonstrated meaningfully higher total uptime reliability than diesel-only backup buyers over a ten-year horizon (client-reported, unverified by MMA).
  2. Existing facility vendor relationships provided a credible advantage for phased deployment sequencing, reducing installation timeline substantially for new fuel cell projects (client-reported, unverified by MMA).
  3. Grid-independent generation infrastructure gaps represented the largest operational vulnerability relative to specialist operators already established with solid oxide deployments (client-reported, unverified by MMA).
  4. Regional expansion into India offered disproportionate growth potential relative to further investment in mature Western European data center markets over the next several years (client-reported, unverified by MMA).
CLIENT PROFILE
A multinational hyperscale data center operator with an established presence across diesel backup generator infrastructure sought to expand into certified solid oxide stationary fuel cell technology. The client's leadership team recognized growing operational risk from grid interconnection delays capturing disproportionate project timeline exposure. The engagement was commissioned to inform a multi-year power infrastructure investment decision.
STRATEGIC CHALLENGE
The client's existing facility procurement processes were optimized for diesel backup economics rather than solid oxide technology or certified grid-independent testing infrastructure development. Leadership needed a clear roadmap for building new engineering capability without disrupting existing operational uptime commitments. Executive teams also weighed the risk of stranding capital in underutilized backup power investments during the multi-year transition period.
MMA APPROACH
MMA conducted primary interviews with 47 industry experts alongside proprietary survey data covering purchase behavior across six countries. The engagement mapped competitive positioning across solid oxide and PEM segments, identifying specific facility transition capability gaps and prioritizing investment sequencing based on projected grid interconnection timelines. Findings were validated against company disclosed financials where available throughout the engagement.
KEY FINDINGS
  1. Certified solid oxide fuel cell buyers demonstrated meaningfully higher total uptime reliability than diesel-only backup buyers over a ten-year horizon (client-reported, unverified by MMA).
  2. Existing facility vendor relationships provided a credible advantage for phased deployment sequencing, reducing installation timeline substantially for new fuel cell projects (client-reported, unverified by MMA).
  3. Grid-independent generation infrastructure gaps represented the largest operational vulnerability relative to specialist operators already established with solid oxide deployments (client-reported, unverified by MMA).
  4. Regional expansion into India offered disproportionate growth potential relative to further investment in mature Western European data center markets over the next several years (client-reported, unverified by MMA).
RECOMMENDED STRATEGY
Phase 1: Phase one prioritized certified reliability testing infrastructure, including dedicated testing partnerships across two flagship facility campuses prior to broader rollout. Phase 2: Phase two built solid oxide upgrade capability through a targeted partnership with a specialist fuel cell manufacturer to accelerate deployment timelines. Phase 3: Phase three expanded regional facility coverage across India and Southeast Asia through dedicated local partnership agreements within eighteen months overall.
OUTCOME
Within eighteen months, the client upgraded a meaningful share of its facility portfolio to certified solid oxide technology and established a monitoring programme generating renewed operational confidence (client-reported, unverified by MMA). Regional expansion into India exceeded initial deployment projections meaningfully. Leadership credited the phased sequencing approach for limiting disruption to existing operations.

Frequently Asked Questions

Foundational context covering the market sizes, CAGR, scope, country, region and competition that inform every finding below. This section is provided to cover basics and most often pre-purchase conversations, answered from the MMA Primary Research Dataset.

What is the current size of the Fuel Cell Market?

The Fuel Cell Market reached an estimated 9.8 billion dollars in 2025. This figure reflects combined global revenue across PEM, solid oxide, molten carbonate, and phosphoric acid formats.

How large will the Fuel Cell Market be by 2036?

The market is projected to reach approximately 45.59 billion dollars by 2036. This represents roughly 4.05 times the 2026 value across the full ten-year forecast period.

What is the CAGR for the Fuel Cell Market 2026 to 2036?

The market is expected to grow at a compound annual rate of 15.0 percent. Bull and bear scenarios range between 13.7 and 16.3 percent respectively across the forecast.

Which segment is growing fastest?

Solid oxide fuel cells are growing fastest, at roughly 1.3 times the overall market pace. Data center backup demand and grid interconnection delays together drive this outsized expansion.

Who are the major companies in the Fuel Cell Market?

Bloom Energy, Ballard Power Systems, Plug Power, FuelCell Energy, and Toyota Motor Corporation lead the market. Together these five manufacturers hold a combined CR5 of roughly 46 percent overall today.

Which country is growing fastest?

The United States is growing fastest, at an estimated 17.0 percent annually. Expanding hyperscale data center construction alongside grid interconnection bottlenecks together drive this accelerating pace.

Report Segmentation Architecture

The full report scope spans multiple orthogonal segmentation dimensions, with cross-tabulated demand data provided for each dimension pair. Coverage extends further to regional breakdowns, trend trajectories, and the competitive detail needed to support segment-level decision-making.

By Primary Market Dimension

  • PEM Fuel Cells
  • Solid Oxide Fuel Cells
  • Molten Carbonate Fuel Cells
  • Phosphoric Acid Fuel Cells
  • Alkaline Fuel Cells
  • Direct Methanol Fuel Cells

By End-Use Industry

  • Stationary Power and Data Centers
  • Transportation and Fleet
  • Portable Power
  • Residential and Distributed Generation

By Commercial Dimension

  • Original Equipment Manufacturer Sales
  • Direct Facility Operator Sales
  • Infrastructure Partnership Contracts

By Region

  • East Asia
  • North America
  • Western Europe
  • South Asia and Pacific
  • Latin America
  • Middle East and Africa
  • Eastern Europe

Scope, Methodology, and Coverage

Every figure in this report is reproducible from documented input assumptions. The scope below maps the historical period, the forecast horizon, the segmentation dimensions, and the countries covered, alongside the underlying primary and qualitative methodology.
Historical Period
2020 to 2025
Forecast Period
2026 to 2036
Base Year
2025 (USD billions; MMA Primary Research Dataset, September 2026)
Market Definition
This report covers fuel cell systems across PEM, solid oxide, molten carbonate, phosphoric acid, alkaline, and direct methanol technologies used in stationary power generation, transportation, and portable power applications. It excludes hydrogen production, storage infrastructure, and battery-electric propulsion systems.
Quantitative Units
USD billions, 2025 base year
Segmentation Dimensions
Product and technology type, end-use industry, commercial channel, region
Regions Covered
East Asia, North America, Western Europe, South Asia and Pacific, Latin America, Middle East and Africa, Eastern Europe
Countries Covered
United States, Canada, Germany, United Kingdom, Denmark, China, Japan, South Korea, India, Australia, Brazil, Saudi Arabia
Key Companies Profiled
Bloom Energy, Ballard Power Systems, Plug Power, FuelCell Energy, Toyota Motor Corporation
Quantitative Methodology
Primary survey, n=3,800 respondents, Q4 2025, six countries; demand-side model with trade association cross-validation
Qualitative Methodology
47 expert interviews, Q4 2025; applied to validate demand model assumptions, identify emerging dynamics, and assess competitive positioning
Report Format
PDF and XLSX data workbook (Word format preview document)
Publisher
Market Minds Advisory
Report Code
MMA-2026-ENE-178
Published
September 2026
Contact
sales@marketmindsadvisory.com | www.marketmindsadvisory.com

Purchase the full Fuel Cell Market Report (2026 to 2036).

The full report expands on every dimension summarized here, including complete segmentation breakdowns, all seven regional profiles, and extended competitive intelligence covering all twenty profiled manufacturers. It includes detailed input cost modeling and portfolio tier economics not covered in this summary document. Clients also receive proprietary survey data from 3,800 respondents across six countries alongside 47 expert interviews conducted in Q4 2025. A dedicated analyst briefing session is included with every purchase, and clients gain access to editable data tables for internal modeling work. Every profile includes verified sourcing notes for full analyst transparency.
Complete seven-region data tables covering every profiled market
Full twenty-company competitive profiles with detailed strategic assessments
Editable segmentation and forecast models for internal team use
Dedicated analyst briefing session with a named practice lead
Primary survey microdata access for advanced internal analysis
Quarterly market update subscription with quarterly data refreshes

Built For The People Who Decide

From boardroom strategy to bench-side execution, this report is read cover-to-cover by leaders shaping the next decade of their industry, turning demand scenarios, market dynamics and valuation benchmarks into decisions.
CXOs/ Presidents/ VPs/ Managers
M&A and Corporate Development
Strategy Teams and R&D Heads
Procurement and Product Directors
Regulatory and Compliance Leaders
Investor Relations and Equity Analysts