Market Minds Advisory
Global Crawler Excavator Market

Global Crawler Excavator Market: Compact Growth, Chinese Export Pressure and the Slow Arrival of Electrification

Chinese overcapacity is exporting price pressure into every market it reaches, compact machines are taking share from every direction, and battery electrification has finally moved from demonstration duty into genuine urban commercial work.

Lead Analyst

David Horsley

Published

September 2026

Make Smarter Decisions with Customized Research Insights

Request a free sample report and evaluate market opportunities, growth trends, and competitive dynamics relevant to your business needs.

2025 MARKET VALUE$46.0BMarket Size 2025
2036 FORECAST VALUE$75.4BBase Case , 2026 to 2036
CAGR 2026 TO 20364.6 %Bull 5.8% / Bear 3.4%
INCREMENTAL OPPORTUNITY$27.3BNet 10- year value creation
EXPANSION MULTIPLE1.57x2036 value over 2026 base
Strategic Levers
M&A Pipeline
Regional Outlook
Country Rankings
Competitive Intelligence
Segmental Deep-dive
Call-Us : 91 93563 13602

Executive Snapshot and Market Trajectory

The single most consequential thing in this market is not a technology. It is that Chinese manufacturers built capacity against a domestic construction boom that ended, and the machines that capacity keeps producing now go abroad, arriving at prices that reset what buyers everywhere expect to pay.
Mini excavators under six tonnes grow at 6.9%, a full 1.50 times the market rate, because urban work, utility installation and landscaping contractors keep finding jobs a compact tracked machine does better than anything else available. East Asia holds 38% of global value, above the standard regional band, because China is both the largest single national market and by a wide margin the largest manufacturing base anywhere.
Concentration runs at 48% for the top five, and it is more stable than the pricing environment suggests. Caterpillar and Komatsu hold position through dealer networks and resale values that Chinese entrants have not replicated, and contractors who buy on acquisition price alone tend to discover exactly why residual value matters when trade-in time arrives. Parts coverage outside China remains thin, and that is the barrier price alone does not clear.
Market Definition
This report covers tracked hydraulic crawler excavators across mini, midi, standard, large and mining weight classes, sold into construction, infrastructure, mining, utility, demolition and forestry applications. Wheeled excavators, backhoe loaders, skid steer and compact track loaders, wheel loaders, bulldozers, draglines, attachments sold separately, and equipment rental service revenue are excluded from the sizing.
Base Year Value
$46.0B in 2025 (MMA Primary Research Dataset, August 2026)
Forecast Period
2026 to 2036, eleven discrete annual values
CAGR
4.6% base case. Bull 5.8%. Bear 3.4%.
Fastest Growth Segment
Mini Excavator Under Six Tonnes: 6.9% CAGR
Fastest Growth Country
India: 7.4% CAGR
Fastest Growth Region
South Asia and Pacific: 6.8% CAGR
Largest Region
East Asia: 38% of 2025 global value
Market Leaders
Caterpillar, Komatsu, Sany Heavy Industry, XCMG and Hitachi Construction Machinery lead on unit shipment volume. Source: MMA Analysis, July 2026.
Primary Survey
n=3,800 procurement and R&D decision-makers, Q4 2025, six countries
Methodology
Demand-side build-up, cross-validated against public data, 47 expert interviews

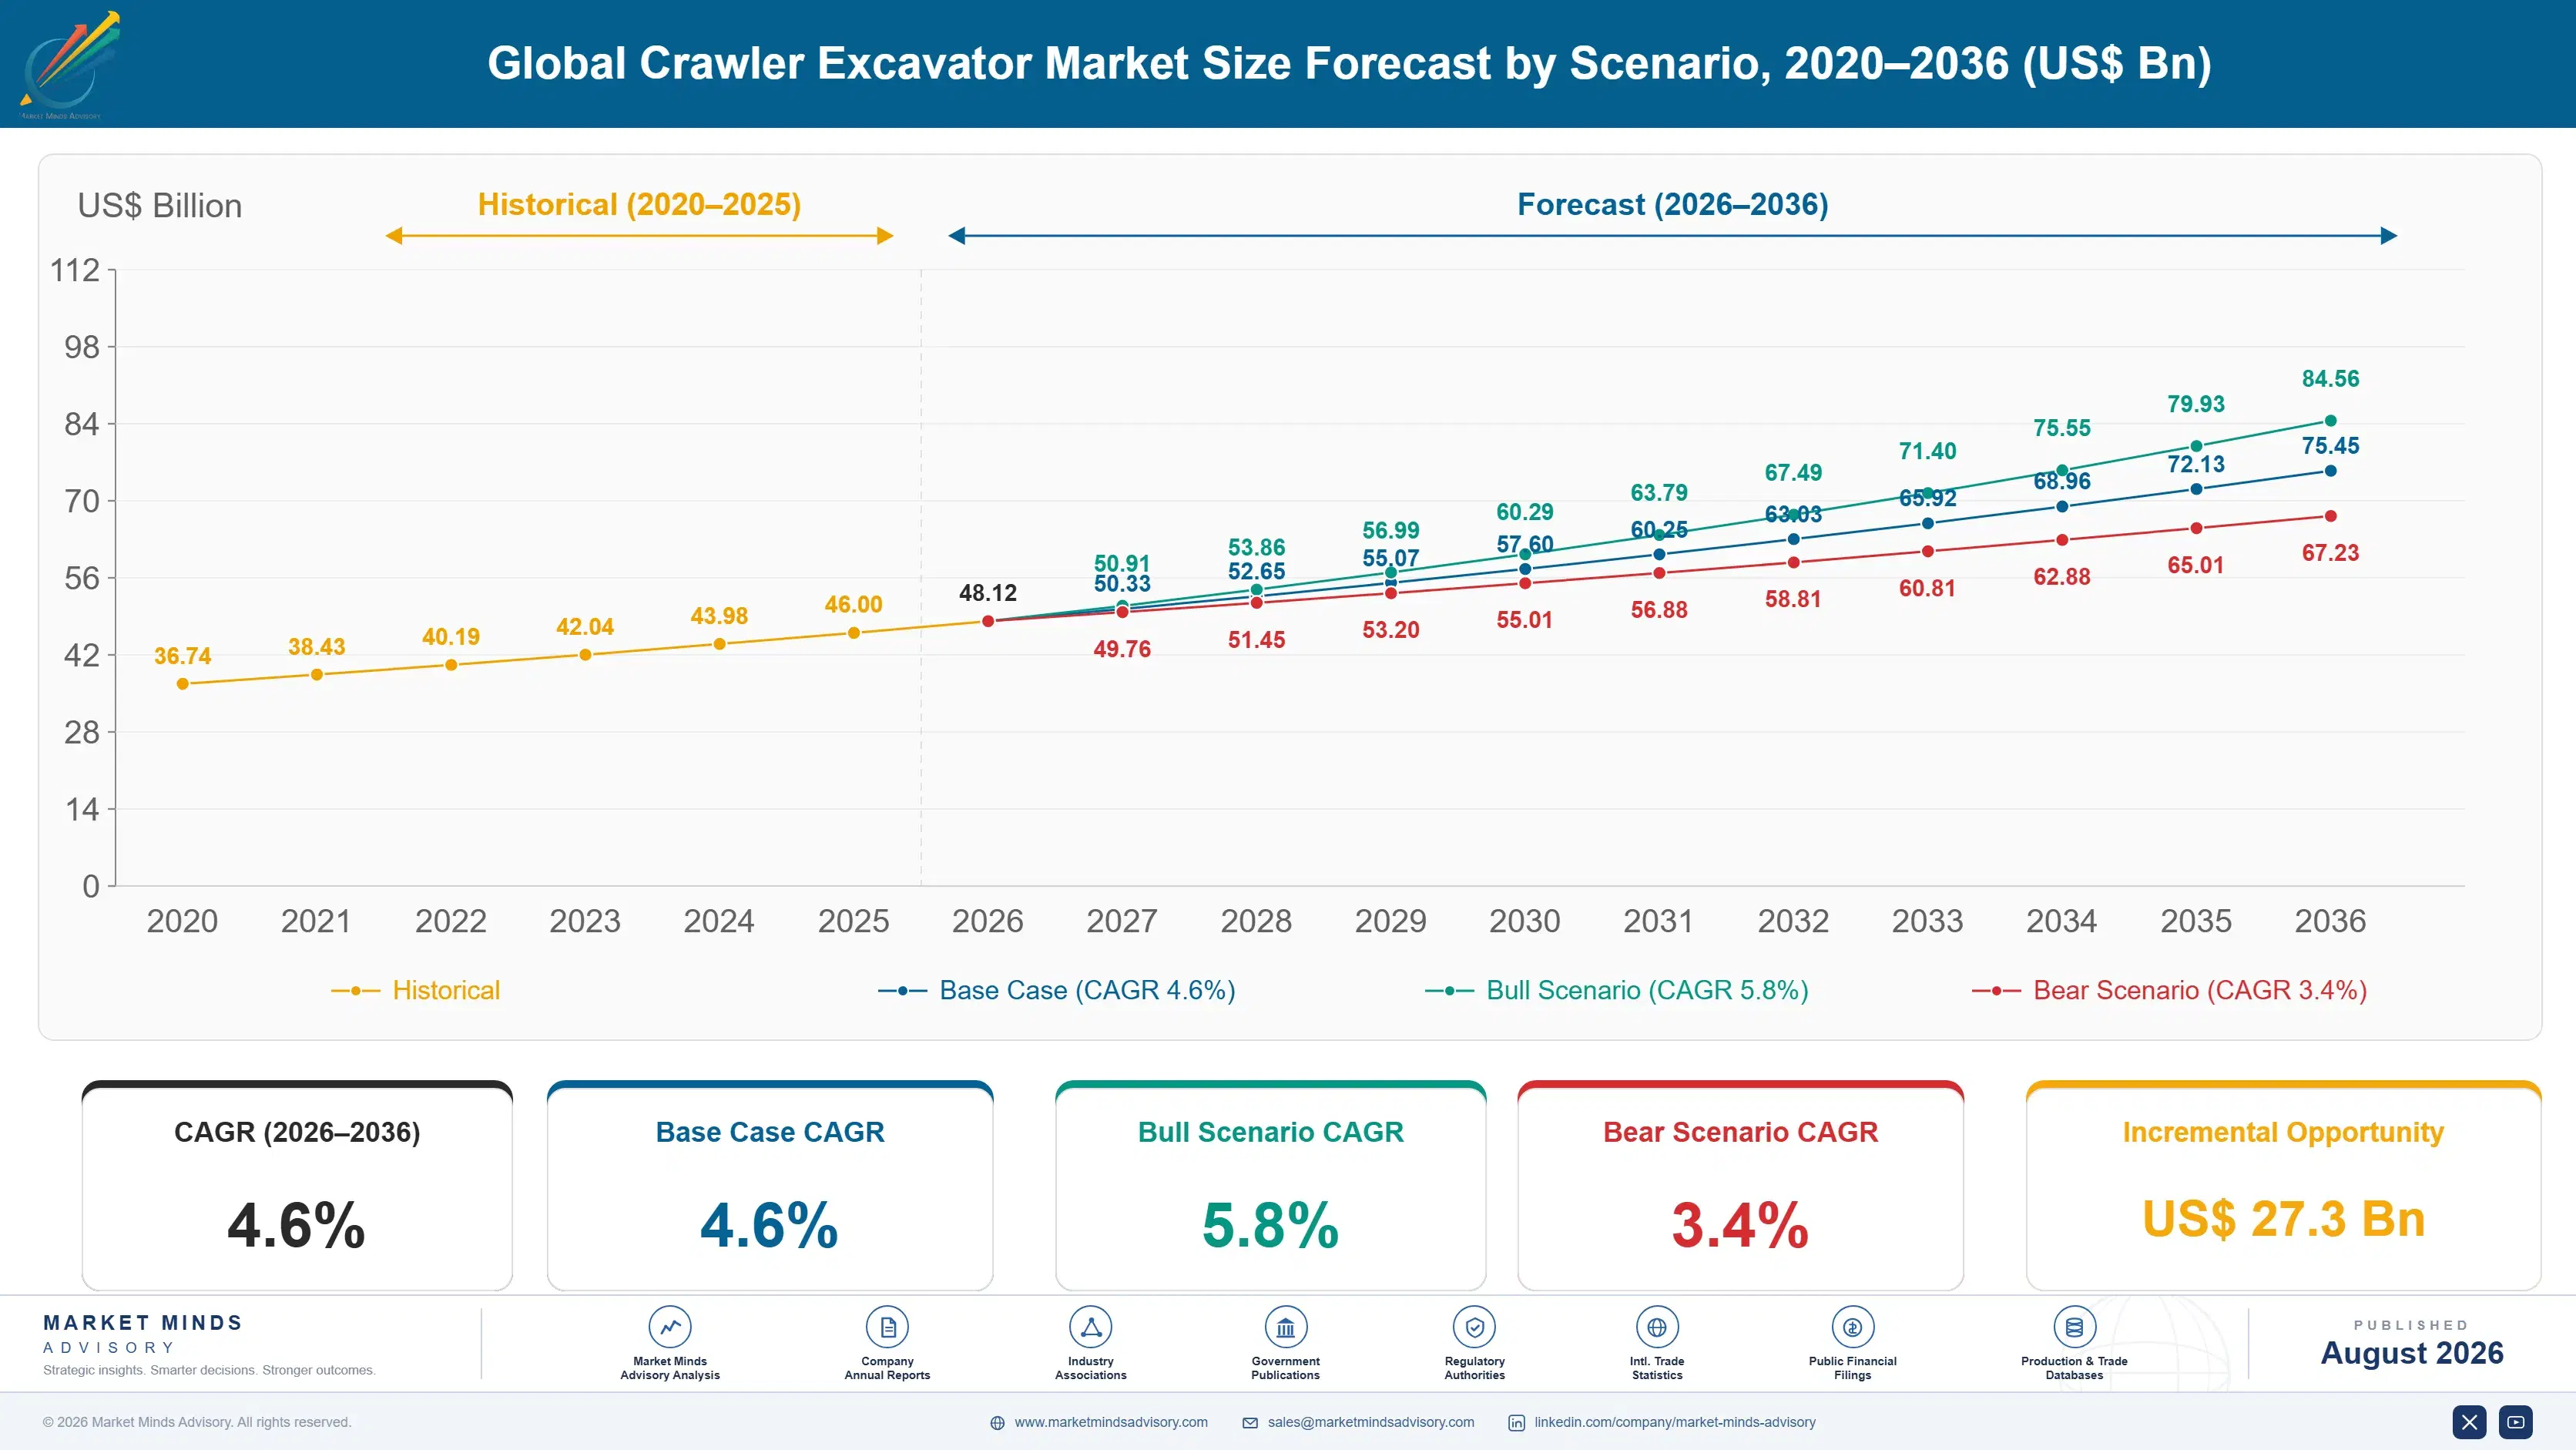
Global Crawler Excavator Market Forecast Scenarios

global-crawler-excavator-market-size-forecast-scenario-1787315869321
Between 2020 and 2025 the market compounded at 3.6%, and two opposite forces produced that number. Chinese domestic demand fell hard after 2021 as the property sector contracted, removing volume that had underpinned global growth for a decade. Infrastructure programmes across North America, India and the Gulf grew through the same period and largely replaced it, though at different machine sizes and considerably different margins.
The base case at 4.6% rests on three mechanisms. Infrastructure programme spending in North America, India and the Middle East is committed on multi-year schedules that contractors buy fleets against, which makes the volume unusually visible. Compact machine growth continues as contractors find urban and utility work that larger equipment cannot access. Content per machine rises steadily through machine control systems, emissions hardware and, at the smaller end, battery electrification carrying a substantial price premium.
The bull case at 5.8% turns on Ukrainian reconstruction beginning at scale, which would represent the largest single earthmoving requirement in Europe for generations. The bear case at 3.4% is Chinese domestic demand staying weak while export capacity continues seeking volume, which compresses pricing globally and pulls realised value down even where unit shipments hold up perfectly well.

What Actually Governs Excavator Value

An excavator is bought on total cost of ownership, and contractors who forget that learn the lesson expensively. Purchase price is one term in an equation that also contains fuel burn, uptime, parts availability, dealer response and what the machine fetches at trade-in seven years later. Contractors who ignore the later terms pay for it.
TOP FIVE CONCENTRATION48%Share held by the five largest global excavator manufacturers
AVERAGE MACHINE PRICE$185,000Typical realised price for a standard weight class
AFTERMARKET REVENUE SHARE34%Portion of manufacturer revenue from parts and service
STEEL AND CASTING SHARE31% of COGSFabricated steel and castings as portion of machine cost
FLEET UTILISATION RATE58%Typical share of available hours a machine works
OWNERSHIP CYCLE LENGTH7 yearsTypical period before a contractor replaces a machine
That equation is where the current competitive argument sits. Chinese manufacturers arrive with machines priced well below Japanese and American equivalents, and for a contractor watching cash the appeal is obvious. What follows varies: parts availability and dealer coverage outside China remain thinner, and residual values at resale have consistently trailed established brands. Buyers who run machines hard and sell at seven years feel that difference clearly, while those who run to failure often do not.
The other defining feature of this business is the aftermarket. Parts and service supply roughly 34% of manufacturer revenue at margins well above the machines themselves, and it arrives whether or not anyone is buying new equipment. That is why dealer network depth is the asset the incumbents defend hardest, and why building one is the barrier every new entrant underestimates.
"Everybody is watching Chinese pricing and almost nobody is watching Chinese dealer networks, which is the wrong way round. Machines can be shipped anywhere in six weeks. A parts depot with trained technicians and inventory takes a decade, and that is what actually decides who keeps a customer."
Practice Director, Construction and Mining Equipment, Market Minds Advisory · MM

Market Trends

Battery Electric Compact Machines Enter Genuine Urban Work

Battery-powered mini excavators have moved past demonstration duty into paid work, driven by urban low-emission and low-noise zones across German, Dutch, Scandinavian and Swiss cities where diesel machines face restricted hours or outright exclusion. Indoor demolition and hospital site work add further demand where exhaust is simply unacceptable. Machines carry roughly 45% higher purchase prices than diesel equivalents, offset partly by lower running costs and by access to jobs competitors cannot bid. Duty cycle remains the constraint, since covering a full shift on battery power still demands careful planning and charging discipline.
Market Impact: Commits 8 years of spending
Machine Control Systems Become Standard Rather Than Optional

Satellite-guided grade control has moved from an expensive aftermarket addition to factory-fitted equipment across standard and large weight classes. The commercial argument is labour: a machine that hits design grade without a survey crew and without rework removes cost from every earthmoving job it touches, and contractors report material reductions in time to completion. Manufacturers now integrate the systems at build rather than leaving them to third parties, which captures revenue previously going elsewhere and locks the machine onto the manufacturer's telematics platform for the whole of its service life.
Market Impact: Takes 40% of new units

Market Opportunities and Growth Drivers

Committed Infrastructure Programmes Give Unusual Demand Visibility

North American federal infrastructure funding, Indian national highway and metro programmes, and Gulf development schemes all commit spending across multiple years rather than annual budgets, which lets contractors size their fleets against work they can genuinely see coming. That visibility is rare in construction equipment and it changes purchasing behaviour, encouraging fleet buying rather than project-by-project hire. Machine mix follows the work: highway and water infrastructure favours standard weight classes, while urban utility and distribution work pulls demand toward compact equipment considerably. Fleet buyers appreciate that visibility more than anyone.
Market Impact: Undercuts pricing by 25%

Rental Fleet Purchasing Reshapes What Manufacturers Must Build

Rental penetration has risen steadily across both North America and Western Europe, and rental companies now represent a very large share of new machine purchasing in both. They buy differently from contractors: serviceability, standardisation across a fleet, telematics integration and predictable residual value matter far more than headline specification or purchase price. Manufacturers who design around those requirements win volume orders covering hundreds of machines at once, while those optimising purely for owner-operator preferences find themselves outside the largest single buying channel in both regions, competing for the fragmented remainder instead.
Market Impact: Extends cycles by 18 months

Market Restraints and Challenges

Chinese Export Capacity Compresses Pricing In Every Market

Manufacturing capacity built against a Chinese domestic boom that ended is now seeking volume abroad, and it arrives at prices that reset buyer expectations wherever it lands. The root cause is straightforward overcapacity rather than any unfair practice. Commercially this compresses margins across every price-sensitive market, particularly Latin America, Africa and Eastern Europe. Participants are responding by competing on dealer coverage and parts availability rather than price, by emphasising residual values that Chinese machines have not yet matched, and by growing the aftermarket revenue that machine discounting cannot reach at all.
Market Impact: Costs 45% above diesel equivalent

Financing Costs Raise The Barrier To Fleet Replacement

Most excavators are financed rather than bought outright, so interest rates translate directly into monthly cost for the contractor making the decision. The root cause is that a machine is a capital asset with a seven year life and a six figure price, which makes it exactly the kind of purchase that gets deferred when borrowing is expensive. Commercially this stretches replacement cycles and shifts a good deal of demand toward used equipment instead. Participants are responding with captive finance subsidies, extended warranty packages and rental-to-purchase structures that lower the entry barrier considerably.
Market Impact: Cuts grading time 30%
3 additional market trends, 4 additional growth drivers, and 2 additional restraints and challenges are covered in the full report. Contact sales@marketmindsadvisory.com to access the complete intelligence.

Segment CAGR and Growth Architecture

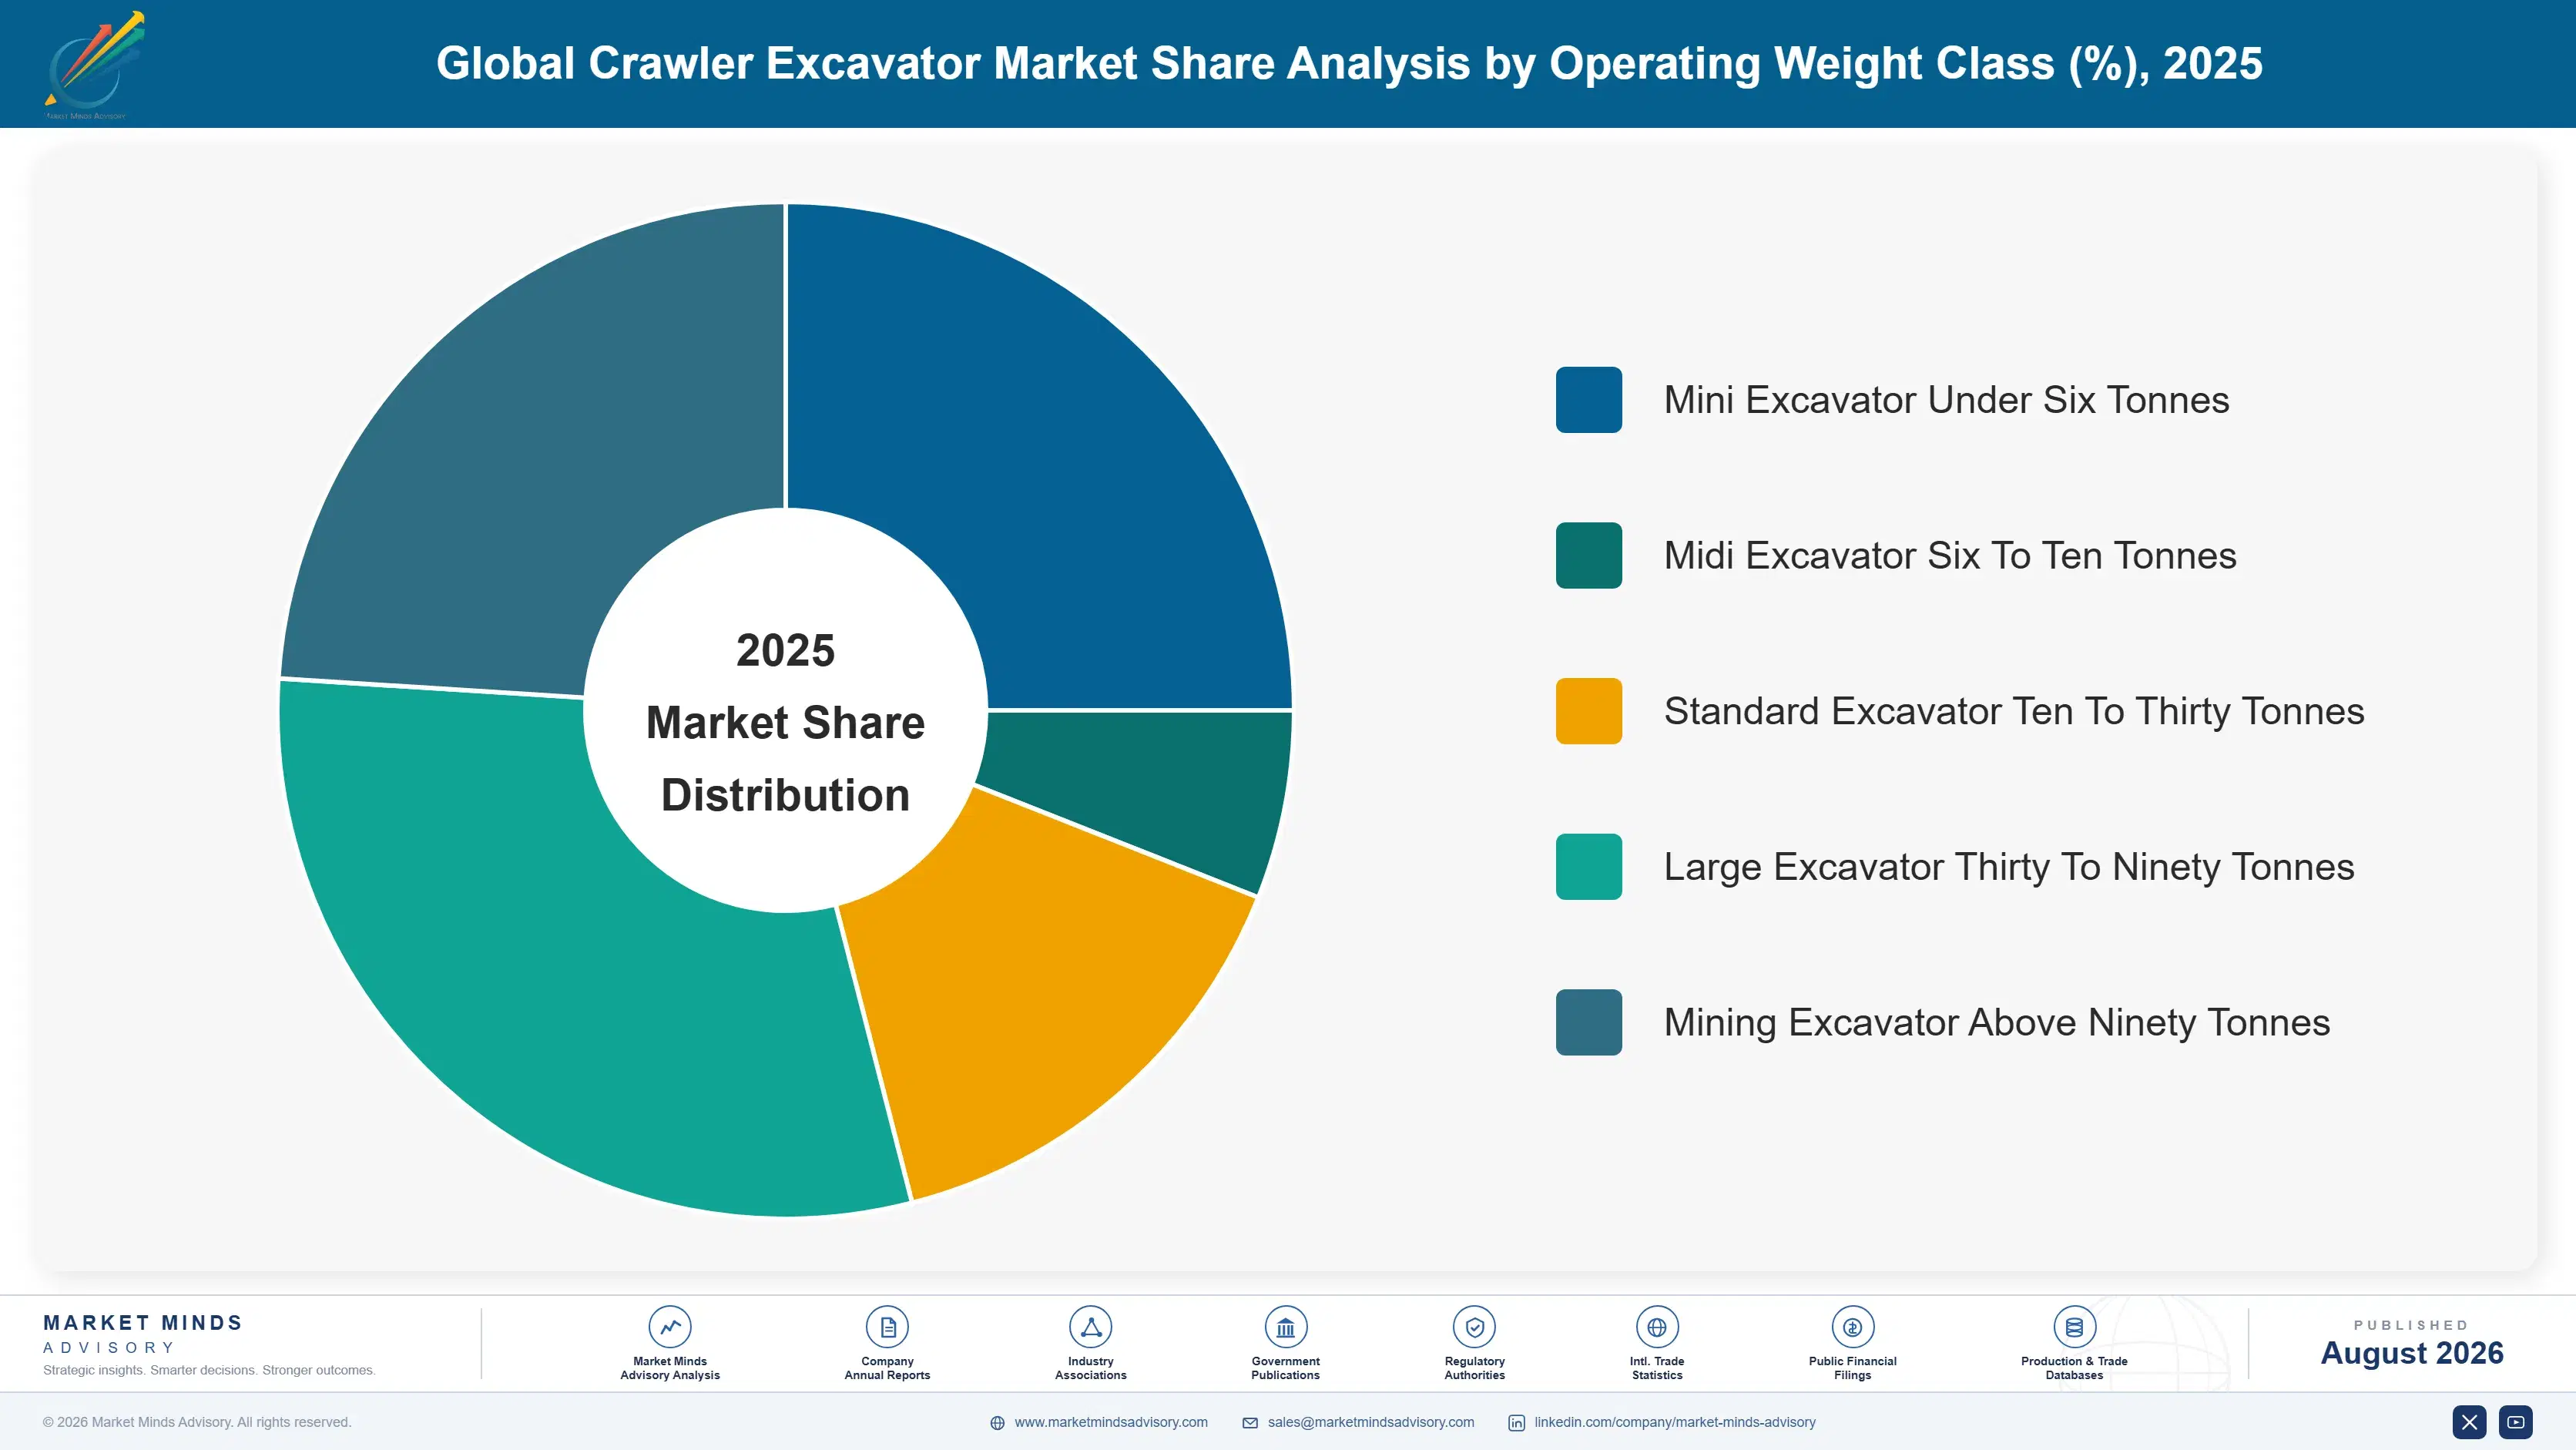
Segmentation follows operating weight class, because machine weight determines the work a unit can perform, the site it can access, the price it commands, the buyer purchasing it and the dealer relationship required to support it. Attachment choice, powertrain and control system content all sit downstream of weight class and are priced directly against it.
global-crawler-excavator-market-market-share-analysis-1787315869853

Mini Excavator Under Six Tonnes

The fastest segment at 6.9%, a full 1.50 times the market rate, covering tracked machines below six tonnes operating weight, generally with zero or reduced tail swing so they work against walls and inside confined sites. Access is what drives the growth. Urban utility installation, residential work, landscaping and interior demolition all present jobs where a standard machine physically cannot go, and contractors who once did that work by hand or with a skid steer now buy a mini excavator instead. The segment is also where battery electrification is arriving first, because duty cycles are short enough for a pack to cover a shift and urban emission rules bite hardest on exactly these sites.
CAGR 6.9%

Midi Excavator Six To Ten Tonnes

Growing at 5.6% on machines between six and ten tonnes, which occupy the useful middle ground between compact access and genuine digging capacity. Contractors buy them when a mini excavator runs out of reach or breakout force but a standard machine will not fit the site or the transport arrangement. Trailer weight limits matter more than most analysis acknowledges, since a machine a contractor can tow behind a truck without a specialist low-loader removes a real logistics cost from every job. Rental fleets buy heavily in this class for exactly that reason. What limits the segment is that its versatility also makes it the easiest class for competitors to enter credibly.
CAGR 5.6%
Full segment breakdown across 5 segments available in the complete report.

Regional Architecture and Country Demand Map

East Asia holds 38% of global value on Chinese domestic demand and manufacturing concentration together. North America follows on committed infrastructure programmes and the world's deepest rental fleet base, while growth runs fastest across South Asia and Pacific on infrastructure programme execution and mining capital spending.

East Asia

Note: East Asia holds 38% against a 22 to 30% band because China alone accounts for the largest single national excavator market and the largest manufacturing base by a wide margin. Sany, XCMG, Zoomlion and LiuGong between them build enormous volume, and when domestic Chinese demand fell after 2021 that capacity turned outward and reshaped pricing in every export market it reached. Japanese manufacturers occupy the opposite position, with Komatsu, Hitachi, Kobelco and Kubota competing on reliability, resale value and dealer support rather than delivered price. Korean output through Doosan Bobcat and Hyundai serves both domestic and export demand substantially. Export volume rather than domestic demand now sets the tone across the region, and that reversal has been abrupt.
Share: 38% | CAGR: 5.8% (2026 to 2036)

North America

Federal infrastructure funding defines this region's demand more than any commercial cycle does. Programme spending on roads, bridges, water systems and grid work has committed multi-year volumes that contractors buy machines against, and rental fleets carry an unusually large share of that purchasing. Rental penetration here is the highest anywhere, which changes what manufacturers actually sell: fleet buyers specify serviceability, resale value and telematics rather than the lowest purchase price. Emissions compliance under Tier 4 Final is settled and no longer a differentiator. Mini excavators have grown fastest, driven by residential work, utility installation and landscaping contractors trading up from skid steers. Rental buying criteria increasingly define what manufacturers actually build for this market.
Share: 22% | CAGR: 4.1% (2026 to 2036)
Regional intelligence for 5 additional markets available in the complete report: Western Europe, South Asia and Pacific, Latin America, Middle East and Africa, Eastern Europe. Contact sales@marketmindsadvisory.com.
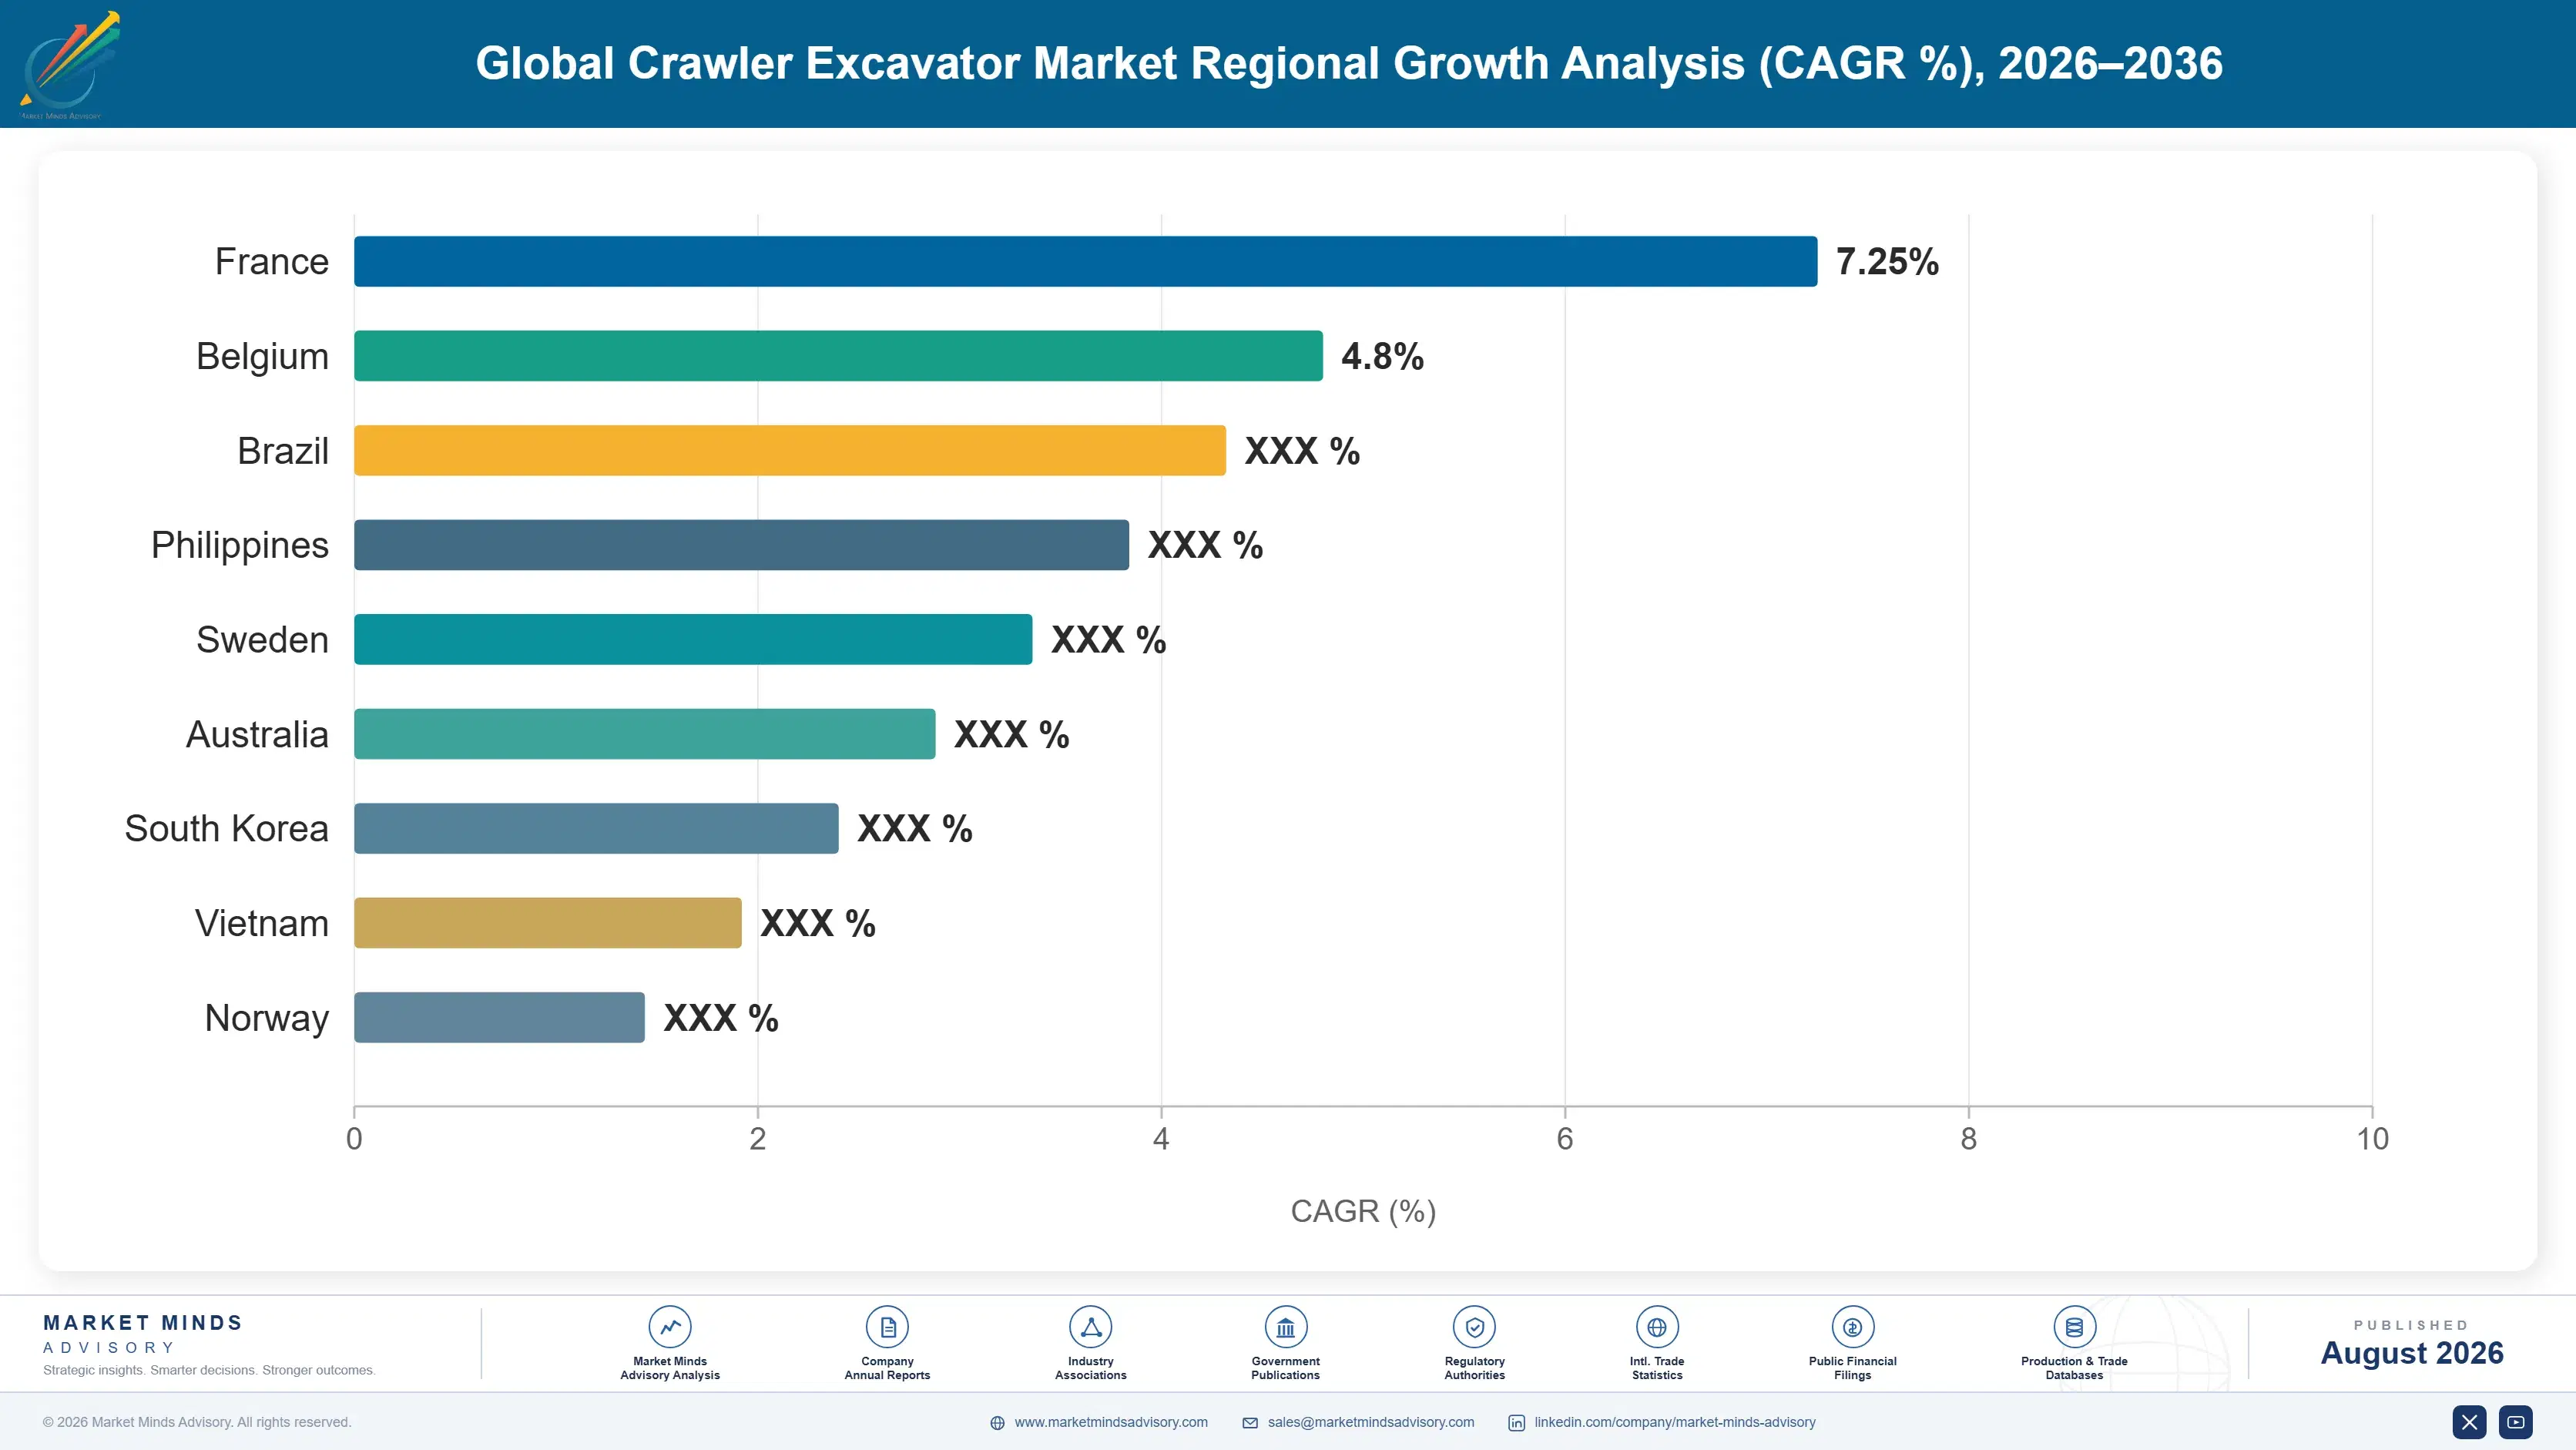
global-crawler-excavator-market-country-cagr-analysis-1787315870370

Where Excavator Margin Is Actually Won

Four positions separate manufacturers holding value against Chinese price pressure from those competing on acquisition cost they cannot win: growing the parts and service annuity behind the installed base, defending residual values that discounting destroys, designing deliberately around rental fleet requirements, and integrating machine control at the factory rather than leaving that revenue to third-party specialists.

Grow The Parts And Service Annuity Behind Machines

Aftermarket supplies roughly 34% of manufacturer revenue at gross margins running 18 to 26 points above new machine sales, and it arrives regardless of whether anybody is buying equipment this year. Every machine sold generates undercarriage, hydraulic, filtration and wear part demand across a seven year life, and manufacturers capturing that flow through certified dealers earn considerably more from a machine after delivery than they ever did at it. Discounting a machine to win the sale is therefore defensible, precisely because the annuity sitting behind it is where the money actually lives.
Market Impact: Earns 26 points above the new machi

Defend Residual Values That Discounting Quietly Destroys

A contractor financing a machine across seven years cares about monthly cost, and residual value drives that figure just as directly as purchase price does. Brands holding resale values 20% to 30% above discount competitors deliver lower total ownership cost even at higher list prices, and rental groups calculating fleet economics across hundreds of units understand this considerably better than owner-operators do. Heavy discounting to defend share destroys exactly this asset, which is exactly why the manufacturers holding the strongest positions discount reluctantly and argue total cost of ownership instead.
Market Impact: Holds resale values 30% above disco

Design Deliberately Around Rental Fleet Requirements

Rental companies now purchase roughly 40% of all new machines sold across North America and Western Europe, and they buy on serviceability, fleet standardisation, telematics integration and predictable residual value rather than on headline specification or delivered price. Manufacturers designing deliberately around those criteria win orders covering hundreds of units at once, and they secure 15% to 22% higher volume per commercial relationship. Those optimising purely for owner-operator preferences find themselves sitting outside the single largest buying channel across both of those regions, competing hard for whatever fragmented remainder is left over.
Market Impact: Secures 22% higher volume per comme

Integrate Machine Control Rather Than Leaving It Aftermarket

Satellite grade control has become standard equipment across the standard and large weight classes, and factory integration now captures revenue that previously went entirely to third-party specialists. It also locks that machine onto the manufacturer's own telematics platform for the whole of its service life, which then supports parts sales, service scheduling and eventually the trade-in conversation as well. Integrated systems realise 12% to 18% more revenue per machine than the equivalent base configuration does, and the software content behind them carries margins that heavy steel fabrication has never once approached.
Market Impact: Realises 18% more revenue on every

Who Controls the Margin Pool

Concentration sits at 48% for the top five measured on unit shipment volume, the basis used throughout this section. Caterpillar and Komatsu lead globally on dealer network depth, aftermarket capture and residual values that no entrant has replicated, while Sany and XCMG hold enormous domestic volume plus rising export share and Hitachi competes across construction and mining classes. The gap to the next tier is moderate in units and considerably wider in aftermarket revenue.
Competitive activity runs on three fronts. Dealer network expansion is the first, and it is where Chinese manufacturers are spending hardest because it is the barrier they have not yet cleared. Machine control integration is the second, moving revenue from third-party specialists onto the manufacturer's own platform. The third is compact machine development, where growth is fastest and rental fleets buy in volume rather than individually.

Pressure comes almost entirely from Chinese export capacity seeking volume that domestic demand no longer absorbs, and it is severe on price but much weaker on parts and service. Rankings will shift only when a Chinese manufacturer builds dealer and parts infrastructure comparable to the incumbents, which is a decade of work rather than a pricing decision anybody can take.
global-crawler-excavator-market-company-positioning-matrix-1787315870890

Competitive Moat and Risk Dimensions

CATERPILLAR

Moat: Dealer network and aftermarket depth

An independent dealer network with parts depots, trained technicians and inventory positioned close to customers delivers uptime that no direct sales model matches, and it captures the aftermarket revenue that makes the machine profitable long after delivery. Building comparable coverage takes a decade and enormous working capital, which is the barrier every entrant underestimates badly.
CATERPILLAR

Risk: Premium pricing under sustained pressure

Chinese machines arriving 25% below list price make the total cost argument harder to sustain with contractors focused on immediate cash rather than seven year economics. Holding price protects residual values and dealer margins but concedes volume in price-sensitive markets, and that trade-off gets more uncomfortable the longer Chinese overcapacity persists.
KOMATSU

Moat: Machine control and autonomy leadership

Early and sustained investment in integrated grade control and semi-autonomous operation puts capability into the machine that contractors increasingly specify rather than treat as optional, and the telematics platform behind it supports parts, service and trade-in relationships across the whole ownership period. Mining autonomy experience feeds directly back into construction products.
KOMATSU

Risk: Exposure to Asian pricing pressure

Substantial revenue exposure to Asian markets where Chinese competitors are strongest means pricing pressure lands harder here than on manufacturers weighted toward North America. Currency movements amplify the effect in both directions, and defending share in those markets risks the premium positioning that supports pricing everywhere else.

Players Tracked

Prominent Players

Caterpillar
Komatsu
Sany Heavy Industry
XCMG
Hitachi Construction Machinery

Other Key Players

Volvo Construction Equipment
Kobelco Construction Machinery
Doosan Bobcat
Hyundai Construction Equipment
Liebherr
JCB
Kubota
Yanmar
Zoomlion
Takeuchi
LiuGong
Case Construction Equipment
Wacker Neuson
Sumitomo Construction Machinery
Tata Hitachi

Recent Developments

FEBRUARY 2025

Battery electric mini excavator range enters series production

A manufacturer moved its battery-powered mini excavator range from limited build volumes into full series production during the year, targeting the urban low-emission and low-noise zones across Northern Europe where diesel machines are now facing restricted operating hours or complete exclusion from certain municipal and hospital sites entirely.
Signal: Battery compact machines have moved past d
JUNE 2025

Chinese manufacturer opens European parts distribution centre

A leading Chinese excavator manufacturer commissioned a European parts distribution centre alongside a dedicated technician training facility during the year, directly addressing the aftermarket coverage gap which has repeatedly limited its ability to convert genuinely competitive machine pricing into durable customer relationships across the whole region.
Signal: Chinese manufacturers are now attacking th
OCTOBER 2025

Rental group orders standardised fleet across weight classes

A major European equipment rental group placed a multi-hundred unit standing order standardised across several adjacent weight classes from a single manufacturer, selecting on serviceability, telematics integration and predictable residual value rather than on delivered machine price at all, which is now increasingly typical of that channel.
Signal: Rental fleet criteria rather than owner-op

What Drives Excavator Build Cost

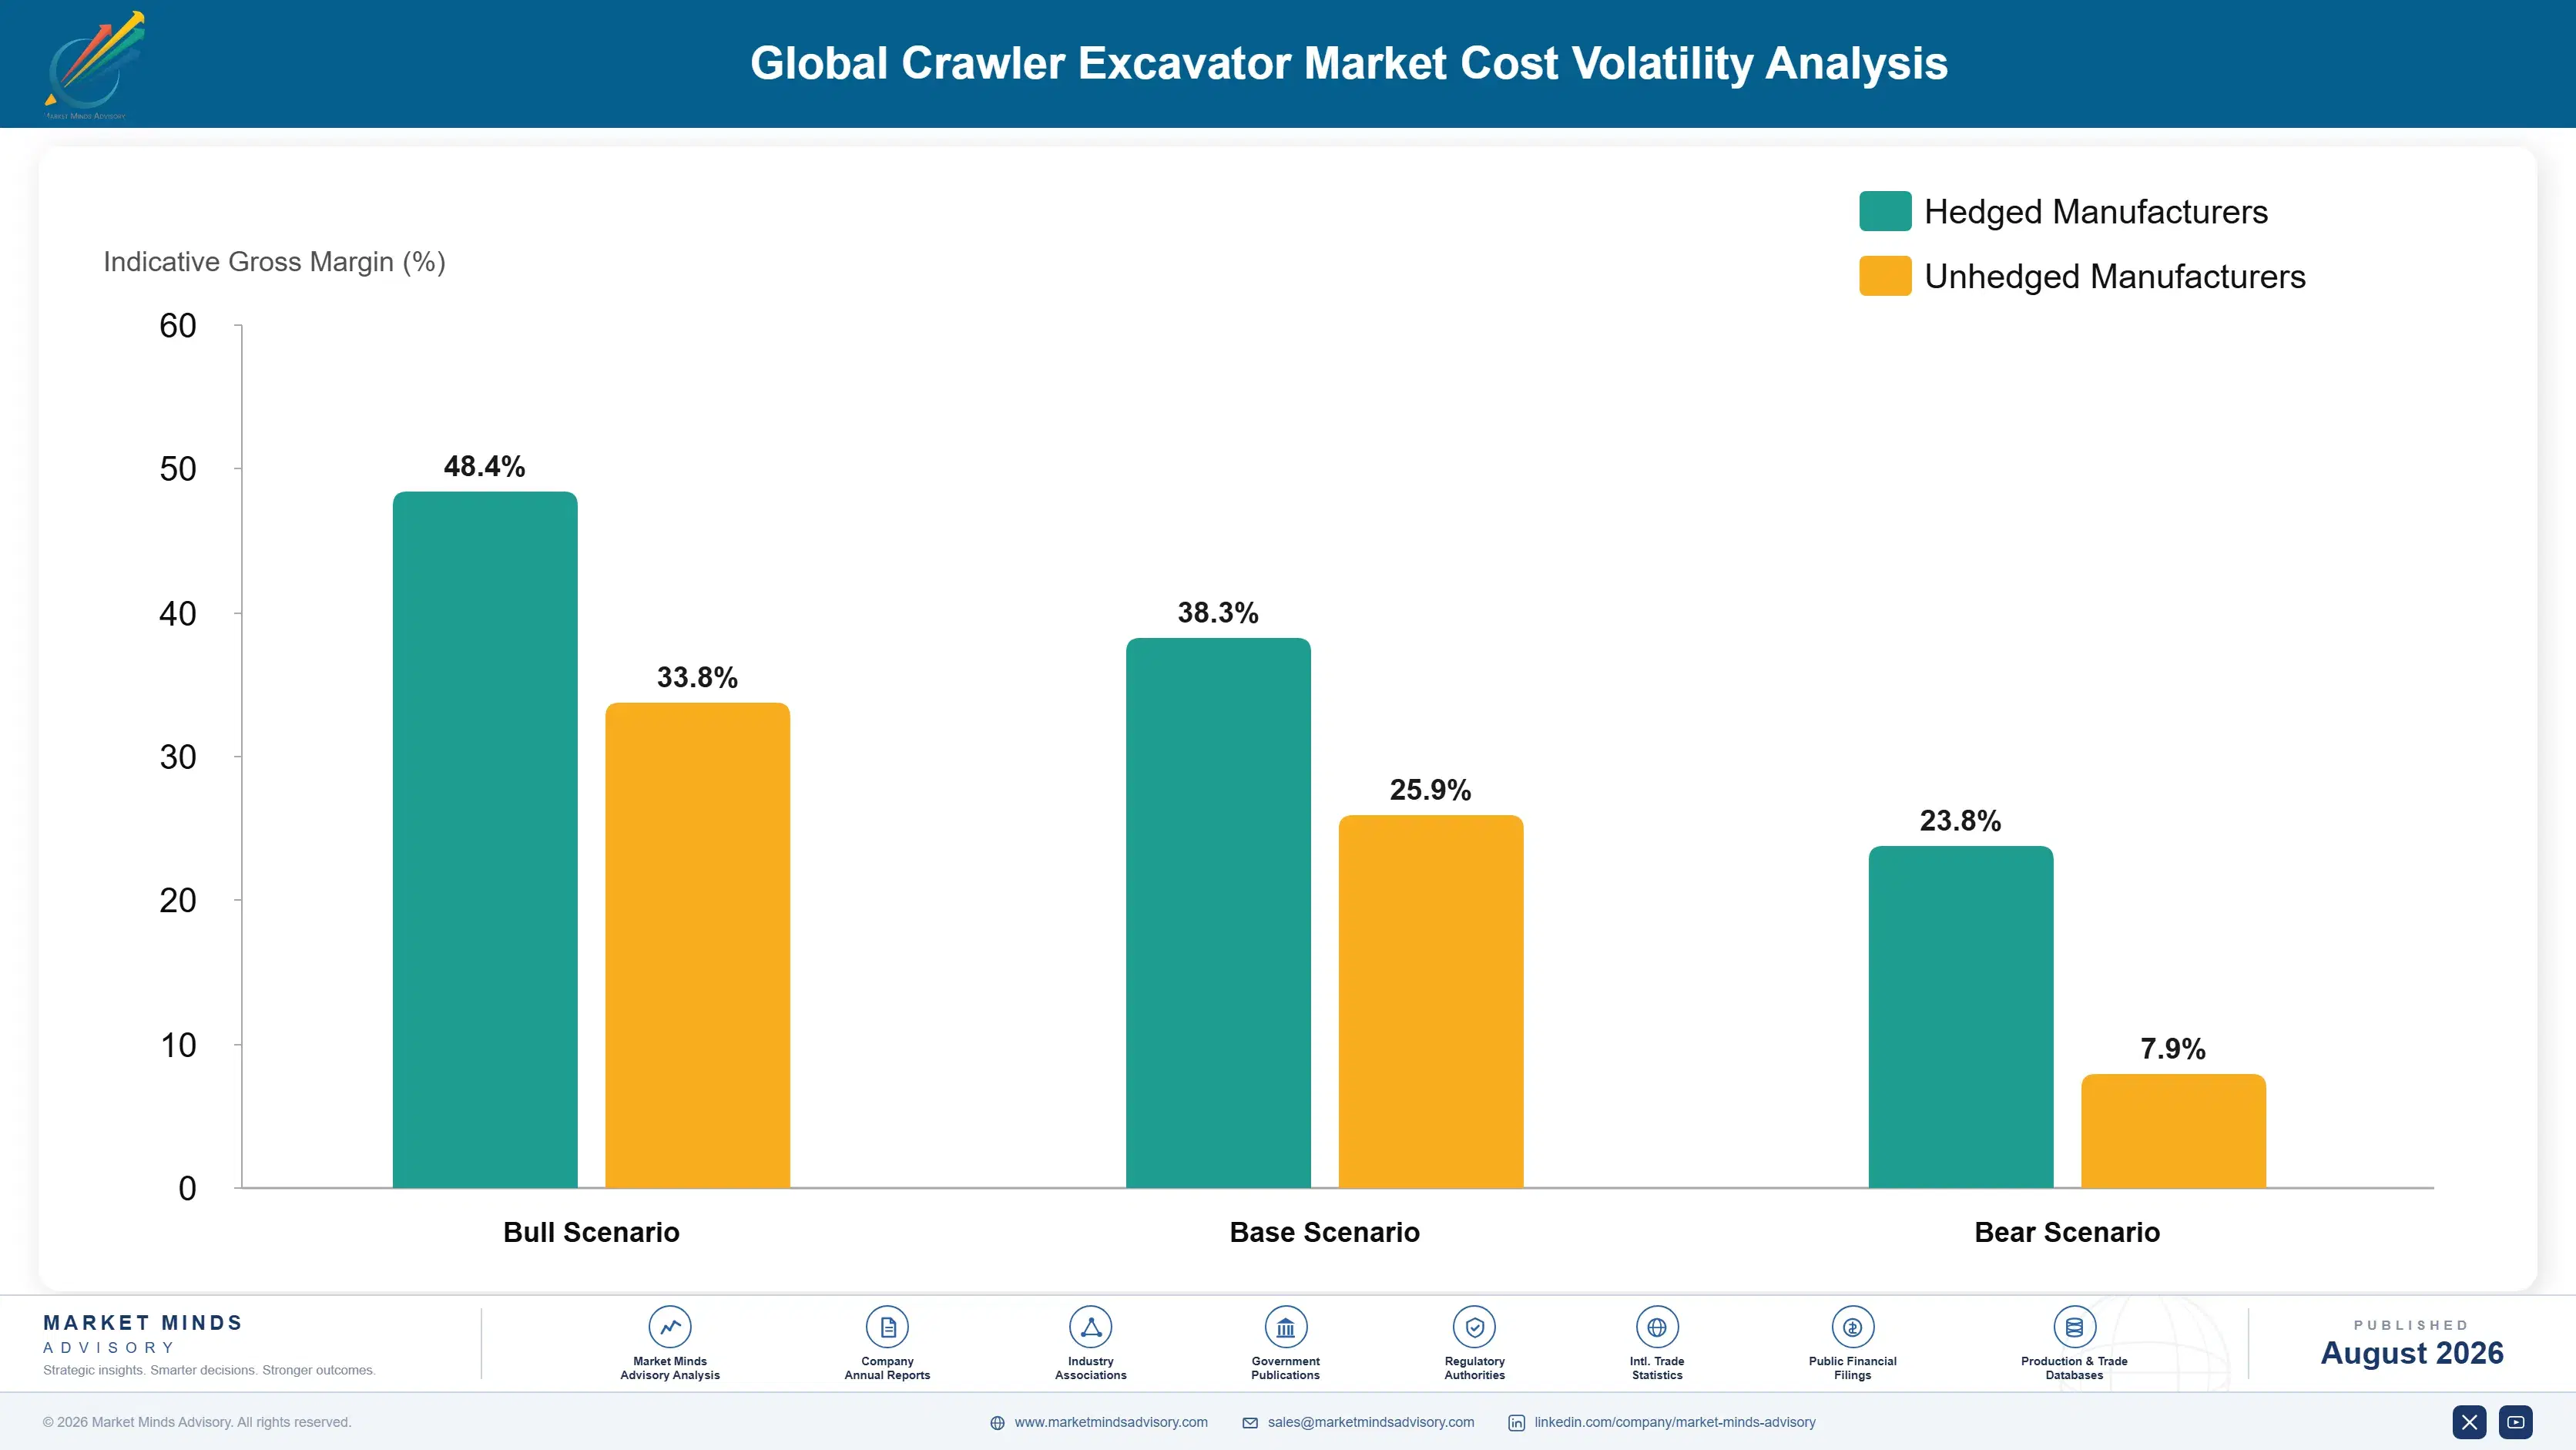
Fabricated steel and castings account for roughly 31% of machine cost, covering the boom, arm, upper frame and counterweight, and sourcing is regional because freight on heavy fabrications is punishing. Hydraulic pumps, motors, valves and cylinders add around 18%, concentrated among a small group of Japanese and European suppliers. The engine and emissions aftertreatment contribute roughly 14%, the undercarriage 11%, and electronics with control systems a further 9%.
Steel pricing moved sharply through 2021 and 2022 on demand recovery and energy costs, and again during 2025 as tariff measures reshaped regional trade flows and raised North American plate costs specifically. Caterpillar Annual Report 2025 and Komatsu Annual Report 2025 both identify material and freight cost as continuing margin factors rather than resolved issues, and pass-through on machines already quoted into multi-year fleet agreements remains the difficult part.

The disadvantage mechanism is hydraulic component dependence rather than steel. A small group of suppliers dominates high-pressure pumps and valves, and manufacturers without internal capability negotiate from a weak position and wait in allocation queues when demand spikes. Exposure also varies geographically: Chinese manufacturers have built domestic hydraulic capability specifically to remove that dependence, and it now contributes materially to their cost position.
global-crawler-excavator-market-cost-volatility-analysis-1787315871088

Develop internal hydraulic component capability progressively

Bringing high-pressure pump and valve manufacturing in house removes the dependence on a concentrated supplier group and captures margin currently sitting outside the business entirely. The investment is substantial and takes years to reach quality parity, which is exactly why so few manufacturers have attempted it. Those that have now hold a cost and availability position competitors cannot match.

Index multi-year fleet agreements to published steel benchmarks

Rental fleet agreements covering several years and hundreds of machines carry real steel exposure if written at fixed prices. Indexing to published plate and casting benchmarks moves that volatility onto a formula both parties can verify. Rental groups resist because it complicates their own fleet economics, but on agreements of this length the alternative is absorbing swings nobody could forecast.

Standardise frame fabrications across adjacent weight classes

Common frame sections, boom profiles and casting patterns shared across adjacent weight classes concentrate steel purchasing, cut tooling investment and simplify the spare parts inventory dealers must carry. The constraint is that each machine is then slightly less optimised for its class. On a cost base where steel is nearly a third of the total, that compromise is worth accepting.

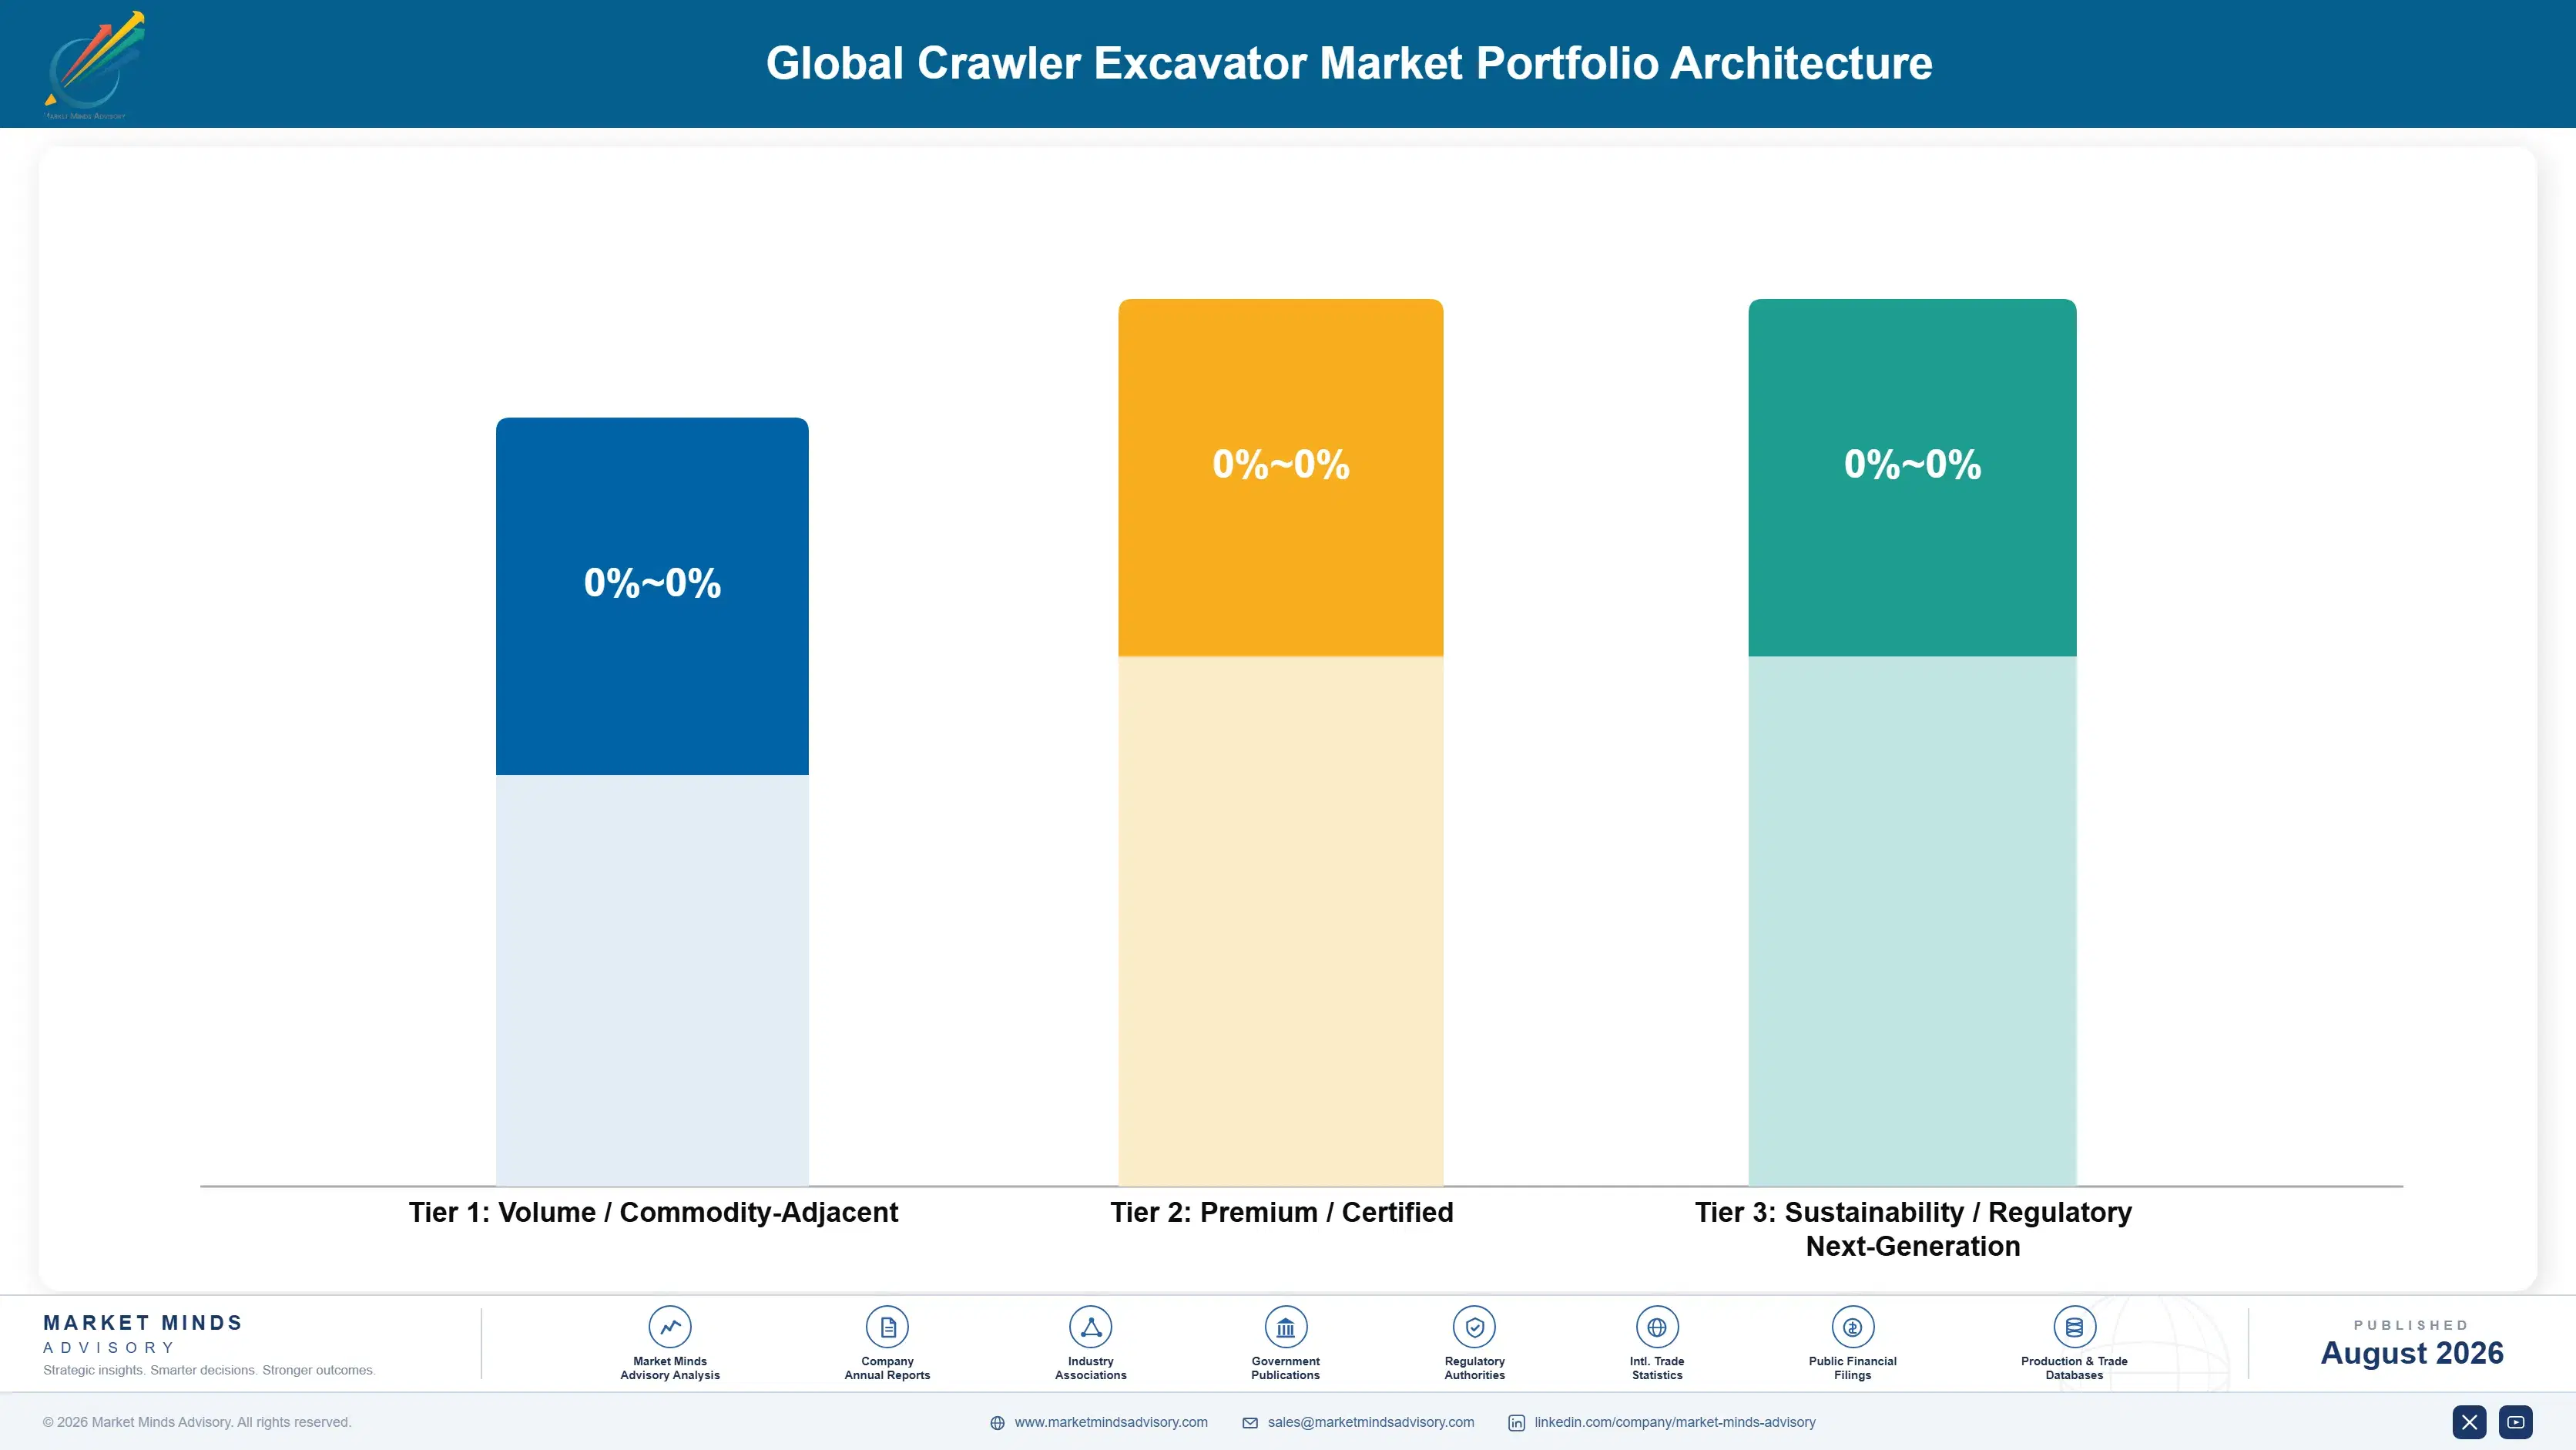
Portfolio Architecture for Margin Defence

Portfolio economics here divide on channel and content rather than on machine size. New machine sales into competitive tenders, particularly in price-sensitive export markets where Chinese competition is strongest, earn gross margins in the mid teens because acquisition cost is the only term the buyer weighs and several credible manufacturers quote comparable specification against each other.
The premium tier is machines sold with integrated control systems and extended service agreements through certified dealers. Grade control, telematics and structured maintenance packages together raise realised value substantially, and the buyer is purchasing productivity and uptime rather than a machine, which changes the pricing conversation entirely. Margins run in the high twenties. Dealer capability decides where in that range a manufacturer actually lands.

Above both sits the aftermarket, and it is where this industry actually makes its money. Parts, service, undercarriage and rebuild work supply roughly 34% of manufacturer revenue at gross margins 18 to 26 points above new machine sales, arriving across a seven year ownership life regardless of whether anybody is buying equipment that year. Margins reach the low forties, and dealer network depth rather than manufacturing capability is what determines who captures it.

Volume / Commodity-Adjacent

New machine sales into competitive tenders in price-sensitive export markets. Acquisition cost is the only term the buyer weighs, several manufacturers quote comparable specification, and Chinese competition holds pricing near the floor.
Gross Margin: 13 to 19%

Premium / Certified

Machines sold with integrated grade control, telematics and structured service agreements through certified dealers. The range reflects how much control and service content each configuration actually carries into the transaction.
Gross Margin: 25 to 32%

Sustainability / Regulatory / Next-Generation

Parts, service, undercarriage and rebuild work across the ownership life, plus battery electric compact machines. The wide range spans routine filtration and wear part sales through to full component rebuild programmes.
Gross Margin: 38 to 46%
global-crawler-excavator-market-portfolio-architecture-1787315871588

High-value Sub-segments and Strategic Watch-out

Parts And Service Aftermarket Revenue

High value and steady growth sitting together. Every machine sold generates undercarriage, hydraulic, filtration and wear part demand across a full seven years at margins well above the equipment itself, and the revenue arrives whether or not anybody is buying a single new machine that year.
Gross Margin: 38 to 46%

Battery Electric Compact Machines

High value running on genuinely rapid growth. Urban low-emission and low-noise zones create work that diesel machines cannot legally perform, purchase prices run a long way above diesel equivalents, and the competitive field remains genuinely thin for as long as duty cycle engineering stays this difficult.
Gross Margin: 31 to 39%

Standard Weight Class Machine Sales

The volume core that keeps factories loaded and seeds the aftermarket annuity sitting behind every unit delivered. Margins sit only moderate here because the competition is genuinely intense, but no manufacturer ever reaches the far more profitable parts business without first winning the machine sale itself.
Gross Margin: 18 to 25%

Price-Led Export Market Sales

The strategic watch-out sitting in this portfolio. Volume is available in Latin America, Africa and Eastern Europe, but Chinese competitors set the price, dealer support is thin enough that aftermarket capture is poor, and the discounting required damages residual values in every other market as well.
Gross Margin: 13 to 19%

How Excavator Demand Repeats

The annuity in this industry is the machine population rather than machine sales. Every unit delivered generates undercarriage replacement, hydraulic service, filtration, wear parts and eventually component rebuild across a seven year ownership life, at margins well above the equipment itself. That is why manufacturers accept thin machine margins to win a sale, and why losing a unit costs considerably more than the transaction value suggests it should.
Stickiness varies sharply by buyer type. Large rental groups are the stickiest, because fleet standardisation, technician training and telematics integration all raise the cost of adding a second brand well beyond any price advantage. Mining operators sit close behind, since machine availability is worth more than any purchase saving when a haul cycle stops. Owner-operators are moderately loyal, generally to a dealer rather than a manufacturer. Price-led export buyers show almost no loyalty at all.

The buyer profile has shifted generationally. Purchasing once sat with owner-operators choosing on feel, dealer relationship and reputation. Today it sits increasingly with rental fleet managers and contractor asset teams running spreadsheets on cost per hour, residual value and utilisation, which rewards manufacturers who can supply the data rather than those who rely on the relationship.
global-crawler-excavator-market-end-use-penetration-index-1787315872076

Where To Compete And Why

These are among the four positions where our research anticipates prominent divergence between winners and laggards over the coming forecast period. Each is grounded in the demand model, the regulatory perimeter, and the announced capacity pipeline.
01 / AFTERMARKET ANNUITY GROWTH

The machine is the entry fee not the business

Parts and service supply roughly 34% of manufacturer revenue at gross margins 18 to 26 points above new machine sales, and that revenue arrives across a seven year ownership life regardless of what equipment demand is doing. Every unit delivered generates undercarriage, hydraulic, filtration and wear part demand that machine discounting cannot reach at all. Accepting thin machine margins to win the sale is therefore rational rather than desperate, provided the dealer network behind it actually captures everything that follows delivery.
02 / RESIDUAL VALUE DEFENCE

Discounting destroys the asset it defends

Contractors financing machines over seven years weigh monthly cost, and residual value drives that as directly as purchase price does. Brands holding resale values 20% to 30% above discount competitors deliver lower total ownership cost even at higher list prices, and rental fleets understand that arithmetic better than owner-operators. Heavy discounting to protect market share erodes precisely the asset that justified the premium in the first place, which is why the strongest positions discount reluctantly and argue total cost instead.
03 / RENTAL CHANNEL DESIGN

Build what fleet managers actually specify

Rental companies purchase roughly 40% of new machines across North America and Europe, and they buy on serviceability, fleet standardisation, telematics integration and predictable residual value rather than on headline specification or price. Manufacturers designing deliberately around those criteria win orders covering hundreds of units at once and secure 15% to 22% higher volume per commercial relationship. Those optimising purely for owner-operator preferences end up outside the largest single buying channel entirely, competing hard for whatever fragmented remainder is left.
04 / CONTROL SYSTEM INTEGRATION

Factory fitting captures what aftermarket loses

Satellite grade control is now standard equipment across standard and large weight classes, and integrating it at build captures revenue that previously flowed entirely to third-party specialists. It also locks the machine onto the manufacturer's telematics platform for its whole life, which then supports parts sales, service scheduling and eventually the trade-in conversation itself. Integrated configurations realise 12% to 18% more per machine sold, and the software content behind them carries margins that heavy steel fabrication has simply never approached.

Engagement Snapshot From the Field

A live engagement with an industry participant carrying material or product regulatory and market exposure ahead of a defining policy shift, showing how our research translates into a defensible multi-year portfolio strategy.
MARKET MINDS ADVISORY · CLIENT ENGAGEMENT SUMMARY
Global Crawler Excavator Producer Strategic Portfolio Review and Transition Roadmap 2026·Investment Scenario on Global Crawler Excavator Exposure Evaluation 2025-26
CLIENT PROFILE
A construction equipment manufacturer with annual revenue near $1.4 billion (client-reported, unverified by MMA), roughly 79% of it from new machine sales across standard and large weight classes in European and Middle Eastern markets. The business held credible engineering and a reasonable dealer footprint but captured well below the industry average in aftermarket revenue, and Chinese competitors had taken visible share in its export markets during the previous three years.
STRATEGIC CHALLENGE
Machine margins had compressed to the low teens as Chinese pricing reset buyer expectations across the Middle East and Eastern Europe, and the client had been discounting to hold volume. Management needed to decide whether to match pricing and defend share, invest in dealer parts infrastructure to capture aftermarket revenue, or withdraw from price-led export markets entirely and concentrate on Western Europe.
MMA APPROACH
MMA modelled machine population and aftermarket capture rates across the client's installed base by market, benchmarked dealer parts inventory and technician coverage against the two market leaders, and assessed residual value trajectories on discounted versus list-priced units. Twenty-four expert interviews with dealers, rental fleet managers and contractor asset teams tested where purchasing decisions were genuinely made.
KEY FINDINGS
  1. Aftermarket capture on the client's installed base ran roughly 19% of potential parts demand against a leader benchmark above 60%, representing revenue the business was simply not collecting.
  2. Discounted export sales showed residual values falling roughly 22% below list-priced equivalents at four years, which was actively damaging the total cost argument the sales force used elsewhere.
  3. Rental groups across Western Europe had excluded the client from tenders on telematics integration gaps rather than on price or machine capability, which was a fixable software problem rather than an engineering one.
  4. Withdrawing from price-led export markets would have removed roughly 14% of revenue but under 4% of gross profit, making the exit far less painful than the revenue figure suggested.
CLIENT PROFILE
A construction equipment manufacturer with annual revenue near $1.4 billion (client-reported, unverified by MMA), roughly 79% of it from new machine sales across standard and large weight classes in European and Middle Eastern markets. The business held credible engineering and a reasonable dealer footprint but captured well below the industry average in aftermarket revenue, and Chinese competitors had taken visible share in its export markets during the previous three years.
STRATEGIC CHALLENGE
Machine margins had compressed to the low teens as Chinese pricing reset buyer expectations across the Middle East and Eastern Europe, and the client had been discounting to hold volume. Management needed to decide whether to match pricing and defend share, invest in dealer parts infrastructure to capture aftermarket revenue, or withdraw from price-led export markets entirely and concentrate on Western Europe.
MMA APPROACH
MMA modelled machine population and aftermarket capture rates across the client's installed base by market, benchmarked dealer parts inventory and technician coverage against the two market leaders, and assessed residual value trajectories on discounted versus list-priced units. Twenty-four expert interviews with dealers, rental fleet managers and contractor asset teams tested where purchasing decisions were genuinely made.
KEY FINDINGS
  1. Aftermarket capture on the client's installed base ran roughly 19% of potential parts demand against a leader benchmark above 60%, representing revenue the business was simply not collecting.
  2. Discounted export sales showed residual values falling roughly 22% below list-priced equivalents at four years, which was actively damaging the total cost argument the sales force used elsewhere.
  3. Rental groups across Western Europe had excluded the client from tenders on telematics integration gaps rather than on price or machine capability, which was a fixable software problem rather than an engineering one.
  4. Withdrawing from price-led export markets would have removed roughly 14% of revenue but under 4% of gross profit, making the exit far less painful than the revenue figure suggested.
RECOMMENDED STRATEGY
Phase 1: Phase one: invest in dealer parts inventory and technician training across the existing installed base, targeting aftermarket capture rather than any new machine volume. Phase 2: Phase two: close the telematics integration gap that had been excluding the business from Western European rental fleet tenders entirely. Phase 3: Phase three: withdraw progressively from price-led export markets where discounting damages residual values without generating any aftermarket revenue behind it.
OUTCOME
The client lifted aftermarket capture to roughly 34% of potential parts demand within eighteen months and reported incremental service revenue of $71 million (client-reported, unverified by MMA). Blended gross margin improved by roughly five points, two Western European rental tenders were won after the telematics work completed, and export withdrawal is proceeding on a phased schedule.

Frequently Asked Questions

Foundational context covering the market sizes, CAGR, scope, country, region and competition that inform every finding below. This section is provided to cover basics and most often pre-purchase conversations, answered from the MMA Primary Research Dataset.

What is the current size of the Global Crawler Excavator Market?

The global crawler excavator market was valued at $46.00 billion in 2025, reaching an estimated $48.12 billion in 2026. That covers tracked hydraulic excavators across mini, midi, standard, large and mining weight classes.

How large will the Global Crawler Excavator Market be by 2036?

MMA forecasts the market reaching $75.44 billion by 2036, an increase of $27.32 billion over the 2026 base. That represents an expansion multiple of 1.57 times across the forecast period.

What is the CAGR for the Global Crawler Excavator Market 2026 to 2036?

The base case compound annual growth rate is 4.6%, with a bull case of 5.8% and a bear case of 3.4%. Historical growth between 2020 and 2025 ran at 3.6% annually.

Which segment is growing fastest?

Mini excavators under six tonnes grow at 6.9%, a full 1.50 times the market rate, on urban access and utility work. Midi excavators between six and ten tonnes follow at 5.6% annually.

Who are the major companies in the Global Crawler Excavator Market?

Caterpillar, Komatsu, Sany Heavy Industry, XCMG and Hitachi Construction Machinery lead on unit shipment volume. Together they account for roughly 48% of global shipments across all weight classes.

Which country is growing fastest?

India grows fastest at 7.4% annually, driven by national highway, metro and water infrastructure programmes plus expanding domestic manufacturing. Saudi Arabia and Vietnam follow on development and mining spending.

Report Segmentation Architecture

The full report scope spans multiple orthogonal segmentation dimensions, with cross-tabulated demand data provided for each dimension pair. Coverage extends further to regional breakdowns, trend trajectories, and the competitive detail needed to support segment-level decision-making.

By Operating Weight Class

  • Mini Excavator Under Six Tonnes
  • Midi Excavator Six To Ten Tonnes
  • Standard Excavator Ten To Thirty Tonnes
  • Large Excavator Thirty To Ninety Tonnes
  • Mining Excavator Above Ninety Tonnes

By End-Use Industry

  • General Construction and Building
  • Road and Highway Infrastructure
  • Mining and Quarrying
  • Utility and Pipeline Installation
  • Demolition and Recycling
  • Forestry and Agriculture

By Commercial Dimension

  • Independent Dealer Network Sales
  • Equipment Rental Fleet Supply
  • Direct Sales to Major Contractors
  • Certified Used and Rebuild Programmes
  • Parts and Service Aftermarket Channel

By Region

  • North America
  • Western Europe
  • East Asia
  • South Asia and Pacific
  • Latin America
  • Middle East and Africa
  • Eastern Europe

Scope, Methodology, and Coverage

Every figure in this report is reproducible from documented input assumptions. The scope below maps the historical period, the forecast horizon, the segmentation dimensions, and the countries covered, alongside the underlying primary and qualitative methodology.
Historical Period
2020 to 2025
Forecast Period
2026 to 2036
Base Year
2025 (USD billions; MMA Primary Research Dataset, August 2026)
Market Definition
This report covers tracked hydraulic crawler excavators across mini, midi, standard, large and mining weight classes, sold into general construction, road and highway infrastructure, mining and quarrying, utility installation, demolition and forestry applications worldwide. Wheeled excavators, backhoe loaders, skid steer and compact track loaders, wheel loaders, bulldozers, draglines, walking excavators, attachments sold separately and equipment rental operating service revenue are all excluded from the sizing.
Quantitative Units
USD billions at manufacturer realised value; unit shipments in thousands; average realised price in USD per machine.
Segmentation Dimensions
By operating weight class; by end-use industry; by commercial dimension; by region.
Regions Covered
North America, Western Europe, East Asia, South Asia and Pacific, Latin America, Middle East and Africa, Eastern Europe
Countries Covered
United States, Canada, Mexico, United Kingdom, Germany, France, Italy, Spain, Sweden, Japan, South Korea, China, India, Indonesia, Australia, Brazil, Chile, Saudi Arabia, South Africa, Poland.
Key Companies Profiled
Caterpillar, Komatsu, Sany Heavy Industry, XCMG, Hitachi Construction Machinery, Volvo Construction Equipment, Kobelco, Doosan Bobcat, Hyundai Construction Equipment, Liebherr, JCB, Kubota, Zoomlion, LiuGong and others.
Quantitative Methodology
Primary survey, n=3,800 respondents, Q4 2025, six countries; demand-side model with trade association cross-validation
Qualitative Methodology
47 expert interviews, Q4 2025; applied to validate demand model assumptions, identify emerging dynamics, and assess competitive positioning
Report Format
PDF and XLSX data workbook (Word format preview document)
Publisher
Market Minds Advisory
Report Code
MMA-2026-CON-935
Published
August 2026
Contact
sales@marketmindsadvisory.com | www.marketmindsadvisory.com

Purchase the full Global Crawler Excavator Market Report (2026 to 2036).

The full report sizes the global crawler excavator market across five weight classes, six end-use industries and seven regions, with unit shipment and realised pricing detail behind every value estimate. It profiles twenty global manufacturers on dealer network depth, aftermarket capture rates and machine control integration. Regional chapters cover infrastructure programme commitments, emissions regulation and rental fleet penetration by market. Competitive analysis quantifies Chinese export pricing pressure and residual value differentials by brand. Cost analysis tracks steel, hydraulic component and emissions hardware exposure across weight classes.
Unit shipment and pricing detail by weight class
Aftermarket capture benchmarking across major manufacturers
Battery electric compact machine adoption forecasts
Residual value differentials by brand and market
Competitive position assessments across twenty global manufacturers
Infrastructure programme commitment tracking by region

Built For The People Who Decide

From boardroom strategy to bench-side execution, this report is read cover-to-cover by leaders shaping the next decade of their industry, turning demand scenarios, market dynamics and valuation benchmarks into decisions.
CXOs/ Presidents/ VPs/ Managers
M&A and Corporate Development
Strategy Teams and R&D Heads
Procurement and Product Directors
Regulatory and Compliance Leaders
Investor Relations and Equity Analysts