Market Minds Advisory
Global Crates Market

Global Crates Market: Pooled Fleets Replace Single-Use Packaging

Grocery chains and produce distributors are standardizing on pooled, reusable crate fleets instead of single-use packaging, forcing manufacturers to compete on fleet management services and durability data rather than unit price alone.

Lead Analyst

Bilal Shaikh

Published

September 2026

Make Smarter Decisions with Customized Research Insights

Request a free sample report and evaluate market opportunities, growth trends, and competitive dynamics relevant to your business needs.

2025 MARKET VALUE$9.8BMarket Size 2025
2036 FORECAST VALUE$19.4BBase Case , 2026 to 2036
CAGR 2026 TO 20366.4 %Bull 7.6% / Bear 5.2%
INCREMENTAL OPPORTUNITY$9.0BNet 10- year value creation
EXPANSION MULTIPLE1.86x2036 value over 2026 base
Strategic Levers
M&A Pipeline
Regional Outlook
Country Rankings
Competitive Intelligence
Segmental Deep-dive
Call-Us : 91 93563 13602

Executive Snapshot and Market Trajectory

Reusable crates are displacing single-use corrugated packaging across grocery and produce distribution, as pooling operators and grocers increasingly view crate fleets as a durable logistics asset rather than a disposable shipping cost, reshaping how retailers plan their packaging budgets entirely, especially across categories with high return volume.
East Asia holds the largest regional share, anchored by China's massive plastic manufacturing base and one of the world's largest domestic e-commerce and food distribution logistics networks. Foldable and collapsible crates are growing fastest of any segment as warehouses prioritize storage density and empty-return shipping efficiency. India is growing fastest of any single country, driven by expanding organized retail and cold chain logistics investment nationwide, especially across states building new organized retail infrastructure nationwide.
The competitive field is fragmented across regional plastics manufacturers and specialized pooling operators, with the top five companies holding meaningfully less combined share than in more consolidated packaging categories. Companies operating pooled crate rental fleets alongside manufacturing are capturing disproportionate share as large retailers increasingly prefer fleet management services over one-time equipment purchases they must then track and maintain themselves. That difference is becoming the clearest signal of contract outcomes.
Market Definition
The global crates market covers reusable and returnable plastic, wood, and metal crates used for the transport, storage, and handling of goods across food and beverage, agriculture, retail, and industrial logistics applications. It excludes single-use corrugated boxes, standalone pallets, and intermediate bulk containers, which are tracked as separate packaging categories.
Base Year Value
$9.8B in 2025 (MMA Primary Research Dataset, August 2026)
Forecast Period
2026 to 2036, eleven discrete annual values
CAGR
6.4% base case. Bull 7.6%. Bear 5.2%.
Fastest Growth Segment
Foldable and Collapsible Crates: 9.2% CAGR
Fastest Growth Country
India: 9.1% CAGR
Fastest Growth Region
South Asia and Pacific: 8.4% CAGR
Largest Region
East Asia: 28% of 2025 global value
Market Leaders
ORBIS Corporation, Schoeller Allibert, IFCO Systems, CABKA Group, and Georg UTZ Holding lead global supply. Source: MMA Analysis based on company annual reports.
Primary Survey
n=3,800 procurement and R&D decision-makers, Q4 2025, six countries
Methodology
Demand-side build-up, cross-validated against public data, 47 expert interviews

Global Crates Market Forecast Scenarios

global-crates-market-2025-2035-size-forecast-scenario-1787551667513
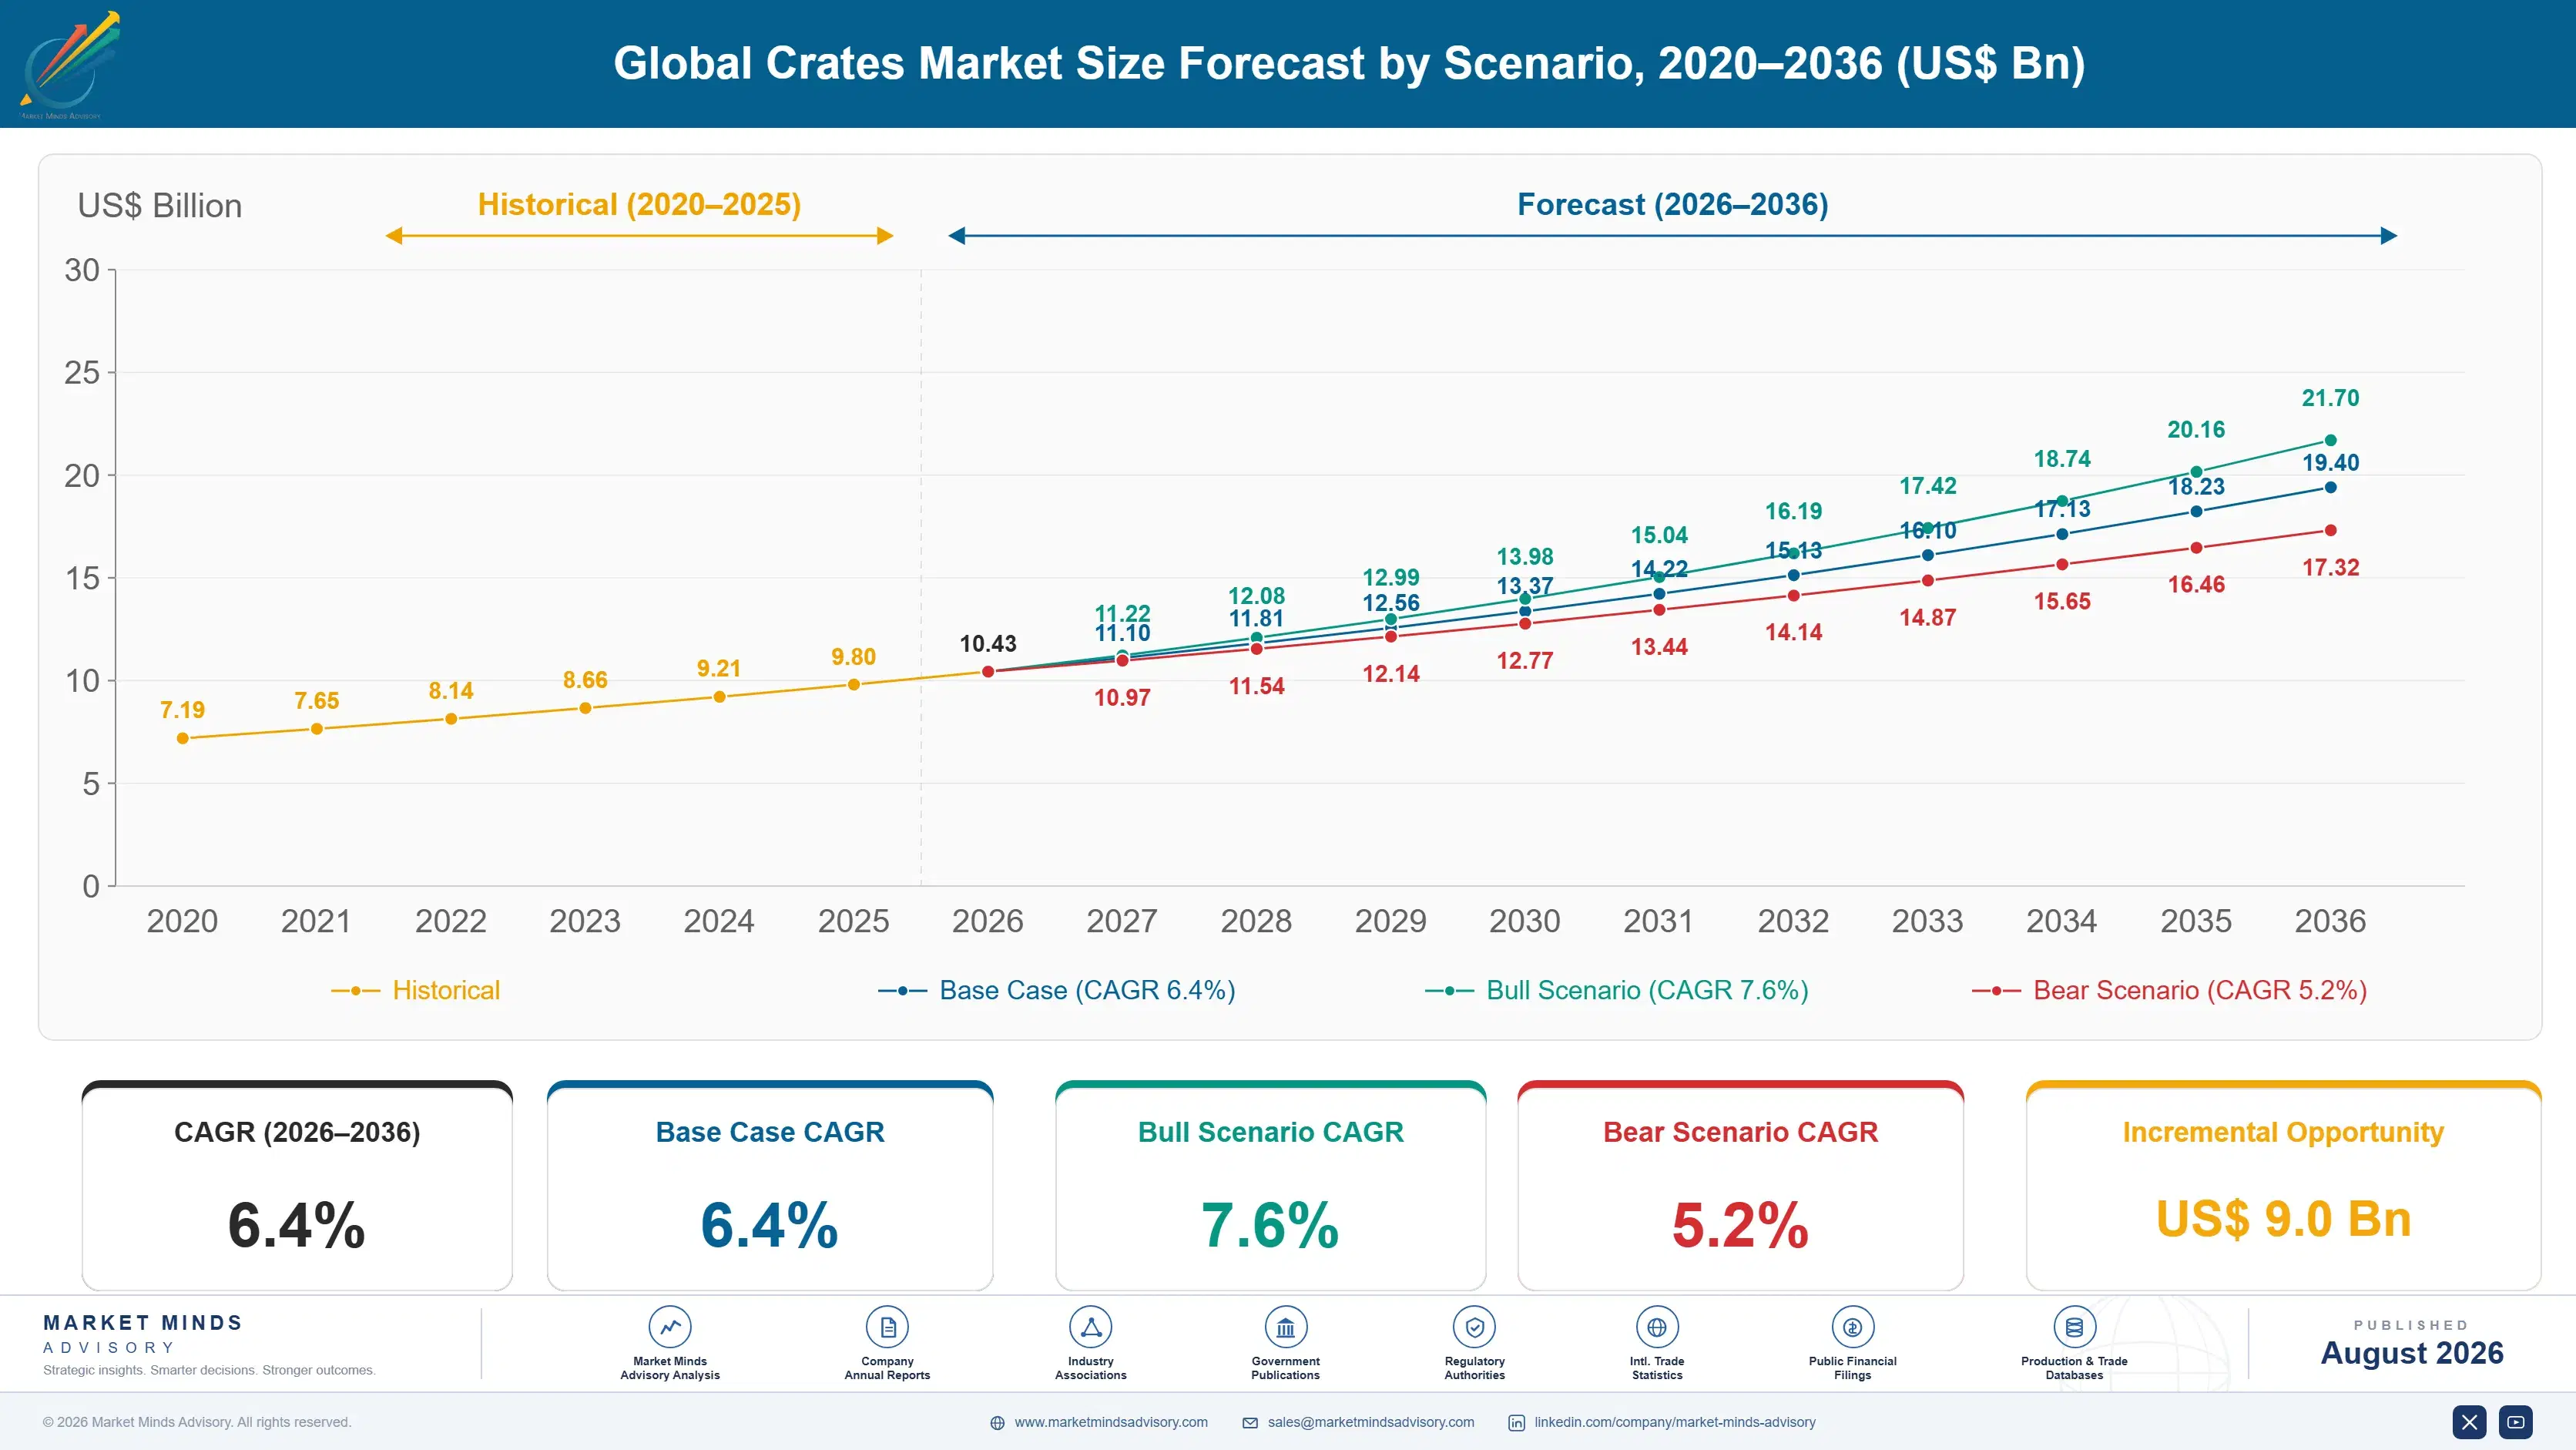
Between 2020 and 2025, crates demand grew at an estimated 5.6% annually as grocery and produce supply chains recovered from pandemic-era disruption and accelerated adoption of pooled reusable packaging over single-use alternatives. ORBIS Corporation and IFCO Systems both expanded pooling fleet capacity through the period to meet growing retailer and distributor demand across major grocery markets.
MMA's base case projects 6.4% annual growth to 2036 on three mechanisms: expanding pooled crate rental adoption among grocery and produce distributors reducing single-use packaging costs, continued warehouse automation investment favoring standardized, stackable crate formats, and steady industrial bulk handling demand from expanding e-commerce fulfillment operations. Foldable crate adoption is adding a fourth, smaller growth channel as empty-return shipping costs become a larger share of total logistics spend. Expect this channel to keep expanding steadily.
A bull catalyst comes from faster-than-expected retailer mandates phasing out single-use packaging across major grocery chains in response to sustainability regulation. The bear risk is pooling fleet loss and damage rates: if crate loss across shared logistics networks remains high, pooling operators could face margin pressure that slows fleet expansion and, in turn, slows category growth meaningfully.

Ownership Gives Way to Pooled Fleet Management

Crates solve a problem every grocery and produce supply chain has: how to move perishable goods from farm or factory to shelf without damaging them, and increasingly the answer is a standardized, stackable plastic container that gets returned, washed, and reused hundreds of times rather than thrown away after one trip. That shift from single-use to pooled reuse is reshaping how retailers and distributors budget for packaging entirely.
MARKET CONCENTRATION34%Reflects a comparatively fragmented overall manufacturing base structure
AVERAGE SELLING PRICE$8.40/unitReflects blended pricing broadly across standard crate formats
TOP PRODUCING COUNTRYChinaLargest global plastic crate manufacturing and export base
CAPACITY UTILIZATION74%Seasonal produce demand creates meaningful utilization swings yearly
FEEDSTOCK COST SHARE48% of COGSPolypropylene and polyethylene resin dominate total input cost
TRADE INTENSITY22% exportedRoughly a fifth of finished crate volume crosses borders
Commercially, fleet management capability increasingly separates specification winners from commodity competitors. Large grocery chains and produce distributors specify pooling operators by documented crate tracking, cleaning, and loss-recovery performance, while smaller regional distributors still buy crates outright largely on price for standard formats. Manufacturers serving both markets effectively run two very different commercial relationships with very different renewal cycles.
Over the next decade, expect pooled fleet rental to grow meaningfully faster than outright crate ownership, since most volume upside comes from retailers shifting to asset-light packaging models rather than growth in one-time equipment purchases. Manufacturers investing in fleet tracking and reverse logistics capability are best positioned to capture this expanding, higher-value pooled rental demand as more retailers commit to multi-year contracts.
"Nobody used to think about what happens to a crate after it's unloaded. Now that return trip, who cleans it, who tracks it, who owns it, is exactly where the money in this category is moving."
Director, Reusable Packaging and Logistics Practice · MMA Reusable and Returnable Transport Packaging Practice · August 2026

Market Trends

Pooled Fleet Rental Displaces Outright Crate Ownership

Large grocery chains and produce distributors are increasingly shifting from outright crate ownership toward pooled fleet rental arrangements, valuing reduced capital expenditure and outsourced cleaning, tracking, and loss-recovery logistics compared with managing owned crate inventory internally. IFCO Systems and Schoeller Allibert have both expanded pooling fleet capacity over the past two years to serve this growing asset-light packaging demand. At least a dozen major grocery chains have transitioned primary produce packaging to pooled rental fleets since 2023, and operators report this shift is meaningfully expanding addressable recurring revenue across previously ownership-based accounts.
Market Impact: Sustains 6%+ regulation-linked growth yearly
Warehouse Automation Standardizes Crate Dimensions Broadly

Automated warehouses and fulfillment centers are increasingly requiring standardized, stackable crate dimensions compatible with robotic picking and conveyor systems, valuing consistent form factors that improve automation throughput compared with mixed, non-standardized container formats. ORBIS Corporation and Rehrig Pacific Company have both expanded standardized-format production capacity over the past two years to serve this growing automated logistics demand. At least several major e-commerce fulfillment operators have adopted standardized crate specifications since 2023, and manufacturers report this shift is meaningfully expanding addressable industrial demand. with several additional fulfillment operators reportedly evaluating similar standardization programs for adoption within the next two years.
Market Impact: Sustains 7%+ fulfillment-linked growth

Market Opportunities and Growth Drivers

Sustainability Regulation Expands Reusable Packaging Demand

Growing packaging waste regulation across multiple major economies continues expanding demand for reusable crates in place of single-use corrugated and plastic film packaging, particularly in grocery and food service supply chains facing new extended producer responsibility requirements. Industry data show packaging waste regulation has tightened considerably across major economies over the past several years, directly supporting reusable crate demand growth. Manufacturers report this regulatory tailwind provides meaningful commercial stability underpinning the broader category's overall growth trajectory, even as broader retail capital spending fluctuates with the economic cycle. That regulatory durability is a meaningful differentiator.
Market Impact: Cuts fleet margins by 8+ points

E-Commerce Fulfillment Expands Industrial Crate Demand

Continued e-commerce fulfillment center expansion across major consumer markets sustains steady demand for industrial bulk handling crates used in internal warehouse logistics and last-mile distribution staging, valued for durability and stackability compared with single-use shipping cartons. Trade data show e-commerce fulfillment center construction has grown considerably across major consumer markets over the past several years. Manufacturers report this baseline demand provides meaningful commercial stability underpinning the broader category's overall growth trajectory, particularly for manufacturers with established warehouse automation equipment relationships. That equipment relationship depth is difficult for newer competitors to replicate quickly.
Market Impact: Compresses margins by 5+ points

Market Restraints and Challenges

Fleet Loss and Damage Rates Erode Margins

Many pooling operators face persistent crate loss and damage across shared logistics networks spanning multiple retailers, distributors, and carriers, and the root cause is that responsibility for tracking and returning crates is diffused across so many handling parties that no single participant bears full accountability for losses. This loss rate erodes pooling operator margins and complicates fleet replacement cost planning across large rental programs. Operators serving highly fragmented distributor networks face the steepest loss rates. Operators are mitigating this by deploying RFID tracking tags and tightening contractual loss-recovery terms with retail partners.
Market Impact: Adds 12+ major grocery chain conversions

Resin Price Volatility Squeezes Manufacturing Margins

Many crate manufacturers face volatile polypropylene and polyethylene resin pricing tied to broader petrochemical commodity cycles, and the root cause is that crate manufacturing contracts with large retailers are often priced on multi-year fixed terms that do not adjust quickly to resin cost swings. This pricing mismatch squeezes manufacturer margins during periods of rising resin costs, particularly for manufacturers without long-term supply contracts. Smaller manufacturers without resin hedging capability face the steepest margin exposure. Manufacturers are mitigating this by negotiating resin cost pass-through clauses into new retailer contracts. That practice is spreading quickly across the industry.
Market Impact: Cuts automated picking errors by 15%+
3 additional market trends, 4 additional growth drivers, and 3 additional restraints and challenges are covered in the full report. Contact sales@marketmindsadvisory.com to access the complete intelligence.

Segment CAGR and Growth Architecture

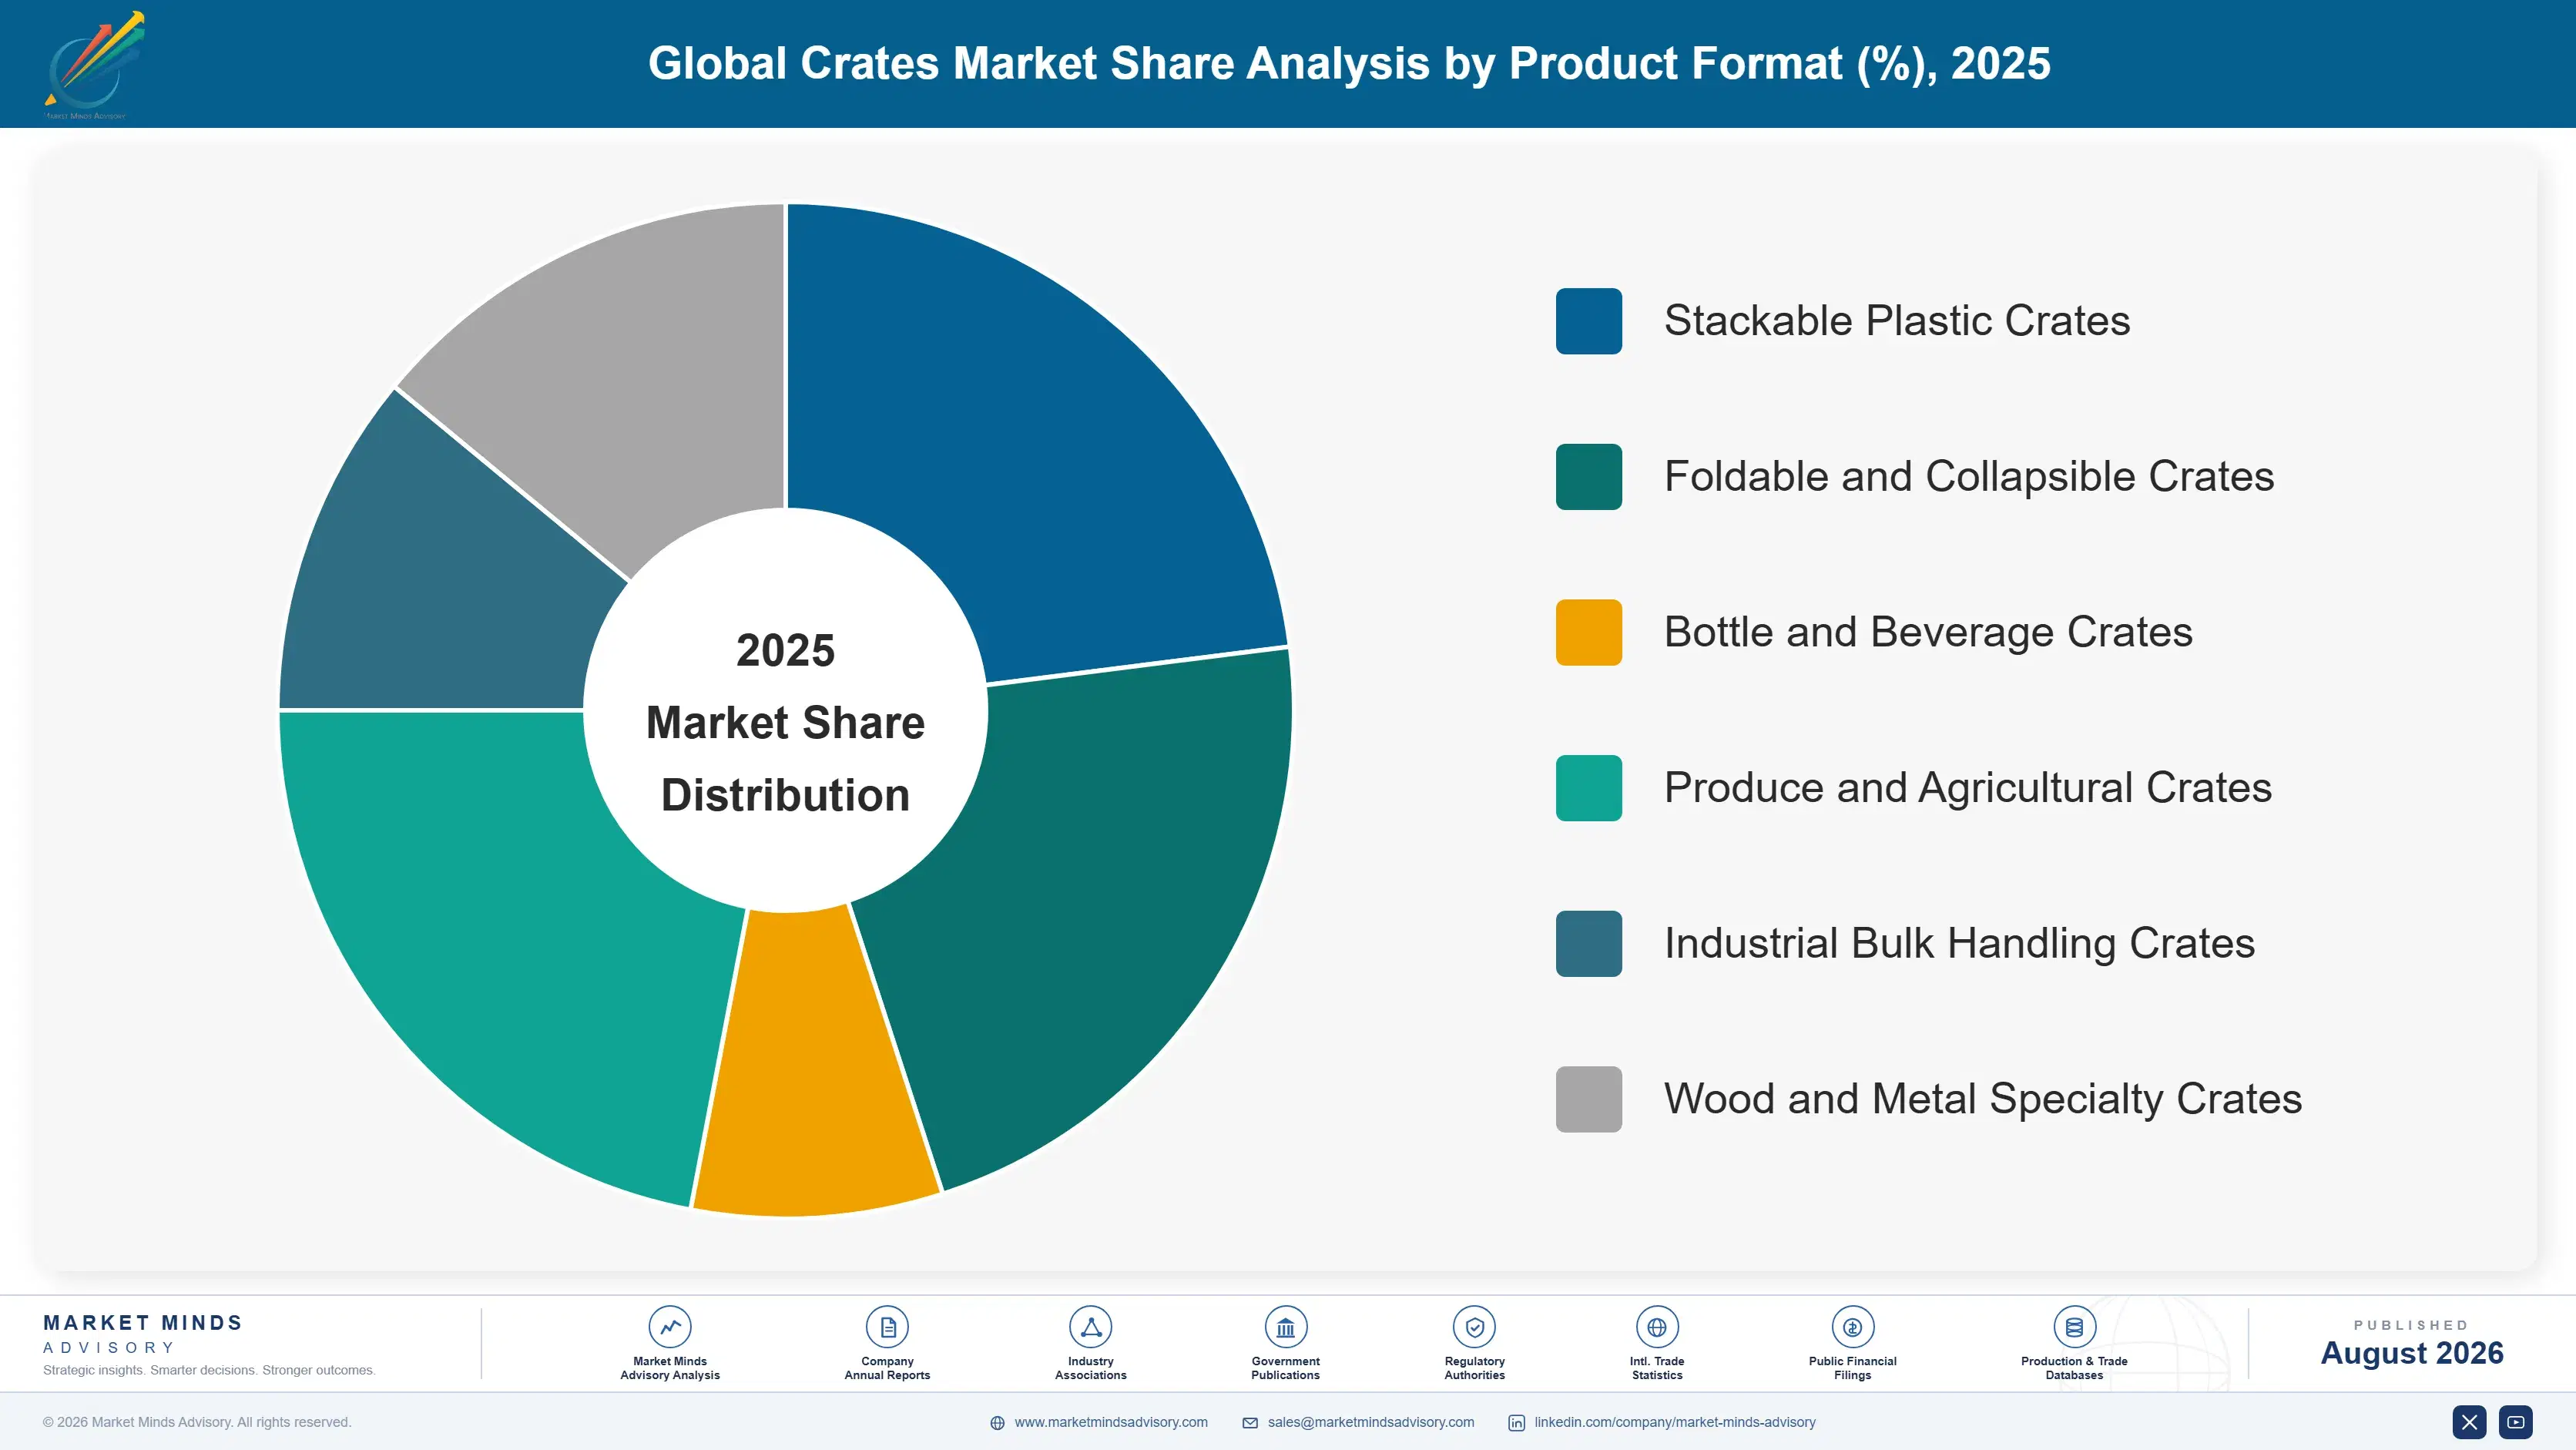
The global crates market is segmented by product format, the classification that determines manufacturing process, storage efficiency, and end-use handling requirements: stackable, foldable, bottle and beverage, produce and agricultural, industrial bulk handling, and wood and metal specialty crates each carry distinct commercial profiles across the packaging value chain. from initial manufacturing through end-of-life recycling.
global-crates-market-2025-2035-market-share-analysis-1787551668087

Foldable and Collapsible Crates

Foldable and collapsible crates are the fastest-growing segment as warehouses and distributors prioritize storage density and empty-return shipping efficiency across increasingly space-constrained logistics networks. CABKA Group and Schoeller Allibert both dominate this segment through established foldable mechanism engineering that rigid-crate-focused manufacturers have not developed to the same degree. Distributors increasingly specify foldable crates by documented empty-return volume reduction and mechanism durability rather than accepting generic collapsible product claims, reflecting growing logistics procurement sophistication. Production costs remain meaningfully above standard stackable crates, but empty-return freight savings and expanding warehouse space constraints more than compensate manufacturers with genuine foldable mechanism engineering capability. and that advantage is widening as warehouse space constraints intensify across major logistics markets.
CAGR 9.2%

Industrial Bulk Handling Crates

Industrial bulk handling crates are scaling quickly as e-commerce fulfillment centers and automated warehouses expand internal logistics infrastructure requiring durable, stackable containers compatible with robotic and conveyor systems. ORBIS Corporation and Rehrig Pacific Company both maintain established fulfillment center distribution relationships that grocery-focused manufacturers have not developed. Fulfillment operators increasingly specify industrial crates by documented automation compatibility and load-bearing capacity rather than accepting generic bulk container claims, reflecting growing industrial procurement sophistication. Pricing remains comparable to standard produce crate formats, supporting steady adoption across cost-conscious warehouse automation programs nationwide. That pricing parity, combined with growing automation mandates, is what is letting industrial crates capture share from legacy shipping carton formats across an expanding range of fulfillment center applications.
CAGR 8.4%
Full segment breakdown across 6 segments available in the complete report.

Regional Architecture and Country Demand Map

East Asia leads the global crates market, anchored by China's massive plastic manufacturing base and one of the world's largest domestic e-commerce and food distribution logistics networks, while North America follows on the strength of its large, mature grocery pooling industry. particularly across long-established national grocery accounts.

East Asia

China anchors regional demand through its massive plastic manufacturing base and one of the world's largest domestic e-commerce and food distribution logistics networks, supplying both domestic retailers and export markets worldwide. Japan maintains a technically sophisticated demand base tied to established grocery pooling programs and precision manufacturing standards. South Korea's advanced logistics automation sector is increasingly adopting standardized crate formats compatible with robotic warehouse systems. Regional growth trails only South Asia and Pacific because both manufacturing capacity and e-commerce fulfillment infrastructure continue expanding rapidly across the region's major economies. Taiwan's smaller but efficient plastics manufacturing sector adds further meaningful regional export capacity. Vietnam's growing manufacturing sector is an emerging secondary export base for regional plastics production.
Share: 28% | CAGR: 7.4% (2026 to 2036)

North America

The United States drives most of the region's demand through its large, mature grocery pooling industry and substantial e-commerce fulfillment center construction favoring standardized crate formats. ORBIS Corporation and IFCO Systems both maintain extensive domestic manufacturing and pooling fleet infrastructure supplying grocery, produce, and industrial customers simultaneously. Canada's smaller grocery sector contributes modest additional demand through established supply chain integration. Growth here is accelerating as pooled fleet rental increasingly supplements the region's traditionally ownership-dominated demand base. Mexico's growing produce export sector, tightly linked to United States cold chain logistics, is adopting comparable pooled crate specifications for cross-border shipments. Federal food safety traceability regulations have meaningfully accelerated grocery chain adoption of tracked pooled crate systems across multiple states.
Share: 25% | CAGR: 6.9% (2026 to 2036)
Regional intelligence for 5 additional markets available in the complete report: Western Europe, South Asia and Pacific, Latin America, Middle East and Africa, Eastern Europe. Contact sales@marketmindsadvisory.com.
global-crates-market-2025-2035-country-cagr-analysis-1787551668604

Where Fleet Operators Can Capture Margin

Margin capture in crates increasingly depends on pooled fleet management capability and loss-recovery performance rather than raw crate manufacturing volume alone. Operators that can deliver documented tracking accuracy, faster cleaning turnaround, and multi-retailer pooling scale are commanding meaningfully better contract economics than manufacturers competing purely on standard crate unit price. across every contract tier.

Deploying RFID Tracking Across Pooled Fleets

Operators that deploy RFID and barcode tracking across pooled crate fleets are capturing improved contract economics from retailers facing persistent loss and shrinkage across shared logistics networks. IFCO Systems's expanded tracking deployment, broadened in 2024, reportedly reduces fleet loss rates by 20 to 30 percent compared with untracked equivalent fleets. Operators without dedicated tracking infrastructure are increasingly partnering with logistics technology providers to access comparable capability. Few competitors currently match this tracking accuracy across multi-retailer pooling networks at comparable scale. That accuracy gap took years of fleet circulation data to build.
Market Impact: Cuts fleet loss rates by 20 to 30 percent

Building Multi-Retailer Pooling Scale Advantages Now

Operators that build pooling networks spanning multiple retailers and distributors are capturing premium positioning among grocery chains seeking wider crate circulation without maintaining dedicated single-retailer fleets. Multi-retailer pooling reportedly reduces per-unit fleet cost by 20 to 30 percent compared with single-retailer dedicated equivalent fleet arrangements. This pooling scale requires sustained multi-year retailer relationship building that smaller operators often cannot justify pursuing independently. That scale advantage compounds further as more retailers join an already-established pooling network. Smaller operators rarely catch up once this circulation gap opens fully across an entire region.
Market Impact: Cuts per-unit fleet cost by 20 to 30 percent

Offering Integrated Washing and Reconditioning Services

Operators that offer integrated crate washing and reconditioning services alongside fleet rental are capturing premium positioning among retailers seeking outsourced sanitation compliance without operating in-house washing facilities themselves. Integrated-service operators reportedly extend average crate service life by 20 to 30 percent compared with operators offering rental without reconditioning support. This washing infrastructure investment requires sustained capital that smaller operators often cannot justify funding independently, leaving them dependent on third-party sanitation contractors that add cost and coordination complexity. That dependency is a meaningful competitive disadvantage over time as retailer expectations continue rising.
Market Impact: Extends crate service life by 20 to 30 percent

Standardizing Formats for Warehouse Automation Compatibility

Manufacturers that standardize crate dimensions for compatibility with robotic picking and conveyor systems are capturing premium positioning among e-commerce fulfillment operators investing heavily in warehouse automation infrastructure. Standardized-format manufacturers reportedly secure 20 to 30 percent longer-term fulfillment center contracts than manufacturers offering only non-standardized equivalent formats. This standardization investment requires sustained engineering coordination with automation equipment makers that smaller manufacturers often cannot justify pursuing, and that gap tends to widen as automation adoption spreads further. Few competitors currently offer comparable engineering coordination depth with automation equipment makers across the industry broadly.
Market Impact: Secures 20 to 30 percent longer contracts overall

Who Controls the Margin Pool

Five companies hold roughly a third of global supply on a production-volume basis, a comparatively fragmented concentration reflecting the mix of regional plastics manufacturers, specialized pooling operators, and diversified packaging conglomerates competing across this category. The gap between operators with proven multi-retailer pooling scale and manufacturers selling only standalone crate units is widening as large grocery chains increasingly prefer fleet management relationships. That capability gap is becoming the clearest predictor of which companies win large national retail contracts.
Current competitive activity centers on three fronts: RFID tracking deployment to reduce fleet loss and improve contract economics, multi-retailer pooling network expansion to capture wider circulation scale, and integrated washing and reconditioning service development to capture outsourced sanitation demand. IFCO Systems and ORBIS Corporation have both announced meaningful investment across these fronts over the past two years.

Emerging pressure is coming from regional Asian manufacturers improving both cost efficiency and pooling technology sophistication, threatening the premium positioning established Western pooling operators have historically held in multinational retail accounts. Rankings could shift meaningfully over the next several years if these regional competitors successfully replicate the tracking and reconditioning infrastructure that currently favors established, larger operators.
global-crates-market-2025-2035-company-positioning-matrix-1787551669125

Competitive Moat and Risk Dimensions

ORBIS CORPORATION

Moat: Integrated Manufacturing and Pooling Scale

ORBIS Corporation maintains an integrated combination of manufacturing capacity and pooling fleet operations, giving it cost and service advantages that manufacturing-only or pooling-only competitors cannot easily replicate. That integration lets ORBIS Corporation offer retailers a single relationship spanning crate design, manufacturing, and fleet management simultaneously, reducing coordination complexity for large national accounts.
ORBIS CORPORATION

Risk: Exposure to Resin Cost Volatility

ORBIS Corporation's substantial manufacturing footprint exposes the company to polypropylene and polyethylene resin cost volatility that affects its production economics more directly than pure pooling operators without owned manufacturing capacity. A sustained resin cost spike could compress ORBIS Corporation's margins more than asset-light competitors focused purely on fleet management services.
IFCO SYSTEMS

Moat: Global Produce Pooling Network Scale

IFCO Systems maintains the broadest global produce pooling network scale in the industry, built through decades of continuous fleet expansion across major grocery and produce distribution markets worldwide. That scale gives IFCO Systems negotiating leverage with retailers and distributors that smaller regional pooling operators cannot easily replicate without years of accumulated fleet circulation.
IFCO SYSTEMS

Risk: Concentration in Produce Applications

IFCO Systems's heavy concentration in produce and grocery pooling applications means the company carries more exposure to grocery sector capital spending cycles than more diversified competitors serving industrial and beverage applications simultaneously. A sustained grocery sector spending slowdown could compress IFCO Systems's growth more than diversified competitors.

Players Tracked

Prominent Players

ORBIS Corporation
Schoeller Allibert
IFCO Systems
CABKA Group
Georg UTZ Holding

Other Key Players

Rehrig Pacific Company
Buckhorn Inc
Nefab Group
DS Smith Plc
Loscam
Craemer Group
Monoflo International
Bekuplast GmbH
SSI Schaefer
Nilkamal Limited
Supreme Industries
Brambles Limited
Rotom Group
Polymer Logistics
Norseman Plastics

Recent Developments

MARCH 2024

IFCO Systems Expands RFID Tracking Deployment

IFCO Systems expanded its RFID tracking deployment across major produce pooling networks in March 2024, targeting reduced fleet loss rates and improved circulation visibility for retailers and distributors across multiple national grocery markets simultaneously. The company expects to extend this deployment to additional distribution centers over the following year.
Signal: Signals established pooling operators are investing well ahead of confirmed retailer loss-recovery contract renegotiations nationwide across most major grocery markets.
AUGUST 2023

ORBIS Corporation Launches Warehouse Automation Format Line

ORBIS Corporation launched a new standardized crate format line in August 2023, engineered specifically for compatibility with robotic picking and conveyor systems used across expanding e-commerce fulfillment center automation programs nationwide. ORBIS Corporation expects this format line to become the industry standard for automated warehouse compatibility within several years.
Signal: Signals format standardization is emerging as a genuine competitive differentiator beyond traditional grocery applications across the broader logistics sector.
JANUARY 2025

Schoeller Allibert Announces Reconditioning Facility Expansion

Schoeller Allibert announced an expanded crate washing and reconditioning facility network in January 2025, targeting retailers and distributors seeking outsourced sanitation compliance without operating in-house washing infrastructure across multiple European markets. Schoeller Allibert expects to extend this reconditioning network to additional regions over the following two years.
Signal: Signals integrated reconditioning services are emerging as a genuine competitive differentiator beyond rental alone across most European retail accounts.

Polypropylene and Polyethylene Resin Cost Exposure

Polypropylene and polyethylene resin account for roughly forty-eight percent of total production cost, reflecting the core plastic feedstock chemistry required for crate manufacturing across stackable, foldable, and industrial bulk handling formats alike. Resin pricing tracks broader petrochemical commodity cycles, and most resin is sourced from large petrochemical producers across North America, the Middle East, and East Asia.
Polypropylene and polyethylene resin prices rose meaningfully during 2021 and 2022 following broader petrochemical supply chain disruption, according to trade association reporting and company annual disclosures, increasing crate production costs across the industry. Manufacturers without long-term resin supply contracts faced the steepest cost increases, since qualifying alternative resin suppliers requires extended validation before substitution becomes possible at scale, a constraint that left several smaller manufacturers absorbing much of the resulting cost increase directly.

Smaller manufacturers relying on open-market resin purchases carry meaningfully more cost exposure than larger, vertically integrated manufacturers like ORBIS Corporation or CABKA Group, which can shift sourcing across multiple qualified suppliers when one underperforms. This exposure disadvantage compounds for manufacturers competing on price against integrated competitors with deeper sourcing relationships and greater negotiating scale across their broader packaging portfolios.
global-crates-market-2025-2035-cost-volatility-analysis-1787551669321

Diversify Polypropylene Resin Sourcing

Larger manufacturers are qualifying polypropylene and polyethylene resin supply from multiple sources simultaneously rather than relying on a single supplier, reducing the odds that one disruption cuts total feedstock availability. This diversification adds procurement complexity but has measurably reduced cost volatility for adopters facing broader petrochemical market disruption. particularly during periods of sudden price spikes.

Negotiate Resin Cost Pass-Through Clauses

Manufacturers are negotiating resin cost pass-through clauses into multi-year retailer supply agreements, reducing exposure to spot market price volatility affecting the broader petrochemical manufacturing sector, and the manufacturers that started earliest are locking in more favorable long-term retailer terms. Late-moving manufacturers negotiating from a weaker position typically absorb meaningfully more cost volatility than early movers.

Incorporate Recycled Resin Content Where Feasible

Manufacturers are incorporating recycled polypropylene content into crate formulations where structural specifications allow, reducing dependence on primary resin while supporting sustainability positioning. This approach requires investment in material qualification testing but has improved overall cost resilience for adopters facing volatile virgin resin markets. especially for manufacturers serving high-volume grocery accounts where consistent supply matters most.

Portfolio Architecture for Margin Defence

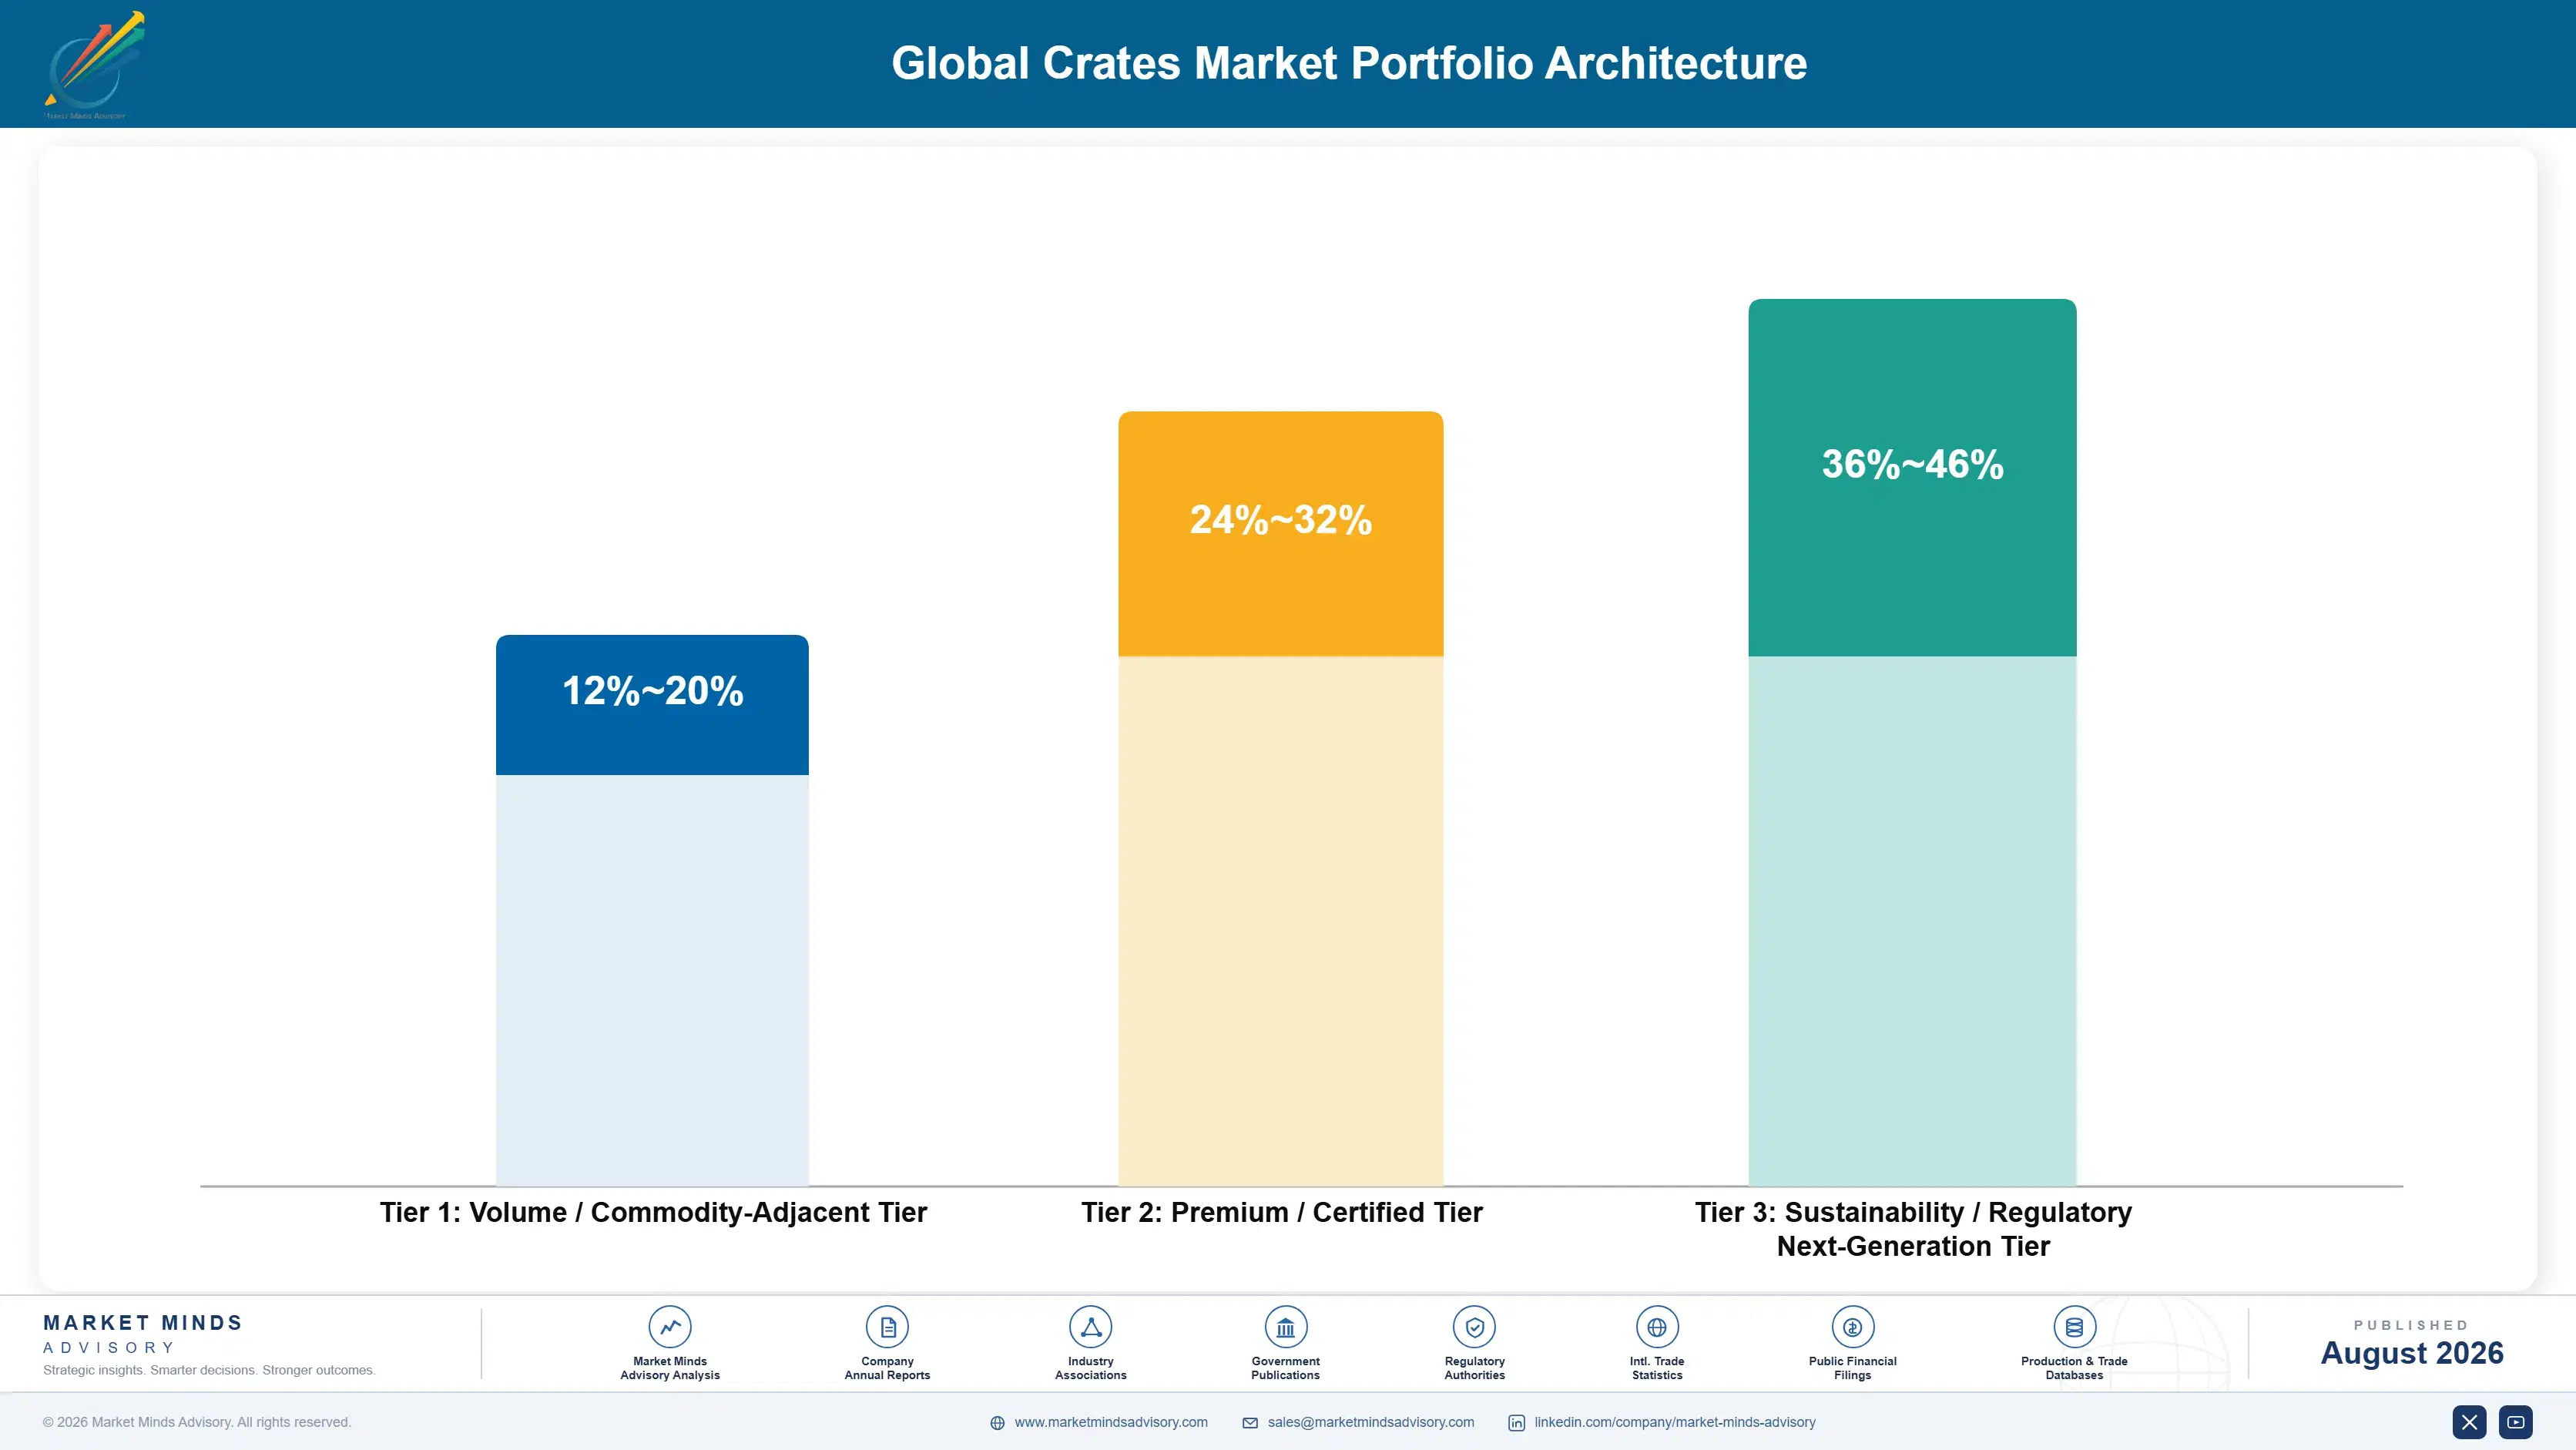
Manufacturers and operators in this market operate a three-tier portfolio spanning standard owned crates sold largely on price into smaller regional distributor customers, certified pooled fleet rental programs commanding premium contract economics from large national retailer customers, and next-generation tracked and automated-format crates positioned for the highest-margin fulfillment center accounts. Gross margins vary meaningfully across these tiers, from modest levels on standard owned crates to well above thirty percent on qualified pooled fleet rental programs.
The volume versus premium tension is intensifying as more operators chase pooling and fulfillment center margins, but standard owned crates still represent meaningful shipped volume across the industry's large regional distributor customer base and remain necessary for covering fixed manufacturing costs. Manufacturers that abandon standard volume too quickly risk underutilizing capacity built for broad commercial scale across smaller accounts.

High-value margin pools concentrate specifically in pooled fleet rental programs sold to large national retailers and in automated-format crates sold to fulfillment center operators facing tightening automation compatibility requirements. Standard owned crates remain the volume anchor but carry thinner margins as competition intensifies among established and emerging Asian manufacturers. Manufacturers slow to reposition toward these higher-margin segments risk ceding share to more agile, specialized competitors.

Volume / Commodity-Adjacent Tier

Standard owned crates sold primarily on price into smaller regional distributor customers with basic durability requirements and limited service needs. Representing meaningful shipped volume but the thinnest margins across the entire portfolio.
Gross Margin: 12-20%

Premium / Certified Tier

Certified pooled fleet rental programs sold into large national retailer customers, commanding premium contract economics through documented tracking performance. Qualification typically requires extended pilot programs before new operators gain approved status.
Gross Margin: 24-32%

Sustainability / Regulatory / Next-Generation Tier

Next-generation tracked and automated-format crates positioned for fulfillment center accounts paying the category's highest per-unit prices for verified compatibility. Only a small handful of manufacturers currently hold established automation compatibility credentials.
Gross Margin: 36-46%
global-crates-market-2025-2035-portfolio-architecture-1787551669826

High-value Sub-segments and Strategic Watch-out

Tracked Pooled Rental Fleets

Tracked pooled rental fleets are capturing the highest margins in the category as retailers shift toward asset-light packaging models, and established operators are defending this premium positioning through accumulated tracking infrastructure competitors cannot easily replicate quickly. That advantage compounds further with each additional year of tracking data.
Gross Margin: 36-46%

Certified Multi-Retailer Pooling Programs

Multi-retailer pooling programs are gaining share as sustainability mandates expand, though documented loss-recovery credibility remains concentrated among a small number of established operators with decades of accumulated trust. Challengers able to build comparable loss-recovery credibility could meaningfully reshape this segment within the next several years.
Gross Margin: 24-32%

Standard Owned Crate Sales

Standard owned crates sold into mainstream regional distributor customers remain the category's volume core, anchored by established relationships but facing steady margin pressure from Asian manufacturers. That pressure is expected to intensify further as Asian manufacturers continue improving both cost efficiency and product durability standards.
Gross Margin: 12-20%

Legacy Uncertified Discount Crates

Uncertified discount crates sold without documented durability testing face rising buyer scrutiny amid growing food safety and traceability concerns, a segment reputable manufacturers should actively avoid entirely going forward. Association with a food safety incident can meaningfully damage a manufacturer's broader reputation for years afterward.
Gross Margin: 6-12%

Pooling Contracts Meet Retailer Renewal Cycles

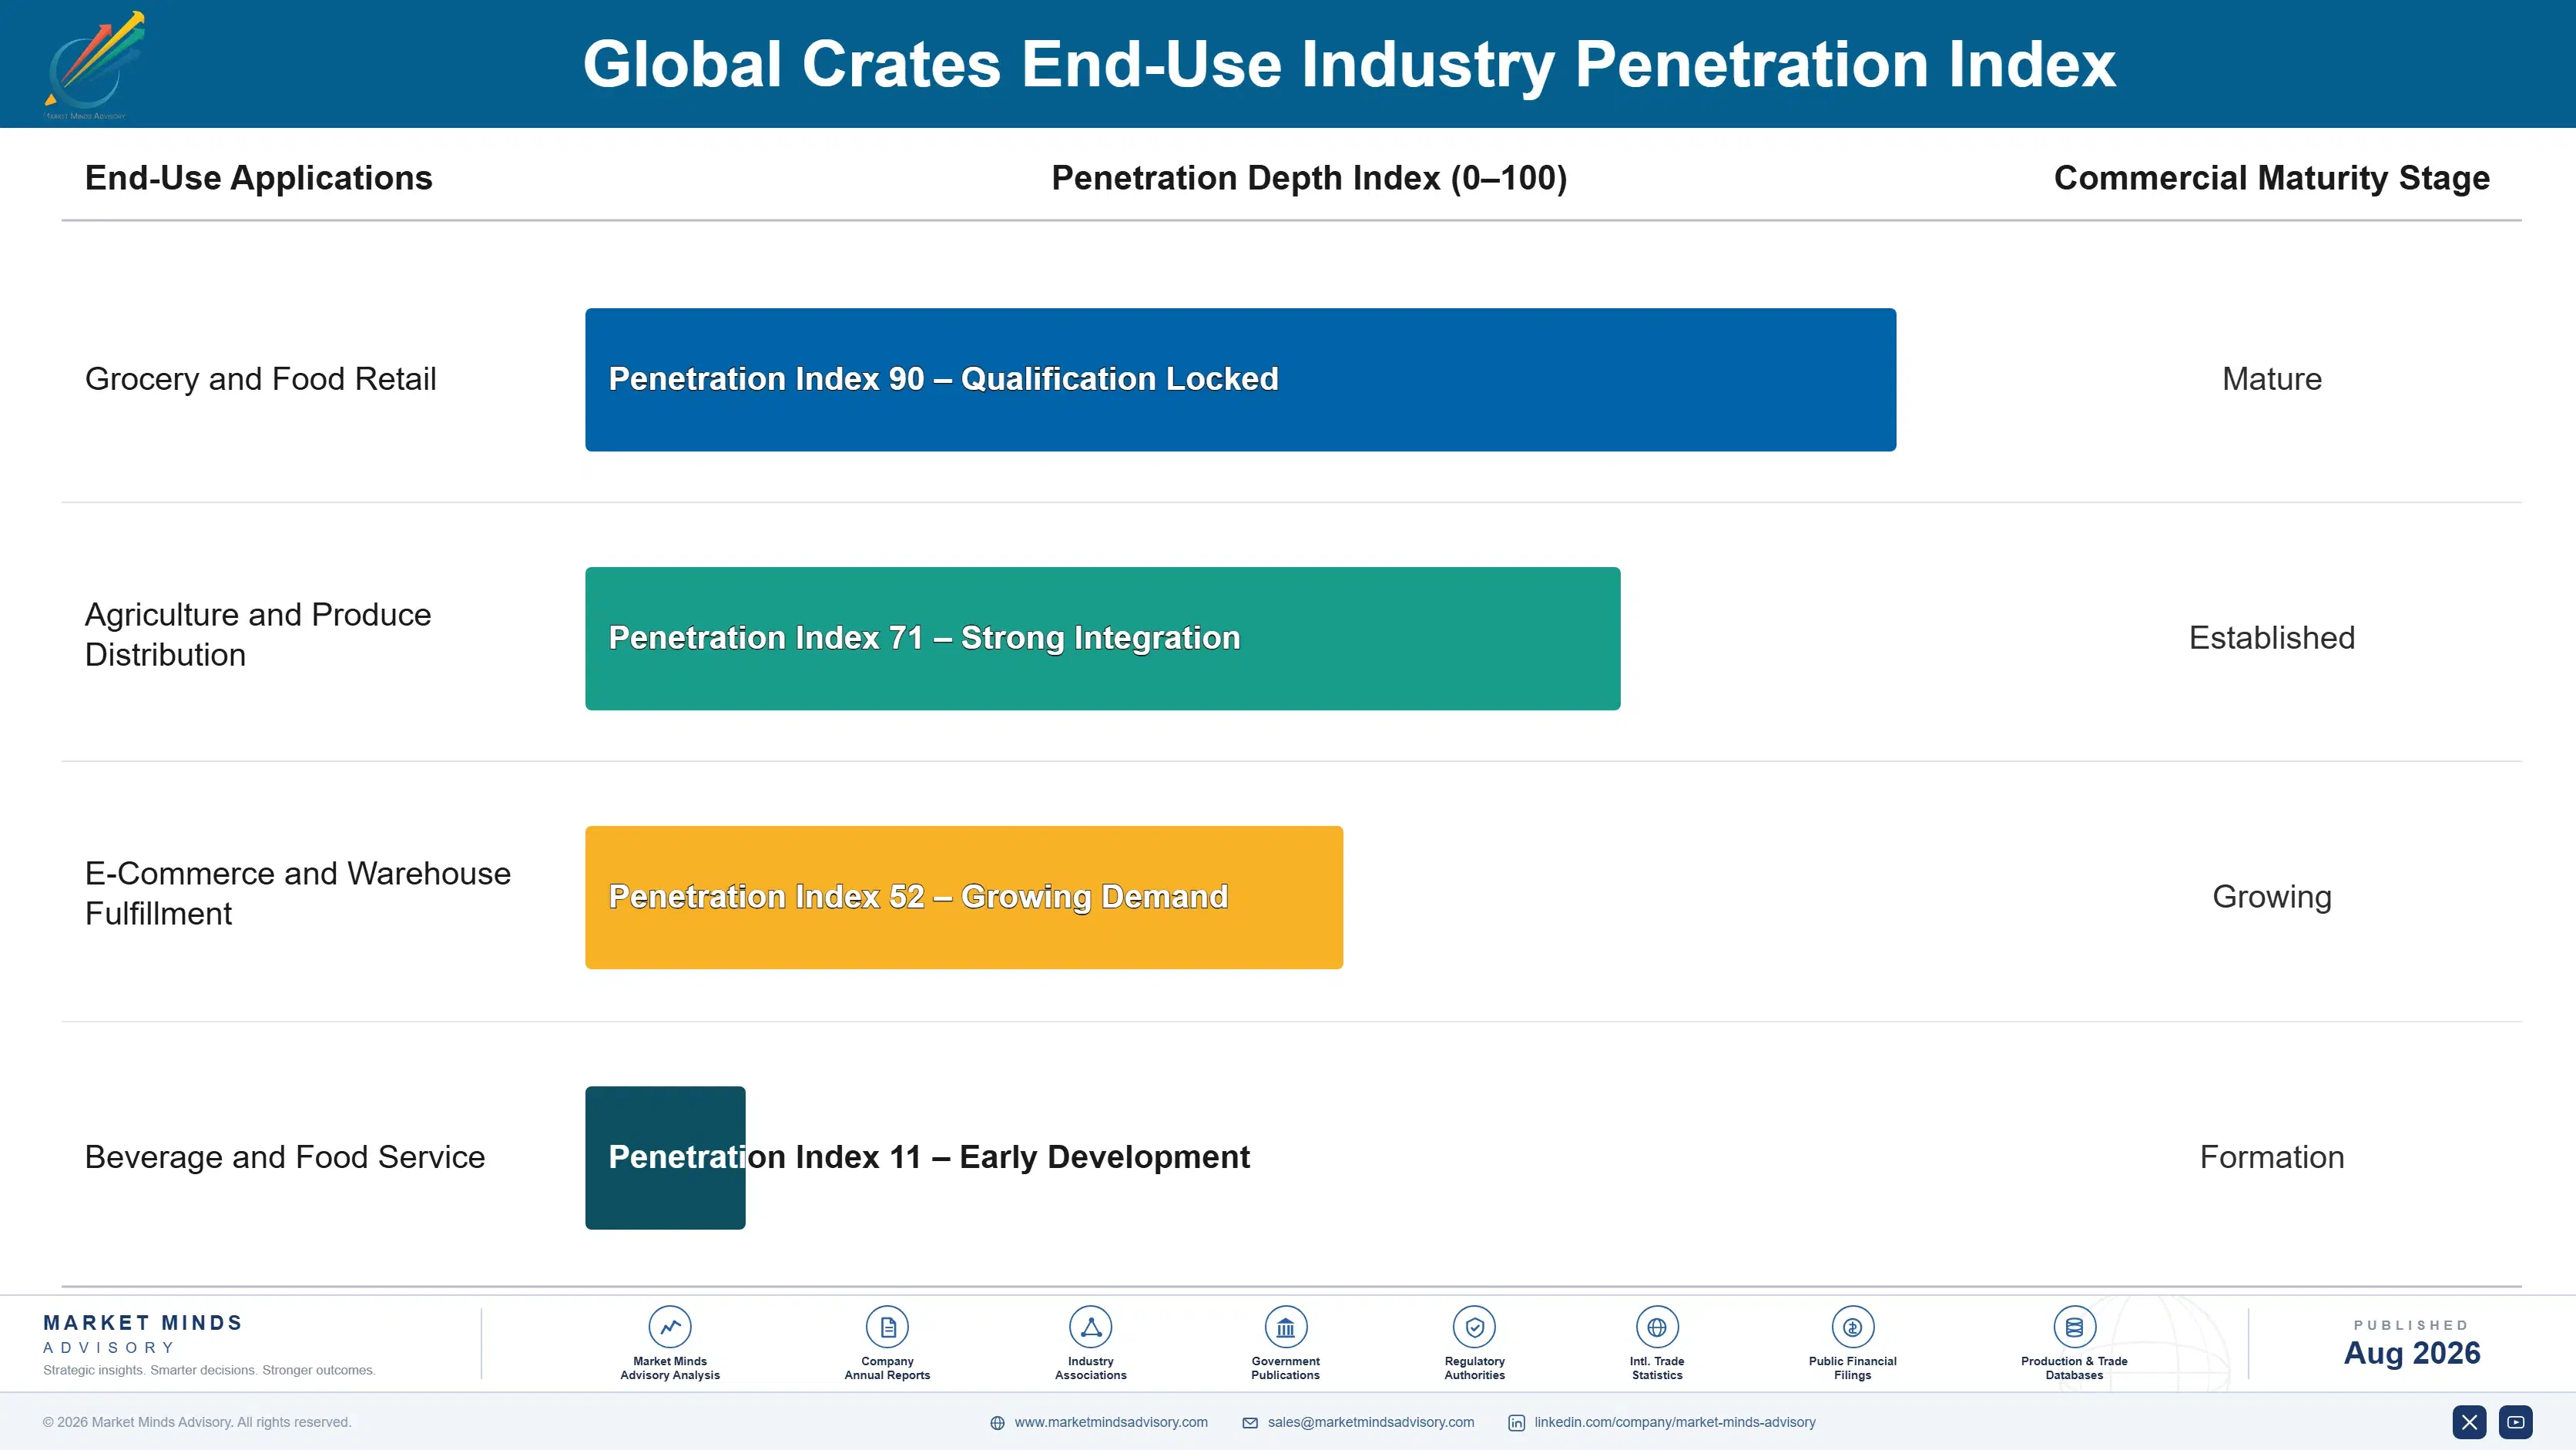
Crate demand increasingly behaves like a specification-locked relationship rather than a recurring commodity purchase, because large retailers typically standardize on a specific pooling operator across an entire multi-year fleet contract rather than switching suppliers opportunistically between purchase orders. That structure gives incumbent operators durable, multi-year revenue visibility once a pooling contract is won, though it also means losing an initial contract locks a competitor out of that retailer's full fleet rollout for years. That visibility is precisely what makes this category attractive to operators seeking predictable, recurring revenue streams.
Adoption depth varies sharply by end-use vertical. Large national grocery chains adopt new pooling operators relatively cautiously given extended contract negotiation and fleet transition logistics requirements, while smaller regional distributors move considerably faster, switching crate suppliers whenever price or availability considerations favor doing so without meaningful procurement burden or committee-level approval.

Generational buyer shifts are visible mainly among newer retail procurement teams building sustainability metrics and fleet tracking data directly into packaging procurement criteria, while legacy distributor buyers remain anchored to established suppliers they have used successfully across previous packaging generations spanning decades of reliable performance and service.
global-crates-market-2025-2035-end-use-penetration-index-1787551670330

Where Crate Value Concentrates

These are among the four positions where our research anticipates prominent divergence between winners and laggards over the coming forecast period. Each is grounded in the demand model, the regulatory perimeter, and the announced capacity pipeline.
01 / RFID TRACKING INFRASTRUCTURE INVESTMENT

Deploy tracking ahead of retailer loss-recovery demands

Retailers increasingly demand documented loss-recovery performance from pooling operators, and operators with deployed RFID tracking are capturing this premium contract demand fastest. IFCO Systems has already demonstrated meaningful commercial traction with its expanded tracking deployment, confirming genuine retailer demand exists for this documented visibility. MMA recommends operators without comparable tracking capability invest in it now, before large retailer contracts consolidate around already-established tracking leaders across additional national accounts worldwide, a consolidation that typically accelerates once early tracking wins compound into broader retailer trust.
02 / MULTI-RETAILER POOLING SCALE DEVELOPMENT

Build pooling scale ahead of circulation economics

Retailers continue favoring pooling operators with wider multi-retailer circulation scale, and operators building this scale are winning contract relationships fastest. ORBIS Corporation has already demonstrated meaningful commercial traction through its integrated manufacturing and pooling scale, confirming genuine retailer demand for broader circulation networks. MMA recommends operators without comparable pooling scale invest in it now, before established competitors further consolidate relationships tied to multi-retailer circulation economics across major grocery markets, since retailers rarely revisit an established pooling relationship once a network has proven reliable circulation across an initial contract cycle.
03 / INTEGRATED RECONDITIONING SERVICE DEVELOPMENT

Build reconditioning capability ahead of sanitation demands

Retailers increasingly prefer outsourced crate washing and reconditioning over operating in-house sanitation facilities, and operators offering integrated reconditioning are winning contracts on service breadth rather than pure rental pricing. Schoeller Allibert has already demonstrated meaningful commercial traction through its expanded reconditioning facility network, confirming genuine retailer demand for this integrated service. MMA recommends operators without comparable reconditioning capability invest in it now, while this advantage remains commercially underdeveloped across much of the fragmented pooling operator base, a gap that typically closes only after competitors invest years in comparable reconditioning infrastructure.
04 / WAREHOUSE AUTOMATION FORMAT DEVELOPMENT

Standardize formats ahead of fulfillment center automation

Fulfillment center operators increasingly require crate formats compatible with robotic picking and conveyor automation, and manufacturers offering standardized formats are winning fulfillment center contracts fastest. ORBIS Corporation has already demonstrated meaningful commercial traction through its standardized format line, confirming genuine fulfillment center demand for this compatibility. MMA recommends manufacturers without comparable standardized formats invest in it now, before established competitors further consolidate this fast-growing automation compatibility advantage across major e-commerce fulfillment markets, particularly among fulfillment operators investing heavily in robotic picking systems that demand precise dimensional compatibility.

Engagement Snapshot From the Field

A live engagement with an industry participant carrying material or product regulatory and market exposure ahead of a defining policy shift, showing how our research translates into a defensible multi-year portfolio strategy.
MARKET MINDS ADVISORY · CLIENT ENGAGEMENT SUMMARY
Global Crates Producer Strategic Portfolio Review and Transition Roadmap 2026·Investment Scenario on Global Crates Exposure Evaluation 2025-26
CLIENT PROFILE
The client is a mid-sized North American regional grocery chain generating an estimated one hundred and ten million dollars in annual packaging and logistics spending (client-reported, unverified by MMA), operating across a multi-state distribution network requiring expanded produce and dairy crate capacity. The client faced a decision about whether to transition from owned crate inventory to a pooled fleet rental arrangement.
STRATEGIC CHALLENGE
Rising crate replacement and internal cleaning costs were straining the client's packaging budget, while competing regional grocery chains had already begun transitioning to pooled fleet arrangements and were reporting meaningfully reduced total packaging costs, creating pressure on the client's own budget planning and raising internal questions about its existing crate ownership model.
MMA APPROACH
MMA conducted a structured evaluation of pooled fleet rental options, benchmarking documented tracking performance, available pooling network scale, and total cost of ownership against the client's existing crate inventory and internal washing infrastructure costs. The evaluation incorporated direct site visits to comparable pooled fleet deployments at peer regional grocery chains.
KEY FINDINGS
  1. The client's existing owned crate total cost of ownership, including replacement and internal washing, significantly exceeded pooled fleet rental costs based on comparable volume and distribution footprint.
  2. Projected pooled fleet total cost favored transition across the majority of the client's produce and dairy distribution categories based on documented volume and turnover patterns.
  3. Two of three evaluated pooling operators offered sufficient network scale and documented tracking performance to support the client's multi-state distribution timeline requirements.
  4. The client's phased transition program reportedly reduced total packaging costs by roughly twenty-five percent within the first two years (client-reported, unverified by MMA).
CLIENT PROFILE
The client is a mid-sized North American regional grocery chain generating an estimated one hundred and ten million dollars in annual packaging and logistics spending (client-reported, unverified by MMA), operating across a multi-state distribution network requiring expanded produce and dairy crate capacity. The client faced a decision about whether to transition from owned crate inventory to a pooled fleet rental arrangement.
STRATEGIC CHALLENGE
Rising crate replacement and internal cleaning costs were straining the client's packaging budget, while competing regional grocery chains had already begun transitioning to pooled fleet arrangements and were reporting meaningfully reduced total packaging costs, creating pressure on the client's own budget planning and raising internal questions about its existing crate ownership model.
MMA APPROACH
MMA conducted a structured evaluation of pooled fleet rental options, benchmarking documented tracking performance, available pooling network scale, and total cost of ownership against the client's existing crate inventory and internal washing infrastructure costs. The evaluation incorporated direct site visits to comparable pooled fleet deployments at peer regional grocery chains.
KEY FINDINGS
  1. The client's existing owned crate total cost of ownership, including replacement and internal washing, significantly exceeded pooled fleet rental costs based on comparable volume and distribution footprint.
  2. Projected pooled fleet total cost favored transition across the majority of the client's produce and dairy distribution categories based on documented volume and turnover patterns.
  3. Two of three evaluated pooling operators offered sufficient network scale and documented tracking performance to support the client's multi-state distribution timeline requirements.
  4. The client's phased transition program reportedly reduced total packaging costs by roughly twenty-five percent within the first two years (client-reported, unverified by MMA).
RECOMMENDED STRATEGY
Phase 1: Phase 1 (Weeks 1 to 5): Benchmark pooling operators against tracking performance, network scale, and total cost of ownership. using a standardized scoring framework applied consistently. Phase 2: Phase 2 (Weeks 6 to 10): Validate projected cost savings against the client's specific volume and distribution footprint requirements. incorporating updated data from each candidate operator. Phase 3: Phase 3 (Weeks 11 to 20): Finalize operator selection, complete transition logistics, and begin phased fleet conversion. starting with the highest-volume distribution centers identified during evaluation.
OUTCOME
The client successfully transitioned to a pooled fleet rental arrangement and reduced total packaging costs within the first two years of the program (client-reported, unverified by MMA). The transition also freed capital budget for reinvestment in additional cold chain infrastructure improvements. and leadership has since recommended a comparable evaluation to two peer regional grocery chains facing similar packaging cost pressures.

Frequently Asked Questions

Foundational context covering the market sizes, CAGR, scope, country, region and competition that inform every finding below. This section is provided to cover basics and most often pre-purchase conversations, answered from the MMA Primary Research Dataset.

What is the current size of the Global Crates Market?

The global crates market is valued at approximately $9.8 billion in 2025. Growth is driven by expanding pooled fleet rental adoption alongside continued warehouse automation format standardization.

How large will the Global Crates Market be by 2036?

MMA projects the market will reach approximately $19.4 billion by 2036, roughly 1.9 times its 2026 base value. Foldable and collapsible crates will account for a growing share of that expansion.

What is the CAGR for the Global Crates Market 2026 to 2036?

The market is expected to grow at a compound annual growth rate of 6.4% between 2026 and 2036. Bull and bear scenarios range from 5.2% to 7.6% depending on retailer sustainability mandate pace.

Which segment is growing fastest?

Foldable and collapsible crates are the fastest-growing segment, expanding at roughly 9.2% annually, about 1.4 times the overall market rate. Empty-return shipping efficiency is the primary driver.

Who are the major companies in the Global Crates Market?

ORBIS Corporation, Schoeller Allibert, IFCO Systems, CABKA Group, and Georg UTZ Holding lead global supply, together holding roughly a third of the fragmented global market.

Which country is growing fastest?

India is growing fastest, driven by expanding organized retail and cold chain logistics investment nationwide. Government programs targeting reduced post-harvest produce losses continue reinforcing this growth.

Report Segmentation Architecture

The full report scope spans multiple orthogonal segmentation dimensions, with cross-tabulated demand data provided for each dimension pair. Coverage extends further to regional breakdowns, trend trajectories, and the competitive detail needed to support segment-level decision-making.

By Product Format

  • Stackable Plastic Crates
  • Foldable and Collapsible Crates
  • Bottle and Beverage Crates
  • Produce and Agricultural Crates
  • Industrial Bulk Handling Crates
  • Wood and Metal Specialty Crates

By End-Use Industry

  • Grocery and Food Retail
  • Agriculture and Produce Distribution
  • E-Commerce and Warehouse Fulfillment
  • Beverage and Food Service

By Commercial Dimension

  • Outright Equipment Purchase
  • Pooled Fleet Rental
  • Distributor and Reseller Channels
  • Long-Term Retailer Pooling Contracts

By Region

  • North America
  • Western Europe
  • East Asia
  • South Asia and Pacific
  • Latin America
  • Middle East and Africa
  • Eastern Europe

Scope, Methodology, and Coverage

Every figure in this report is reproducible from documented input assumptions. The scope below maps the historical period, the forecast horizon, the segmentation dimensions, and the countries covered, alongside the underlying primary and qualitative methodology.
Historical Period
2020 to 2025
Forecast Period
2026 to 2036
Base Year
2025 (USD billions; MMA Primary Research Dataset, August 2026)
Market Definition
The global crates market covers reusable and returnable plastic, wood, and metal crates used for the transport, storage, and handling of goods across food and beverage, agriculture, retail, and industrial logistics applications. It excludes single-use corrugated boxes, standalone pallets, and intermediate bulk containers, which are tracked as separate packaging categories.
Quantitative Units
USD billions (current prices); million units shipped annually where applicable
Segmentation Dimensions
By Product Format; By End-Use Industry; By Commercial Dimension; By Region
Regions Covered
North America, Western Europe, East Asia, South Asia and Pacific, Latin America, Middle East and Africa, Eastern Europe
Countries Covered
USA, Canada, Mexico, Germany, Netherlands, UK, France, China, Japan, South Korea, Taiwan, India, Australia, Vietnam, Indonesia, Brazil, Argentina, Saudi Arabia, UAE, South Africa, Poland, Russia, Czech Republic, Hungary, and additional markets relevant to this sector
Key Companies Profiled
ORBIS Corporation, Schoeller Allibert, IFCO Systems, CABKA Group, Georg UTZ Holding, Rehrig Pacific Company, Buckhorn Inc, Nefab Group, DS Smith Plc, Loscam, Craemer Group, Monoflo International, Bekuplast GmbH, SSI Schaefer, Nilkamal Limited, Supreme Industries, Brambles Limited, Rotom Group, Polymer Logistics, Norseman Plastics
Quantitative Methodology
Primary survey, n=3,800 respondents, Q4 2025, six countries; demand-side model with trade association cross-validation
Qualitative Methodology
47 expert interviews, Q4 2025; applied to validate demand model assumptions, identify emerging dynamics, and assess competitive positioning
Report Format
PDF and XLSX data workbook (Word format preview document)
Publisher
Market Minds Advisory
Report Code
MMA-2026-PAC-202
Published
August 2026
Contact
sales@marketmindsadvisory.com | www.marketmindsadvisory.com

Purchase the full Global Crates Market Report (2026 to 2036).

This report delivers a complete assessment of the global crates market across all major product formats, end-use industries, and geographic regions through 2036. It includes competitive profiling of twenty companies and segmentation distinguishing stackable, foldable, beverage, produce, industrial, and specialty crate formats. Regional demand modeling spans all seven MMA-covered geographies. Buyers will find quantified forecasts for market size, segment growth, and regional CAGR alongside analysis of fleet loss rates, resin cost exposure, and pooling versus ownership dynamics. A dedicated revenue lever framework identifies four specific commercial actions operators can take to capture margin as pooled fleet adoption accelerates.
Twenty-company competitive profiling with moat and risk analysis
Seven-region demand model with justified share and CAGR bands
Product format segmentation across six MECE categories
Quantified revenue lever framework for margin capture strategies
Polypropylene and polyethylene resin cost exposure analysis
Anonymized case study on grocery chain pooled fleet transition

Built For The People Who Decide

From boardroom strategy to bench-side execution, this report is read cover-to-cover by leaders shaping the next decade of their industry, turning demand scenarios, market dynamics and valuation benchmarks into decisions.
CXOs/ Presidents/ VPs/ Managers
M&A and Corporate Development
Strategy Teams and R&D Heads
Procurement and Product Directors
Regulatory and Compliance Leaders
Investor Relations and Equity Analysts