Market Minds Advisory
Global Calcium Carbonate Market

Global Calcium Carbonate Market: Calcium Carbonate: Satellite Plant Economics, Surface Treatment Premiums, and Freight That Decides Everything

Building the plant inside the customer's mill removes freight entirely and locks a thirteen-year contract in place. It is the cleverest commercial structure in industrial minerals and it depends on paper nobody prints any more.

Lead Analyst

Bilal Shaikh

Published

August 2026

Make Smarter Decisions with Customized Research Insights

Request a free sample report and evaluate market opportunities, growth trends, and competitive dynamics relevant to your business needs.

2025 MARKET VALUE$26.8BMarket Size 2025
2036 FORECAST VALUE$44.0BBase Case , 2026 to 2036
CAGR 2026 TO 20364.6 %Bull 5.8% / Bear 3.4%
INCREMENTAL OPPORTUNITY$15.9BNet 10- year value creation
EXPANSION MULTIPLE1.57x2036 value over 2026 base
Strategic Levers
M&A Pipeline
Regional Outlook
Country Rankings
Competitive Intelligence
Segmental Deep-dive
Call-Us : 91 93563 13602

Executive Snapshot and Market Trajectory.

Freight is 38% of delivered cost on a mineral selling near 118 dollars a tonne, which means a quarry beside a customer beats any multinational shipping in. That single arithmetic keeps the top five at 24% of a market measured in tens of millions of tonnes.
Commercial advantage belongs to producers who eliminate the freight rather than optimise it, which is precisely what the satellite precipitated plant model does by building inside the customer's own mill on a thirteen-year term. Ultrafine and nano precipitated grades grow fastest at 9.8%, roughly 2.13 times the market. East Asia holds the largest position at 34% of value, above the standard band, on plastics and construction demand.
Concentration stays low because deposit location beats scale in every comparison anybody runs. Surface treatment earns 54% over untreated grades and requires processing beyond grinding. Paper takes 31% of volume and is moving in two directions at once, which the satellite model was never designed to accommodate. Producers weighted toward graphic mills face declining volume while those serving board see growth, and a satellite plant cannot be relocated anywhere at all afterwards.
Market Definition
The market comprises calcium carbonate products supplied to industrial and consumer applications, covering standard ground calcium carbonate, slurry ground calcium carbonate, precipitated calcium carbonate, surface-treated grades, ultrafine and nano precipitated grades, and food, pharmaceutical or pharmacopoeia grades. Value is measured at producer level including satellite plant supply. Quicklime and hydrated lime, cement and aggregate, dolomite sold as a separate mineral, agricultural liming materials, and downstream paper, plastic, or paint manufacture fall outside scope.
Base Year Value
$26.8B in 2025 (MMA Primary Research Dataset, August 2026)
Forecast Period
2026 to 2036, eleven discrete annual values
CAGR
4.6% base case. Bull 5.8%. Bear 3.4%.
Fastest Growth Segment
Ultrafine and Nano Precipitated Grades: 9.8% CAGR
Fastest Growth Country
India: 7.8% CAGR
Fastest Growth Region
South Asia and Pacific: 6.8% CAGR
Largest Region
East Asia: 34% of 2025 global value
Market Leaders
Omya, Imerys, Minerals Technologies, Sibelco, and Huber Engineered Materials lead on calcium carbonate production revenue. Source: company annual reports and MMA Analysis, July 2026.
Primary Survey
n=3,800 procurement and R&D decision-makers, Q4 2025, six countries
Methodology
Demand-side build-up, cross-validated against public data, 47 expert interviews

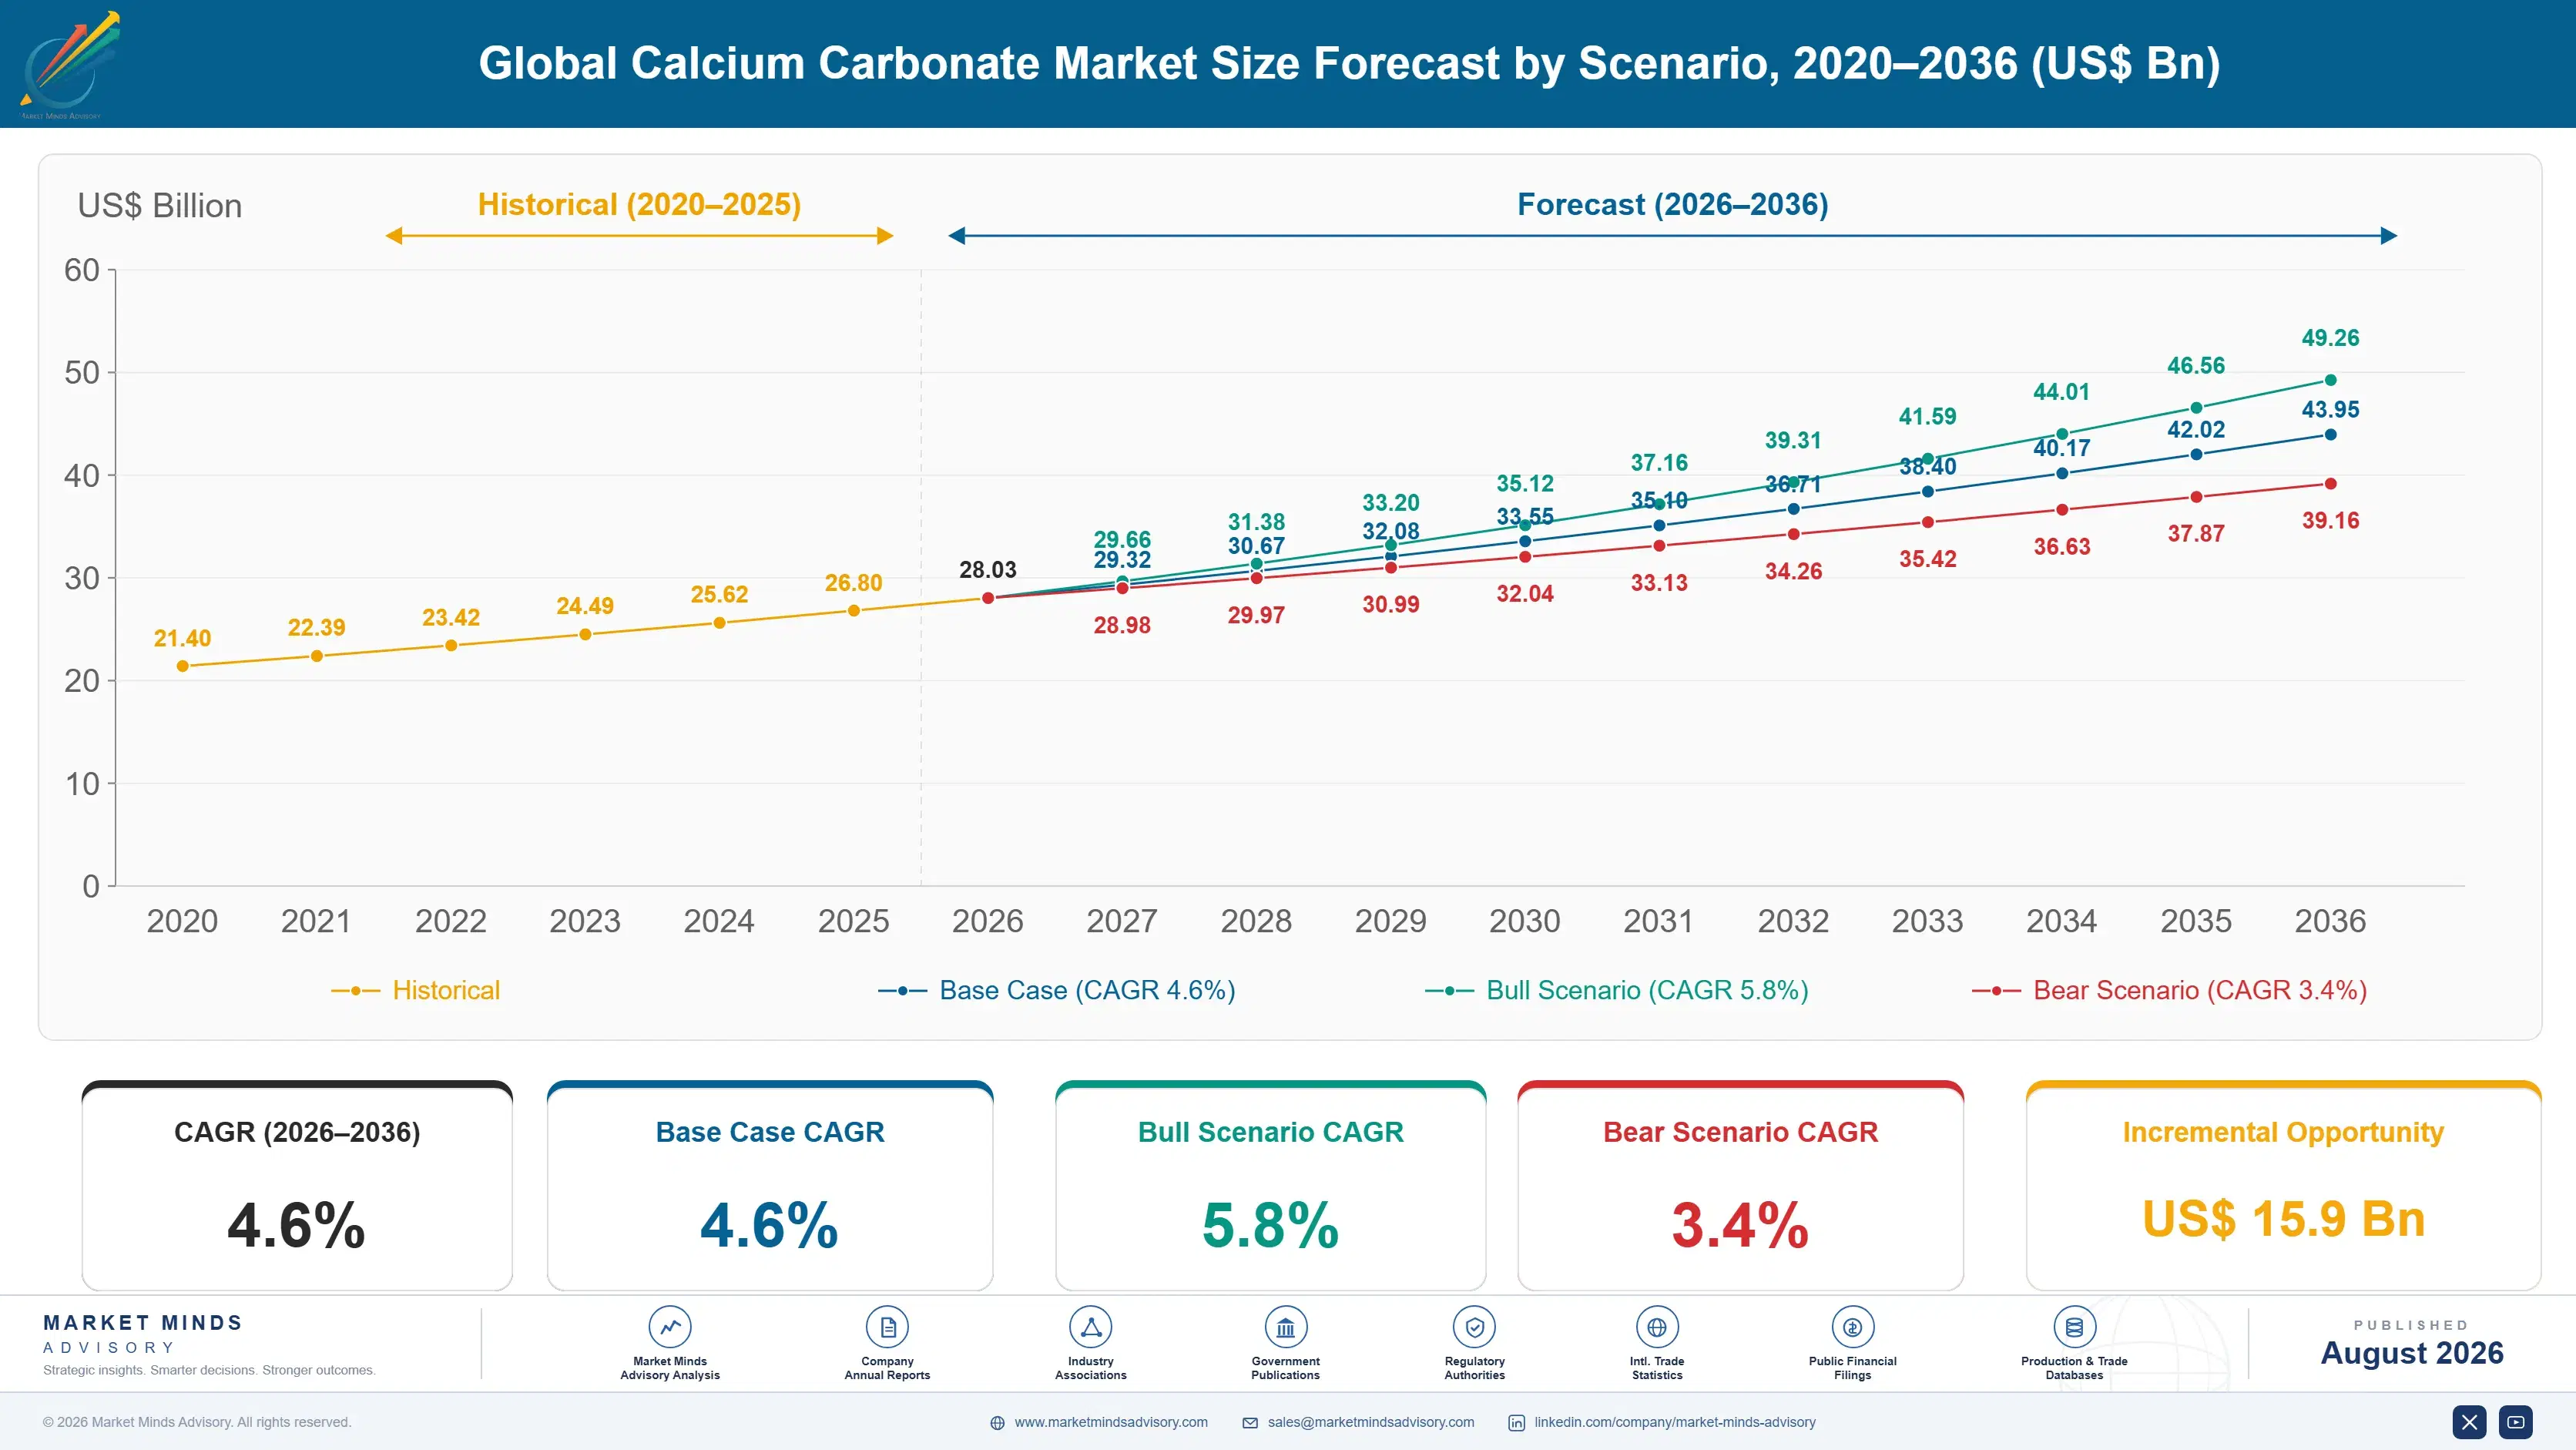
Global Calcium Carbonate Market Forecast Scenarios

global-calcium-carbonate-market-trends-size-forecast-scenario-1787551151874
Between 2020 and 2025 paper demand split in two directions and dragged the product mix with it. Graphic paper kept declining under digital substitution while packaging board grew steadily, and precipitated grades weighted toward graphic filling felt that directly. Plastics and construction demand held up better. The 3.8% historical rate combines a mature volume market with genuine mix improvement toward treated and specialty grades underneath it.
The 4.6% base case rests on three mechanisms. Surface-treated grades keep taking share in plastics as compounders substitute filler for resin at rising polymer prices. Food, pharmaceutical, and supplement demand grows on population and dietary calcium consumption independent of any industrial cycle. And packaging board expansion continues offsetting graphic paper decline in the filler and coating applications that carry most volume. None of the three depends on graphic paper stabilising anywhere.
The 5.8% bull case assumes polymer prices stay high enough to keep pulling filler substitution while packaging growth accelerates. The 3.4% bear case reflects graphic paper decline running faster than packaging offsets it, construction weakness across China and Europe, and freight cost increases squeezing producers whose delivered radius was already at its practical limit. Freight economics sit under both cases unchanged.

Where the Quarry Sits Decides Everything

Every commercial question in this market resolves back to freight. At 38% of delivered cost on material realising around 118 dollars a tonne, transport eats the margin before a producer has travelled far, which is why concentration sits at 24% across a market measured in tens of millions of tonnes. A quarry beside a customer wins, and no amount of manufacturing scale changes that.
TOP-FIVE CONCENTRATION24%Combined share of output held by the largest producing companies
FREIGHT COST SHARE38%Portion of delivered cost attributable to transport alone
AVERAGE REALISED PRICEUSD 118 per tonneBlended across ground, precipitated, and treated product grades
SATELLITE PLANT CONTRACT LENGTH13 yearsTypical term for an on-site precipitated plant agreement
SURFACE TREATMENT PREMIUM54%Uplift commanded over untreated ground grades of equivalent fineness
PAPER APPLICATION SHARE31%Portion of volume entering paper filling and coating applications
The satellite precipitated plant is the industry's answer and it is genuinely elegant. A producer builds a plant inside a paper mill, uses the mill's own carbon dioxide from its lime kiln, and supplies slurry across the fence with no freight at all. Contracts run around thirteen years. Nothing else in industrial minerals locks a customer in comparably, and the model built one company's entire position.
Surface treatment is where the other value sits. Coating ground carbonate with stearate makes it disperse in polyolefins rather than agglomerating, which is what allows a compounder to replace resin with filler at all. Treated grades earn 54% over untreated equivalents and need processing capability beyond grinding. Deposit whiteness then decides which applications a producer can even attempt.
"The satellite model was the best commercial idea this industry ever had and it was bolted to graphic paper, which is disappearing. Watching those thirteen-year contracts run out against mills that may not exist is the most interesting thing happening in industrial minerals."
Practice Director, Industrial Minerals and Functional Fillers · MMA Industrial Minerals Practice · August 2026

Market Trends

Satellite Plant Model Faces Its Graphic Paper Exposure

Building a precipitated plant inside a paper mill removes freight entirely and locks a customer for around thirteen years, which is the most durable commercial structure industrial minerals has produced. It was built around graphic paper filling, and graphic paper keeps declining under digital substitution. Contracts running out against mills that may close leave stranded assets nobody can relocate. Producers are working to convert satellite capacity toward packaging board and non-paper applications with mixed success so far. Plant configuration decides whether conversion is possible at all, and it varies enormously between installations.
Market Impact: Paper takes 31% of total volume
Filler Substitution Rises With Polymer Pricing

Compounders replace resin with surface-treated carbonate whenever polymer prices justify it, and treated grades disperse properly in polyolefins where untreated material simply agglomerates and ruins the part. That substitution has deepened as polymer costs rose, and loadings that would once have been unacceptable are now routine in pipe, film, and moulded goods. Treated grades earn 54% over untreated equivalents. Processing capability beyond grinding is what separates producers who capture that from those who supply the base mineral. Loadings that would once have been rejected on mechanical grounds are now routine in several applications.
Market Impact: East Asia holds 34% of value

Market Opportunities and Growth Drivers

Packaging Board Growth Offsets Graphic Paper Decline

Paper takes 31% of volume and the two halves of it are moving in opposite directions, with packaging board expanding on parcel and food service demand while graphic grades keep contracting. Filler and coating requirements differ between them, and board generally uses less filler per tonne than fine paper did. Producers weighted toward graphic mills face declining volume while those serving board see growth. The transition is uncomfortable rather than catastrophic for most of the industry. Producers weighted toward graphic mills are managing decline while those serving board are adding capacity, occasionally within the same company.
Market Impact: Freight is 38% of delivered cost

Asian Plastics and Construction Anchor Volume Growth

Chinese and Indian plastics compounding, construction sealants, and paint manufacture consume enormous carbonate volumes, and both continue expanding while developed market demand plateaus. India grows fastest of any country at 7.8% as domestic compounding and construction activity build out simultaneously. East Asia holds 34% of value, above the standard band, on manufacturing concentration rather than any pricing advantage. Domestic producers supply nearly all of it, since freight economics exclude imports almost entirely. Surface treatment capability lags demand across much of the region, which leaves treated grade requirements partly served by imports despite the freight penalty involved.
Market Impact: Treated grades reach 54% uplift

Market Restraints and Challenges

Freight Caps the Radius Any Producer Can Serve

Transport at 38% of delivered cost on material worth around 118 dollars a tonne means a producer competes only within a tight radius of its quarry, and no operating improvement extends that boundary meaningfully. The root cause is simply mass against value. Producers mitigate by siting plants near customer clusters rather than near the best deposits, by shipping slurry where water content is acceptable to the customer, and by concentrating distant sales on treated and specialty grades whose value per tonne tolerates the haul. Position beats reserves in this business every single time.
Market Impact: Contracts run around 13 years

Deposit Whiteness Determines Which Applications Are Reachable

Marble-derived carbonate is whiter than most limestone and chalk, and brightness decides whether a producer can supply paper coating, white plastics, and paint at all rather than only filling applications where colour is irrelevant. The root cause is geology, which no processing fully corrects. Producers mitigate through beneficiation and magnetic separation to remove coloured impurities, through blending across deposits, and by matching each quarry to the applications its brightness genuinely supports rather than chasing all of them. Marketing a deposit into applications its brightness cannot support wastes effort and costs technical credibility.
Market Impact: Treated grades earn 54% premium
4 additional market trends, 3 additional growth drivers, and 2 additional restraints and challenges are covered in the full report. Contact sales@marketmindsadvisory.com to access the complete intelligence.

Segment CAGR and Growth Architecture

Segmentation follows product form and processing level, because particle size, surface chemistry, and purity together determine which applications a grade can serve and what it realises per tonne. Six grades cover commercial supply, and the divide between run-of-quarry ground material and processed treated or precipitated product matters far more commercially than the distinction between limestone and marble sources.
global-calcium-carbonate-market-trends-market-share-analysis-1787551152405

Ultrafine and Nano Precipitated Grades

The fastest grade at 9.8%, roughly 2.13 times the market, covering precipitated material engineered to controlled particle size and morphology well below what grinding can achieve. Applications include high-gloss coatings, sealants requiring rheology control, specialty polymer compounds, and printing inks. Producing consistent morphology at that scale requires precise control of carbonation conditions rather than better milling equipment. Value per tonne runs several times standard ground material, and freight tolerance improves correspondingly. Very few producers hold the process capability at commercial scale in any region. Precipitation reagent cost and carbonation control both scale badly with fineness, which is why the grade stays scarce despite obvious demand from coatings and sealant formulators everywhere.
CAGR 9.8%

Food, Pharmaceutical and Pharmacopoeia Grades

Second fastest at 8.4%, serving calcium supplements, antacids, food fortification, and pharmaceutical excipient use under purity and documentation standards no industrial grade approaches. Heavy metal limits, microbiological control, and manufacturing documentation all sit well beyond what a filler operation maintains. Demand follows population, dietary supplementation, and ageing rather than any industrial cycle, which makes it usefully uncorrelated with everything else in this portfolio. Qualification with a pharmaceutical customer runs long and holds afterwards, and very few quarries can meet the purity requirement at all. Documentation and manufacturing controls generally take longer to establish than the material qualification itself, which surprises producers approaching this from an industrial filler background for the first time.
CAGR 8.4%
Full segment breakdown across 6 segments available in the complete report.

Regional Architecture and Country Demand Map

Regional shares follow paper, plastics, and construction activity within each producer's freight radius rather than any global trade pattern. East Asia sits above the standard band for the reason stated below, and every other region falls inside its range. Global trade barely exists on standard grades.

North America

Satellite precipitated plants inside paper mills are more established here than anywhere, and graphic paper mill closures have stranded several of them in exactly the way the model always risked. Packaging board growth has absorbed some of that capacity and not all of it. Plastics compounding and construction sealant demand provide steadier volume. Minerals Technologies, Imerys, Huber, and Mississippi Lime hold established regional positions. Growth of 4.4% depends on packaging and plastics offsetting a graphic paper decline that shows no sign of slowing at all. Slurry supply by tanker into paper and paint operations is more established here than in most regions, which removes packaging and redispersion cost the customer would otherwise carry itself.
Share: 22% | CAGR: 4.4% (2026 to 2036)

Western Europe

Marble deposits in Italy, Austria, and Norway give the region the whitest carbonate available anywhere, which supports paper coating, white plastics, and paint applications that darker limestone simply cannot serve. Omya built its position on exactly that geology. Graphic paper decline has been steeper here than in most regions and mill closures have followed. Energy costs pressure grinding economics, which are genuinely power intensive. Growth of 3.4% is the slowest anywhere, held back by paper decline and industrial demand that has not recovered since the energy shock. Pharmacopoeia and food grade production is concentrated here on deposits clean enough to meet heavy metal limits, which is a geological accident rather than any deliberate industrial policy.
Share: 19% | CAGR: 3.4% (2026 to 2036)
Regional intelligence for 5 additional markets available in the complete report: East Asia, South Asia and Pacific, Latin America, Middle East and Africa, Eastern Europe. Contact sales@marketmindsadvisory.com.
global-calcium-carbonate-market-trends-country-cagr-analysis-1787551152918

Four Moves Worth Real Capital

Advantage here comes from removing freight rather than managing it, from processing beyond grinding, and from applications where value per tonne finally tolerates a haul. Four moves justify capital across the forecast period, and the first is the structure that built this industry's most durable customer relationships. Reserves appear nowhere among the four at all.

Convert satellite capacity toward packaging and non-paper

Satellite precipitated plants inside paper mills remove freight entirely and lock customers for around thirteen years, which no other arrangement in industrial minerals matches. They were built around graphic paper, and graphic paper keeps declining while packaging board grows. Converting existing satellite capacity toward board grades and non-paper applications preserves an asset that cannot be relocated at any cost. Producers waiting for contract expiry to address this will be negotiating from a stranded plant. Conversion typically costs 15 to 25% of original plant capital where configuration permits it, which is trivial against writing the asset off entirely.
Market Impact: Protects assets sitting on 13-year supply contracts today

Build surface treatment beyond grinding capability

Stearate coating makes ground carbonate disperse in polyolefins rather than agglomerating, which is what permits a compounder to substitute filler for resin at all, and treated grades earn 54% over untreated equivalents of the same fineness. Polymer prices have deepened that substitution considerably. Producers who only grind supply a base mineral into somebody else's treatment operation and capture none of the premium. The processing investment is modest against the realised price difference. Compounders importing treated grades from hundreds of kilometres away are paying freight a local treatment investment would remove entirely for both parties.
Market Impact: Captures the entire 54% surface treatment premium available

Match each quarry to what its brightness supports

Deposit whiteness decides whether an operation can serve paper coating, white plastics, and paint or only filling applications where colour is irrelevant, and no processing fully corrects the geology. Producers chasing every application from a deposit that cannot support them waste sales effort and lose credibility. Matching quarries deliberately to reachable applications, and using beneficiation only where it genuinely helps, concentrates commercial effort where it converts rather than spreading it thin. Brightness below roughly 90 on the standard scale closes paper coating and white plastics entirely, and no beneficiation reliably recovers the difference.
Market Impact: Reaches applications well beyond the 31% in paper

Push specialty grades beyond the freight radius

Freight at 38% of delivered cost confines standard grades to a tight radius around a quarry, and no operating improvement moves that boundary at all. Ultrafine precipitated and pharmacopoeia grades realise several times standard pricing, which means the same haulage represents a far smaller share of delivered cost and the reachable market expands accordingly. Those grades grow at 9.8% and 8.4% respectively. Very few producers hold the process capability at commercial scale. Sales incentives measuring tonnage rather than contribution are usually what push standard grades past the boundary where freight destroys the margin entirely.
Market Impact: Escapes a freight burden reaching 38% of cost

Who Controls the Margin Pool

Concentration is very low at roughly 24% for the top five on production revenue, and freight economics rather than any failure of consolidation explain all of it. Omya built the broadest international position on marble deposits and surface treatment depth. Imerys spans many minerals with carbonate among them, Minerals Technologies pioneered and still leads the satellite precipitated model, Sibelco holds strong European positions, and Huber is established in North American specialty grades.
Competition runs on three dimensions. Quarry location relative to customer clusters is the first and it is close to absolute. Processing capability beyond grinding is the second, since treatment and precipitation are where the premium sits. Deposit whiteness is the third, and it is entirely a matter of geology nobody can acquire through investment.

Pressure is building from two directions. Graphic paper decline is eroding the application that satellite plants and precipitated grades were built around. Regional producers everywhere serve their own clusters at delivered costs no international operator can approach. Rankings will shift toward producers holding treatment capability and specialty process depth rather than toward whoever quarries the most tonnage. Tonnage quarried has never been the useful measure here.
global-calcium-carbonate-market-trends-company-positioning-matrix-1787551153434

Competitive Moat and Risk Dimensions

OMYA

Moat: Marble deposits and treatment depth

Omya holds marble deposits producing brightness that most limestone and chalk operations cannot approach, which opens paper coating, white plastics, and paint applications closed to darker material. Surface treatment capability across many sites converts that geology into the premium grades the market actually pays for. Deposit quality of that kind cannot be acquired by anybody through capital investment at all.
OMYA

Risk: European graphic paper exposure

Paper coating built on high-brightness carbonate has been a core European application and graphic paper decline there has been steeper than in most regions, with mill closures following. Packaging board uses less filler per tonne and often accepts lower brightness. Redirecting that capacity toward plastics and paint means competing where whiteness matters less and freight matters just as much.
MINERALS TECHNOLOGIES

Moat: Satellite precipitated plant model

Building precipitated plants inside customer paper mills removes freight completely, uses the mill's own carbon dioxide, and locks contracts running around thirteen years, which is the most durable customer relationship this industry has ever constructed. The model produced a position competitors have never successfully replicated at comparable scale. Switching costs are close to prohibitive once a plant is installed.
MINERALS TECHNOLOGIES

Risk: Stranded satellite asset exposure

Satellite plants cannot be relocated and were built predominantly around graphic paper filling, which keeps declining as digital substitution continues without any sign of stabilising. A mill closure strands the plant inside it entirely. Converting capacity toward packaging board and non-paper applications is possible in some cases and impossible in others, depending on plant configuration.

Players Tracked

Prominent Players

Omya
Imerys
Minerals Technologies
Sibelco
Huber Engineered Materials

Other Key Players

Carmeuse
Lhoist
Mississippi Lime
Nordkalk
Schaefer Kalk
Maruo Calcium
Shiraishi Kogyo
Gulshan Polyols
20 Microns
Fimatec
Provencale
Calcinor
Cales de Llierca
GCCP Resources
Great Lakes Calcium

Recent Developments

FEBRUARY 2025

Satellite plant converts from graphic filling to board coating

A precipitated calcium carbonate satellite plant inside a paper mill was reconfigured to supply packaging board coating after the mill converted its own production away from graphic grades. Plant configuration permitted the change, which is not the case at every satellite installation anywhere. Others cannot convert.
Signal: Satellite conversion is possible at some plants and impossible at others, which decides who strands assets
JUNE 2025

Compounder raises filler loading as polymer pricing climbs

A pipe extrusion compounder increased surface-treated carbonate loading substantially in response to polymer costs, reaching levels that would have been considered unacceptable for mechanical performance only a few years earlier. Treatment quality determined whether the higher loading worked at all. Mechanical properties held up throughout testing.
Signal: Filler substitution deepens with polymer pricing, and surface treatment quality decides how far it can actually go
OCTOBER 2025

Producer qualifies pharmacopoeia grade at existing quarry

A regional producer completed qualification of a pharmacopoeia grade from an existing deposit after heavy metal testing confirmed the purity requirement could be met without additional beneficiation. Documentation and manufacturing controls took considerably longer to establish than the material qualification itself. Additional beneficiation was not required anywhere.
Signal: Deposit purity opens pharmacopoeia grades that documentation systems rather than the geology itself then gate afterwards

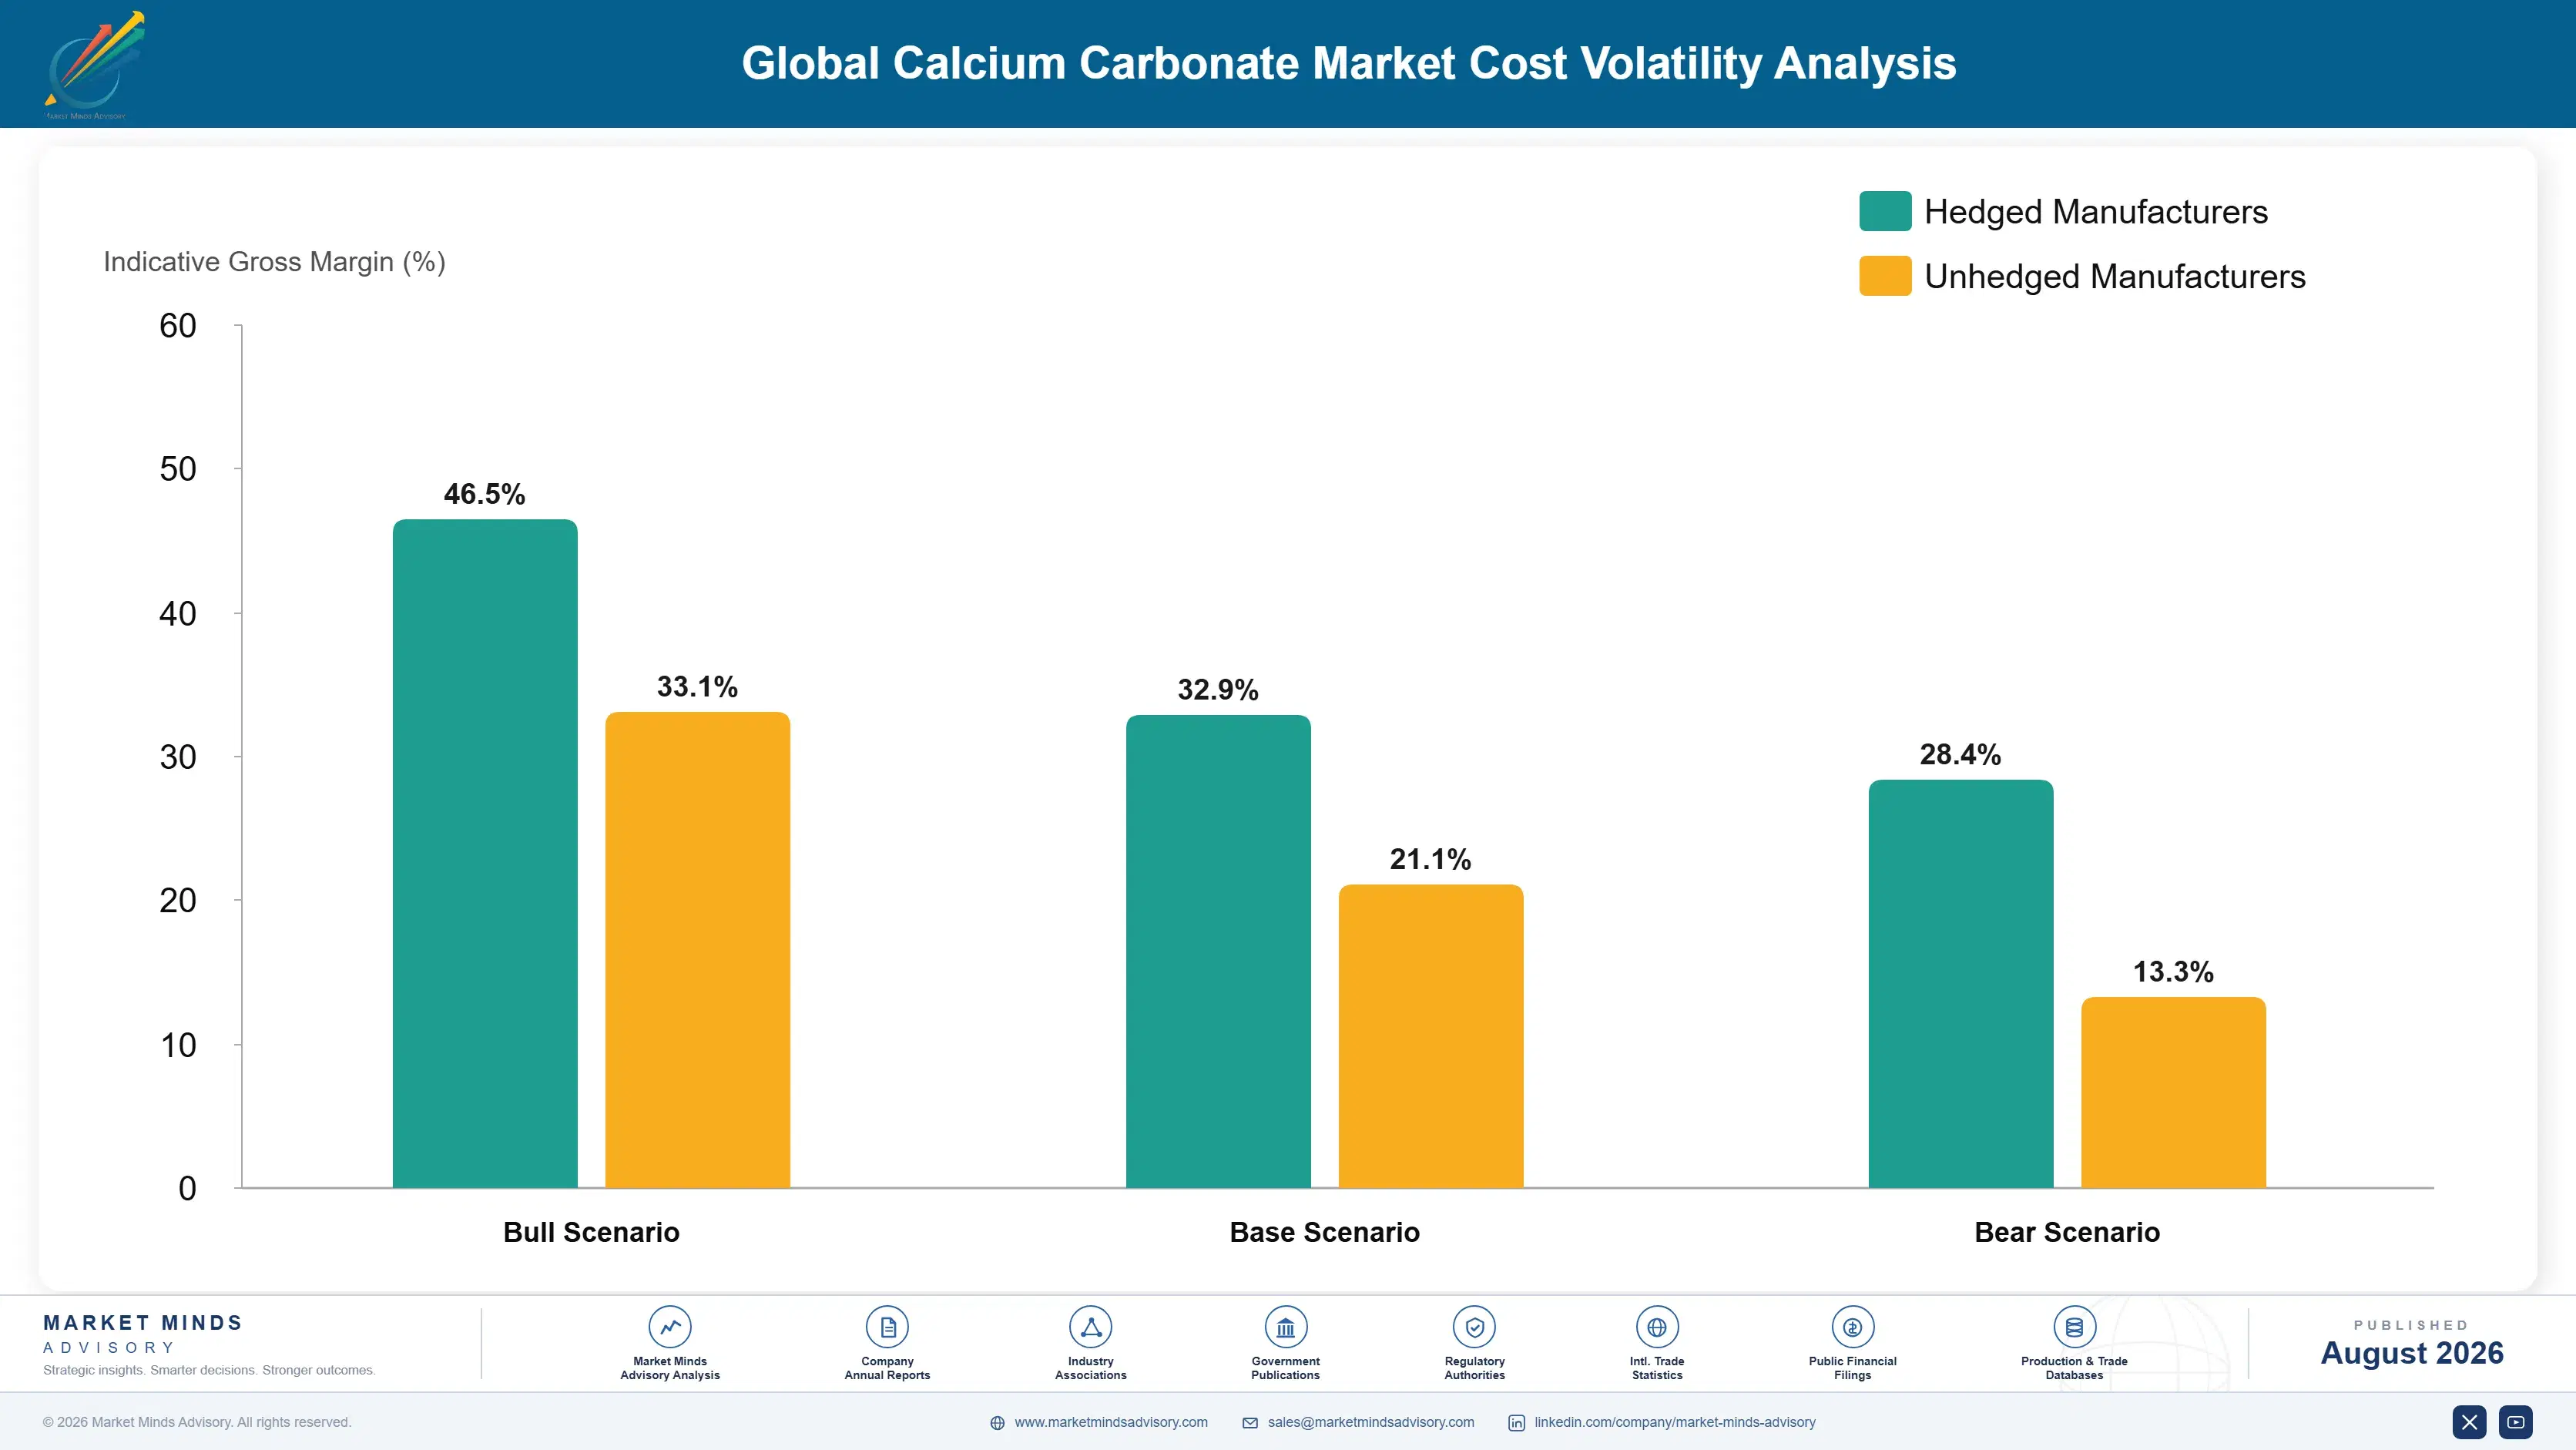
What Delivered Cost Contains

Freight dominates at roughly 38% of delivered cost, moving by road, rail, or barge depending on distance and access, and it is the reason quarry location beats every other variable. Grinding and classification energy takes a further 22% and is genuinely power intensive at fine particle sizes. Quarrying, crushing, and site operations absorb 17%. Treatment chemistry and precipitation reagents add cost only on processed grades.
European electricity prices moved sharply through 2022 and into 2023, and grinding economics suffered disproportionately because reducing particle size consumes power almost without limit. Omya and Imerys both discussed energy cost pressure and pricing recovery in their reporting for those years. Road haulage rates moved separately on driver availability and fuel, which hit producers serving the edge of their economic radius hardest of all. Slurry supply avoided part of that.

Exposure divides on freight distance and grade mix, not scale. A producer serving customers within a short radius carries modest transport exposure whatever its size. One shipping to the boundary of its economic reach carries the full weight of haulage rate movement. Treated and precipitated grades realising several times standard pricing absorb both energy and freight movement comfortably, while run-of-quarry material has no cushion.
global-calcium-carbonate-market-trends-cost-volatility-analysis-1787551153630

Route grades by value against haulage distance

Standard ground material at around 118 dollars a tonne cannot travel far before freight at 38% of delivered cost removes the margin entirely. Treated, precipitated, and pharmacopoeia grades realising several times that tolerate considerably longer hauls. Routing commodity output to nearby customers and reserving distant accounts for high-value grades is straightforward and remarkably few producers do it deliberately.

Index supply agreements to electricity references

Grinding at 22% of delivered cost consumes power almost without limit as particle size falls, and annual customer agreements priced firm transfer that whole exposure to the producer. Indexation to published electricity references removes the mismatch. Customers facing the same exposure through every alternative supplier accept it more readily than commercial teams generally anticipate.

Ship slurry where the customer can accept water

Transporting dry powder means hauling packaging and handling dust, while slurry moves by tanker straight into a customer's process where the water is acceptable. Paper mills and paint plants frequently can accept it and never get offered the option. Slurry also removes the redispersion step, which is worth something to the customer beyond the freight arithmetic itself.

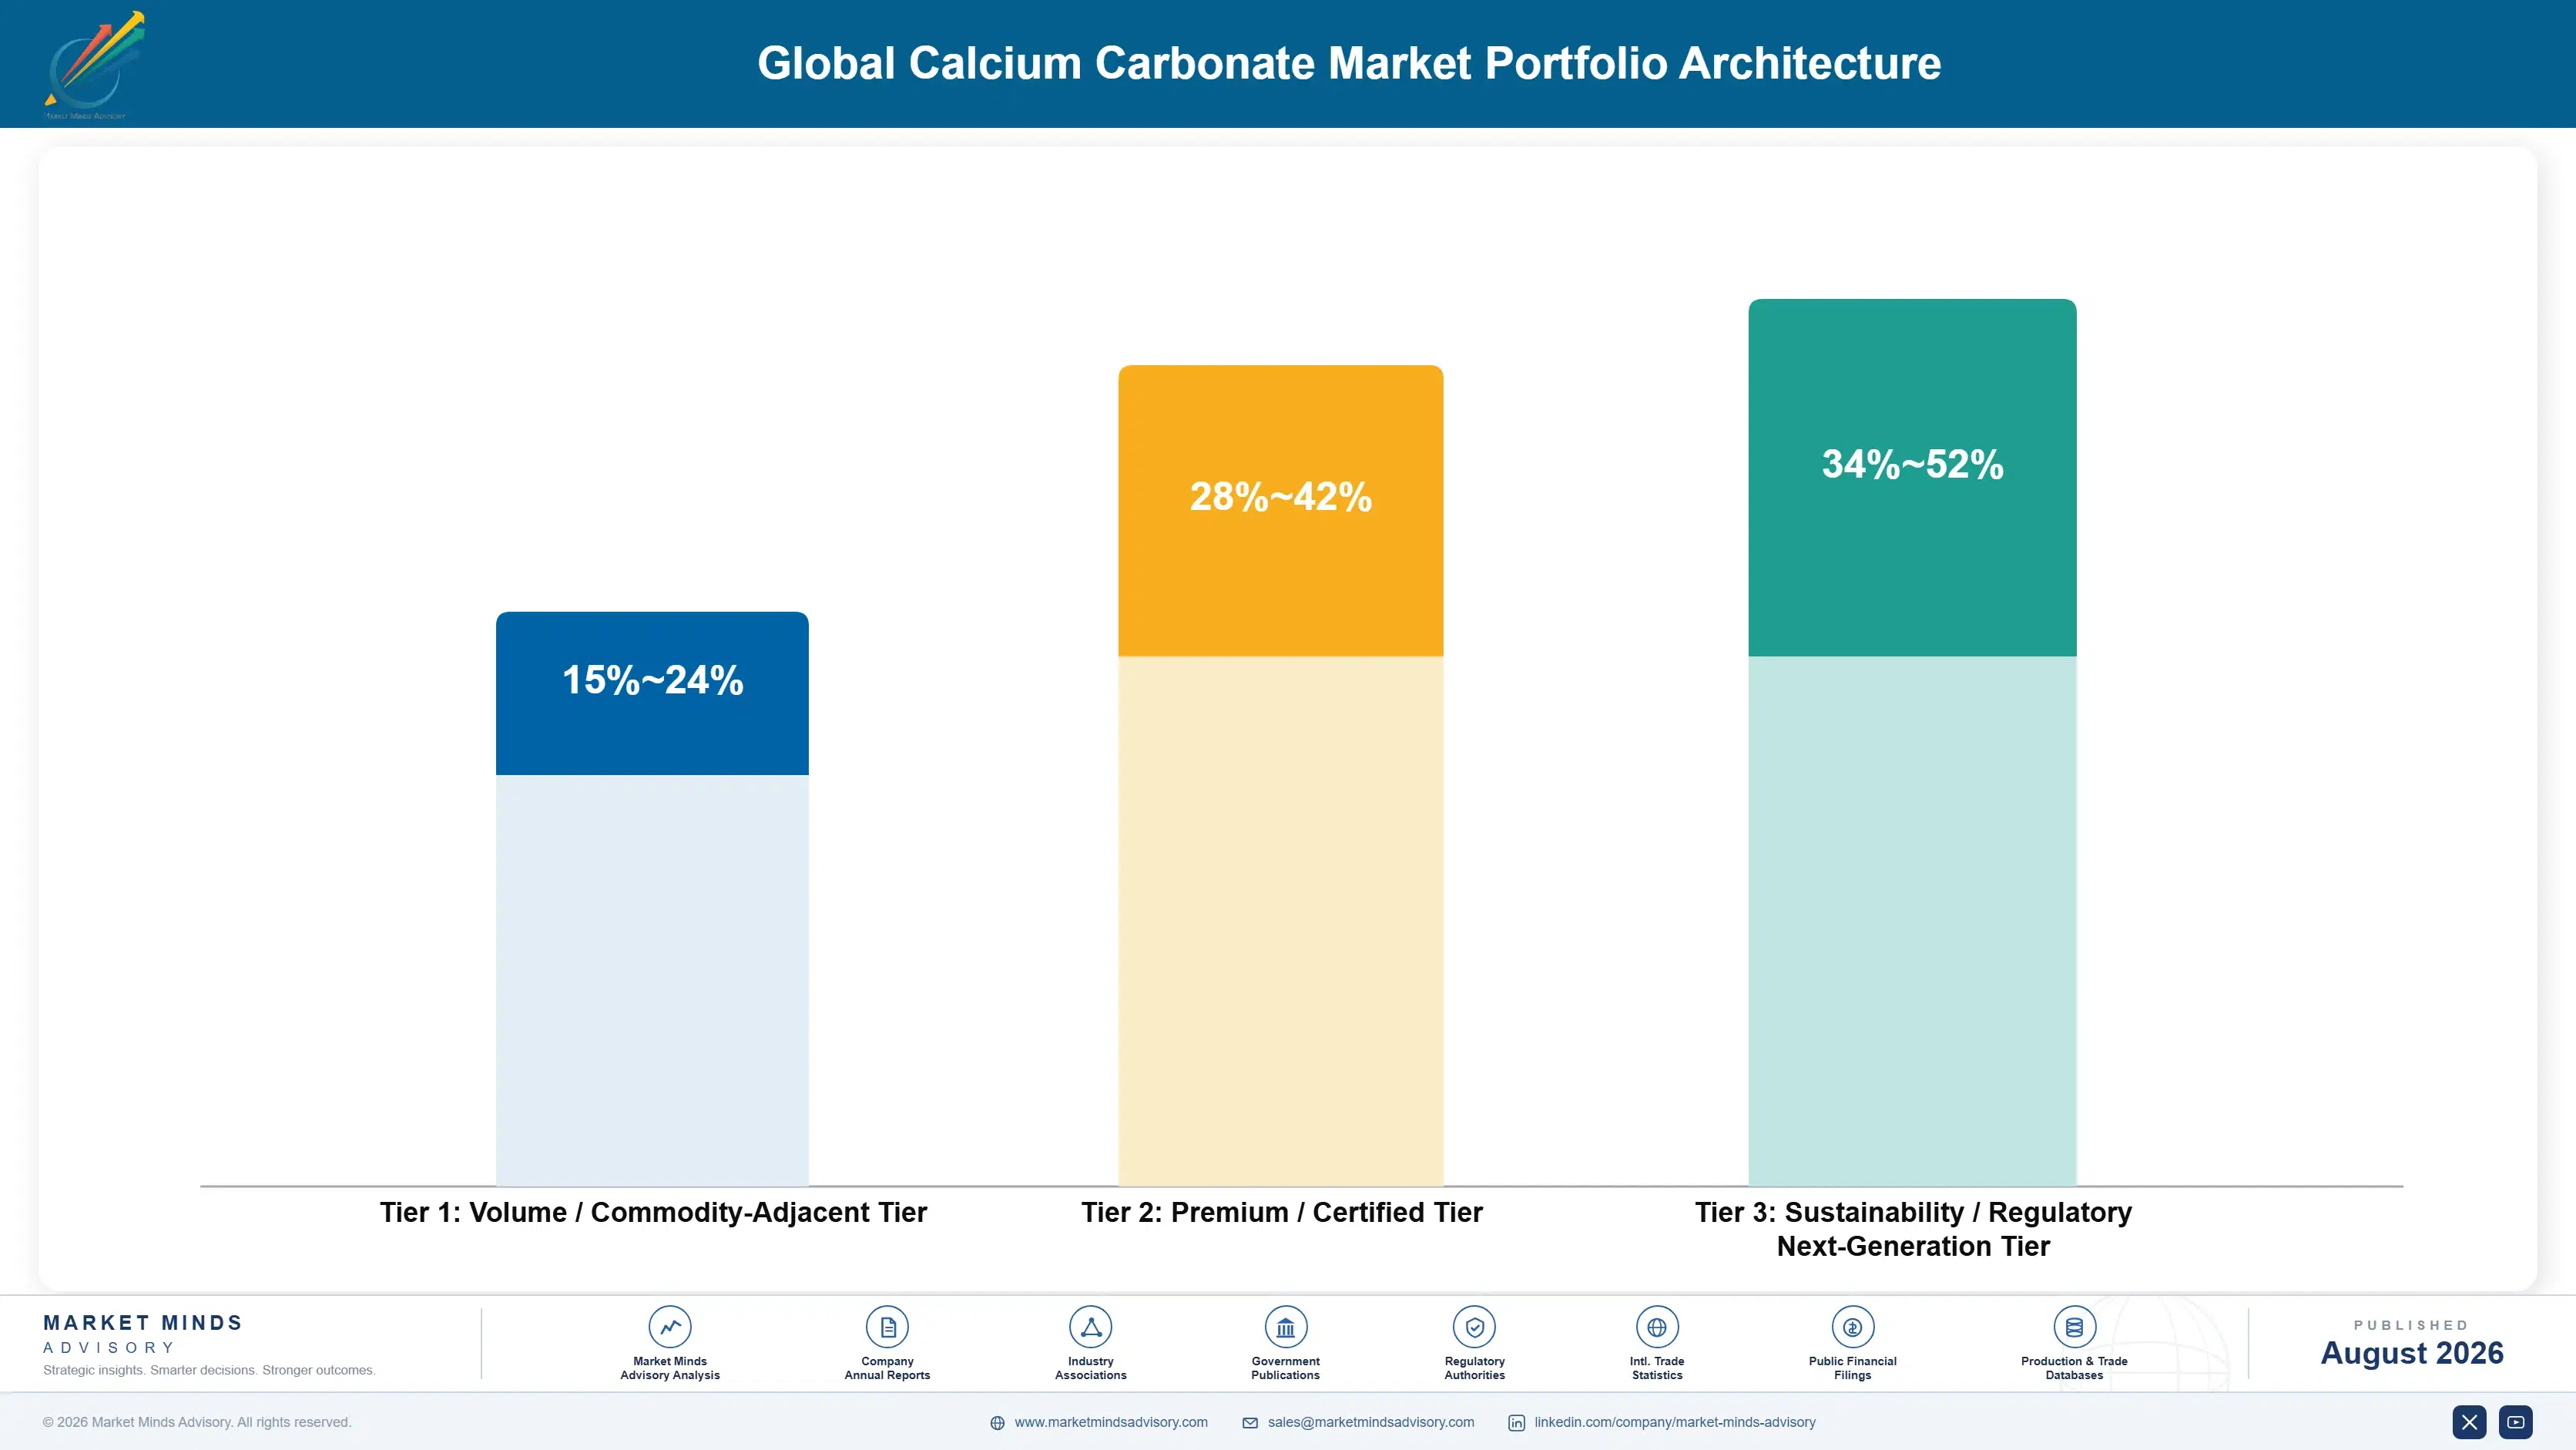
Portfolio Architecture for Margin Defence

Margin architecture follows processing depth rather than reserves, which almost every producer holds in abundance. Run-of-quarry ground material competes on delivered cost inside a tight radius and earns very little for anybody. Surface-treated grades earn 54% more on processing capability. Precipitated and ultrafine material earns considerably more again, and pharmacopoeia grades earn most because so few deposits and documentation systems can reach them at all.
The volume and premium tension is really a question about capital. A quarry can ship tonnage profitably enough with crushing and screening alone and nothing more. Reaching treated, precipitated, and pharmaceutical grades requires classification, coating, carbonation, and quality systems that turn a mining operation into a processing business. Plenty of producers never make that transition and compete on freight radius forever. That transition is a different business entirely.

High-value pools concentrate in surface-treated grades for polymer compounding, ultrafine precipitated material, and pharmacopoeia supply behind purity and documentation barriers. Each is defended by processing capability or deposit purity rather than by quarry ownership, which is why concentration remains at 24% while realised margins differ by a factor of several between operations. Quarry ownership confers remarkably little on its own.

Volume / Commodity-Adjacent Tier

Standard ground carbonate into filling applications where colour is irrelevant and delivered cost decides everything. Freight radius bounds the addressable market absolutely. Reserves confer no advantage because almost every producer holds plenty of them.
Gross Margin: 15%-24%

Premium / Certified Tier

Surface-treated grades for polymer compounding and coating applications requiring specified brightness, particle distribution, and dispersion behaviour. Processing capability rather than geology defends this. The range reflects wide variation in treatment sophistication between producers.
Gross Margin: 28%-42%

Sustainability / Regulatory / Next-Generation Tier

Ultrafine precipitated grades, pharmacopoeia and food material, and satellite plant supply removing freight entirely. Process control, purity, and contract structure all defend pricing. The range is wide because satellite and pharmaceutical economics differ completely from each other.
Gross Margin: 34%-52%
global-calcium-carbonate-market-trends-portfolio-architecture-1787551154141

High-value Sub-segments and Strategic Watch-out

Surface-Treated Polymer Grades

Earning 54% over untreated equivalents because treatment is what permits a compounder to substitute filler for resin at all, and polymer pricing keeps deepening that substitution across pipe, film, and moulded goods. Processing capability rather than deposit quality alone decides who captures any of it.
Gross Margin: 30%-42%

Pharmacopoeia and Food Grades

Growing at 8.4% on demand that follows population and supplementation rather than any industrial cycle, gated by deposit purity and documentation systems that very few filler operations have ever maintained. Documentation systems generally take rather longer to establish than the material qualification itself ever takes.
Gross Margin: 38%-52%

Ultrafine Precipitated Material

Growing at 9.8% on morphology control that requires precise carbonation rather than better milling, with value per tonne high enough that freight stops bounding the reachable market meaningfully at all. Reagent cost and carbonation control both scale badly with fineness, which keeps the supply scarce.
Gross Margin: 36%-50%

Standard Ground Filling Grades

The strategic watch-out. Freight at 38% of delivered cost bounds the radius absolutely, regional producers serve their own clusters better than anybody, and reserves confer no advantage whatsoever here. Sales incentives measuring tonnage rather than contribution keep on pushing volume well past that profitable boundary.
Gross Margin: 15%-24%

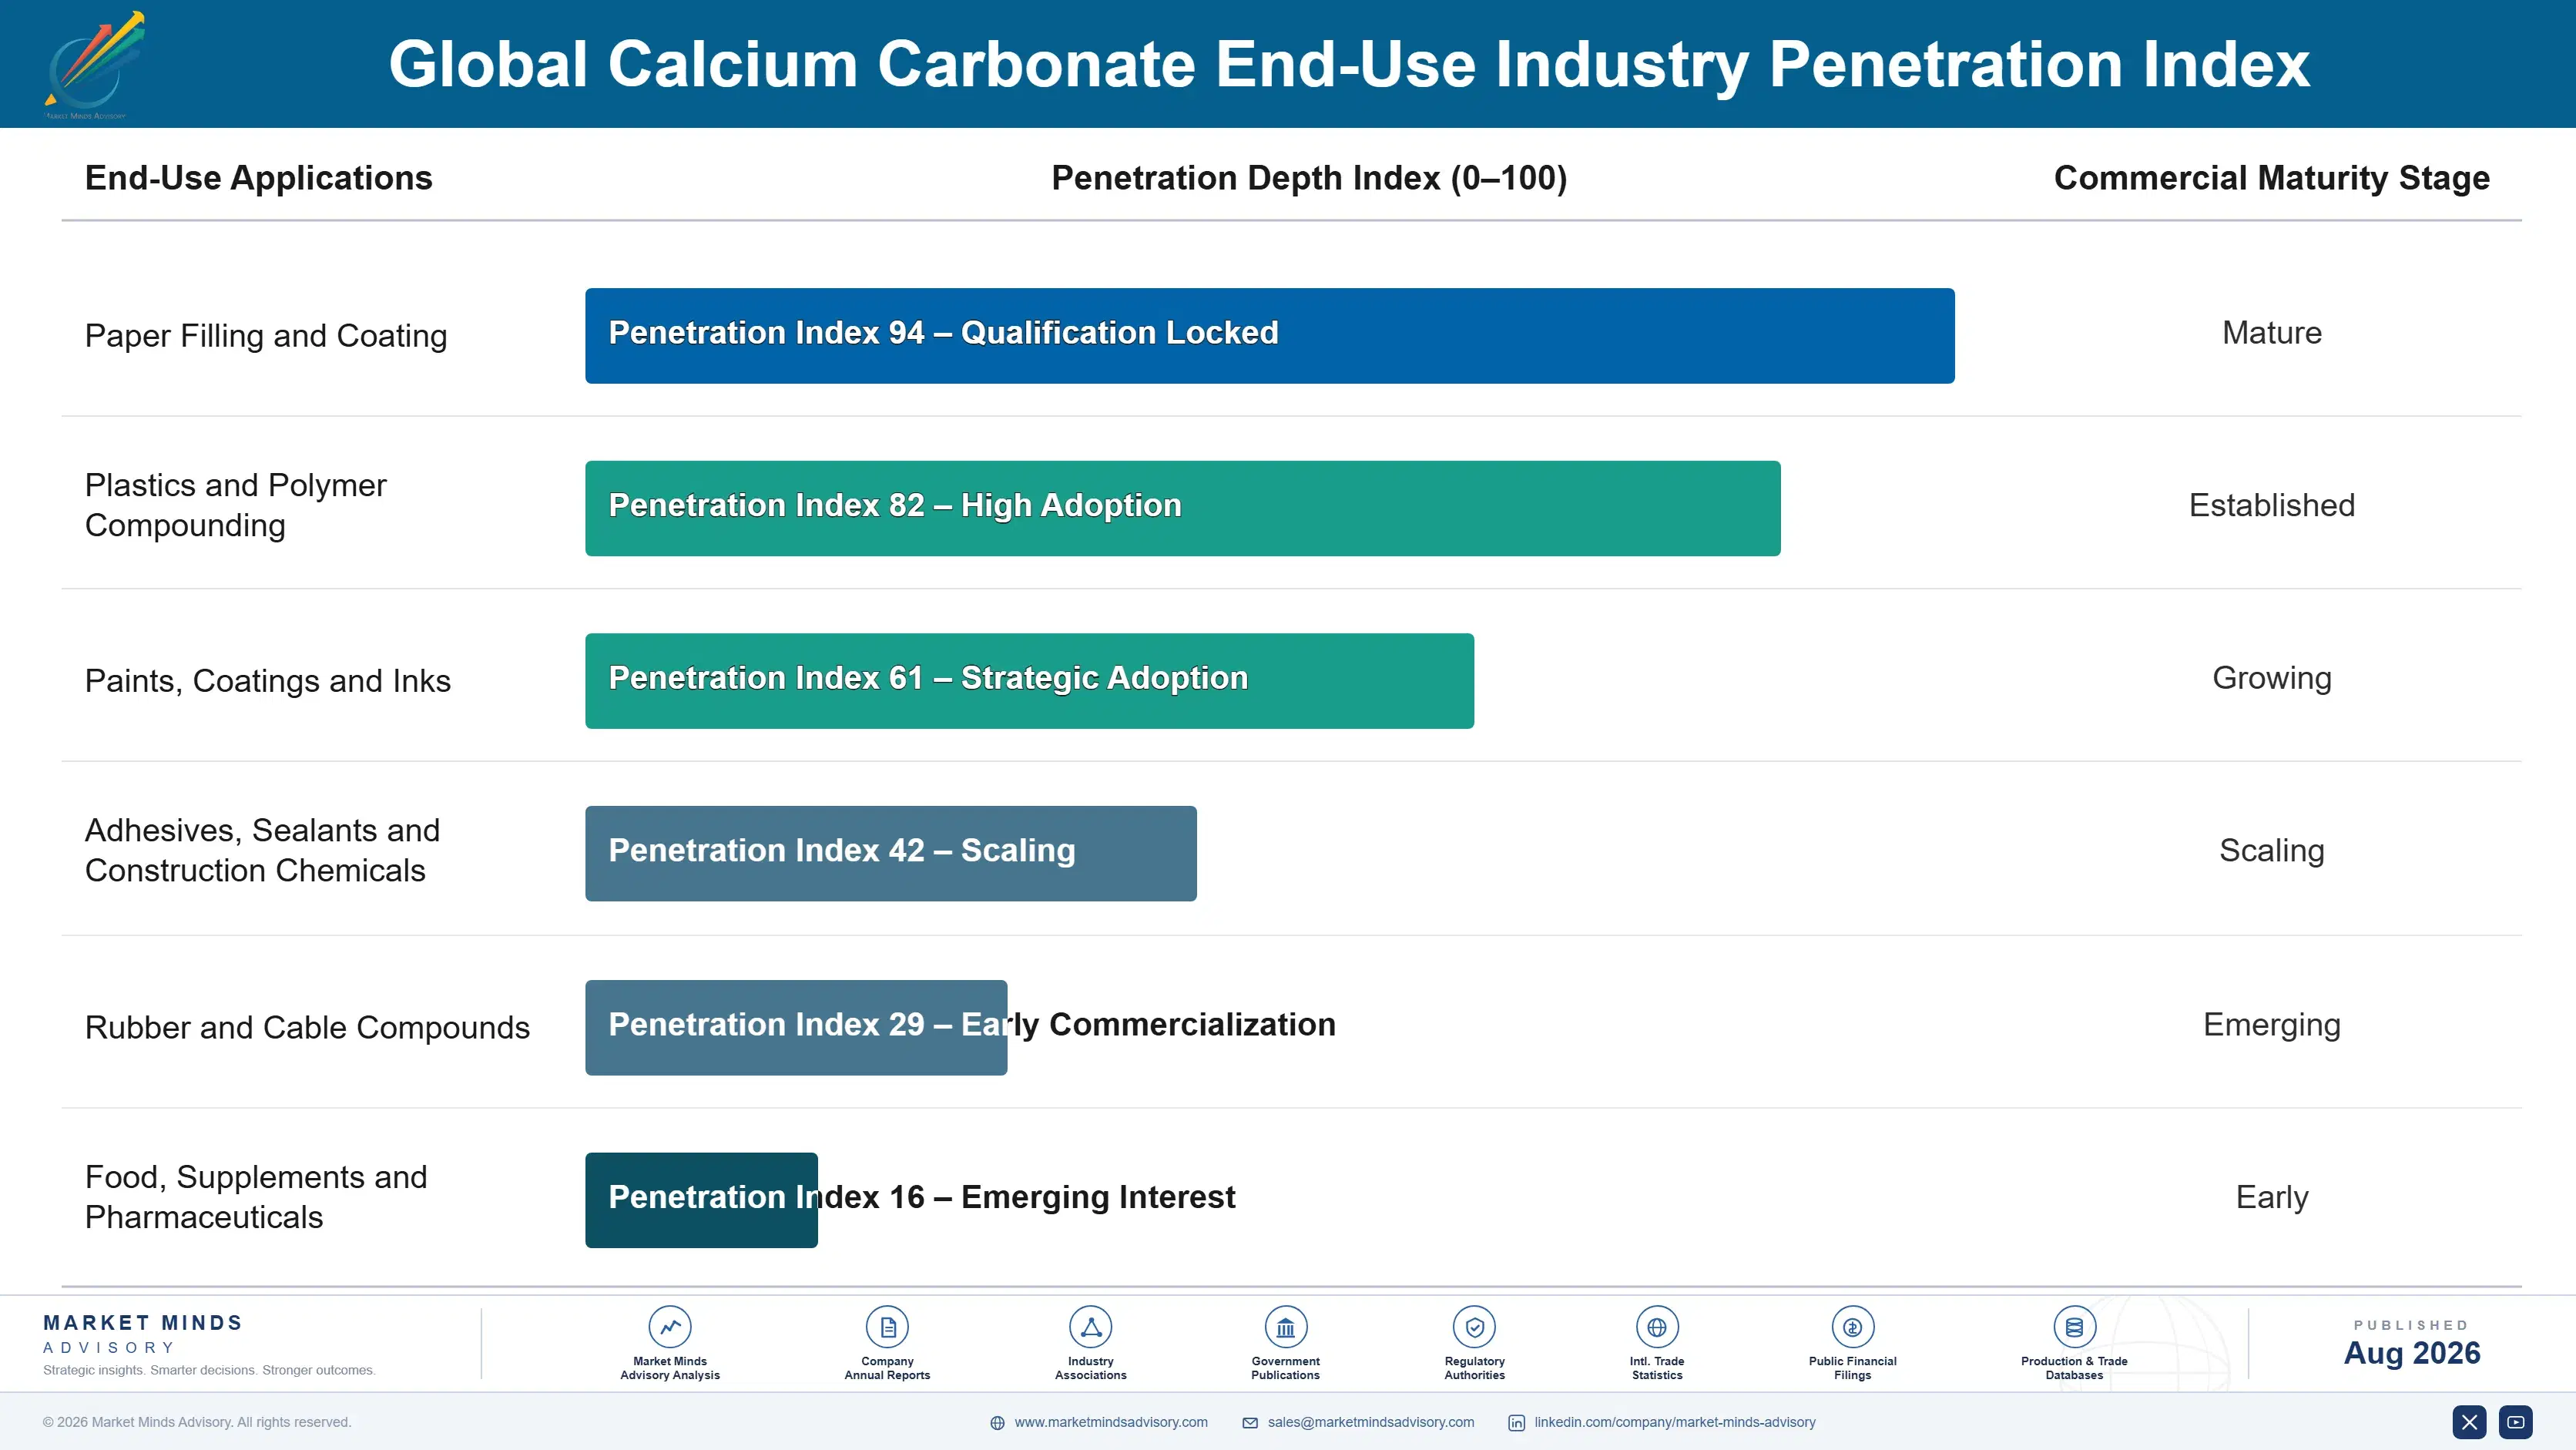
How Tonnage Gets Committed

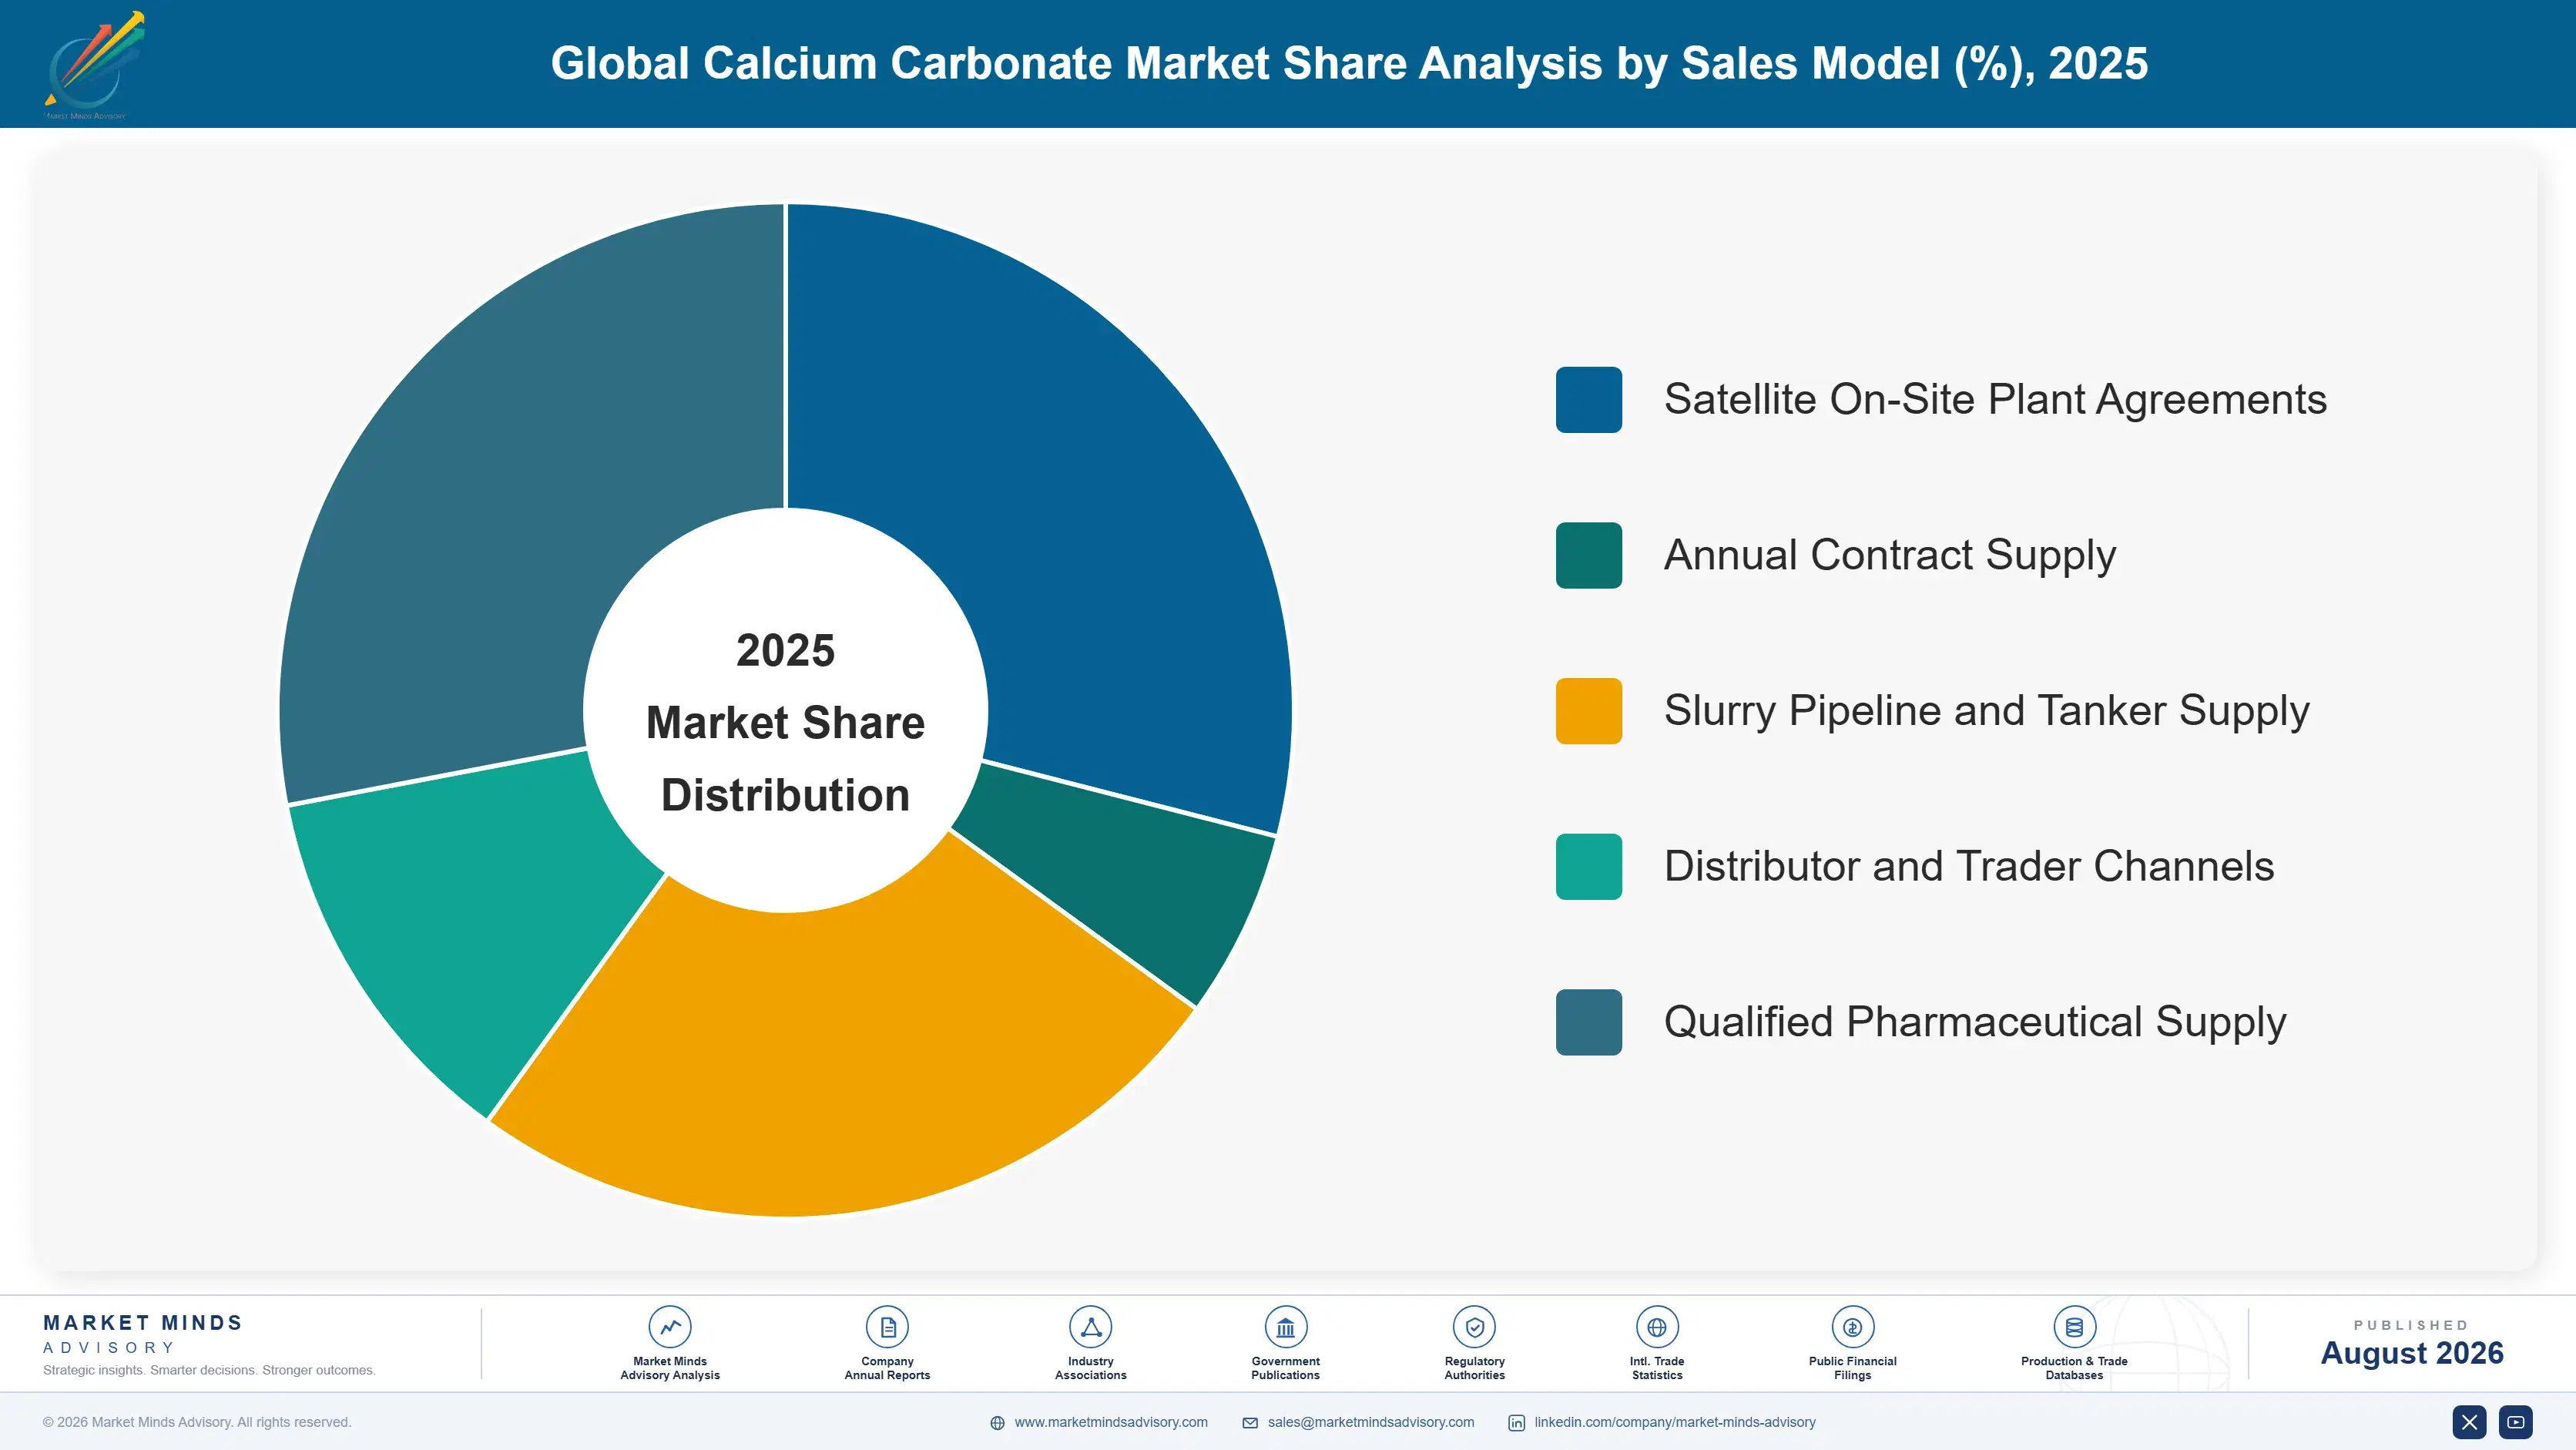
Demand reaches producers through three structures that behave nothing alike. Satellite plant agreements run around thirteen years, remove freight entirely, and make switching close to prohibitive once the plant sits inside the customer's fence. Annual supply contracts to compounders, paint formulators, and paper mills reprice each year against whoever is nearest and cheapest. Pharmacopoeia and food supply runs on qualification and documentation that holds until the customer changes its own specification.
Stickiness follows how expensive leaving would be. Satellite customers effectively cannot leave at all. Qualified pharmaceutical and food buyers face requalification costing more than any price difference. Treated grade users hold through formulation validation. Standard ground buyers hold until a nearer quarry quotes lower, which happens routinely. Nothing about the mineral itself holds any of it.

The deciding buyer differs sharply by grade. Procurement compares delivered cost per tonne on commodity material and little else. Compounding and formulation technical teams evaluate dispersion, brightness, and particle distribution on treated grades. Pharmaceutical quality functions assess purity documentation. Producers using one commercial approach across all three are winning one conversation and losing the other two. Very few producers run three commercial approaches at once.
global-calcium-carbonate-market-trends-end-use-penetration-index-1787551154633

What Actually Earns Anything

These are among the four positions where our research anticipates prominent divergence between winners and laggards over the coming forecast period. Each is grounded in the demand model, the regulatory perimeter, and the announced capacity pipeline.
01 / SATELLITE ASSET CONVERSION

Repurpose the plants before the contracts expire

Satellite precipitated plants built inside paper mills remove freight completely and lock customers for around thirteen years, which is the most durable commercial relationship this industry has ever managed to construct anywhere. They were built predominantly around graphic paper filling, and graphic paper keeps declining under digital substitution with no sign of stabilising at all. Converting that capacity toward packaging board and non-paper applications preserves an asset that cannot be relocated, and waiting for contract expiry means negotiating from a stranded plant.
02 / SURFACE TREATMENT INVESTMENT

Coat the mineral or supply somebody who does

Stearate treatment makes ground carbonate disperse properly in polyolefins rather than agglomerating and ruining the part, which is the only reason a compounder can substitute filler for resin at any meaningful loadings at all. Treated grades earn 54% over untreated equivalents of identical fineness, and rising polymer prices keep deepening the substitution across pipe, film, and moulded goods. Producers who only grind are supplying a base mineral into somebody else's treatment operation and capturing none of the premium they effectively created themselves.
03 / DEPOSIT APPLICATION MATCHING

Sell what the geology can actually support

Deposit whiteness decides whether an operation can reach paper coating, white plastics, and paint at all, or only filling applications where colour is genuinely irrelevant, and no amount of processing fully corrects what the underlying geology actually delivered. Producers chasing every application from a deposit that cannot support them waste commercial effort and lose technical credibility with the customers who really matter most. Matching quarries deliberately to reachable applications concentrates effort where it converts rather than spreading it uselessly thin everywhere.
04 / VALUE PER TONNE ROUTING

Send the expensive grades on the long journeys

Freight at 38% of delivered cost on material realising around 118 dollars a tonne confines standard grades to a tight radius that no operating improvement extends by any genuinely meaningful distance. Ultrafine precipitated and pharmacopoeia grades realise several times that pricing, which makes the identical haulage a far smaller share of delivered cost and expands the reachable market accordingly. Those grades grow at 9.8% and 8.4% respectively, and remarkably few producers route their output deliberately on this basis at all.

Engagement Snapshot From the Field

A live engagement with an industry participant carrying material or product regulatory and market exposure ahead of a defining policy shift, showing how our research translates into a defensible multi-year portfolio strategy.
MARKET MINDS ADVISORY · CLIENT ENGAGEMENT SUMMARY
Global Calcium Carbonate Producer Strategic Portfolio Review and Transition Roadmap 2026·Investment Scenario on Global Calcium Carbonate Exposure Evaluation 2025-26
CLIENT PROFILE
A European calcium carbonate producer with revenue near EUR 210 million (client-reported, unverified by MMA), operating four quarries supplying ground grades to paper, plastics, and construction customers. Surface treatment capacity existed at one site only, no precipitated capability was held, and margins had declined for five consecutive years running. Contribution had never been measured by customer.
STRATEGIC CHALLENGE
Graphic paper mill closures had removed a meaningful share of volume with no replacement identified. Regional competitors were undercutting delivered pricing on standard grades everywhere. Roughly a fifth of tonnage was being shipped beyond the point where freight consumed the entire contribution, sustained by volume-based sales incentives. Nobody had allocated haulage properly.
MMA APPROACH
MMA rebuilt contribution by customer against actual haulage cost, assayed deposit brightness and purity against application requirements, and modelled surface treatment expansion against the polymer substitution opportunity. Forty-seven expert interviews with compounders, paint formulators, paper technologists, and pharmaceutical quality functions established what each application genuinely requires and pays for. Every quarry was assayed for brightness and heavy metals.
KEY FINDINGS
  1. Around a fifth of tonnage was loss-making once actual haulage was allocated properly, and sales incentives measuring volume rather than contribution had been sustaining it for years.
  2. Two of the four deposits assayed clean enough for pharmacopoeia grade on heavy metals, and nobody in the business had ever tested for that purpose at all.
  3. Regional compounders were importing surface-treated grades from considerably further away because the client offered treatment from only one site with limited capacity.
  4. Deposit brightness varied enough between quarries that two were being marketed into paper coating applications they could never realistically serve on colour.
CLIENT PROFILE
A European calcium carbonate producer with revenue near EUR 210 million (client-reported, unverified by MMA), operating four quarries supplying ground grades to paper, plastics, and construction customers. Surface treatment capacity existed at one site only, no precipitated capability was held, and margins had declined for five consecutive years running. Contribution had never been measured by customer.
STRATEGIC CHALLENGE
Graphic paper mill closures had removed a meaningful share of volume with no replacement identified. Regional competitors were undercutting delivered pricing on standard grades everywhere. Roughly a fifth of tonnage was being shipped beyond the point where freight consumed the entire contribution, sustained by volume-based sales incentives. Nobody had allocated haulage properly.
MMA APPROACH
MMA rebuilt contribution by customer against actual haulage cost, assayed deposit brightness and purity against application requirements, and modelled surface treatment expansion against the polymer substitution opportunity. Forty-seven expert interviews with compounders, paint formulators, paper technologists, and pharmaceutical quality functions established what each application genuinely requires and pays for. Every quarry was assayed for brightness and heavy metals.
KEY FINDINGS
  1. Around a fifth of tonnage was loss-making once actual haulage was allocated properly, and sales incentives measuring volume rather than contribution had been sustaining it for years.
  2. Two of the four deposits assayed clean enough for pharmacopoeia grade on heavy metals, and nobody in the business had ever tested for that purpose at all.
  3. Regional compounders were importing surface-treated grades from considerably further away because the client offered treatment from only one site with limited capacity.
  4. Deposit brightness varied enough between quarries that two were being marketed into paper coating applications they could never realistically serve on colour.
RECOMMENDED STRATEGY
Phase 1: Phase one: reallocate output by contribution rather than tonnage, withdrawing from customers beyond the profitable freight radius and resetting sales incentives accordingly. Phase 2: Phase two: expand surface treatment capacity to a second site, targeting the regional compounders currently importing treated grades from much further away. Phase 3: Phase three: pursue pharmacopoeia qualification at the two clean deposits, building the documentation systems that gate the grade rather than the geology.
OUTCOME
The client withdrew from unprofitable distant accounts and raised contribution while shipping less tonnage. Treatment capacity at a second site was commissioned, pharmacopoeia qualification began at one deposit, and blended gross margin improved 7.9 percentage points (client-reported, unverified by MMA). Two distant accounts were exited during the year.

Frequently Asked Questions

Foundational context covering the market sizes, CAGR, scope, country, region and competition that inform every finding below. This section is provided to cover basics and most often pre-purchase conversations, answered from the MMA Primary Research Dataset.

What is the current size of the Global Calcium Carbonate Market?

The market was valued at USD 26.8 billion in 2025, rising to an estimated USD 28.03 billion in 2026. East Asia holds the largest regional share at 34% of value.

How large will the Global Calcium Carbonate Market be by 2036?

MMA forecasts USD 43.95 billion by 2036 under the base case, an expansion multiple of 1.57 times the 2026 value. That represents USD 15.92 billion of incremental value.

What is the CAGR for the Global Calcium Carbonate Market 2026 to 2036?

The base case CAGR is 4.6%, with a bull case of 5.8% and a bear case of 3.4%. The spread reflects uncertainty over graphic paper decline and polymer pricing.

Which segment is growing fastest?

Ultrafine and nano precipitated grades grow fastest at 9.8%, roughly 2.13 times the market rate. Food and pharmacopoeia grades follow at 8.4% on supplementation demand.

Who are the major companies in the Global Calcium Carbonate Market?

Omya, Imerys, Minerals Technologies, Sibelco, and Huber Engineered Materials lead, holding roughly 24% between them. Freight economics keep concentration low across this entire market, and no scale changes it.

Which country is growing fastest?

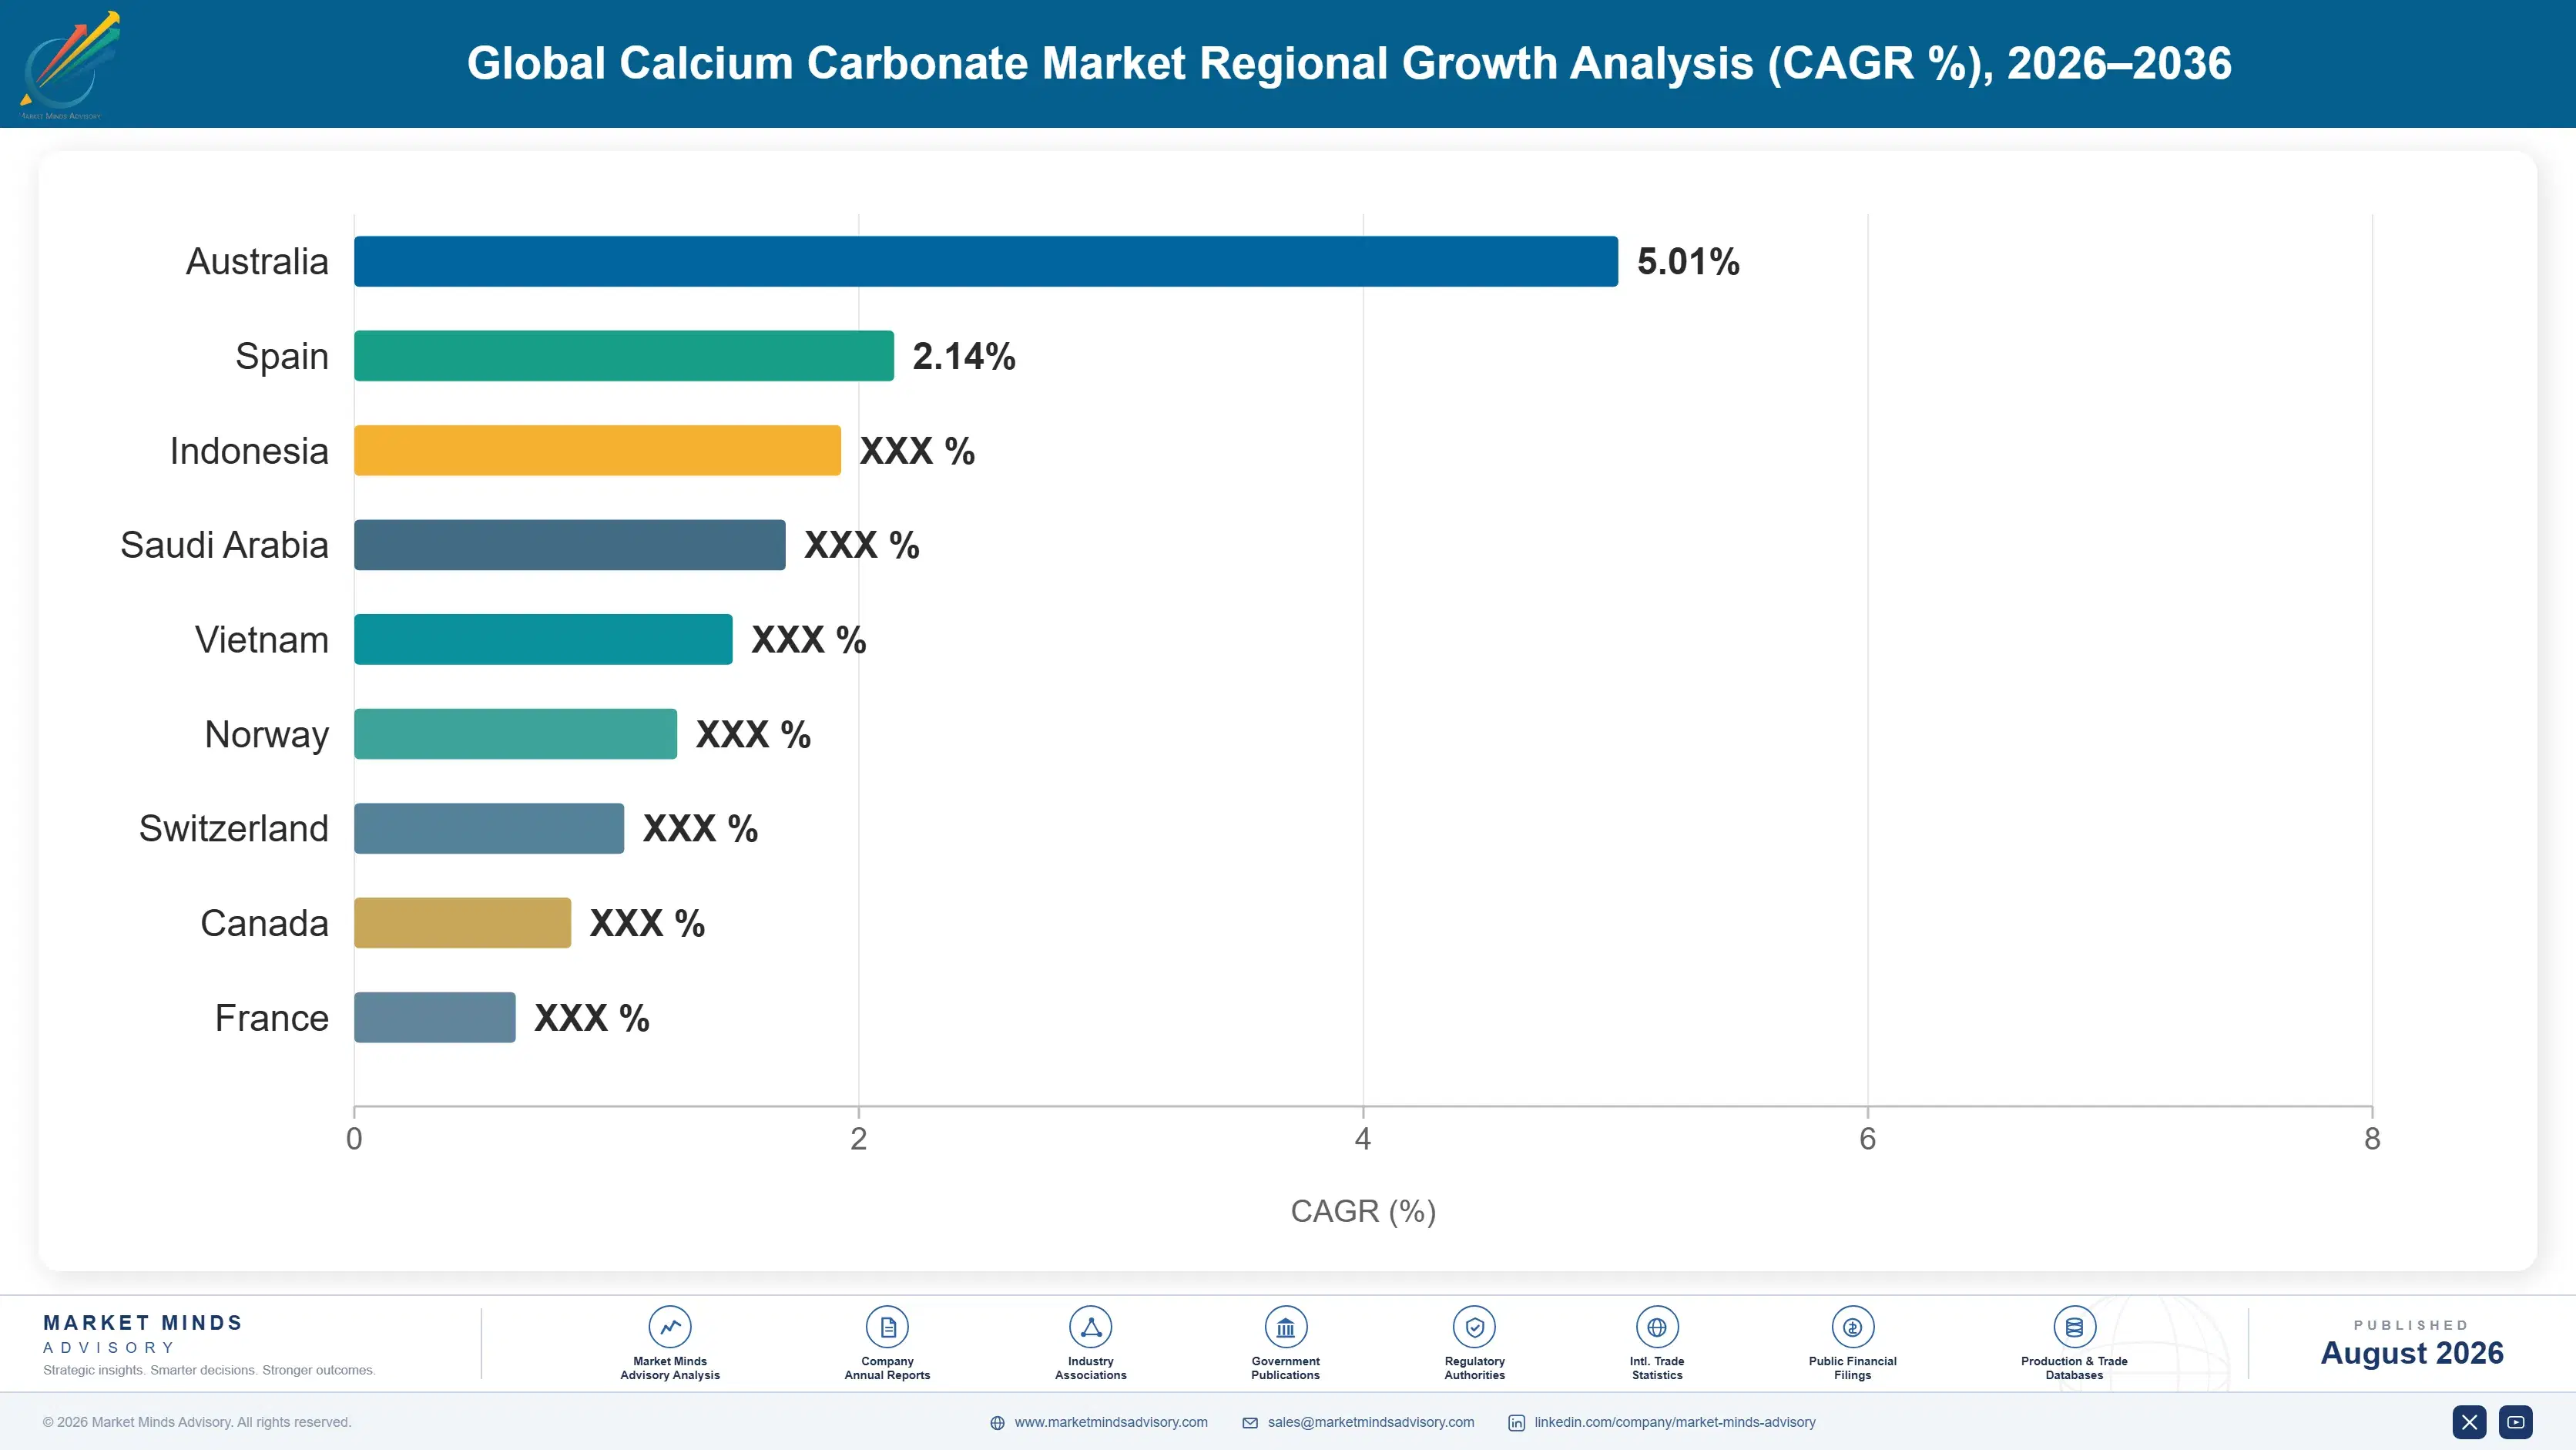
India grows fastest at 7.8%, as plastics compounding, construction chemicals, and paint manufacture expand together against quarries located close to those consuming clusters. Deposit brightness varies considerably between quarries there.

Report Segmentation Architecture

The full report scope spans multiple orthogonal segmentation dimensions, with cross-tabulated demand data provided for each dimension pair. Coverage extends further to regional breakdowns, trend trajectories, and the competitive detail needed to support segment-level decision-making.

By Product Form and Processing Level

  • Standard Ground Calcium Carbonate
  • Slurry Ground Calcium Carbonate
  • Precipitated Calcium Carbonate
  • Surface-Treated Grades
  • Ultrafine and Nano Precipitated Grades
  • Food, Pharmaceutical and Pharmacopoeia Grades

By End-Use Industry

  • Paper Filling and Coating
  • Plastics and Polymer Compounding
  • Paints, Coatings and Inks
  • Adhesives, Sealants and Construction Chemicals
  • Rubber and Cable Compounds
  • Food, Supplements and Pharmaceuticals

By Sales Model

  • Satellite On-Site Plant Agreements
  • Annual Contract Supply
  • Slurry Pipeline and Tanker Supply
  • Distributor and Trader Channels
  • Qualified Pharmaceutical Supply

By Region

  • North America
  • Western Europe
  • East Asia
  • South Asia and Pacific
  • Latin America
  • Middle East and Africa
  • Eastern Europe

Scope, Methodology, and Coverage

Every figure in this report is reproducible from documented input assumptions. The scope below maps the historical period, the forecast horizon, the segmentation dimensions, and the countries covered, alongside the underlying primary and qualitative methodology.
Historical Period
2020 to 2025
Forecast Period
2026 to 2036
Base Year
2025 (USD billions; MMA Primary Research Dataset, August 2026)
Market Definition
The market comprises calcium carbonate products supplied to industrial and consumer applications, covering standard ground calcium carbonate, slurry ground calcium carbonate, precipitated calcium carbonate, surface-treated grades, ultrafine and nano precipitated grades, and food, pharmaceutical or pharmacopoeia grades. Value is measured at producer level including satellite on-site plant supply. Quicklime and hydrated lime, cement and construction aggregate, dolomite sold as a separate mineral, agricultural liming materials, and downstream paper, plastic, or paint manufacture fall outside scope.
Quantitative Units
USD billions (current prices); million tonnes produced annually; USD per tonne by grade and delivery basis
Segmentation Dimensions
By Product Form and Processing Level; By End-Use Industry; By Sales Model; By Region
Regions Covered
North America, Western Europe, East Asia, South Asia and Pacific, Latin America, Middle East and Africa, Eastern Europe
Countries Covered
China, Japan, South Korea, Taiwan, India, Indonesia, Vietnam, Thailand, Australia, United States, Canada, Mexico, Germany, France, Italy, Austria, Norway, Finland, Spain, United Kingdom, Poland, Czechia, Romania, Hungary, Brazil, Mexico, Colombia, Saudi Arabia, Egypt, South Africa
Key Companies Profiled
Omya, Imerys, Minerals Technologies, Sibelco, Huber Engineered Materials, Carmeuse, Lhoist, Mississippi Lime, Nordkalk, Schaefer Kalk, Maruo Calcium, Shiraishi Kogyo, Gulshan Polyols, 20 Microns, Fimatec, Provencale, Calcinor, Cales de Llierca, GCCP Resources, Great Lakes Calcium
Quantitative Methodology
Primary survey, n=3,800 respondents, Q4 2025, six countries; demand-side model with trade association cross-validation
Qualitative Methodology
47 expert interviews, Q4 2025; applied to validate demand model assumptions, identify emerging dynamics, and assess competitive positioning
Report Format
PDF and XLSX data workbook (Word format preview document)
Publisher
Market Minds Advisory
Report Code
MMA-2026-CHM-457
Published
August 2026
Contact
sales@marketmindsadvisory.com | www.marketmindsadvisory.com

Purchase the full Global Calcium Carbonate Market Report (2026 to 2036).

The full report sizes calcium carbonate demand across six product grades, six end-use industries, and seven regions with 2026 to 2036 forecasts under base, bull, and bear cases. It models freight as the binding commercial constraint rather than as a cost line, since delivered-cost radius rather than production scale decides almost every competitive outcome. Competitive profiles cover twenty producers assessed consistently on production revenue, processing capability, and deposit quality. Cost analysis traces freight, grinding energy, and treatment chemistry exposure by grade. Commercial guidance addresses satellite asset conversion, treatment investment, deposit matching, and value-based routing.
Six product grades sized separately by region
Freight economics modelled as delivered-cost radius by grade
Satellite plant exposure mapped against graphic paper decline
Surface treatment premium quantified against untreated equivalents
Deposit brightness assessed against reachable application sets
Paper demand separated between graphic and packaging grades

Built For The People Who Decide

From boardroom strategy to bench-side execution, this report is read cover-to-cover by leaders shaping the next decade of their industry, turning demand scenarios, market dynamics and valuation benchmarks into decisions.
CXOs/ Presidents/ VPs/ Managers
M&A and Corporate Development
Strategy Teams and R&D Heads
Procurement and Product Directors
Regulatory and Compliance Leaders
Investor Relations and Equity Analysts