Market Minds Advisory
Analgesics Market

Analgesics Market: Analgesics: Brand Durability, and Active Ingredient Concentration

The first genuinely new class of pain medicine in decades arrived in 2025 priced hundreds of times above the generic tablets it competes with, and payers rather than prescribers will decide whether it matters.

Lead Analyst

Alice Ballenger

Published

September 2026

Make Smarter Decisions with Customized Research Insights

Request a free sample report and evaluate market opportunities, growth trends, and competitive dynamics relevant to your business needs.

2025 MARKET VALUE$82.0BMarket Size 2025
2036 FORECAST VALUE$152.5BBase Case , 2026 to 2036
CAGR 2026 TO 20365.8 %Bull 7.0% / Bear 4.6%
INCREMENTAL OPPORTUNITY$65.7BNet 10- year value creation
EXPANSION MULTIPLE1.76x2036 value over 2026 base
Strategic Levers
M&A Pipeline
Regional Outlook
Country Rankings
Competitive Intelligence
Segmental Deep-dive
Call-Us : 91 93563 13602

Executive Snapshot and Market Trajectory

Suzetrigine reached the United States market in January 2025 as the first new class of pain medicine approved in decades, and it costs several hundred times what a generic opioid tablet does. Whether payers fund it is now the central question in this category. Prescribers were never the obstacle.
Non-opioid prescription analgesics compound at 8.7%, a full 1.50x the market rate, from a base so small that almost any adoption registers as growth. East Asia holds the largest share at 28%, carried by Chinese volume across paracetamol and NSAIDs together with Japanese per-capita over-the-counter spending that exceeds every other market tracked here. North American value rests on prescription pricing instead. Volume and value part company completely here.
Concentration sits at 26%, low for a consumer health category, because generic and private label manufacturers supply most volume while branded houses capture most value. Kenvue and Haleon lead on brands whose chemistry expired generations ago and whose pricing power somehow did not. Active ingredient supply tells a different story: roughly 68% of paracetamol originates in China, a concentration nobody planned and everybody now watches. Second sourcing costs money nobody wants to spend.
Market Definition
This market covers pharmaceutical products whose primary indication is the relief of pain, spanning over-the-counter and prescription channels. Coverage includes non-steroidal anti-inflammatory drugs, paracetamol and its combination products, opioid analgesics, novel non-opioid prescription analgesics, topical and local analgesic preparations, and adjuvant agents prescribed principally for neuropathic pain. Anaesthesia agents used in surgical settings, anti-migraine specific therapies, disease-modifying antirheumatic drugs, medical devices delivering analgesia, and non-pharmacological pain interventions are excluded.
Base Year Value
$82.0B in 2025 (MMA Primary Research Dataset, August 2026)
Forecast Period
2026 to 2036, eleven discrete annual values
CAGR
5.8% base case. Bull 7.0%. Bear 4.6%.
Fastest Growth Segment
Non-Opioid Prescription Analgesics: 8.7% CAGR
Fastest Growth Country
India: 9.6% CAGR
Fastest Growth Region
South Asia and Pacific: 8.0% CAGR
Largest Region
East Asia: 28% of 2025 global value
Market Leaders
Kenvue, Haleon, Bayer, Reckitt Benckiser, and Sanofi. Source: MMA Primary Research Dataset, July 2026.
Primary Survey
n=3,800 procurement and R&D decision-makers, Q4 2025, six countries
Methodology
Demand-side build-up, cross-validated against public data, 47 expert interviews

Analgesics Market Forecast Scenarios

global-analgesics-market-size-forecast-scenario-1787303431493
Growth ran at roughly 4.6% between 2020 and 2025, and two shocks shaped it. Pandemic stockpiling emptied paracetamol and ibuprofen shelves in 2020, then active ingredient supply from China and India tightened through 2021 and 2022, pushing input costs up sharply for a category that competes on price. Meanwhile opioid volumes fell steadily across developed markets under prescribing restriction, subtracting from an otherwise stable base.
Base case growth of 5.8% depends on three mechanisms. Ageing populations increase the prevalence of osteoarthritis and chronic musculoskeletal pain, which is the largest single driver of analgesic volume worldwide. Emerging market retail pharmacy expansion converts self-medication that previously happened informally into recorded branded and generic sales. And topical formulations continue taking share from oral therapy among older patients, where avoiding systemic gastrointestinal and cardiovascular exposure genuinely matters clinically. Each mechanism is slow and reliable.
The bull case at 7.0% assumes broad payer coverage for non-opioid prescription analgesics, which would create a high-value prescription category where essentially none existed. The bear case at 4.6% is a pricing one: private label share continues rising across developed retail markets while active ingredient costs stay elevated, squeezing branded margins without generating any offsetting volume growth.

Analgesics: Brand Durability Against Commodity Chemistry

The strangest fact about analgesics is that brand equity survives commodity chemistry. Paracetamol and ibuprofen have been off patent for generations, cost almost nothing to make, and are chemically identical whichever box they leave in. Yet Tylenol, Panadol and Nurofen still command substantial premiums over private label sitting on the same shelf. Consumers buy reassurance, and they buy it repeatedly. Chemistry stopped being the point decades ago.
TOP FIVE CONCENTRATION26%Generic and private label supply keeps branded leadership shares modest
OTC VOLUME SHARE71%Doses sold without prescription across retail and pharmacy channels
AVERAGE DOSE PRICEUSD 0.09Blended global price per single analgesic dose across channels
PRIVATE LABEL SHARE34%Retailer own-brand share of developed market over-the-counter volume
CHINA API ORIGIN SHARE68%Paracetamol active ingredient originating from a single producing country
PHARMACY CHANNEL SHARE46%Value moving through pharmacies rather than grocery or online retail
Value and volume diverge sharply. Roughly 71% of doses move over the counter at pennies each, while the small prescription tail carries disproportionate revenue. Suzetrigine sharpened that split considerably: a non-opioid prescription analgesic priced near fifteen dollars a day sits in the same therapeutic space as a tablet costing under a cent. Both treat pain. Only one of them requires a payer negotiation.
Supply concentration is the quiet risk underneath everything. Around 68% of paracetamol active ingredient originates in China and a similar picture holds for several NSAIDs, a position built over two decades of cost competition that nobody consciously chose. The 2021 and 2022 tightening demonstrated what that means: costs rose across a category with almost no ability to reprice at retail. Nobody chose this, and everybody now watches it.
"This category spent thirty years perfecting the manufacture of molecules that cost nothing, and then a company arrived charging fifteen dollars a day for pain relief. The interesting question is not whether suzetrigine works. It is whether anyone has built a payer argument for pain that expensive."
Director, Consumer Health and Pain Therapeutics Practice · MMA Healthcare Practi

Market Trends

Non-opioid prescription analgesics create a genuinely new category

Suzetrigine, a selective NaV1.8 sodium channel blocker, reached the United States market in January 2025 as the first novel analgesic class approved in decades. It relieves acute pain without opioid receptor activity, so it carries no dependence liability and no scheduling burden. The clinical case is straightforward and the commercial one is not: pricing near fifteen dollars a day competes against generic opioids and NSAIDs costing fractions of a cent. Formulary access, not prescriber enthusiasm, will determine whether the category becomes commercially meaningful. Several further candidates in the class are in late-stage development.
Market Impact: Over 600 million with osteoarthriti

Topical formats take share from oral therapy in older patients

Diclofenac gels, lidocaine patches and capsaicin preparations avoid the systemic gastrointestinal and cardiovascular exposure that limits oral NSAID use in patients over sixty-five. Regulatory switches moving topical diclofenac to over-the-counter status across several major markets opened retail distribution that prescription status had restricted. Japanese manufacturers, particularly Hisamitsu, built the patch format decades before Western markets took it seriously. Growth here reflects genuine clinical substitution rather than marketing, because the safety argument in elderly patients is real and prescribers accept it. Margins run well above oral generics, because adhesive and transdermal delivery technology is harder to copy than pressing a tablet.
Market Impact: Adds 9.6% Indian growth annually

Market Opportunities and Growth Drivers

Ageing populations expand chronic musculoskeletal pain prevalence steadily

Osteoarthritis and chronic back pain are the largest sources of analgesic volume worldwide, and both scale directly with the proportion of the population over sixty. Every region tracked here is ageing, and the effect compounds because older patients take analgesics more days per year and for more years in total. This is the most reliable demand mechanism in the category and it requires nothing from manufacturers except supply. It also shifts the formulation mix toward topical and gastro-protective options that suit older physiology better. Manufacturers need only supply what demography already guarantees them.
Market Impact: Private label reaches 34% volume

Retail pharmacy expansion converts informal self-medication into recorded sales

Across India, Indonesia, Nigeria and much of Latin America, pain relief has long been bought loose from small shops or unregulated vendors, generating no recorded market value. Organised pharmacy chains and regulated over-the-counter distribution are expanding rapidly in exactly those markets. The volume was always there; what changes is that it becomes branded, packaged and measurable. Indian retail pharmacy count has grown substantially since 2020, and analgesics are typically among the first three categories any new pharmacy stocks properly. Nothing about total consumption changes; what changes is whether that consumption appears in any recorded figure at all.
Market Impact: Roughly 68% from 1 country

Market Restraints and Challenges

Private label erosion compresses branded margins across developed retail

Retailer own-brand analgesics now hold roughly 34% of developed market over-the-counter volume, and grocery chains price them at a fraction of branded equivalents sitting directly alongside. The root cause is that the products are chemically identical and consumers increasingly know it. Commercial impact falls on branded houses whose entire value rests on trust rather than differentiation. Responses that work include format innovation that private label cannot easily copy, pharmacist recommendation programmes, and combination products carrying genuine formulation patents rather than pure marketing claims. Advertising alone has stopped working, and the data on incremental media returns makes that plain.
Market Impact: Priced above 300 times generics

Active ingredient concentration leaves the category exposed to single-country supply

Roughly 68% of paracetamol active ingredient and a comparable share of several NSAIDs originate in China, with India supplying most of the remainder. The root cause is two decades of cost competition in a category where a cent per dose decides shelf position, which drove production toward the lowest-cost sites and nowhere else. The 2021 and 2022 tightening raised input costs across a market with almost no retail repricing ability. European and American manufacturers have begun qualifying domestic and Indian secondary sources, though at costs that retail pricing barely supports.
Market Impact: Topical growth at 7.2% annually
3 additional market trends, 4 additional growth drivers, and 2 additional restraints and challenges are covered in the full report. Contact sales@marketmindsadvisory.com to access the complete intelligence.

Segment CAGR and Growth Architecture

Segmentation follows pharmacological class, because class determines the regulatory pathway, the distribution channel, the pricing structure and the clinical indication set. Six classes cover analgesic supply without overlap. Delivery format, whether tablet, patch, gel or injection, varies within classes rather than defining them and is treated as a formulation attribute here. Class, not delivery format, sets the commercial rules here.
global-analgesics-market-market-share-analysis-1787303432401

Non-Opioid Prescription Analgesics

Growing at 8.7%, a full 1.50x the market rate, this class barely existed before suzetrigine's approval in January 2025 and its growth rate reflects a tiny base as much as genuine momentum. NaV1.8 sodium channel blockers relieve acute pain peripherally without opioid receptor binding, removing dependence risk and controlled substance scheduling from the equation entirely. The clinical proposition is clean. The commercial one depends wholly on formulary access, because pricing near fifteen dollars daily competes with generics costing fractions of a cent for pain that most prescribers already treat adequately. Health economic evidence rather than clinical performance will decide the outcome, and several further candidates in the class are already in late-stage development behind it.
CAGR 8.7%

Topical and Local Analgesics

Topical preparations grow at 7.2% on a clinical argument that prescribers genuinely accept: diclofenac gel, lidocaine patches and capsaicin formulations deliver local relief without the gastrointestinal bleeding and cardiovascular risk that limit oral NSAID use in older patients. Regulatory switches to over-the-counter status across several major markets opened retail shelves that prescription status had closed. Japanese manufacturers built this format decades ahead of Western adoption and still hold disproportionate share of it. Margins run considerably above oral generics because formulation, adhesive technology and transdermal delivery are genuinely harder to copy than pressing a tablet. Over-the-counter switches have opened retail shelves that prescription status previously kept closed to these formats entirely.
CAGR 7.2%
Full segment breakdown across 6 segments available in the complete report.

Regional Architecture and Country Demand Map

Regional value reflects population, ageing profile and retail channel structure rather than any difference in clinical need, since pain is distributed fairly evenly across humanity. Channel formality is the variable that decides whether consumption becomes recorded market value or stays invisible in informal trade. That distinction matters more than income.

East Asia

East Asia takes the largest share at 28%, built on two quite different foundations. China supplies enormous paracetamol and NSAID volume into a domestic retail market that has formalised rapidly, and it also manufactures most of the world's active ingredient, which gives Chinese producers a cost position nobody else can approach. Japan is the opposite case: per-capita over-the-counter analgesic spending there exceeds every other market tracked, supported by a pharmacy culture that recommends specific brands and a topical patch category that Hisamitsu and Kobayashi built decades ago. South Korea and Taiwan follow Japanese consumption patterns at smaller scale. Growth at 6.6% reflects channel formalisation. Production and demand reinforce each other here.
Share: 28% | CAGR: 6.6% (2026 to 2036)

North America

Twenty-seven per cent of value sits in North America, and prescription pricing rather than volume explains it. The United States pays more per analgesic dose than any other market, and suzetrigine's arrival at fifteen dollars daily extends that gap dramatically. Opioid volumes have fallen for eight consecutive years under prescribing restriction, subtracting steadily from the base. Private label now holds a third of retail over-the-counter volume, and grocery chains price aggressively against branded equivalents. Canadian pricing sits lower under provincial formulary control. Growth at 5.2% is modest because private label erosion and opioid decline together offset most of the demographic tailwind. Suzetrigine's reception across United States formularies will decide whether prescription value grows again or continues its slow decline.
Share: 27% | CAGR: 5.2% (2026 to 2036)
Regional intelligence for 5 additional markets available in the complete report: Western Europe, South Asia and Pacific, Latin America, Middle East and Africa, Eastern Europe. Contact sales@marketmindsadvisory.com.
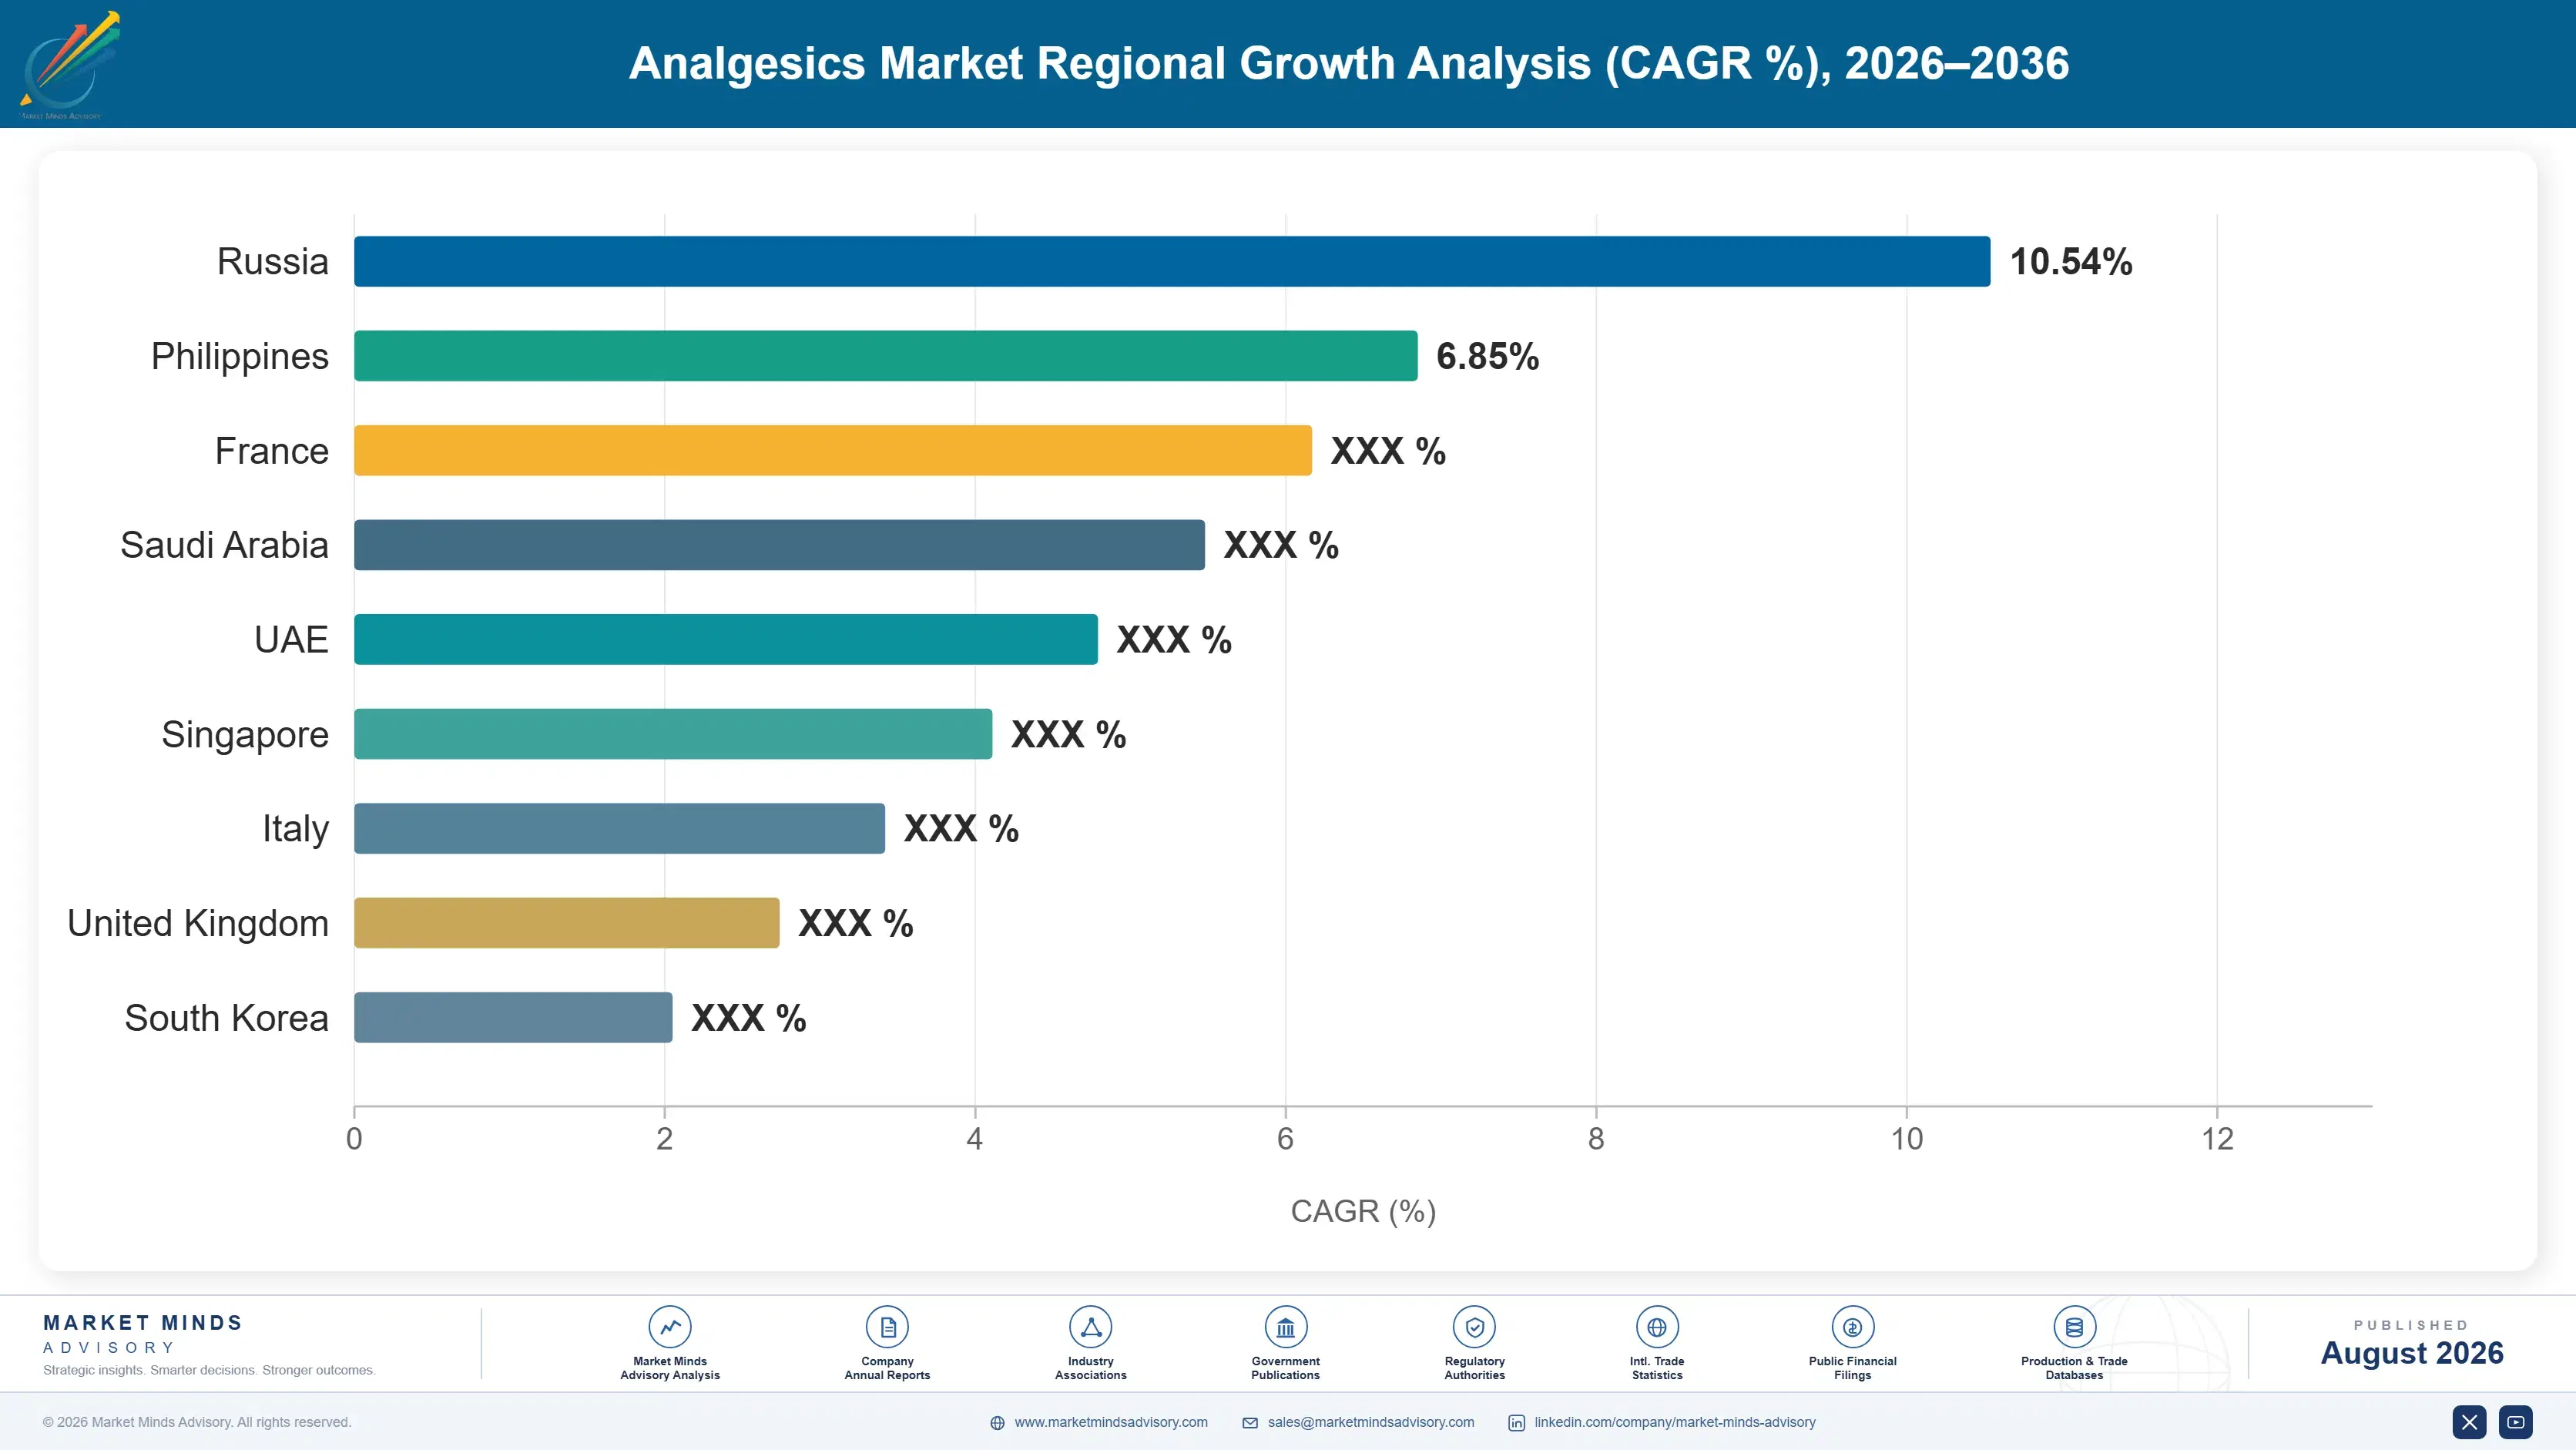
global-analgesics-market-country-cagr-analysis-1787303433263

Where Analgesic Value Actually Concentrates

Chemistry in this category is free and has been for generations, so nothing durable is won on the molecule itself. Value accrues to brand trust that survives price comparison, to formulations private label cannot copy quickly, to channel positions that preserve pharmacist recommendation, and to secure supply of active ingredient. Everything else is temporary.

Defend brand premium through format rather than advertising

Private label matches any branded tablet chemically and prices it at roughly 40% less, so advertising alone stops working eventually. Formats that private label cannot copy quickly do hold: fast-dissolve preparations, liquid capsules, dual-action combinations with genuine formulation patents, and paediatric dosing systems. Those carry real manufacturing barriers and support premiums that plain tablets no longer justify. The investment sits in formulation development and packaging engineering rather than in media spend, which is an uncomfortable reallocation for organisations built around brand marketing teams. The brands that made that shift five years ago are the ones still holding premium today.
Market Impact: Protects roughly 40% price premium

Secure second-source active ingredient outside single-country supply

Roughly 68% of paracetamol active ingredient originates in China, and the 2021 and 2022 tightening showed exactly what that costs when supply narrows. Qualifying Indian, European or domestic secondary sources carries regulatory change control expense and a higher unit price, typically around 15% above the Chinese benchmark. In a category competing on cents per dose that hurts, which is precisely why so few competitors carry it. The companies that did kept shelves filled through the last disruption while others took stockouts and lost placement. Shelf placement lost to a stockout rarely returns quickly.
Market Impact: Costs about 15% above the Chinese b

Build pharmacist recommendation where regulation preserves the counter

In markets that keep analgesics behind the pharmacy counter, France and Germany most notably, pharmacist recommendation decides a large share of purchases and private label penetration stays materially lower. Brands that invest in pharmacist education, sampling and counter-level relationships hold roughly 25% more share in those markets than in open grocery channels. The mechanism disappears the moment regulation opens distribution, so it is worth mapping which markets are likely to deregulate before committing long-term spending there. Germany and France are the two markets where this mechanism still carries real weight, and both review their pharmacy distribution rules periodically.
Market Impact: Holds around 25% more share behind

Prepare the payer argument before novel analgesics reach formularies

Non-opioid prescription analgesics face a pricing gap of several hundred times against generic alternatives, and no amount of clinical elegance closes that on its own. The argument that works is economic: avoided opioid dependence, reduced post-surgical readmission, and shorter recovery time carry costs payers already measure. Building that evidence before launch rather than after determines formulary placement, which determines everything. Companies developing in this class should be running health economic studies alongside phase three rather than treating them as a post-approval afterthought. A pricing gap of roughly 300 times cannot be argued away clinically.
Market Impact: Bridges roughly 300 times the gener

Who Controls the Margin Pool

Concentration sits at 26% across the top five, measured on annual revenue attributable to analgesic products across both prescription and over-the-counter channels, the single basis applied throughout. That is low for consumer health, because generic and private label manufacturers supply most doses while branded houses capture most value. Kenvue and Haleon lead, followed by Bayer, Reckitt Benckiser and Sanofi, all competing with molecules that went off patent generations ago.
Competition runs on three dimensions that have little to do with chemistry. Brand trust is the first and most durable, since consumers buying pain relief for a child reach for a name they recognise. Format is the second, where fast-dissolve, liquid capsule and combination products create barriers private label needs years to replicate. Channel position is the third, and it decides how much pharmacist recommendation a brand receives.

The pressure worth watching comes from two directions. Private label continues gaining developed market share as retailers improve their own packaging and positioning. Separately, Vertex Pharmaceuticals has entered from outside consumer health entirely with a prescription analgesic priced in a different universe, and if payers fund it, the value distribution across this category changes in ways no incumbent brand strategy currently anticipates.
global-analgesics-market-company-positioning-matrix-1787303434155

Competitive Moat and Risk Dimensions

KENVUE

Moat: Durable consumer trust position

Tylenol holds brand recognition in the United States that decades of identical private label paracetamol have failed to erode, and healthcare professional recommendation reinforces it continuously. Consumers buying analgesics for children or elderly relatives select on trust rather than price, and that behaviour has proved remarkably stable across economic cycles and across retailer pricing pressure.
KENVUE

Risk: Litigation and category concentration

The company carries substantial exposure to a single molecule in a single flagship brand, and product liability litigation over paracetamol has generated recurring uncertainty. Private label share continues climbing in exactly the retail channels where Tylenol is strongest. Any regulatory action on paracetamol safety would strike the core franchise directly rather than at the periphery.
HALEON

Moat: Geographic brand portfolio breadth

Panadol, Advil and Voltaren give Haleon leading positions across paracetamol, ibuprofen and topical diclofenac simultaneously, and across considerably more geographies than any competitor holds. That spread means private label pressure in one market or channel does not threaten the whole position, and it supports scale in manufacturing and procurement that smaller branded houses cannot match.
HALEON

Risk: Emerging market pricing exposure

Growth depends heavily on emerging markets where local generic manufacturers price far below international brands and consumers are considerably more price-sensitive than in Western Europe. Currency movement compounds it. Building brand equity in those markets takes sustained investment against competitors whose cost base is permanently lower and whose regulatory burden is lighter.

Players Tracked

Prominent Players

Kenvue
Haleon
Bayer
Reckitt Benckiser
Sanofi

Other Key Players

Vertex Pharmaceuticals
Teva Pharmaceutical Industries
Viatris
Perrigo Company
Sun Pharmaceutical Industries
Cipla
Dr. Reddy's Laboratories
Hikma Pharmaceuticals
Taisho Pharmaceutical
Kobayashi Pharmaceutical
Hisamitsu Pharmaceutical
GrĂ¼nenthal
Menarini Group
Glenmark Pharmaceuticals
Zydus Lifesciences

Recent Developments

JANUARY 2025

Vertex Pharmaceuticals receives United States approval for suzetrigine

The Food and Drug Administration approved suzetrigine for moderate to severe acute pain, the first novel analgesic class cleared in decades. The selective NaV1.8 sodium channel blocker relieves pain peripherally without opioid receptor activity, and therefore carries no dependence liability or controlled substance scheduling requirement.
Signal: A prescription analgesic priced hundreds o
JUNE 2025

Haleon expands topical analgesic manufacturing capacity in Europe

Haleon commissioned additional topical analgesic production lines at a European site, an organic capacity expansion rather than any acquisition, responding to sustained demand growth for diclofenac gel formats following over-the-counter regulatory switches across several major national markets. No acquisition or partner site was involved in the expansion.
Signal: Topical formats carry manufacturing barrie
NOVEMBER 2025

Indian manufacturers expand paracetamol active ingredient capacity under incentive scheme

Several Indian producers commissioned new paracetamol active ingredient capacity under the government production-linked incentive scheme, organic expansions intended to reduce Indian dependence on Chinese intermediate supply and to serve international customers seeking a second qualified source. Buyers had been requesting a qualified alternative for three years.
Signal: Buyers are now paying above the Chinese be

Active Ingredient and Packaging Cost Exposure

Analgesic cost structures are unusually simple and unusually exposed. Active pharmaceutical ingredient accounts for roughly 32% of over-the-counter product cost of goods, with paracetamol and ibuprofen sourced overwhelmingly from Chinese producers and Indian formulators dependent on Chinese intermediates. Packaging contributes a further 26%, higher than most pharmaceutical categories because blister foil, cartons and child-resistant closures cost real money against a product selling for pennies
The 2021 and 2022 active ingredient tightening showed the exposure clearly. Chinese production curtailment combined with container freight disruption pushed paracetamol and ibuprofen input costs up sharply, and Perrigo and Haleon both disclosed input cost pressure in their annual reporting for those years. Retail pricing could not absorb it: analgesics sit at price points consumers notice, and private label competition removes any room to pass increases through quietly.

The disadvantage falls hardest on private label and value manufacturers with no brand premium to cushion input movement. A branded house selling at a 40% premium can absorb an active ingredient increase for several quarters. A contract manufacturer supplying retailer own-brand at contracted prices cannot. Geography compounds it: European producers carry energy and regulatory costs that Chinese and Indian sites simply do not.
global-analgesics-market-cost-volatility-analysis-1787303434546

Qualify Indian and domestic secondary active ingredient sources ahead of need

Regulatory change control makes source qualification slow, so it has to be done before a disruption rather than during one. Manufacturers holding a qualified second source pay roughly 15% more per kilogram in normal conditions and keep shelves filled when supply narrows. Shelf placement lost during a stockout rarely comes back quickly, which is what makes the premium worthwhile.

Shift premium defence toward formats that resist private label copying

Input cost increases cannot be passed through on plain tablets because private label sits alongside at a visibly lower price. Fast-dissolve, liquid capsule and combination formats carry manufacturing barriers that give real pricing latitude. Moving volume mix toward those formats provides a cushion against active ingredient movement that no procurement strategy on its own can supply.

Index contract manufacturing agreements to published active ingredient benchmarks

Retailer own-brand contracts written at fixed prices transferred the entire input increase onto contract manufacturers during the last cycle, and several exited the category. Newer agreements increasingly carry narrow indexation tied to published active ingredient pricing. Retailers accept it more readily than a general escalator, because the underlying benchmark is external, verifiable and clearly outside the manufacturer's control.

Portfolio Architecture for Margin Defence

Margin architecture in analgesics has almost nothing to do with clinical value and almost everything to do with how easily a product can be copied. Plain generic tablets and retailer own-brand earn manufacturing margins measured in low single-digit cents. Branded oral analgesics earn consumer goods margins built purely on trust. Topical and specialised formats earn more because the formulation genuinely resists copying, and novel prescription analgesics earn pharmaceutical margins entirely.
The volume versus premium tension is sharper here than in most healthcare categories because the products are chemically indistinguishable. A branded paracetamol tablet and a private label one are the same compound at the same dose, and the entire premium rests on packaging, recommendation and habit. That is a real asset, demonstrably durable across decades, and it is also one that erodes quietly whenever a retailer improves its own presentation.

High-value pools sit where formulation or regulation creates genuine barriers. Transdermal patches, fast-dissolve technology, paediatric dosing systems, prescription combination products and the emerging non-opioid prescription class all support pricing that plain tablets cannot. Routine oral paracetamol and ibuprofen represent most doses consumed worldwide and a modest share of category value, and that gap has widened steadily over the past decade.

Volume / Commodity-Adjacent Tier

Generic and retailer own-brand oral paracetamol, ibuprofen and aspirin, competing purely on delivered cost against chemically identical products. Chinese and Indian active ingredient pricing sets the floor, and contract manufacturing margins compress whenever input costs move at all.
Gross Margin: 12-20%

Premium / Certified Tier

Branded oral analgesics and specialised formats including fast-dissolve, liquid capsule and paediatric dosing systems, where consumer trust and formulation complexity protect pricing. Pharmacist recommendation adds materially in markets that keep analgesics behind the counter.
Gross Margin: 38-52%

Sustainability / Regulatory / Next-Generation Tier

Topical and transdermal preparations plus novel non-opioid prescription analgesics, protected by adhesive and delivery technology or by patent and regulatory exclusivity. Best margins in the category by a wide distance, and the only genuinely defensible positions.
Gross Margin: 60-75%
global-analgesics-market-portfolio-architecture-1787303435516

Habit Economics Across Repeat Purchase

Analgesics generate the most reliable repeat purchase in consumer health. A household buys pain relief several times a year for decades, and brand selection is made once and then repeated with almost no reconsideration. That habit is the entire commercial asset, and it explains why brands whose patents expired generations ago still command premiums. Acquisition of a new household is expensive; retention costs almost nothing once the habit forms.
Stickiness varies considerably by purchase context. Analgesics bought for children show the strongest brand loyalty of any category tracked here, because parents will not experiment on a sick child. Purchases for elderly relatives behave similarly. Adults buying for themselves switch far more readily on price, which is precisely where private label has taken its share. Prescription analgesic loyalty follows the prescriber rather than the patient entirely.

Buyer profiles have shifted with channel. A decade ago most analgesic purchases happened in pharmacies where a pharmacist could recommend, and that recommendation carried real weight. Today grocery and online retail take a growing share, and the recommendation disappears with it. Younger consumers research active ingredients online before purchasing, arriving at the shelf knowing paracetamol is paracetamol.
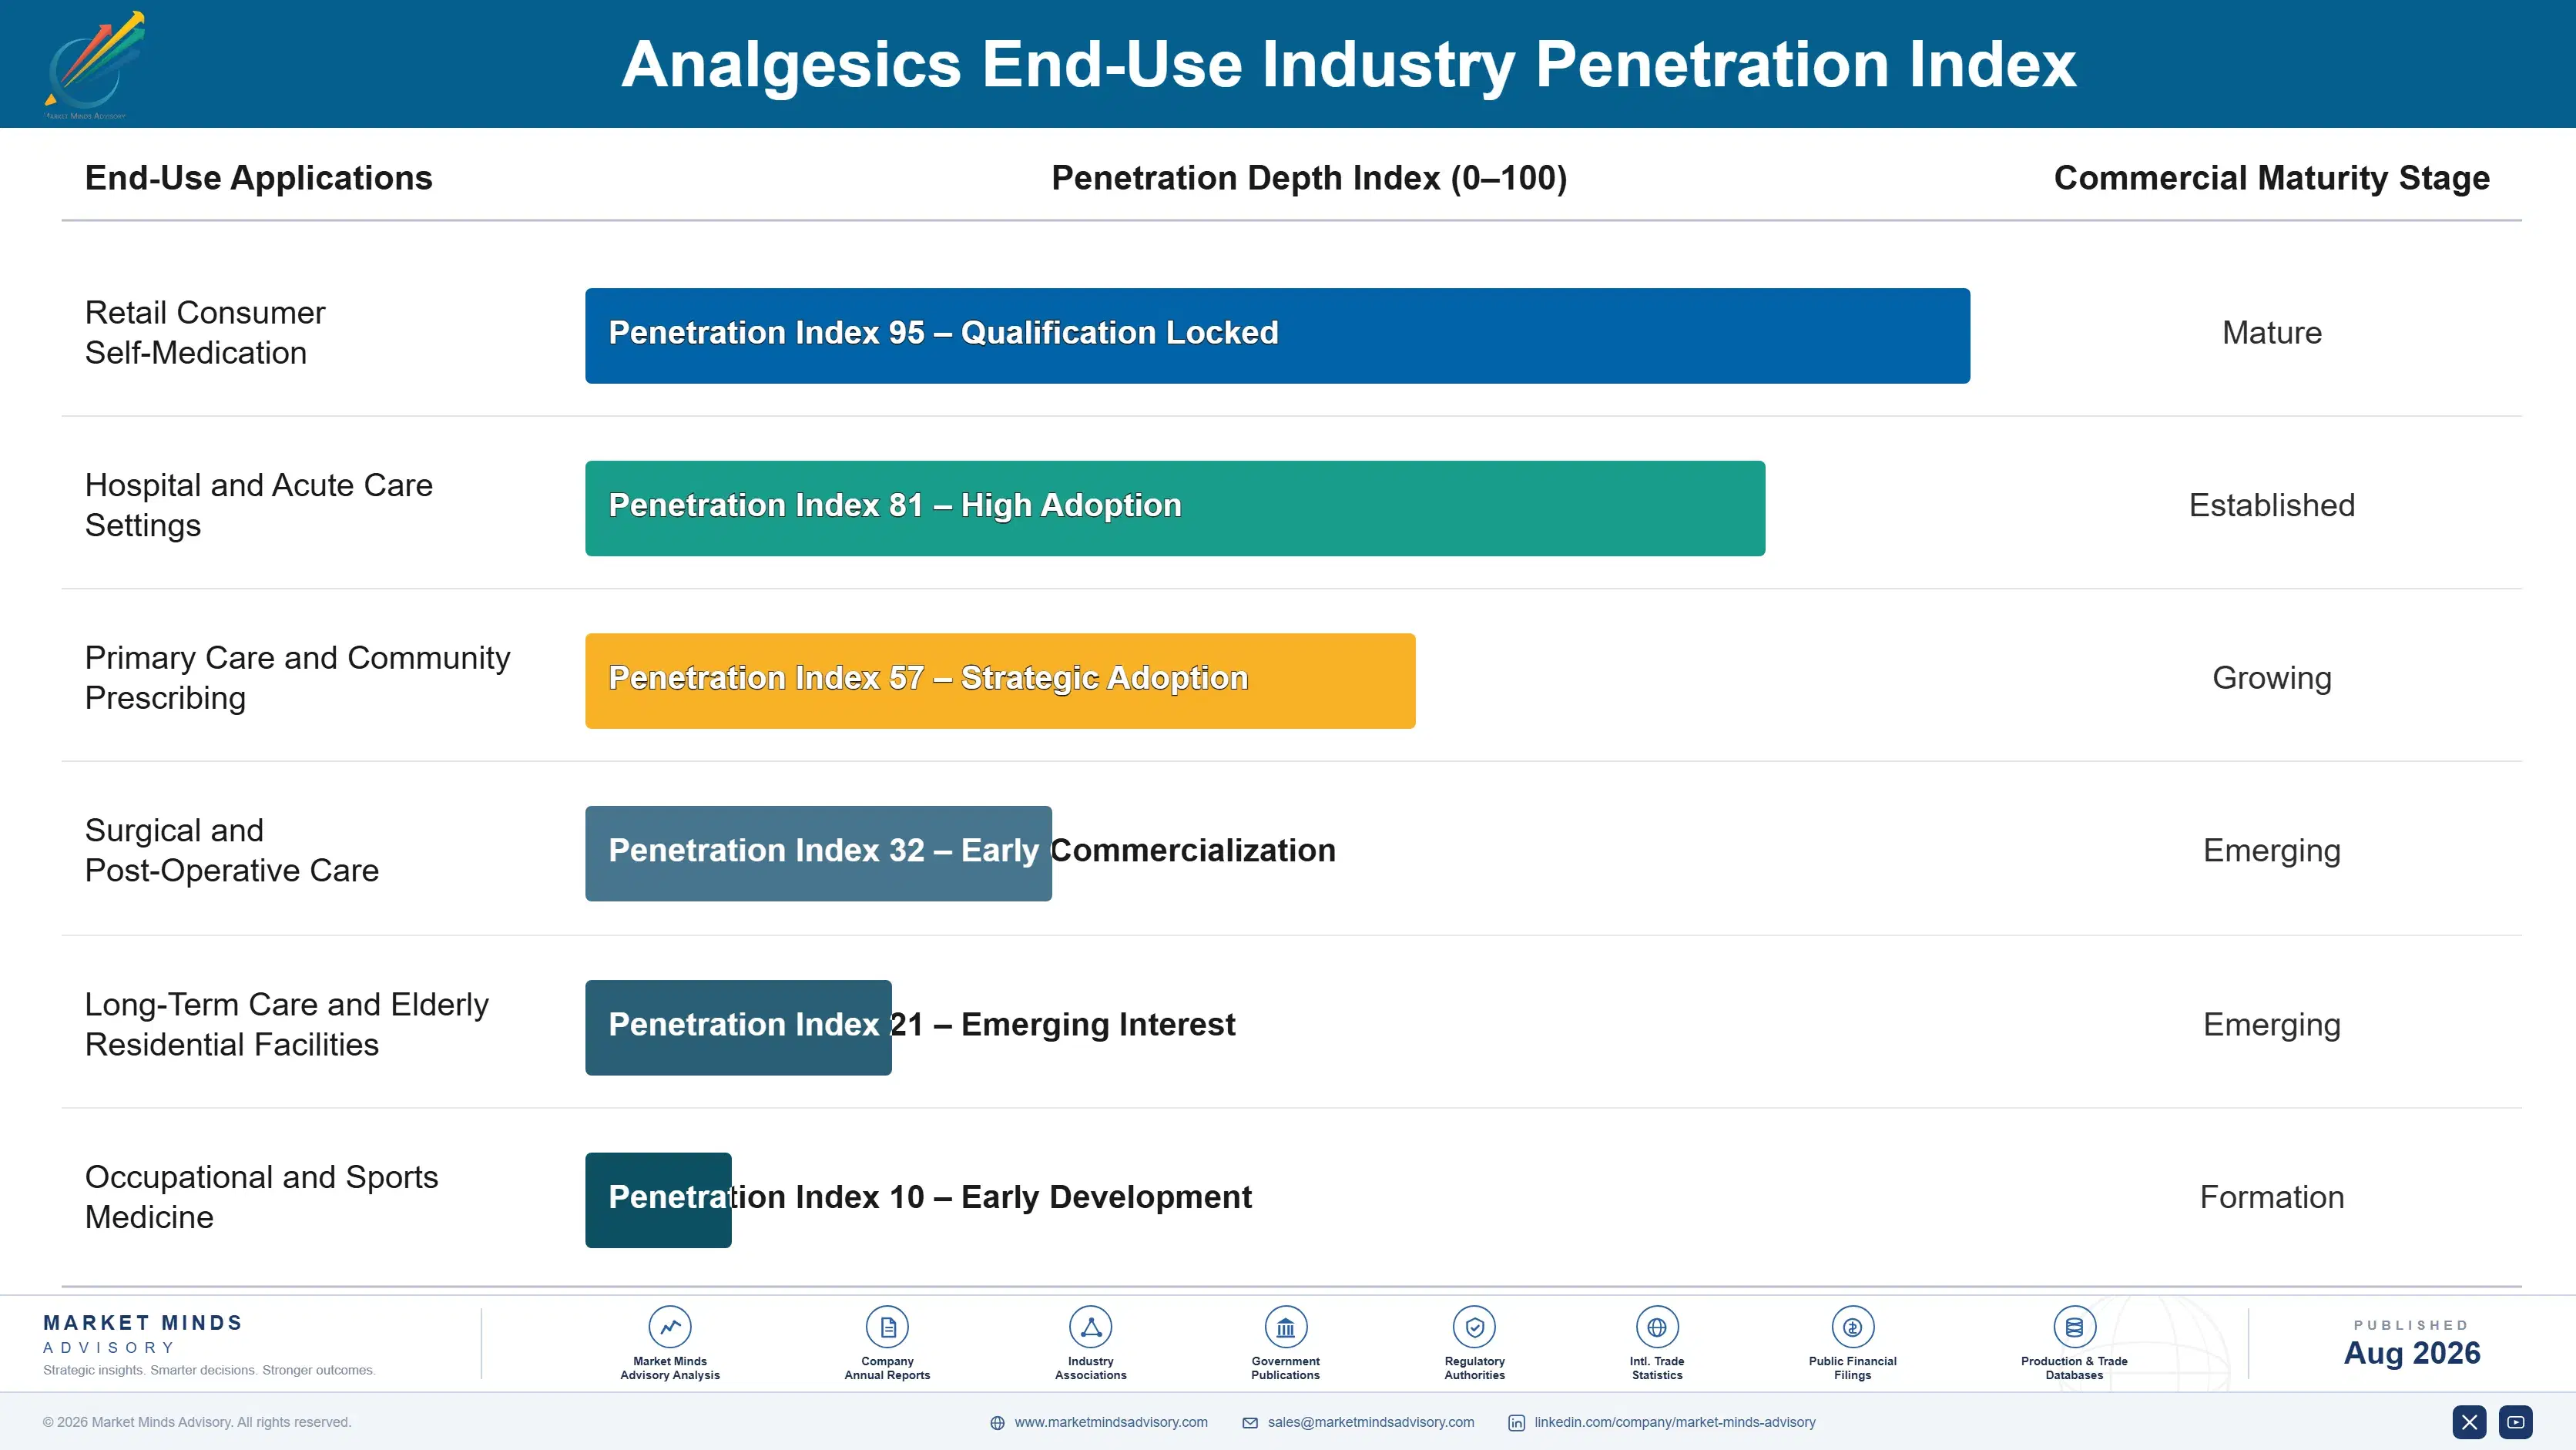
global-analgesics-market-end-use-penetration-index-1787303436389

Where Analgesic Strategy Must Land

These are among the four positions where our research anticipates prominent divergence between winners and laggards over the coming forecast period. Each is grounded in the demand model, the regulatory perimeter, and the announced capacity pipeline.
01 / FORMAT INNOVATION PRIORITY

Advertising no longer defends a premium that formulation can

Private label sells chemically identical tablets at roughly 40% below branded pricing on exactly the same retail shelf, and consumers increasingly understand that the two compounds are genuinely indistinguishable. Fast-dissolve preparations, liquid capsules, paediatric dosing systems and genuine combination products all carry manufacturing barriers that retailer own-brand suppliers need years to replicate properly. Reallocating spend from media toward formulation and packaging engineering is deeply uncomfortable for brand-led organisations, and it is nonetheless the only thing that still protects margin now.
02 / SUPPLY SOURCE DIVERSIFICATION

One country supplies most of the active ingredient here

Roughly 68% of the world's paracetamol active ingredient originates in China, a concentration produced by two full decades of cost competition rather than by any deliberate sourcing decision anybody ever made. Qualifying Indian, European or domestic secondary sources costs around 15% more per kilogram and requires regulatory change control completed well before the disruption arrives. Manufacturers holding a qualified second source kept their shelves filled through the last disruption, while competitors took stockouts and then permanently lost the placement that followed.
03 / PAYER EVIDENCE PREPARATION

Novel analgesics live or die on health economic argument

Non-opioid prescription analgesics face a pricing gap of several hundred times against generic alternatives, and no amount of clinical elegance closes a gap of that magnitude on its own merits. What works instead is economic evidence payers already measure: avoided opioid dependence, reduced post-surgical readmission and shorter recovery time all carry costs that appear in existing budget lines. Companies developing in this class should be running health economic studies alongside phase three trials rather than treating them as a post-approval afterthought.
04 / CHANNEL POSITION DEFENCE

Pharmacist recommendation disappears when regulation opens distribution

Markets that keep analgesics behind the pharmacy counter, notably France and Germany, sustain branded share roughly 25% above what those same brands manage to achieve in open grocery channels elsewhere. That advantage rests entirely on a regulatory arrangement that national governments periodically review and occasionally remove altogether without a great deal of warning. Companies should therefore map deregulation risk market by market well before committing any long-term investment to counter-level relationships that a single policy decision could render entirely worthless.

Engagement Snapshot From the Field

A live engagement with an industry participant carrying material or product regulatory and market exposure ahead of a defining policy shift, showing how our research translates into a defensible multi-year portfolio strategy.
MARKET MINDS ADVISORY · CLIENT ENGAGEMENT SUMMARY
Analgesics Producer Strategic Portfolio Review and Transition Roadmap 2026·Investment Scenario on Analgesics Exposure Evaluation 2025-26
CLIENT PROFILE
A multinational consumer health company with a leading branded oral analgesic franchise across Western European and Latin American markets, generating annual analgesic revenue of approximately USD 1.4 billion (client-reported, unverified by MMA). Roughly 85% of that came from plain oral paracetamol and ibuprofen formats, with a small topical range acquired several years earlier that had received limited investment or commercial attention since.
STRATEGIC CHALLENGE
Private label had taken share for five consecutive years across the client's core European grocery channels while active ingredient costs stayed elevated, compressing margin from both ends at once. The board wanted to know whether to defend the oral franchise through increased brand investment, or to redirect capital into topical formats where barriers looked more durable but the position was small.
MMA APPROACH
MMA conducted 47 expert interviews across retail category managers, pharmacists, general practitioners, contract manufacturers and active ingredient suppliers in six countries. A quantitative survey of 3,800 consumers established brand selection behaviour, price sensitivity and purchase context across oral and topical formats. We then modelled contribution margin and share trajectory for both strategic options under continued private label expansion and elevated input cost conditions.
KEY FINDINGS
  1. Consumers buying analgesics for children or elderly relatives showed brand loyalty roughly three times stronger than adults purchasing for themselves, and price sensitivity in those contexts was almost absent.
  2. Retail category managers in five of six countries planned further private label expansion in plain oral formats, and none intended to expand own-brand into topical or transdermal ranges within three years.
  3. Topical contribution margin ran substantially above oral branded equivalents, and adhesive and delivery formulation presented barriers that retail own-brand suppliers had consistently declined to attempt.
  4. Incremental brand advertising on plain oral formats showed measurably declining returns, with share response falling well below the levels the same spending achieved five years earlier.
CLIENT PROFILE
A multinational consumer health company with a leading branded oral analgesic franchise across Western European and Latin American markets, generating annual analgesic revenue of approximately USD 1.4 billion (client-reported, unverified by MMA). Roughly 85% of that came from plain oral paracetamol and ibuprofen formats, with a small topical range acquired several years earlier that had received limited investment or commercial attention since.
STRATEGIC CHALLENGE
Private label had taken share for five consecutive years across the client's core European grocery channels while active ingredient costs stayed elevated, compressing margin from both ends at once. The board wanted to know whether to defend the oral franchise through increased brand investment, or to redirect capital into topical formats where barriers looked more durable but the position was small.
MMA APPROACH
MMA conducted 47 expert interviews across retail category managers, pharmacists, general practitioners, contract manufacturers and active ingredient suppliers in six countries. A quantitative survey of 3,800 consumers established brand selection behaviour, price sensitivity and purchase context across oral and topical formats. We then modelled contribution margin and share trajectory for both strategic options under continued private label expansion and elevated input cost conditions.
KEY FINDINGS
  1. Consumers buying analgesics for children or elderly relatives showed brand loyalty roughly three times stronger than adults purchasing for themselves, and price sensitivity in those contexts was almost absent.
  2. Retail category managers in five of six countries planned further private label expansion in plain oral formats, and none intended to expand own-brand into topical or transdermal ranges within three years.
  3. Topical contribution margin ran substantially above oral branded equivalents, and adhesive and delivery formulation presented barriers that retail own-brand suppliers had consistently declined to attempt.
  4. Incremental brand advertising on plain oral formats showed measurably declining returns, with share response falling well below the levels the same spending achieved five years earlier.
RECOMMENDED STRATEGY
Phase 1: Phase one: hold oral brand investment flat rather than increasing it, and redirect the planned increment toward topical range extension and paediatric dosing formats. Phase 2: Phase two: qualify an Indian secondary active ingredient source across the full oral portfolio to reduce single-country exposure and stockout risk. Phase 3: Phase three: concentrate remaining oral brand spending on paediatric and elderly care positioning, where loyalty is strongest and private label competes least effectively.
OUTCOME
The client redirected approximately USD 95 million from oral media spend into topical range development and secondary source qualification (client-reported, unverified by MMA). Two years on, topical revenue had roughly doubled, blended analgesic gross margin had recovered about four percentage points, and the oral franchise had held share in paediatric formats while continuing to concede adult volume.

Frequently Asked Questions

Foundational context covering the market sizes, CAGR, scope, country, region and competition that inform every finding below. This section is provided to cover basics and most often pre-purchase conversations, answered from the MMA Primary Research Dataset.

What is the current size of the Analgesics Market?

The global analgesics market was valued at USD 82.0 billion in 2025, covering NSAIDs, paracetamol, opioids, topical preparations, adjuvant agents and novel non-opioid prescription analgesics. Roughly 71% of doses move through over-the-counter channels.

How large will the Analgesics Market be by 2036?

MMA forecasts the market at USD 152.46 billion by 2036, expanding 1.76 times from the 2026 base of USD 86.76 billion. That represents roughly USD 65.7 billion of incremental value across the forecast decade.

What is the CAGR for the Analgesics Market 2026 to 2036?

The base case compound annual growth rate is 5.8%, with a bull case of 7.0% and a bear case of 4.6%. The bull case depends on broad payer coverage for novel non-opioid prescription analgesics.

Which segment is growing fastest?

Non-opioid prescription analgesics grow at 8.7%, a full 1.50x the overall market rate, though from a base that barely existed before 2025. Topical and local analgesics follow at 7.2%.

Who are the major companies in the Analgesics Market?

Kenvue, Haleon, Bayer, Reckitt Benckiser and Sanofi together hold 26% of analgesic revenue. Concentration is low because generic and retailer own-brand manufacturers supply most doses while branded houses capture most value.

Which country is growing fastest?

India grows fastest at 9.6%, driven by organised pharmacy chains replacing informal loose-tablet sale across smaller cities. South Asia and Pacific is the fastest region overall at 8.0%.

Report Segmentation Architecture

The full report scope spans multiple orthogonal segmentation dimensions, with cross-tabulated demand data provided for each dimension pair. Coverage extends further to regional breakdowns, trend trajectories, and the competitive detail needed to support segment-level decision-making.

By Pharmacological Class

  • Non-Steroidal Anti-Inflammatory Drugs
  • Paracetamol and Combination Products
  • Opioid Analgesics
  • Non-Opioid Prescription Analgesics
  • Topical and Local Analgesics
  • Adjuvant Neuropathic Pain Agents

By End-Use Industry

  • Retail Consumer Self-Medication
  • Hospital and Acute Care Settings
  • Primary Care and Community Prescribing
  • Surgical and Post-Operative Care
  • Long-Term Care and Elderly Residential Facilities
  • Occupational and Sports Medicine

By Commercial Dimension

  • Branded Over-the-Counter Retail
  • Retailer Private Label Supply
  • Pharmacy-Only Distribution
  • Grocery and Mass Merchandise Channels
  • Online and Direct-to-Consumer Sales
  • Hospital and Institutional Tender Supply

By Region

  • East Asia
  • North America
  • Western Europe
  • South Asia and Pacific
  • Latin America
  • Middle East and Africa
  • Eastern Europe

Scope, Methodology, and Coverage

Every figure in this report is reproducible from documented input assumptions. The scope below maps the historical period, the forecast horizon, the segmentation dimensions, and the countries covered, alongside the underlying primary and qualitative methodology.
Historical Period
2020 to 2025
Forecast Period
2026 to 2036
Base Year
2025 (USD billions; MMA Primary Research Dataset, August 2026)
Market Definition
This market comprises pharmaceutical products whose primary indication is the relief of pain, measured at manufacturer revenue across prescription and over-the-counter channels in retail, pharmacy, hospital and institutional settings. Coverage spans non-steroidal anti-inflammatory drugs including ibuprofen, diclofenac, naproxen and aspirin, paracetamol and its combination products, opioid analgesics across oral, transdermal and injectable formats, novel non-opioid prescription analgesics including selective sodium channel blockers, topical and local analgesic preparations including gels, patches and capsaicin formulations, and adjuvant agents prescribed principally for neuropathic pain. General and regional anaesthesia agents, migraine-specific therapies including triptans and CGRP inhibitors, disease-modifying antirheumatic drugs, medical devices delivering analgesia, veterinary analgesics, and non-pharmacological pain interventions fall outside scope.
Quantitative Units
USD billions (current prices); dose volumes by pharmacological class; average price per dose; active ingredient tonnage by origin; retail channel value split
Segmentation Dimensions
By Pharmacological Class; By End-Use Industry; By Commercial Dimension; By Region
Regions Covered
East Asia, North America, Western Europe, South Asia and Pacific, Latin America, Middle East and Africa, Eastern Europe
Countries Covered
United States, Canada, Mexico, United Kingdom, Germany, France, Italy, Spain, Netherlands, Belgium, China, Japan, South Korea, Taiwan, India, Indonesia, Vietnam, Thailand, Australia, Brazil, Argentina, Colombia, Chile, Saudi Arabia, United Arab Emirates, Egypt, Nigeria, South Africa, Poland, Czechia, Hungary, Romania, Russia, and additional markets relevant to analgesic supply and consumption
Key Companies Profiled
Kenvue, Haleon, Bayer, Reckitt Benckiser, Sanofi, Vertex Pharmaceuticals, Teva Pharmaceutical Industries, Viatris, Perrigo Company, Sun Pharmaceutical Industries, Cipla, Dr. Reddy's Laboratories, Hikma Pharmaceuticals, Taisho Pharmaceutical, Kobayashi Pharmaceutical, Hisamitsu Pharmaceutical, GrĂ¼nenthal, Menarini Group, Glenmark Pharmaceuticals, Zydus Lifesciences
Quantitative Methodology
Primary survey, n=3,800 respondents, Q4 2025, six countries; demand-side model with trade association cross-validation
Qualitative Methodology
47 expert interviews, Q4 2025; applied to validate demand model assumptions, identify emerging dynamics, and assess competitive positioning
Report Format
PDF and XLSX data workbook (Word format preview document)
Publisher
Market Minds Advisory
Report Code
MMA-2026-HLT-980
Published
August 2026
Contact
sales@marketmindsadvisory.com | www.marketmindsadvisory.com

Purchase the full Analgesics Market Report (2026 to 2036).

The full MMA report examines how a category built on free chemistry defends value, tracing brand premium durability, private label advance and the arrival of prescription analgesics priced in a different universe entirely. It sizes six pharmacological classes and seven regions to 2036, modelling dose volumes, average price and channel structure separately so that volume and value trajectories can be distinguished. Competitive assessment covers twenty manufacturers on one consistent revenue basis. Input cost exposure is traced through active ingredient origin concentration and packaging economics. Four commercial levers and a strategic verdict close the report, grounded in 47 expert interviews and a 3,800-respondent survey.
Six pharmacological classes sized separately to 2036
Private label advance quantified across developed retail markets
Active ingredient origin concentration mapped by country
Twenty manufacturers assessed on one consistent basis
Novel non-opioid payer coverage scenarios modelled fully
Anonymised client engagement with tested strategic recommendations

Built For The People Who Decide

From boardroom strategy to bench-side execution, this report is read cover-to-cover by leaders shaping the next decade of their industry, turning demand scenarios, market dynamics and valuation benchmarks into decisions.
CXOs/ Presidents/ VPs/ Managers
M&A and Corporate Development
Strategy Teams and R&D Heads
Procurement and Product Directors
Regulatory and Compliance Leaders
Investor Relations and Equity Analysts