Market Minds Advisory
Glass Additives Market

Glass Additives Market: Redox Control, Selenium That Mostly Escapes, and Cullet Rewriting Every Batch Sheet

Additives are 1.4% of batch weight and most of what can ruin a furnace campaign. Rising cullet ratios now force a recalculation of the whole package every few weeks of operation.

Lead Analyst

Bilal Shaikh

Published

September 2026

Make Smarter Decisions with Customized Research Insights

Request a free sample report and evaluate market opportunities, growth trends, and competitive dynamics relevant to your business needs.

2025 MARKET VALUE$1.6BMarket Size 2025
2036 FORECAST VALUE$2.9BBase Case , 2026 to 2036
CAGR 2026 TO 20365.4 %Bull 6.6% / Bear 4.2%
INCREMENTAL OPPORTUNITY$1.2BNet 10- year value creation
EXPANSION MULTIPLE1.69x2036 value over 2026 base
Strategic Levers
M&A Pipeline
Regional Outlook
Country Rankings
Competitive Intelligence
Segmental Deep-dive
Call-Us : 91 93563 13602

Executive Snapshot and Market Trajectory

Additives make up around 1.4% of what goes into a glass furnace and account for most of what can go wrong inside it. Colour, bubble count, and iron redox are all set by materials dosed at fractions of a percent into a melt nobody can stop.
Commercial advantage belongs to suppliers who help a glassmaker recalculate the batch as cullet ratios shift rather than those selling oxide by the tonne, because reformulation now happens roughly every 14 weeks per furnace. UV and infrared absorbers grow fastest at 9.8%, roughly 1.81 times the market. East Asia holds the largest position at 33% of value, above the standard band, on combined container, flat, and solar glass output.
Concentration is low at roughly 30% for the top five, since most of these oxides are widely available industrial chemicals. Technical service is what separates suppliers. Selenium retention near 28% makes dosing genuinely difficult, and supply of it depends on copper refining rather than on any glass demand at all. Cerium sits inside a rare earth chain concentrated in one country, which is a comparable exposure arriving from a completely different direction entirely.
Market Definition
The market comprises functional additives dosed into glass batch to control colour, refining, redox, and optical properties, covering colourants, decolourisers, fining and refining agents, redox control agents, UV and infrared absorbers, and opacifiers with specialty modifiers. Value is measured at additive supplier level. Primary batch materials including silica sand, soda ash, limestone, and feldspar, recycled cullet, furnace refractories, glass coatings applied after forming, and finished glass products fall outside scope.
Base Year Value
$1.6B in 2025 (MMA Primary Research Dataset, August 2026)
Forecast Period
2026 to 2036, eleven discrete annual values
CAGR
5.4% base case. Bull 6.6%. Bear 4.2%.
Fastest Growth Segment
UV and Infrared Absorbers: 9.8% CAGR
Fastest Growth Country
India: 8.6% CAGR
Fastest Growth Region
South Asia and Pacific: 7.6% CAGR
Largest Region
East Asia: 33% of 2025 global value
Market Leaders
Vibrantz Technologies, Venator Materials, Cathay Industries, The Shepherd Color Company, and Tosoh lead on glass additive supply revenue. Source: company annual reports and MMA Analysis, July 2026.
Primary Survey
n=3,800 procurement and R&D decision-makers, Q4 2025, six countries
Methodology
Demand-side build-up, cross-validated against public data, 47 expert interviews

Glass Additives Market Forecast Scenarios

glass-additives-market-trend-size-forecast-scenario-1787551542160
Between 2020 and 2025 recycled content rose faster than most batch chemists had planned for. Packaging regulation pushed container glass cullet ratios upward across Europe and North America, and every increase changed the colour and redox history arriving in the furnace. Solar glass capacity expanded enormously and pulled cerium and low-iron requirements with it. The 4.4% historical rate combines flat volumes with a mix shift toward technically demanding grades.
The 5.4% base case rests on three mechanisms. Solar glass capacity keeps expanding and requires ultraviolet stability additives that ordinary container and flat glass never needed. Cullet ratios continue rising under packaging regulation, which raises reformulation frequency and the technical service attached to it. And architectural solar control glazing keeps growing on building energy performance rules across most developed markets. None of the three depends on total melted tonnage rising at all.
The 6.6% bull case assumes solar glass build-out runs at the upper end of announced capacity while architectural glazing standards tighten further. The 4.2% bear case reflects container glass volumes declining as packaging shifts to other materials, rare earth supply disruption raising cerium costs sharply, and glassmakers substituting toward cheaper additive packages under margin pressure of their own.

One Percent That Decides Everything

The commercial position of an additive supplier rests on a peculiar asymmetry. These materials are 1.4% of batch weight and cost very little relative to the sand and soda ash they accompany, and they determine colour, seed count, and iron redox in a furnace running continuously for years. Getting the package wrong ruins glass at a rate nobody can pause to correct.
TOP-FIVE CONCENTRATION30%Combined share of additive supply held by leading producers
BATCH WEIGHT CONTRIBUTION1.4%Portion of total batch mass supplied as additives
SELENIUM MELT RETENTION28%Share of dosed selenium remaining in the finished glass
CONTAINER GLASS DEMAND SHARE37%Portion of volume entering bottle and jar production
CULLET RATIO AVERAGE58%Recycled content share across container glass furnaces globally
BATCH REFORMULATION FREQUENCY14 weeksTypical interval between additive package adjustments per furnace
Cullet has made that harder rather than easier. Recycled content averages 58% in container glass and each delivery arrives carrying its own colour and redox history from whatever the glass was before. The batch chemist has to compensate, which means recalculating the additive package roughly every 14 weeks rather than setting it once. Suppliers who help with that calculation hold a relationship that oxide pricing never generates.
Selenium illustrates the difficulty better than anything else. It serves as both a colourant for bronze glass and a decolouriser in flint containers, retention in the melt runs near 28% because most of it volatilises, and supply comes from copper refining rather than from any glass-driven production. Dosing is genuinely an art, and the price moves on decisions taken in copper smelters.
"Batch chemists talk about redox the way sommeliers talk about vintage, and the frustrating thing is that they are right. Two furnaces with identical batch sheets and different cullet streams produce visibly different glass, and no supplier selling oxide by the tonne can explain why."
Practice Director, Inorganic Specialties and Glass Chemistry · MMA Specialty Inorganic Chemicals Practice · August 2026

Market Trends

Rising Cullet Ratios Force Continuous Batch Recalculation

Recycled content averaging 58% in container glass brings colour and redox history into the furnace that varies with every delivery, since the cullet was previously bottles of unpredictable composition. Batch chemists compensate by adjusting the additive package, which now happens roughly every 14 weeks per furnace rather than at annual review. Packaging regulation keeps pushing those ratios higher. Suppliers who support the recalculation hold a technical relationship that pure oxide supply cannot generate at any price. Every increase in recycled content therefore raises the technical service requirement rather than simply changing the batch composition.
Market Impact: Architectural glass adds 24% share
Solar Glass Pulls Ultraviolet Stability Requirements Upward

Photovoltaic cover glass must transmit light for decades without solarisation or discolouration, which requires cerium and related additives that ordinary container and flat glass never needed at all. Capacity expansion across Chinese and Indian module manufacture has pulled that demand sharply upward. Ultraviolet and infrared absorbers grow at 9.8%, the fastest function here. Rare earth supply concentration makes cerium pricing a genuine risk that glassmakers have started to hedge through contracts rather than accepting spot exposure. Inventory-holding suppliers were the only ones able to commit volume across a multi-year contract during the last tightening.
Market Impact: East Asia holds 33% of value

Market Opportunities and Growth Drivers

Building Energy Rules Expand Solar Control Glazing

Building regulations across developed markets keep tightening on thermal performance, and solar control glazing using iron, cobalt, and selenium colourants to manage heat gain is one of the cheaper routes to compliance. That demand is specification-driven rather than discretionary, since the glazing must meet a stated performance figure. Architectural glass carries considerably higher additive value per tonne than container glass does. Growth follows building code revision timetables that are published years ahead of taking effect anywhere. Suppliers tracking those revision timetables position with float producers before the requirement lands rather than quoting afterwards.
Market Impact: Only 28% of selenium is retained

Asian Glass Capacity Anchors Global Additive Consumption

Chinese container, flat, and solar glass production together exceed every other region combined, and Indian capacity is expanding rapidly behind it. India grows fastest of any country at 8.6% as float and container capacity builds out against domestic construction and packaging demand. East Asia holds 33% of value, above the standard regional band, on production scale rather than on any specification advantage. Domestic additive suppliers serve most of that volume at prices international producers cannot approach. Specification sophistication is rising quickly even where pricing remains the primary purchasing consideration for most customers.
Market Impact: Absorbers now 9.8% growth segment

Market Restraints and Challenges

By-Product Supply Makes Selenium Pricing Uncontrollable

Selenium comes from copper refining anode slimes rather than from any dedicated production, so availability follows copper output and smelter economics regardless of what glassmakers need. Retention near 28% in the melt means most of what is dosed volatilises anyway. The root cause is metallurgical rather than commercial. Suppliers mitigate through inventory positions carried across cycles, through multi-year offtake with refiners, and by developing selenium-free colour and decolourising packages where the glass specification permits it. Glassmakers have started contracting rather than buying spot, which favours whoever carries inventory through the cycles nobody can forecast.
Market Impact: Cullet averages 58% of batch

Rare Earth Concentration Threatens Cerium Availability

Cerium oxide for ultraviolet stability and decolourising comes from a rare earth supply chain concentrated overwhelmingly in China, where export policy has moved prices sharply before without warning. The root cause is processing concentration rather than geological scarcity. Suppliers mitigate through inventory, through qualification of non-Chinese separation capacity as it develops, and by formulating packages that reduce cerium loading where the optical specification allows any substitution at all. Non-Chinese separation capacity is developing slowly and qualification of that material takes optical testing time nobody can compress, so the exposure persists well into the forecast period.
Market Impact: Absorber demand grows at 9.8%
4 additional market trends, 3 additional growth drivers, and 2 additional restraints and challenges are covered in the full report. Contact sales@marketmindsadvisory.com to access the complete intelligence.

Segment CAGR and Growth Architecture

Segmentation follows additive function, because each group solves a different problem in the melt and carries a distinct supply chain, dosing tolerance, and technical service requirement. Six functions cover commercial supply, and the divide between materials controlling appearance and materials controlling furnace behaviour matters far more commercially than any distinction between the oxides involved.
glass-additives-market-trend-market-share-analysis-1787551542688

UV and Infrared Absorbers

The fastest function at 9.8%, roughly 1.81 times the market, driven by photovoltaic cover glass that must transmit light for decades without solarisation and by architectural glazing managing solar heat gain. Cerium oxide carries most of the ultraviolet work and iron chemistry most of the infrared, with vanadium and other additions used in specific formulations. Rare earth supply concentration makes cerium pricing a genuine commercial risk rather than a routine input question. Glassmakers have begun contracting rather than buying spot, which suits suppliers holding inventory positions. Iron chemistry doing the infrared work is far less constrained than the cerium doing ultraviolet work, which means the two halves of this function carry completely different supply risk profiles.
CAGR 9.8%

Opacifiers and Specialty Modifiers

Second fastest at 7.2%, covering fluorides, zirconia, titania, and related materials that produce opacity, surface durability, or specific refractive behaviour in tableware, lighting, technical, and display glass. Volumes are small against colourants and value per tonne runs considerably higher, because these applications specify tightly and tolerate very little variation. Fluoride emissions regulation has restricted some traditional opacifying routes, which pushed formulation work toward alternatives. Technical glass and display applications are where the growth sits, rather than in the tableware that historically defined this function. Qualification with a technical or display glass producer runs long and holds afterwards, which makes these positions considerably more durable than anything in container or float supply. Volumes stay small throughout.
CAGR 7.2%
Full segment breakdown across 6 segments available in the complete report.

Regional Architecture and Country Demand Map

Regional shares follow glass melting capacity weighted by how technically demanding the product mix is. East Asia sits above the standard band for the reason stated below, and every other region falls inside its range across the forecast period. Melted tonnage alone predicts value poorly here.

North America

Container glass remains the largest application and cullet ratios have risen steadily under state deposit schemes and packaging commitments, which drives the reformulation frequency that technical service depends on. Architectural solar control glazing demand follows building energy codes that vary considerably between states and provinces. Vibrantz and Shepherd hold established positions with batch chemists at major glassmakers. Solar glass manufacture is growing under domestic content rules. Growth of 5.2% reflects mix improvement toward technical grades more than any increase in melted tonnage. Deposit schemes producing cleaner, better-sorted cullet make the recalculation problem more tractable here than in markets where collection is mixed, which is a genuine advantage batch chemists rarely mention. Colour separation matters enormously.
Share: 22% | CAGR: 5.2% (2026 to 2036)

Western Europe

Container glass cullet ratios are the highest anywhere, exceeding regional averages substantially under packaging regulation that has been tightening for decades, which makes batch recalculation close to continuous work. Fluoride and heavy metal restrictions have removed several traditional additive routes and forced reformulation across tableware and technical glass. Venator, Solvay, and Merck hold technically strong positions. Furnace closures on energy cost have reduced melted tonnage meaningfully. Growth of 3.8% is the slowest anywhere, reflecting declining capacity offset partly by rising technical requirements. Solar glass manufacture here is limited despite substantial installation, which means the fastest-growing additive function generates relatively little regional demand compared with the volume of panels actually deployed across member states.
Share: 19% | CAGR: 3.8% (2026 to 2036)
Regional intelligence for 5 additional markets available in the complete report: East Asia, South Asia and Pacific, Latin America, Middle East and Africa, Eastern Europe. Contact sales@marketmindsadvisory.com.
glass-additives-market-trend-country-cagr-analysis-1787551543205

Four Moves Worth Real Capital

Advantage here comes from helping a batch chemist solve a moving problem, from holding inventory in materials nobody can produce on demand, and from following optical specifications rather than tonnage. Four moves justify capital across the forecast period, and the first reframes what these suppliers are actually selling. Oxide production cost appears nowhere on the list.

Sell batch recalculation, not oxide by the tonne

Cullet at 58% of container batch arrives with unpredictable colour and redox history, which forces additive package adjustment roughly every 14 weeks per furnace rather than at annual review. Suppliers who model the compensation and support the recalculation hold a technical relationship that oxide pricing cannot generate at any level. Those quoting per tonne against widely available industrial chemicals are competing where the top five hold only 30% because nothing else distinguishes them. Rejection rates fall measurably where the support is properly resourced, which is the number a glassmaker will actually pay against rather than any claim about oxide purity.
Market Impact: Supports batch reformulation every 14 weeks per furnace

Carry inventory in by-product constrained materials

Selenium comes from copper refining anode slimes and cerium from a concentrated rare earth chain, so neither responds to glass demand and both have moved sharply on decisions taken elsewhere. Suppliers holding inventory across cycles supply when spot markets tighten and competitors cannot. Glassmakers have begun contracting rather than buying spot precisely because of that exposure. Working capital in these positions returns more than it costs in every tightening the market has produced. Cerium spot pricing moved more than 40% inside a single quarter during the last policy change, and inventory holders were the only suppliers able to commit volume.
Market Impact: Covers a melt retention loss of only 28%

Follow building code revision timetables deliberately

Solar control glazing demand is specification-driven rather than discretionary, and building energy codes publish revision timetables years before they take effect anywhere. Architectural glass carries considerably higher additive value per tonne than container glass, already representing 24% of demand. Suppliers tracking those timetables position with float glass producers before the specification requirement lands. Those responding when the demand appears are quoting into formulations somebody else has already helped develop. Architectural glass also carries considerably higher additive value per tonne than container glass, which makes each specification win worth more than the tonnage comparison suggests it should be.
Market Impact: Serves the 24% share held by architectural glass

Develop packages that reduce constrained material loading

Selenium retention runs near 28% and cerium sits inside a supply chain concentrated in one country, which makes reducing the loading of either a genuine commercial capability rather than a formulation nicety. Alternative colour and decolourising routes exist where the glass specification permits, and cerium loading can frequently be cut without measurable optical penalty. Suppliers offering that reformulation reduce their customer's exposure and their own simultaneously, which is an unusually aligned proposition. Glassmakers have begun asking for this work directly, which turns a defensive reformulation exercise into a reason for the batch chemist to call a supplier at all.
Market Impact: Cuts exposure where only 28% of selenium remains

Who Controls the Margin Pool

Concentration is low at roughly 30% for the top five on additive supply revenue, because most of these materials are widely available industrial oxides that many chemical producers could supply competently. Vibrantz holds the broadest colourant and specialty position. Venator brings titanium and iron chemistry depth, Cathay supplies iron oxides at scale, Shepherd holds strong complex inorganic pigment positions, and Tosoh anchors Japanese technical glass supply.
Competition runs on three dimensions. Technical service to batch chemists is the first, and it is essentially the only thing separating suppliers of chemically identical oxides. Supply security in by-product and rare earth constrained materials is the second. Specification presence with float and solar glass producers is the third, since optical requirements are designed rather than tendered. None of the three is a manufacturing capability.

Pressure is building from two directions. Domestic Chinese and Indian producers supply commodity oxides at prices international suppliers cannot match on any comparable basis. Glassmakers under their own margin pressure substitute toward cheaper packages wherever specification permits. Rankings will shift toward suppliers holding technical service capability and constrained material inventory rather than toward whoever produces oxide most cheaply. Oxide production cost decides only the tonnage nobody differentiates.
glass-additives-market-trend-company-positioning-matrix-1787551543719

Competitive Moat and Risk Dimensions

VIBRANTZ TECHNOLOGIES

Moat: Colourant breadth and batch expertise

Vibrantz spans colourants, decolourisers, and specialty modifiers with technical people who work alongside batch chemists on redox and colour problems rather than supplying against a purchase order. That breadth lets it solve a whole package rather than one line on a batch sheet. Relationships built through furnace campaigns are hard for a commodity supplier to approach.
VIBRANTZ TECHNOLOGIES

Risk: Commodity oxide price competition

Many of the materials involved are widely available industrial chemicals that Chinese and Indian producers supply at prices no Western supplier can match on a comparable cost base. Technical service defends the specification-driven work and not the tonnage underneath it. Glassmakers under margin pressure of their own increasingly separate the two and buy accordingly wherever the specification permits them to.
VENATOR MATERIALS

Moat: Iron and titanium chemistry depth

Venator produces iron oxide and titanium chemistry upstream rather than trading it, which secures supply on materials central to both colour and infrared control in architectural and solar glazing. Manufacturing position also supports consistency that batch chemists value more highly than headline assay. Specification presence with float glass producers reaches decisions taken during product development rather than at purchasing.
VENATOR MATERIALS

Risk: Limited rare earth position

Cerium and related rare earth additives carry the fastest-growing demand in this market at 9.8%, and Venator holds no upstream position in a supply chain concentrated overwhelmingly in one country. That leaves the company trading a material whose price and availability move on export policy decisions. Securing rare earth supply is expensive and takes longer than the growth window allows.

Players Tracked

Prominent Players

Vibrantz Technologies
Venator Materials
Cathay Industries
The Shepherd Color Company
Tosoh

Other Key Players

Solvay
Merck KGaA
Lanxess
Treibacher Industrie
Neo Performance Materials
Umicore
5N Plus
American Elements
Reade International
Chemours
Kronos Worldwide
Nubiola
Colorobbia
Zircomet
Elementis

Recent Developments

MARCH 2025

Container producer contracts additive supply with reformulation support

A European container glass group restructured additive purchasing to include continuous batch recalculation support, after cullet ratio increases made the previous annual formulation review inadequate for maintaining colour consistency across furnaces. Pricing rose and rejection rates fell measurably during the following year. Nobody had priced it before.
Signal: Technical support is now being contracted explicitly rather than simply expected free alongside ordinary oxide supply
JULY 2025

Solar glass maker contracts cerium supply on multi-year terms

A photovoltaic cover glass manufacturer moved cerium oxide purchasing onto multi-year contracted supply after spot pricing moved sharply on rare earth export policy changes. Inventory-holding suppliers were the only ones able to commit volume across the requested contract period at all. Price was a secondary consideration.
Signal: Constrained material exposure is now pushing glassmakers away from spot buying toward contracted supply relationships instead
NOVEMBER 2025

Glassmaker reformulates to reduce selenium loading

A container producer worked with its additive supplier to cut selenium loading in flint glass decolourising, motivated by both cost and the volatility of a material whose retention in the melt runs below a third. Optical results met specification without any measurable penalty. Cost fell alongside the risk.
Signal: Reducing constrained material loading is becoming a shared supplier and customer objective rather than a compromise

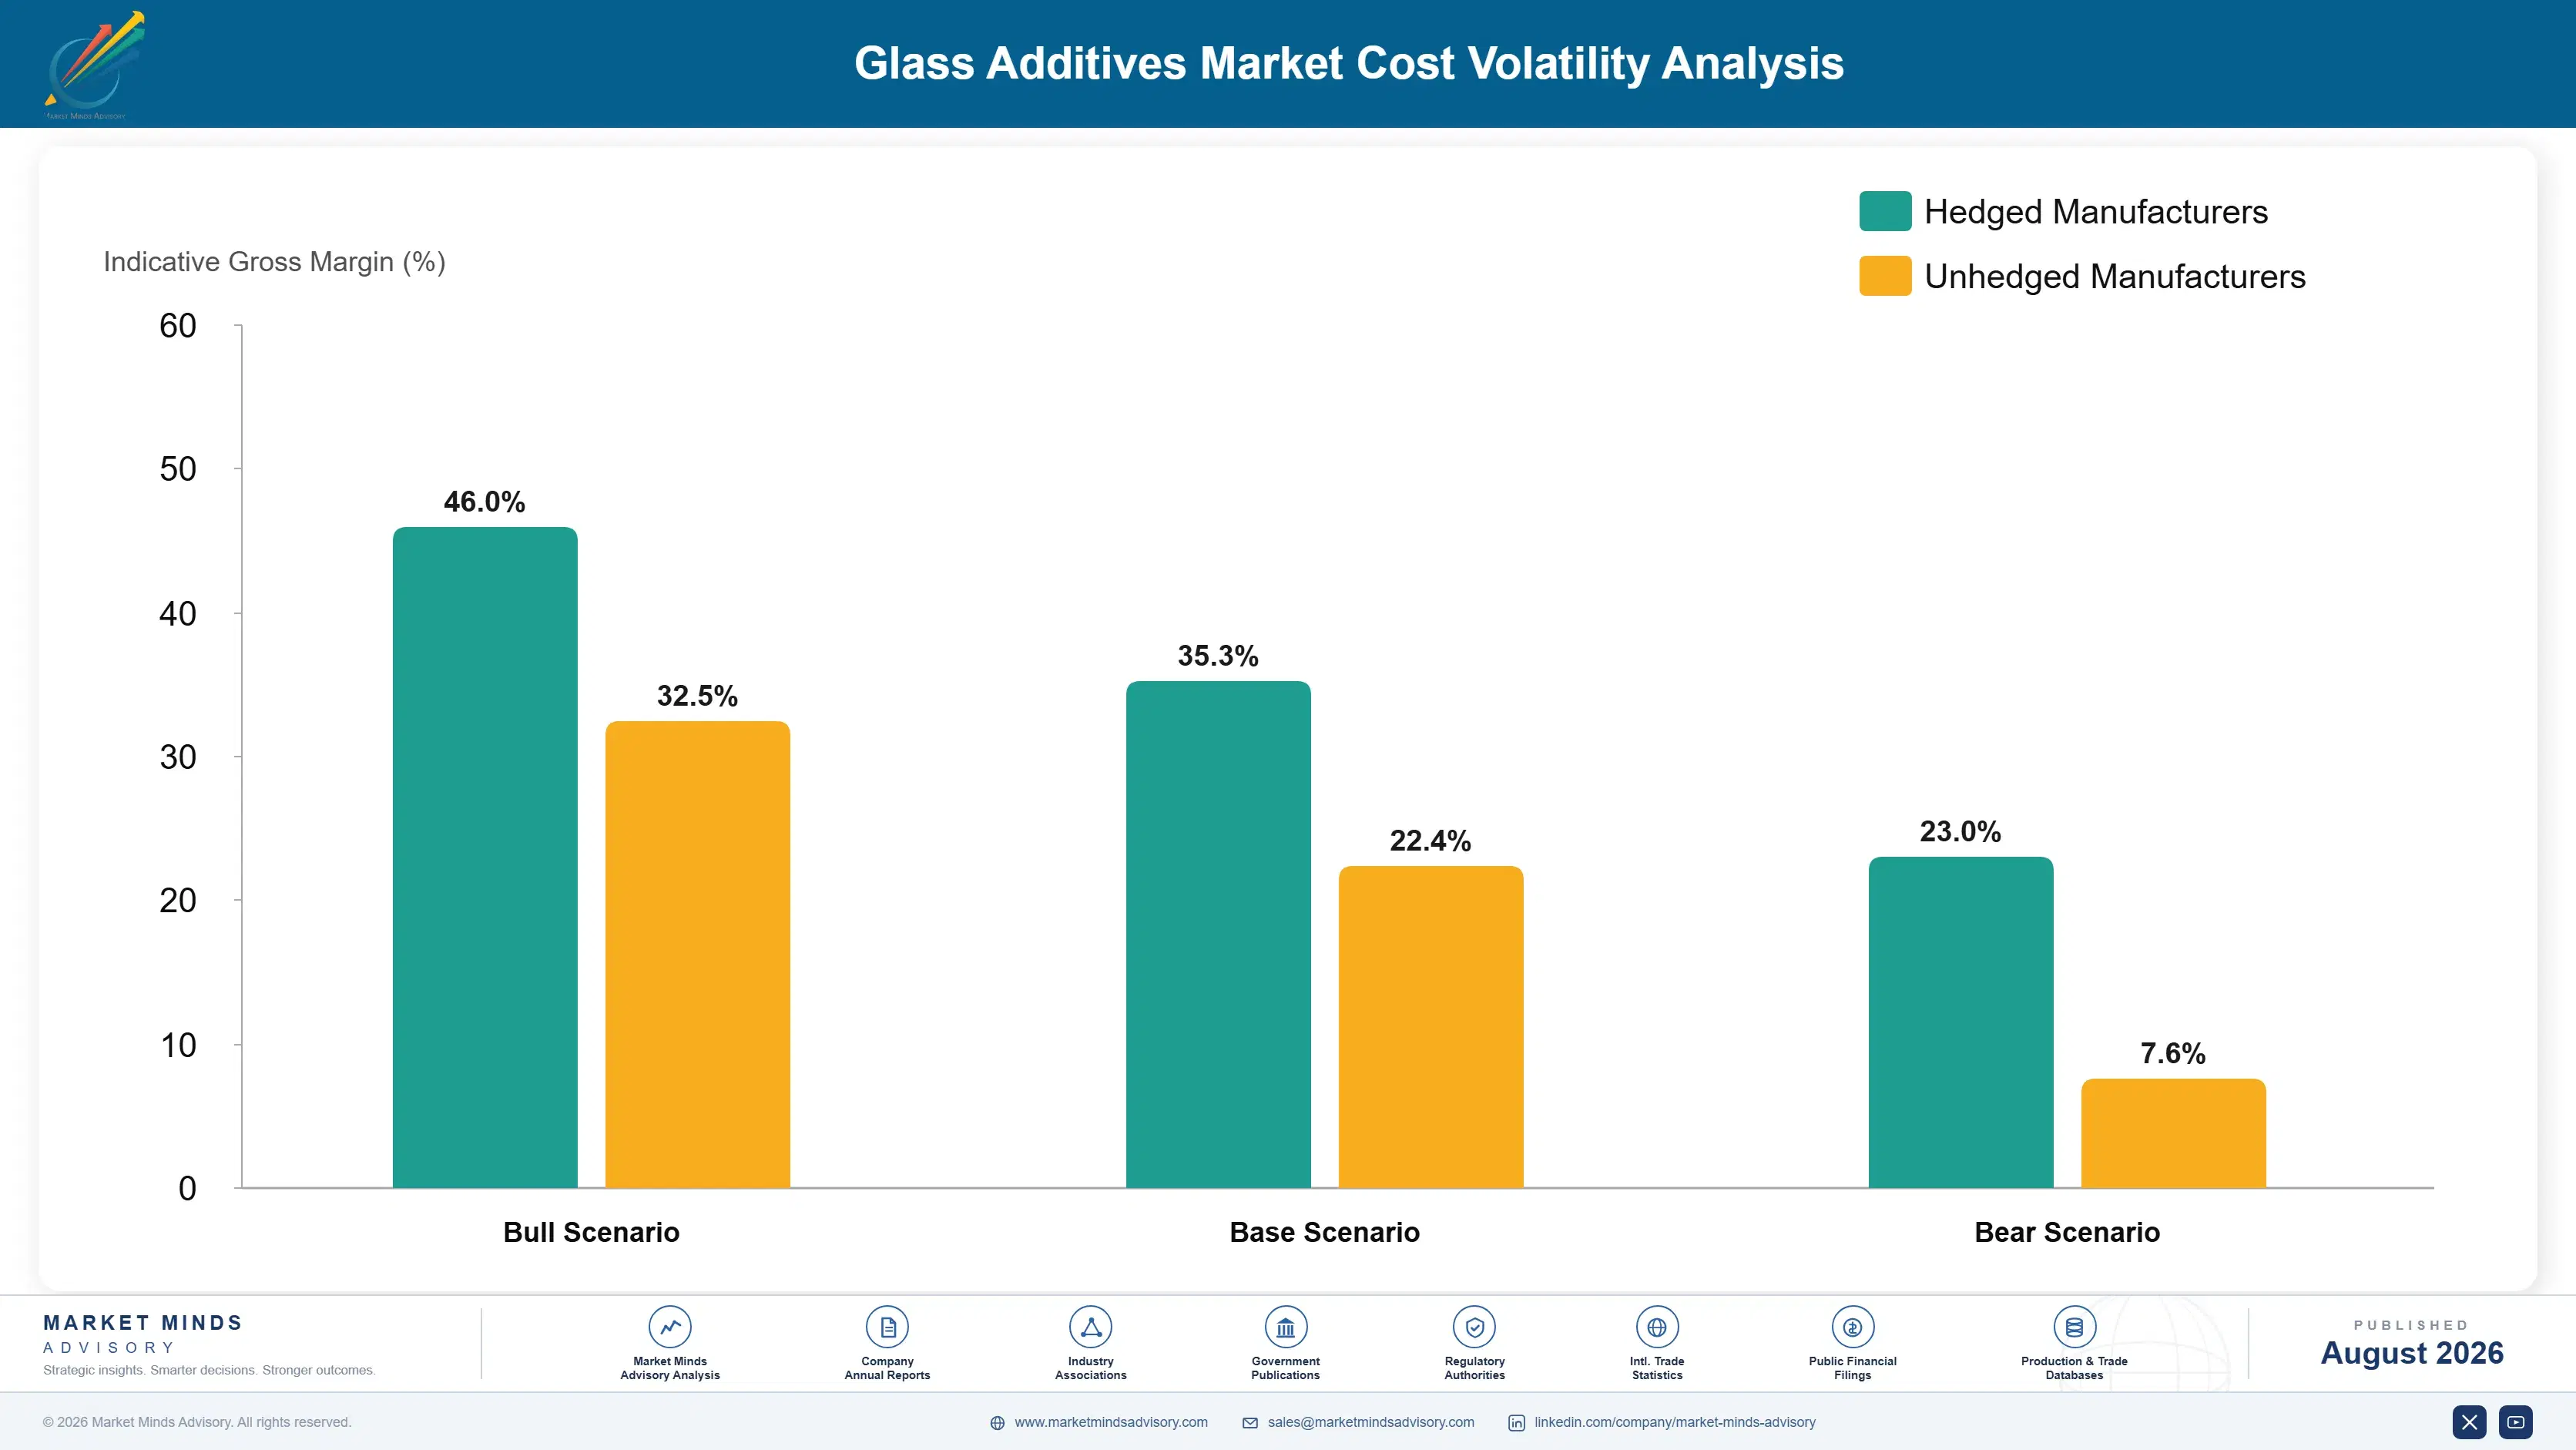
What the Package Actually Costs

Metal oxide raw materials dominate at roughly 58% of production cost, spanning iron, chromium, cobalt, cerium, selenium, and titanium chemistry sourced across concentrated and widely traded supply chains alike. Milling, blending, and particle sizing take a further 16%, since dosing accuracy at 1.4% of batch depends on consistent physical form. Packaging and handling for dusty inorganic powders absorb 9%. Technical service resource carries most of the remainder.
Cobalt and selenium pricing moved sharply through recent years on battery demand and copper refining output respectively, neither of which responds to glass requirements. Rare earth export policy moved cerium separately and without warning. Venator and Vibrantz both discussed raw material cost pressure in their reporting for those years. Suppliers holding annual glassmaker agreements absorbed most of the movement, since additive contracts are rarely indexed.

Exposure divides on material mix rather than on scale. Suppliers weighted toward commodity iron and chromium oxides face price competition from Chinese and Indian producers against modest margins. Those holding selenium, cerium, and cobalt positions face volatile supply chains with far better margins and genuine inventory risk. Technical service cost is fixed and falls per tonne as the base grows, which rewards relationship depth rather than catalogue breadth.
glass-additives-market-trend-cost-volatility-analysis-1787551543915

Index additive contracts to published metal references

Cobalt, selenium, and cerium all move on drivers entirely unrelated to glass demand, yet annual glassmaker agreements are rarely indexed to anything at all. Tying pricing to published metal references removes an exposure suppliers have absorbed repeatedly without compensation. Glassmakers accept indexation once shown that every alternative supplier carries identical exposure on the same inputs.

Carry inventory through by-product supply cycles

Selenium follows copper refining and cerium follows rare earth separation policy, so neither responds to glass demand and both tighten without notice. Inventory carried through cycles allows supply when competitors cannot, which is worth considerably more than the working capital costs. Glassmakers now contract rather than buy spot precisely because they experienced the alternative.

Price technical service into the contract explicitly

Batch recalculation support is a fixed cost that suppliers have historically given away alongside oxide supply, which makes it invisible in a price comparison and impossible to defend. Contracting it explicitly converts a cost into revenue and makes the value visible to a purchasing department that would otherwise weigh only tonnage price. The conversation changes immediately.

Portfolio Architecture for Margin Defence

Margin architecture follows technical difficulty rather than material value, which is why the most expensive oxides are not always the most profitable to supply. Commodity iron and chromium colourants compete against Chinese and Indian producers on price and earn accordingly. Constrained materials like selenium and cerium earn more on supply position and inventory risk. Technical service attached to batch recalculation earns best of all, where suppliers actually charge for it.
The volume and premium tension is really about whether the service is priced. Suppliers have historically given batch support away alongside oxide supply, which makes it invisible in any price comparison and leaves them competing on tonnage against producers offering nothing else. Contracting the support explicitly converts a fixed cost into revenue and makes the difference visible to the purchasing department that would otherwise ignore it.

High-value pools concentrate in cerium and ultraviolet absorber supply for solar glass, contracted batch recalculation service, and specialty modifiers for technical and display glass. Each is defended by supply position, technical capability, or specification presence rather than by oxide production cost, which regional producers will always contest successfully anywhere they operate.

Volume / Commodity-Adjacent Tier

Iron, chromium, and manganese oxide colourants and standard fining agents that many chemical producers supply competently. Chinese and Indian producers set pricing. Nothing in the material distinguishes one supplier from another at all.
Gross Margin: 16%-25%

Premium / Certified Tier

Selenium, cobalt, and other constrained materials where supply position and inventory carry genuine value alongside the oxide itself. Availability rather than specification supports pricing. The range reflects wide swings in underlying material cost cycles.
Gross Margin: 26%-40%

Sustainability / Regulatory / Next-Generation Tier

Cerium and ultraviolet absorbers for solar glass, specialty modifiers for technical and display applications, and contracted batch recalculation service. Supply chain position and technical capability defend both. The range is wide because material and service economics differ completely.
Gross Margin: 34%-50%
glass-additives-market-trend-portfolio-architecture-1787551544414

High-value Sub-segments and Strategic Watch-out

Cerium and Ultraviolet Absorbers

Growing at 9.8% on solar cover glass that must transmit light for decades without solarisation, against a rare earth supply chain concentrated in one country where export policy has moved prices before. Glassmakers have begun contracting rather than buying spot because of exactly that exposure.
Gross Margin: 36%-50%

Contracted Batch Recalculation Service

Cullet at 58% forces additive adjustment roughly every 14 weeks per furnace, and suppliers who contract that support explicitly convert a fixed cost they were giving away into visible revenue instead. Rejection rates fall measurably wherever the support is properly resourced and actually paid for.
Gross Margin: 38%-50%

Constrained Material Inventory Positions

Selenium follows copper refining and retention runs near 28%, so availability and dosing expertise both carry value that a spot oxide quotation cannot represent. Glassmakers now contract because they experienced the alternative. Dosing expertise matters quite as much as the material itself in this function.
Gross Margin: 28%-40%

Commodity Oxide Colourants

The strategic watch-out. Widely available industrial chemicals sold against Chinese and Indian producers on price alone, with technical service given away free and therefore invisible in every purchasing comparison. Purchasing departments benchmark these against imported quotations carrying no technical support whatsoever, and they generally win.
Gross Margin: 16%-25%

How the Batch Sheet Gets Written

Demand originates with the batch chemist rather than with purchasing, and the two rarely have the same priorities. A batch chemist compensating for a shifting cullet stream needs a supplier who understands redox behaviour in that specific furnace, and will defend a material that keeps colour within tolerance. Purchasing sees a widely available oxide with several qualified sources and negotiates accordingly. Suppliers who reach only the second conversation lose work the first would have protected.
Stickiness follows technical involvement almost exactly. A supplier embedded in batch recalculation holds through furnace campaigns lasting years. Constrained material supply holds while availability is tight and loosens when it is not. Commodity oxide supply holds until the next annual negotiation, which arrives quickly and repeatedly. Nothing about the oxide itself holds anything in place.

Optical and solar glass work adds a third route entirely. Float and photovoltaic glass producers design an optical specification during product development, and the additive package is developed with it. Suppliers involved at that stage are named in a formulation. Those arriving afterwards are quoting against a package somebody else already helped design. Reaching that stage requires technical people rather than commercial ones.
glass-additives-market-trend-end-use-penetration-index-1787551544903

Where the Difference Is Made

These are among the four positions where our research anticipates prominent divergence between winners and laggards over the coming forecast period. Each is grounded in the demand model, the regulatory perimeter, and the announced capacity pipeline.
01 / BATCH SERVICE CONTRACTING

Charge for the recalculation you already do

Recycled cullet at 58% of container batch arrives carrying unpredictable colour and redox history, which forces additive package adjustment roughly every 14 weeks per furnace instead of at annual review as it once was. Suppliers have historically given that support away alongside oxide supply, which makes it invisible in a price comparison and leaves them competing on tonnage against producers offering nothing at all. Contracting the service explicitly converts a fixed cost into revenue and makes the value visible to purchasing.
02 / CONSTRAINED SUPPLY INVENTORY

Hold stock in materials nobody makes on demand

Selenium comes from copper refining anode slimes and cerium from a rare earth chain concentrated overwhelmingly in one country, so neither responds to glass demand and both have moved sharply on decisions taken by others well outside this industry entirely. Retention near 28% for selenium compounds the difficulty, since most of what gets dosed volatilises during the melting process anyway. Suppliers carrying inventory across cycles supply when spot markets tighten and competitors simply cannot, which glassmakers now contract for quite deliberately now.
03 / SPECIFICATION STAGE PRESENCE

Be in the optical design, not the tender

Float and photovoltaic glass producers develop an optical specification during product development and build the additive package alongside it, years before any purchasing conversation takes place with anybody at all. Building energy codes governing solar control glazing also publish revision timetables well ahead of taking effect, which makes the demand genuinely and unusually forecastable. Suppliers involved at that design stage are named inside a formulation, while everybody else quotes against a package somebody else has already helped to develop for them.
04 / LOADING REDUCTION DEVELOPMENT

Cut the constrained materials out where possible

Selenium retention runs near 28% and cerium sits inside a supply chain that export policy has repeatedly disrupted without warning, which makes reducing the loading of either a genuine commercial capability rather than a formulation nicety of any kind. Alternative colour and decolourising routes exist wherever the glass specification permits, and cerium loading can frequently be cut without any measurable optical penalty at all in practice. Suppliers offering that work reduce their customer's exposure and their own at exactly the same time.

Engagement Snapshot From the Field

A live engagement with an industry participant carrying material or product regulatory and market exposure ahead of a defining policy shift, showing how our research translates into a defensible multi-year portfolio strategy.
MARKET MINDS ADVISORY · CLIENT ENGAGEMENT SUMMARY
Glass Additives Producer Strategic Portfolio Review and Transition Roadmap 2026·Investment Scenario on Glass Additives Exposure Evaluation 2025-26
CLIENT PROFILE
A European specialty inorganics supplier with glass additive revenue near EUR 96 million (client-reported, unverified by MMA), selling colourants, fining agents, and decolourisers to container and float glass producers. Technical support was provided free alongside supply, no inventory positions were held in constrained materials, and margins had declined for four consecutive years. Inventory positions had never been considered.
STRATEGIC CHALLENGE
Purchasing departments were benchmarking the client's oxides against Chinese and Indian quotations that carried no technical support at all, and winning that argument repeatedly. Cerium spot exposure had produced two loss-making quarters. Solar glass producers in the region had never been approached at specification stage. Nobody had ever costed the free technical support.
MMA APPROACH
MMA analysed retained and lost accounts against technical involvement depth, modelled inventory economics on selenium and cerium across recent price cycles, and assessed specification-stage engagement with float and solar glass producers. Forty-seven expert interviews with batch chemists, glass purchasing managers, and float glass product developers established where each decision genuinely originates.
KEY FINDINGS
  1. Every account retained at full margin involved the client's technical people working directly with a batch chemist, and every account lost had been managed exclusively through purchasing.
  2. Free technical support cost the business a measurable amount annually and appeared nowhere in any customer's evaluation, which meant it was funding competitors' price comparisons directly.
  3. Cerium inventory carried through the last two price cycles would have earned more than it cost in working capital, and the finance function had never modelled it that way.
  4. Two regional solar glass producers had developed optical specifications with competitors during product development, and the client had learned about both only at tender stage.
CLIENT PROFILE
A European specialty inorganics supplier with glass additive revenue near EUR 96 million (client-reported, unverified by MMA), selling colourants, fining agents, and decolourisers to container and float glass producers. Technical support was provided free alongside supply, no inventory positions were held in constrained materials, and margins had declined for four consecutive years. Inventory positions had never been considered.
STRATEGIC CHALLENGE
Purchasing departments were benchmarking the client's oxides against Chinese and Indian quotations that carried no technical support at all, and winning that argument repeatedly. Cerium spot exposure had produced two loss-making quarters. Solar glass producers in the region had never been approached at specification stage. Nobody had ever costed the free technical support.
MMA APPROACH
MMA analysed retained and lost accounts against technical involvement depth, modelled inventory economics on selenium and cerium across recent price cycles, and assessed specification-stage engagement with float and solar glass producers. Forty-seven expert interviews with batch chemists, glass purchasing managers, and float glass product developers established where each decision genuinely originates.
KEY FINDINGS
  1. Every account retained at full margin involved the client's technical people working directly with a batch chemist, and every account lost had been managed exclusively through purchasing.
  2. Free technical support cost the business a measurable amount annually and appeared nowhere in any customer's evaluation, which meant it was funding competitors' price comparisons directly.
  3. Cerium inventory carried through the last two price cycles would have earned more than it cost in working capital, and the finance function had never modelled it that way.
  4. Two regional solar glass producers had developed optical specifications with competitors during product development, and the client had learned about both only at tender stage.
RECOMMENDED STRATEGY
Phase 1: Phase one: contract batch recalculation support explicitly as a priced service, making visible to purchasing what the business has been giving away for years. Phase 2: Phase two: build inventory positions in selenium and cerium sized against historical cycle volatility, and index remaining contracts to published metal references. Phase 3: Phase three: place technical people with float and solar glass producers during optical specification development rather than waiting for tender documents.
OUTCOME
The client contracted technical support at eleven accounts within a year and recovered two previously lost customers. Cerium inventory supplied through a subsequent tightening when competitors could not, and blended gross margin improved 7.4 percentage points (client-reported, unverified by MMA). Specification-stage engagement began with two float producers.

Frequently Asked Questions

Foundational context covering the market sizes, CAGR, scope, country, region and competition that inform every finding below. This section is provided to cover basics and most often pre-purchase conversations, answered from the MMA Primary Research Dataset.

What is the current size of the Glass Additives Market?

The market was valued at USD 1.6 billion in 2025, rising to an estimated USD 1.69 billion in 2026. East Asia holds the largest regional share at 33% of value.

How large will the Glass Additives Market be by 2036?

MMA forecasts USD 2.85 billion by 2036 under the base case, an expansion multiple of 1.69 times the 2026 value. That represents USD 1.16 billion of incremental value.

What is the CAGR for the Glass Additives Market 2026 to 2036?

The base case CAGR is 5.4%, with a bull case of 6.6% and a bear case of 4.2%. The spread reflects uncertainty over solar glass build-out and rare earth supply.

Which segment is growing fastest?

Ultraviolet and infrared absorbers grow fastest at 9.8%, roughly 1.81 times the market rate, on solar cover glass. Opacifiers and specialty modifiers follow at 7.2%.

Who are the major companies in the Glass Additives Market?

Vibrantz Technologies, Venator Materials, Cathay Industries, Shepherd Color, and Tosoh lead, holding roughly 30% between them. Technical service rather than chemistry sustains the differentiation here.

Which country is growing fastest?

India grows fastest at 8.6%, as float and container glass capacity builds out against construction and packaging demand while solar module glass manufacture begins under incentives.

Report Segmentation Architecture

The full report scope spans multiple orthogonal segmentation dimensions, with cross-tabulated demand data provided for each dimension pair. Coverage extends further to regional breakdowns, trend trajectories, and the competitive detail needed to support segment-level decision-making.

By Additive Function

  • Colourants
  • Decolourisers
  • Fining and Refining Agents
  • Redox Control Agents
  • UV and Infrared Absorbers
  • Opacifiers and Specialty Modifiers

By End-Use Industry

  • Container and Packaging Glass
  • Architectural Flat Glass
  • Photovoltaic Cover Glass
  • Automotive Glazing
  • Tableware and Decorative Glass
  • Technical, Display and Fibre Glass

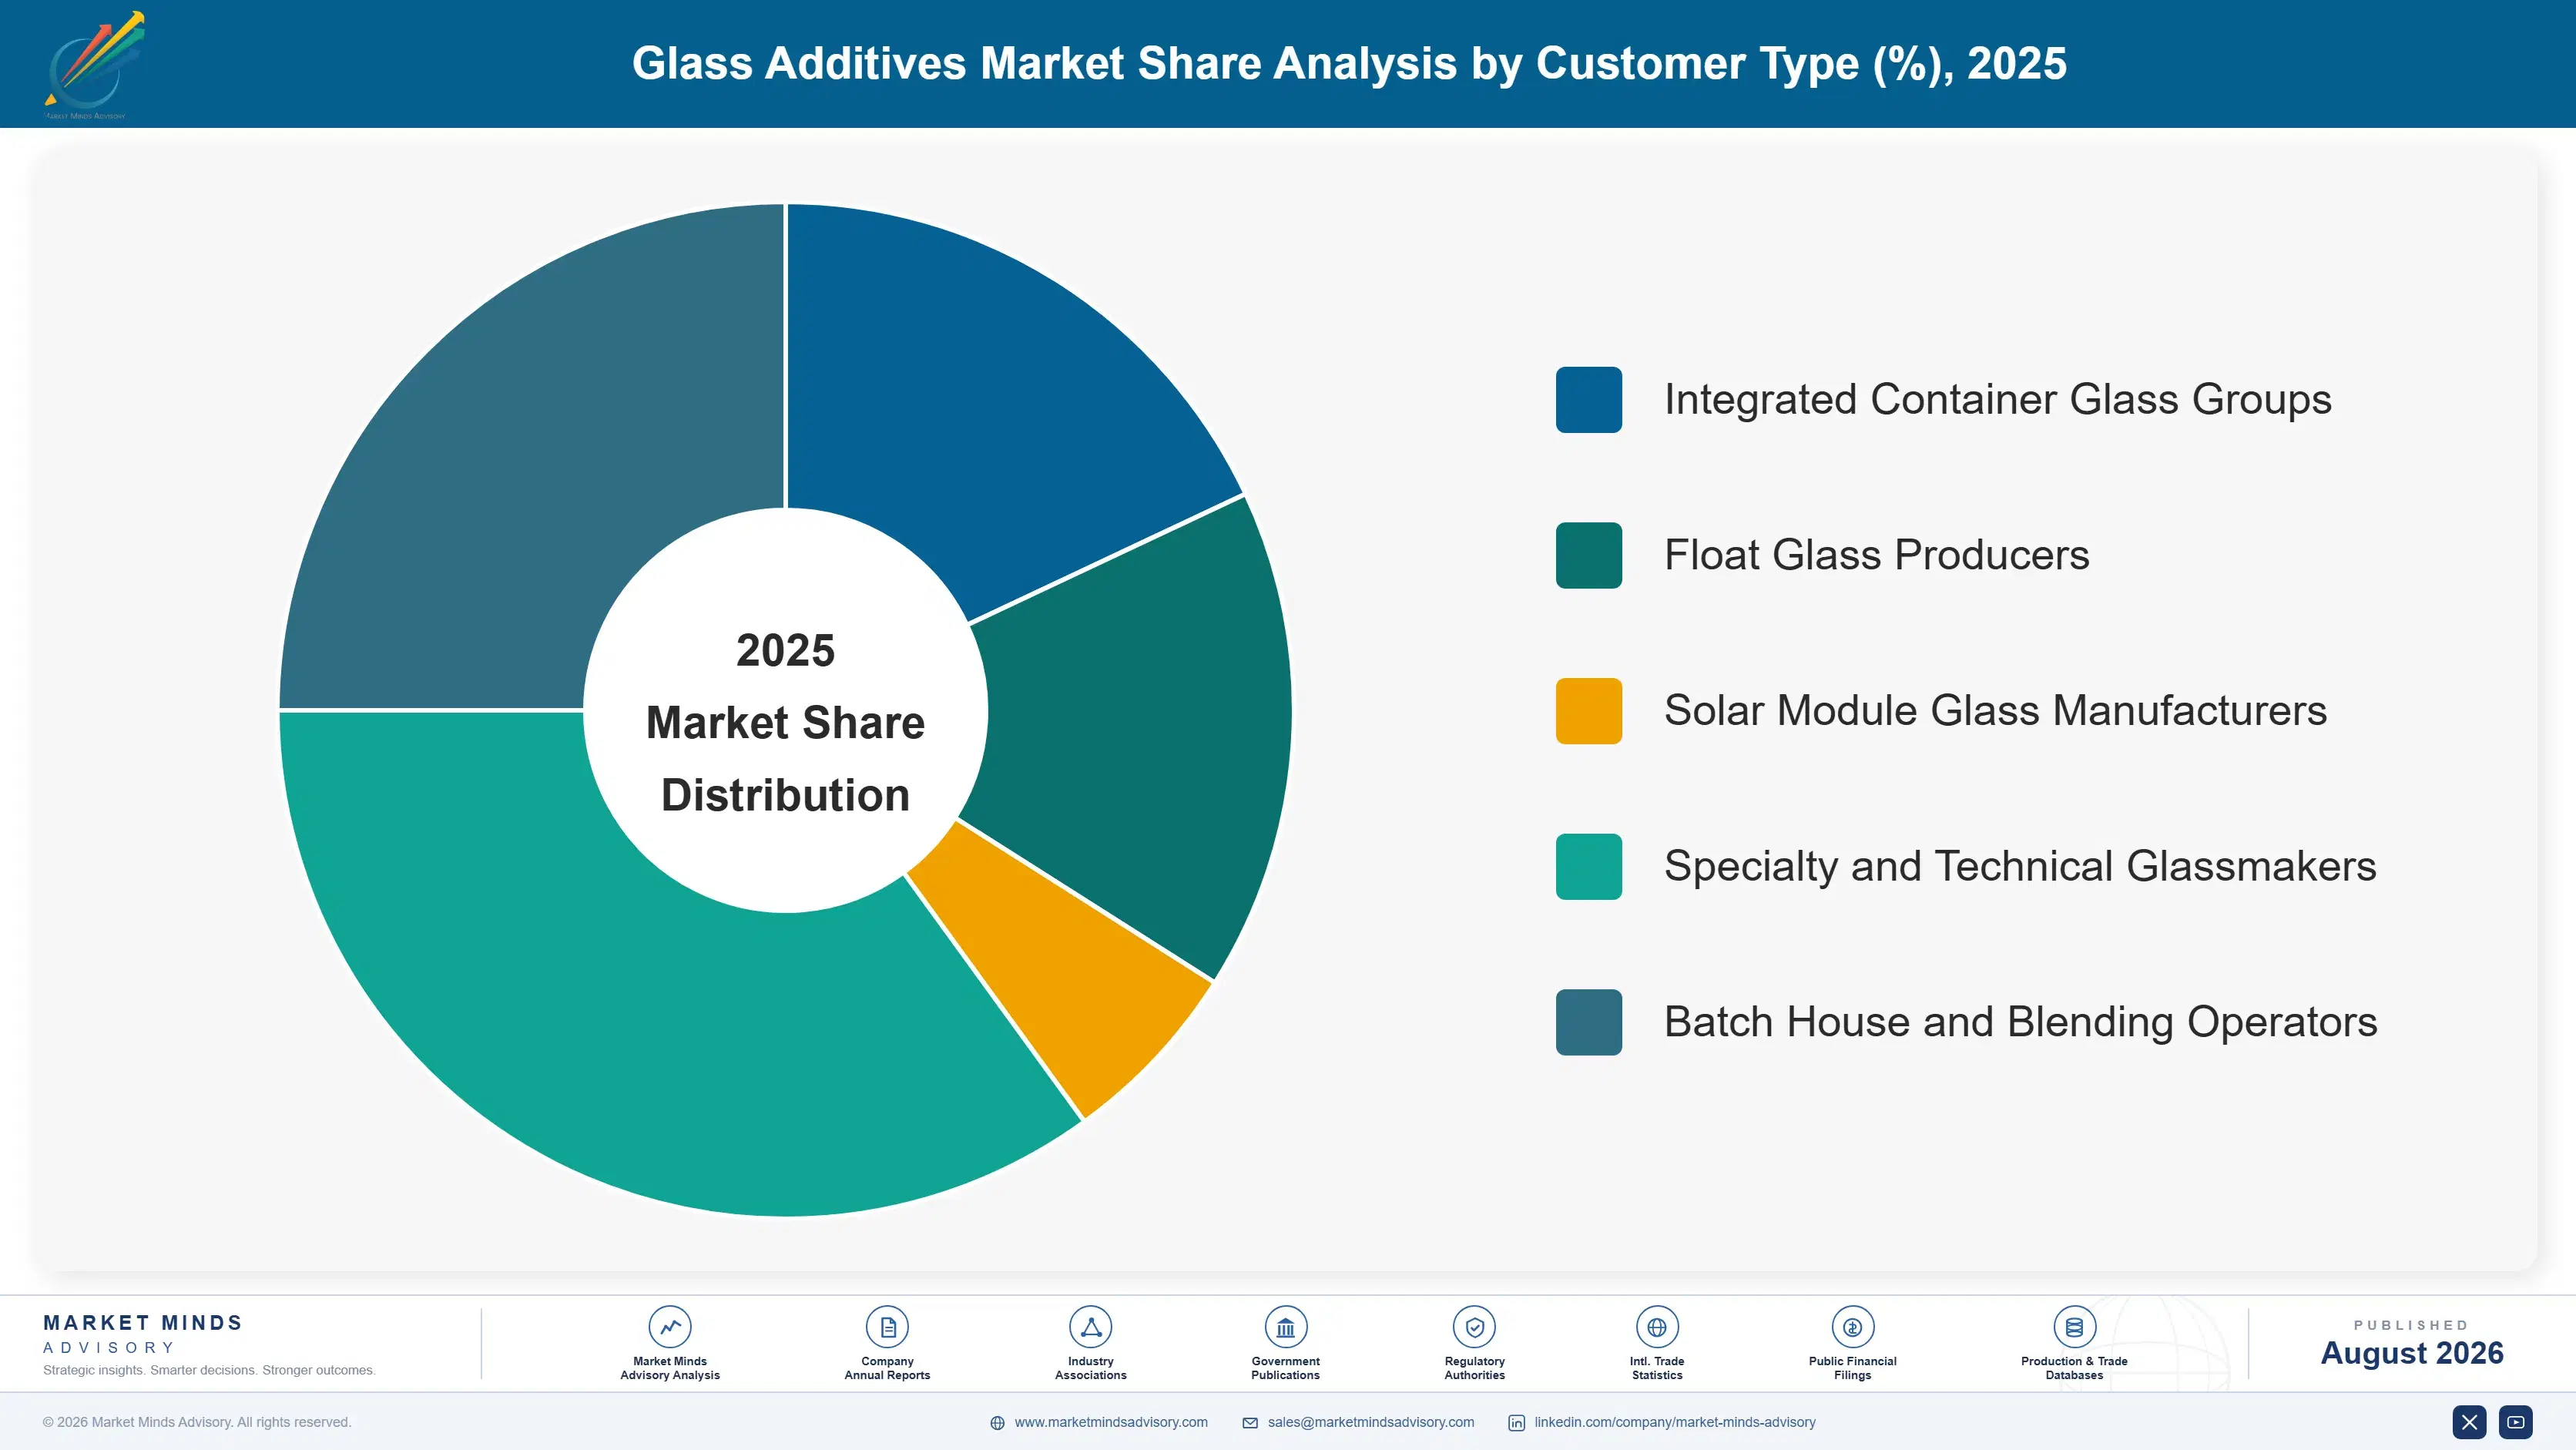
By Customer Type

  • Integrated Container Glass Groups
  • Float Glass Producers
  • Solar Module Glass Manufacturers
  • Specialty and Technical Glassmakers
  • Batch House and Blending Operators

By Region

  • North America
  • Western Europe
  • East Asia
  • South Asia and Pacific
  • Latin America
  • Middle East and Africa
  • Eastern Europe

Scope, Methodology, and Coverage

Every figure in this report is reproducible from documented input assumptions. The scope below maps the historical period, the forecast horizon, the segmentation dimensions, and the countries covered, alongside the underlying primary and qualitative methodology.
Historical Period
2020 to 2025
Forecast Period
2026 to 2036
Base Year
2025 (USD billions; MMA Primary Research Dataset, August 2026)
Market Definition
The market comprises functional additives dosed into glass batch to control colour, refining, redox, and optical properties, covering colourants, decolourisers, fining and refining agents, redox control agents, UV and infrared absorbers, and opacifiers with specialty modifiers. Value is measured at additive supplier level including contracted technical service where separately priced. Primary batch materials including silica sand, soda ash, limestone, and feldspar, recycled cullet, furnace refractories, glass coatings applied after forming, and finished glass products fall outside scope.
Quantitative Units
USD billions (current prices); thousand tonnes of additive supplied annually; USD per tonne by additive function and material
Segmentation Dimensions
By Additive Function; By End-Use Industry; By Customer Type; By Region
Regions Covered
North America, Western Europe, East Asia, South Asia and Pacific, Latin America, Middle East and Africa, Eastern Europe
Countries Covered
China, Japan, South Korea, Taiwan, India, Indonesia, Vietnam, Australia, Thailand, United States, Canada, Mexico, Germany, France, Italy, Spain, United Kingdom, Netherlands, Belgium, Portugal, Poland, Czechia, Romania, Hungary, Brazil, Mexico, Chile, Saudi Arabia, United Arab Emirates, Egypt
Key Companies Profiled
Vibrantz Technologies, Venator Materials, Cathay Industries, The Shepherd Color Company, Tosoh, Solvay, Merck KGaA, Lanxess, Treibacher Industrie, Neo Performance Materials, Umicore, 5N Plus, American Elements, Reade International, Chemours, Kronos Worldwide, Nubiola, Colorobbia, Zircomet, Elementis
Quantitative Methodology
Primary survey, n=3,800 respondents, Q4 2025, six countries; demand-side model with trade association cross-validation
Qualitative Methodology
47 expert interviews, Q4 2025; applied to validate demand model assumptions, identify emerging dynamics, and assess competitive positioning
Report Format
PDF and XLSX data workbook (Word format preview document)
Publisher
Market Minds Advisory
Report Code
MMA-2026-CHM-431
Published
August 2026
Contact
sales@marketmindsadvisory.com | www.marketmindsadvisory.com

Purchase the full Glass Additives Market Report (2026 to 2036).

The full report sizes glass additive demand across six functions, six end-use industries, and seven regions with 2026 to 2036 forecasts under base, bull, and bear cases. It models cullet ratio increases as a driver of technical service demand rather than only of batch composition, since reformulation frequency is what actually separates suppliers. Competitive profiles cover twenty suppliers assessed consistently on additive supply revenue, technical service depth, and constrained material supply position. Cost analysis traces metal oxide, processing, and service exposure by material mix. Commercial guidance addresses service contracting, inventory positions, specification presence, and loading reduction development.
Six additive functions sized separately by region
Cullet ratios tracked against batch reformulation frequency
Constrained material supply chains mapped for selenium and cerium
Solar glass absorber demand modelled against module capacity
Technical service economics separated from oxide supply revenue
Building code revision timetables tracked across major jurisdictions

Built For The People Who Decide

From boardroom strategy to bench-side execution, this report is read cover-to-cover by leaders shaping the next decade of their industry, turning demand scenarios, market dynamics and valuation benchmarks into decisions.
CXOs/ Presidents/ VPs/ Managers
M&A and Corporate Development
Strategy Teams and R&D Heads
Procurement and Product Directors
Regulatory and Compliance Leaders
Investor Relations and Equity Analysts