Market Minds Advisory
Ginseng Market

Ginseng Market: Ginseng Market. Ageing and Immunity Demand, Ginsenoside-Enriched Formats, and Long Cultivation Cycles and Origin Fraud Shape Global Supply.

Global ginseng supply spans red and white Panax ginseng, American ginseng, extracts and functional ingredients, and ginsenoside-enriched and fermented formats sold to supplement, beverage, cosmetic, and traditional medicine buyers, where ageing and immunity demand.

Lead Analyst

Published

September 2026

Make Smarter Decisions with Customized Research Insights

Request a free sample report and evaluate market opportunities, growth trends, and competitive dynamics relevant to your business needs.

2025 MARKET VALUE$5.2BMarket Size 2025
2036 FORECAST VALUE$9.9BBase Case , 2026 to 2036
CAGR 2026 TO 20366.0 %Bull 7.3% / Bear 4.7%
INCREMENTAL OPPORTUNITY$4.4BNet 10- year value creation
EXPANSION MULTIPLE1.79x2036 value over 2026 base
Strategic Levers
M&A Pipeline
Regional Outlook
Country Rankings
Competitive Intelligence
Segmental Deep-dive
Call-Us : 91 93563 13602

Executive Snapshot and Market Trajectory.

Ginseng is the root of Panax plants, mainly Asian Panax ginseng and American Panax quinquefolius, sold as red or white root, extract, and ginsenoside-enriched ingredients for supplements, tonics, cosmetics, and traditional medicine. Ageing and immunity demand lift volumes, while long cultivation cycles, replant disease, and origin fraud restrain supply and
Ginsenoside-Enriched and Fermented Ginseng grows fastest as brands seek better absorption and measurable actives, while extracts follow into beverages, gummies, and cosmetics. East Asia holds the largest share because Korea, China, and Japan grow, process, and consume most ginseng through deep traditional medicine, gifting, and tonic cultures, while North America follows through American ginseng and supplements. Cultivation sets supply. Ginsenosides set premiums. Buyers review suppliers every season.
Competition is moderately concentrated, with a Korean ginseng leader, a Chinese traditional medicine house, a Korean cosmetics group, an American ginseng grower, and a flavour and botanical group leading on cultivation, processing know-how, and brand trust, while regional farms and extractors serve niches. Herbal, food, and supplement rules govern use. Origin wins trust. Enrichment wins premiums. Supply contracts decide renewal. Delivery reliability decides supplier rankings. Margins follow sourcing discipline. Batch records protect future sales.
Market Definition
The market covers global sales of ginseng, valued at producer level, including red ginseng products, white and dried ginseng root and powder, American ginseng, ginseng extracts and functional ingredients, and ginsenoside-enriched and fermented ginseng sold to supplement, beverage, cosmetic, and traditional medicine makers. The scope excludes Siberian ginseng and other adaptogens sold under different names, and finished consumer products.
Base Year Value
$5.2B in 2025 (MMA Primary Research Dataset, September 2026)
Forecast Period
2026 to 2036, eleven discrete annual values
CAGR
6.0% base case. Bull 7.3%. Bear 4.7%.
Fastest Growth Segment
Ginsenoside-Enriched and Fermented Ginseng: 11.0% CAGR
Fastest Growth Country
China: 7.6% CAGR
Fastest Growth Region
South Asia and Pacific: 8.0% CAGR
Largest Region
East Asia: 40% of 2025 global value
Market Leaders
Korea Ginseng Corporation, Beijing Tong Ren Tang, Amorepacific, Hsu's Ginseng Enterprises, Givaudan. Source: MMA Analysis, company annual reports.
Primary Survey
n=3,800 procurement and R&D decision-makers, Q4 2025, six countries
Methodology
Demand-side build-up, cross-validated against public data, 47 expert interviews

Ginseng Market Forecast Scenarios

ginseng-market-size-forecast-scenario-1789883059599
Between 2020 and 2025, ginseng demand grew as immunity and healthy ageing interest rose after 2020, Korean red ginseng brands expanded abroad, and ginseng extracts entered beverages and cosmetics. Root prices swung with weather and replant disease, energy costs rose in 2022, and producers passed on cost changes unevenly to brands and distributors. Cost control separates leaders from followers.
The base case rests on three commercial mechanisms. First, ageing populations and immunity interest keep lifting supplement and tonic use. Second, ginsenoside-enriched and fermented formats raise absorption and premium pricing. Third, extracts spread into beverages, gummies, and cosmetics. Producers plan cultivation contracts, processing capacity, and analytical laboratories around all three. Clear specifications build buyer trust. Small buyers feel every input swing. Technical reach compounds over time. Audits repeat every year. Buyers review suppliers every season.
The bull case needs stronger clinical evidence and faster enriched format adoption, which would lift volumes and prices. The bear case is an origin fraud scandal combined with a poor harvest, which would squeeze margins and damage trust. Supply contracts decide renewal. Delivery reliability decides supplier rankings. Margins follow sourcing discipline. Batch records protect future sales.

Ageing Demand, Enriched Formats, and Long Cultivation Cycles Set Ginseng Outcomes

Ginseng supply starts with roots grown for four to six years in shaded beds in Korea, China, Canada, and the United States, on fields that need years of rest between crops. Growers harvest, wash, and dry roots for white ginseng or steam and dry them for red ginseng, and processors extract, concentrate, ferment, or enrich them for supplements, beverages, cosmetics, and medicine.
MARKET CONCENTRATION42% CR5Leading five suppliers hold a moderate combined share
RED GINSENG SHARE36%Portion of global value sold as steamed red ginseng
ROOT COST SHARE43%Portion of goods cost taken by ginseng roots
CULTIVATION CYCLE4-6 yearsTime ginseng roots need in the field before harvest
GINSENOSIDE CONTENT2-8%Typical total ginsenoside content in dried ginseng root
ENRICHED PREMIUM40-120%Typical price gap between ginsenoside-enriched and standard extracts
Ginsenoside content, root age, origin, residue results, and brand trust decide value. Buyers run identity and residue tests, and enriched and fermented grades earn premiums of 40% to 120% over standard extracts. Korean and Chinese houses win on heritage and scale, while North American growers win on American ginseng. Cultivation is slow, so contracts matter. Audits repeat yearly. Cost control separates leaders from followers.
Buyers judge ginseng on ginsenoside profile, root age, botanical identity, pesticide and heavy metal results, origin certificates, and price stability. Supplement brands want standardised extracts, tonic makers want authentic red ginseng, and cosmetic makers want documented actives. Price sensitivity is moderate. Identity tests and origin certificates decide shortlists. Clear specifications build buyer trust. Small buyers feel every input swing. Technical reach compounds over time.
"Ginseng is the rare crop where the buyer is paying for six years of patience and a country name. That makes fraud tempting and certificates valuable. The houses that pair a real origin with a ginsenoside number keep the premium."
Senior Analyst, Botanical Actives and Traditional Medicine Practice · MMA Ginseng Practice · September 2026

Market Trends

Ginsenoside-Enriched and Fermented Ginseng Improve Absorption Claims

Producers use enzymes and fermentation to convert large ginsenosides into smaller forms such as compound K that absorb better, and they market enriched extracts with measurable ginsenoside profiles. Ginsenoside-Enriched and Fermented Ginseng grows about 11.0% a year, and gross margins run 34% to 52% against 18% to 30% for standard extracts. The trend needs absorption evidence and stable enzyme processes, and it rewards houses with fermentation know-how and analytical laboratories. Audits repeat every year. Buyers review suppliers every season. Supply contracts decide renewal. Delivery reliability decides supplier rankings. Margins follow sourcing discipline.
Market Impact: over 65 population grows 3-4% yearly

Ginseng Extracts Enter Beverages, Gummies, and Cosmetic Formulations

Brands add ginseng extract to energy drinks, shots, gummies, and skincare, and extractors offer water-soluble and powdered grades that fit these formats. Ginseng Extracts and Functional Ingredients grow about 7.8% a year. The trend needs taste-masked, stable, soluble extracts and clear claims, and it rewards extractors with application laboratories, standardised grades, and supply agreements with beverage and cosmetic groups in Korea, China, Japan, and beyond. Batch records protect future sales. Cost control separates leaders from followers. Clear specifications build buyer trust. Small buyers feel every input swing. Technical reach compounds over time.
Market Impact: gift sets drive 30% of sales

Market Opportunities and Growth Drivers

Ageing Populations and Immunity Interest Sustain Ginseng Supplement Demand

Populations over 65 grow about 3% to 4% a year in Japan, Korea, China, Europe, and North America, and older consumers and their families buy ginseng for energy, immunity, and vitality. Interest in healthy ageing also reaches younger buyers. The driver sustains steady demand and rewards suppliers with authentic origin, standardised ginsenoside content, and trusted brands that meet family and gifting expectations. Audits repeat every year. Buyers review suppliers every season. Supply contracts decide renewal. Delivery reliability decides supplier rankings. Margins follow sourcing discipline. Batch records protect future sales. Cost control separates leaders from followers.
Market Impact: roots need 4-6 years to mature

Traditional Medicine Heritage and Gifting Culture Support East Asian Volumes

Ginseng has a long place in Korean, Chinese, and Japanese traditional medicine and gift culture, and premium red ginseng gift sets drive about 30% of Korean sales in some periods. Holidays and corporate gifts create peaks. The driver sustains East Asian volumes and rewards houses with heritage brands, quality grading, and attractive packaging that supports premium pricing and repeat gifting. Clear specifications build buyer trust. Small buyers feel every input swing. Technical reach compounds over time. Audits repeat every year. Buyers review suppliers every season. Supply contracts decide renewal. Delivery reliability decides supplier rankings.
Market Impact: residue rejections hit 5-10% of lots

Market Restraints and Challenges

Long Cultivation Cycles and Replant Disease Limit Ginseng Supply

Ginseng grows slowly under shade and needs years of rest between plantings because soil disease builds up, so supply cannot respond quickly to demand. The root cause is biology and soil pathogens. Growers respond with new land, crop rotation, and breeding, though roots need 4 to 6 years to mature, which ties up capital and leaves prices exposed when demand jumps or harvests fail. Margins follow sourcing discipline. Batch records protect future sales. Cost control separates leaders from followers. Clear specifications build buyer trust. Small buyers feel every input swing. Technical reach compounds over time.
Market Impact: enriched ginseng grows 11.0% yearly

Adulteration, Pesticide Residues, and Origin Fraud Undermine Trust

High prices and slow supply tempt sellers to mix cheaper roots, relabel origin, or sell roots with high pesticide residues, and importers and regulators reject some shipments. The root cause is price gaps between origins. Producers respond with testing and certification, though residue rejections hit 5% to 10% of lots in some channels, which raises audit cost and damages brand trust. Audits repeat every year. Buyers review suppliers every season. Supply contracts decide renewal. Delivery reliability decides supplier rankings. Margins follow sourcing discipline. Batch records protect future sales. Cost control separates leaders from followers.
Market Impact: extracts grow 7.8% yearly
3 additional market trends, 2 additional growth drivers, and 4 additional restraints and challenges are covered in the full report. Contact sales@marketmindsadvisory.com to access the complete intelligence.

Segment CAGR and Growth Architecture

The global ginseng market is segmented by product form and grade, which shows where cultivation, processing, and enrichment technology create pricing power in a moderately concentrated market. Five segments cover red ginseng products, white and dried root and powder, American ginseng, extracts and functional ingredients, and ginsenoside-enriched and fermented ginseng. Enriched ginseng and extracts grow fastest as absorption
ginseng-market-market-share-analysis-1789883059898

Ginsenoside-Enriched and Fermented Ginseng

Ginsenoside-Enriched and Fermented Ginseng is the fastest-growing segment at 11.0% a year, about 1.83 times the overall market rate, from a modest base. Brands seek better absorption and measurable actives, so gross margins of 34% to 52% against 18% to 30% for standard extracts support fermentation and analytical investment. Absorption evidence and stable enzyme processes are the main constraints. Houses with fermentation know-how win. Clear specifications build buyer trust. Small buyers feel every input swing. Technical reach compounds over time. Audits repeat every year. Buyers review suppliers every season. Supply contracts decide renewal. Delivery reliability decides supplier rankings. Margins follow sourcing discipline. Batch records protect future sales. Cost control separates leaders from followers.
CAGR 11.0%

Ginseng Extracts and Functional Ingredients

Ginseng Extracts and Functional Ingredients grows at 7.8% a year, about 1.30 times the overall market rate, because brands add ginseng extract to beverages, gummies, and skincare and need soluble, stable, taste-masked grades, with buyers accepting gross margins of 26% to 42% for standardised content and application support. Formulation skill and clear claims shape supply. Extractors with laboratories hold price better than followers. Clear specifications build buyer trust. Small buyers feel every input swing. Technical reach compounds over time. Audits repeat every year. Buyers review suppliers every season. Supply contracts decide renewal. Delivery reliability decides supplier rankings. Margins follow sourcing discipline. Batch records protect future sales. Cost control separates leaders from followers.
CAGR 7.8%
Full segment breakdown across 5 segments available in the complete report.

Regional Architecture and Country Demand Map

East Asia leads at 40% because Korea, China, and Japan grow, process, and consume most ginseng and traditional medicine and gifting cultures are deep. North America follows at 22% through American ginseng and supplements, Western Europe adds standardised extracts, and South Asia and Pacific grows fastest as Australian and

East Asia

East Asia holds 40% share, above its 22% to 30% band, because Korea, China, and Japan grow, process, and consume most ginseng through Korea Ginseng Corporation, Beijing Tong Ren Tang, Amorepacific, and many farms, and traditional medicine, tonic, and gifting cultures are deep. The lead follows where cultivation and heritage sit. Growth exceeds the global rate. Origin fraud and residue rules restrain margins. Clear specifications build buyer trust. Small buyers feel every input swing. Technical reach compounds over time. Audits repeat every year. Buyers review suppliers every season. Supply contracts decide renewal. Delivery reliability decides supplier rankings. Margins follow sourcing discipline. Batch records protect future sales. Cost control separates leaders from followers.
Share: 40% | CAGR: 7.0% (2026 to 2036)

North America

In North America, 22% of value comes from Wisconsin and Ontario, where Hsu's Ginseng Enterprises and Chai-Na-Ta grow American ginseng that Asian buyers prize for a cooling profile, and from the United States and Canada, where supplement brands buy extracts. Growth runs slightly below the global rate. Export dependence on Asia and weather swings restrain margins. Clear specifications build buyer trust. Small buyers feel every input swing. Technical reach compounds over time. Audits repeat every year. Buyers review suppliers every season. Supply contracts decide renewal. Delivery reliability decides supplier rankings. Margins follow sourcing discipline. Batch records protect future sales. Cost control separates leaders from followers. Clear specifications build buyer trust. Small buyers feel every input swing.
Share: 22% | CAGR: 5.6% (2026 to 2036)
Regional intelligence for 5 additional markets available in the complete report: Western Europe, South Asia and Pacific, Latin America, Middle East and Africa, Eastern Europe. Contact sales@marketmindsadvisory.com.
ginseng-market-country-cagr-analysis-1789883060213

Four Margin Routes for Ginseng Suppliers

Margin in ginseng comes from ginsenoside-enriched and extract formats, origin and ginsenoside data, root supply contracts, and residue compliance rather than plain root volume. The routes below apply to ginseng houses, growers, and extractors, and each can start inside one planning cycle, with clear measures in gross margin points, cost per kilogram, and customer programmes served.

Shifting Volume Into Ginsenoside-Enriched and Extract Formats

Enriched and extract formats earn gross margins of 26% to 52% against 18% to 30% for standard extracts, so houses that add fermentation, enzyme processing, and analytical laboratories to shift 10% of volume into these formats report gross margin gains of 6 to 10 points on the mix. Fermentation and laboratory programmes cost $2 million to $8 million. Pilots with five brands confirm demand. Audits repeat every year. Buyers review suppliers every season. Supply contracts decide renewal. Delivery reliability decides supplier rankings. Margins follow sourcing discipline. Batch records protect future sales. Cost control separates leaders from followers.
Market Impact: premium mix shift lifts gross margin by 6-10 points

Winning Supplement and Beverage Brands With Origin and Ginsenoside Data

Brands audit heavily and want proof, so houses that offer ginsenoside profiles, root age records, and certified origin win multi-year programmes and lift sales per customer by 10% to 18%. Data programmes cost $0.5 million to $2 million a year. Houses should target established supplement, tonic, and beverage brands first and publish batch data against generic extracts. Clear specifications build buyer trust. Small buyers feel every input swing. Technical reach compounds over time. Audits repeat every year. Buyers review suppliers every season. Supply contracts decide renewal. Delivery reliability decides supplier rankings. Margins follow sourcing discipline.
Market Impact: origin data lifts sales per customer by 10-18%

Contracting Multi-Origin Root Supply Years Ahead of Harvest

Roots need 4 to 6 years to mature and prices swing with weather and disease, so houses that sign multi-year contracts with growers in Korea, China, Canada, and the United States, fund new land, and hold root stock cut margin swings. Grower contracts cut spot purchases by 30% to 50%. Houses should share planting plans openly with buyers and index prices. Batch records protect future sales. Cost control separates leaders from followers. Clear specifications build buyer trust. Small buyers feel every input swing. Technical reach compounds over time. Audits repeat every year.
Market Impact: grower contracts cut root cost swings by 15-25%

Certifying Residue Compliance and Origin to Protect Premium Accounts

Residue rejections and origin fraud threaten trust, so houses that add field-to-extract traceability, pesticide testing, and third-party origin certification protect premium accounts and lift contract renewals by 8% to 15%. Certification programmes cost $0.5 million to $2 million. Houses should target Japanese, Korean, and North American importers first and publish audit outcomes to reassure buyers. Buyers review suppliers every season. Supply contracts decide renewal. Delivery reliability decides supplier rankings. Margins follow sourcing discipline. Batch records protect future sales. Cost control separates leaders from followers. Clear specifications build buyer trust. Small buyers feel every input swing.
Market Impact: origin certification lifts contract renewals by 8-15% annually

Who Controls the Margin Pool

The global ginseng market is moderately concentrated, with a CR5 of 42%, and regional farms, extractors, and traditional medicine shops sit outside the leading five. This assessment measures participants on estimated ginseng product value supplied, held constant across all players. Korea Ginseng Corporation leads through red ginseng brand strength and cultivation control, while Beijing Tong Ren Tang, Amorepacific, Hsu's Ginseng Enterprises, and Givaudan follow, with a modest gap between the
Competition runs on four dimensions today: cultivation access and root quality, processing and enrichment technology, brand and origin trust, and channel reach. Korean and Chinese houses win on heritage and gifting, American growers win on cooling American ginseng, and extractors win on standardised grades. Imitators cannot copy slow cultivation quickly, so origin brands hold premiums, but price competition appears in generic extracts and powders. Technical reach compounds over time.

Emerging pressure comes from origin fraud, adaptogen substitutes such as ashwagandha, and Chinese and Canadian growers scaling. Rankings shift where a house secures land, launches an enriched format, or wins a beverage programme. Specialists can move up quickly when they document origin and ginsenosides, since trust can outweigh scale in premium accounts. Audits repeat every year.
ginseng-market-company-positioning-matrix-1789883060539

Competitive Moat and Risk Dimensions

KOREA GINSENG CORPORATION

Moat: Cultivation Control and Brand Trust

Korea Ginseng Corporation, a Korean ginseng company owned by KT&G, contracts ginseng farmers, processes red ginseng, and sells products under its Cheong Kwan Jang brand in Korea and abroad. Its farmer contracts, grading, and brand trust give it credibility with gift and tonic buyers, and its position supports premium pricing for authentic Korean red ginseng across many channels.
KOREA GINSENG CORPORATION

Risk: Domestic Market Maturity

Korea Ginseng Corporation depends on Korean gifting and mature domestic volumes, so growth relies on exports and new formats. Global brands and enriched extract suppliers can compete abroad. Buyers review suppliers every season. Supply contracts decide renewal. Delivery reliability decides supplier rankings. Margins follow sourcing discipline. Batch records protect future sales.
BEIJING TONG REN TANG

Moat: Traditional Medicine Heritage and Reach

Beijing Tong Ren Tang, a Chinese traditional medicine company with a long history, makes and sells ginseng products, pharmacies, and medicines across China and in many overseas markets. Its heritage, pharmacy network, and traditional medicine credibility give it trust with Chinese consumers, and its position supports steady demand for authentic products in domestic and diaspora channels.
BEIJING TONG REN TANG

Risk: Regulatory and Quality Scrutiny

Beijing Tong Ren Tang faces scrutiny on quality and residues in overseas markets, so export growth depends on compliance. Focused suppliers can win with cleaner documentation. Cost control separates leaders from followers. Clear specifications build buyer trust. Small buyers feel every input swing. Technical reach compounds over time.

Players Tracked

Prominent Players

Korea Ginseng Corporation
Beijing Tong Ren Tang
Amorepacific
Hsu's Ginseng Enterprises
Givaudan

Other Key Players

Chai-Na-Ta
Nong Woo Bio
Ilhwa
Gaia Herbs
Nature's Way
Layn Natural Ingredients
Shaanxi Jiahe Phytochem
Bio-gen Extracts
Indena
Shiseido
Suntory Wellness
Kobayashi Pharmaceutical
Blackmores
Swisse Wellness
Bayer Consumer Health

Recent Developments

JANUARY 2026

Korea Ginseng Corporation Expands Ginsenoside-Enriched Red Ginseng Extract Line for Export

Korea Ginseng Corporation expanded its ginsenoside-enriched red ginseng extract line for export, according to company communications. It is an organic capacity expansion, not an acquisition, and it tests demand for enriched formats abroad. Investment terms were not disclosed. Audits repeat every year. Buyers review suppliers every season.
Signal: Suggests leading houses are moving beyond gift roots into enriched extracts that fit supplements and beverages in export markets.
FEBRUARY 2026

Hsu's Ginseng Enterprises Announces New American Ginseng Fields and Residue Testing Programme

Hsu's Ginseng Enterprises announced new American ginseng fields and a residue testing programme, according to company communications. It is an organic investment, not an acquisition, and it tests whether testing protects premium export accounts. Investment terms were not disclosed. Supply contracts decide renewal. Delivery reliability decides supplier rankings.
Signal: Indicates American growers are adding land and residue testing to protect premium Asian export accounts against fraud and rejection risk.
MARCH 2026

Amorepacific Introduces Fermented Ginseng Active for Anti-Ageing Skincare Ranges

Amorepacific introduced a fermented ginseng active for anti-ageing skincare ranges, according to company communications. It is a product launch, and it tests demand for fermented ginsenoside actives in cosmetics. Sales volumes were not disclosed. Margins follow sourcing discipline. Batch records protect future sales. Cost control separates leaders from followers.
Signal: Confirms cosmetic groups are using fermented ginseng actives, which widens demand beyond supplements and tonics into skincare ranges.

What Drives Ginseng Production Costs

Fresh ginseng roots account for roughly 43% of cost of goods, steaming, drying, and extraction energy about 12%, ethanol and processing aids about 8%, and labour, testing, packaging, and logistics about 37%. Roots come from Korea, China, Canada, and the United States, after four to six years in the field and specialised shade structures. Technical reach compounds over time. Audits repeat every year.
The clearest recent shock came from harvest, labour, and energy conditions. Weather, disease, and labour shortages cut root supply in several seasons, as Korean and Canadian agriculture agencies reported, energy prices surged in 2022, as the IEA reported, and KT&G noted in its Annual Report 2022 that ginseng raw material and energy costs affected margins. Houses raised prices by 8% to 20%. Buyers review suppliers every season. Supply contracts decide renewal.

The competitive disadvantage falls on small extractors and brands without grower contracts or root stock, which cannot pass costs on quickly. Large houses control farmer contracts and hold multi-year stock. Exposure also varies by segment, since enriched and extract formats carry higher margins that absorb cost swings better than plain root. Delivery reliability decides supplier rankings. Margins follow sourcing discipline.
ginseng-market-cost-volatility-analysis-1789883060849

Multi-Year Grower Contracts With Price Indexation

Houses sign multi-year contracts with growers in several countries and index selling prices to root, labour, and energy costs. Contracts cut spot purchases by roughly half and reduce margin swings by 10% to 20% in volatile years. The main challenge is the four to six year crop cycle, so houses fund planting early. Batch records protect future sales.

Mix Shift Toward Enriched and Extract Formats

Houses shift capacity toward enriched and extract formats that carry higher margins and absorb cost swings. A shift of 10% of volume lifts gross margin by 6 to 10 points. The main challenge is qualification time, so houses run absorption and stability studies early and keep root lines for core customers. Cost control separates leaders from followers.

Multi-Year Root Stock and Cold Storage

Houses hold multi-year root stock in controlled storage to cover poor harvests and disease years. Programmes cut shortage exposure by 30% to 50% at a stock cost of 5% to 9% of annual spend. The main challenge is working capital, so houses phase stock builds and share storage. Clear specifications build buyer trust. Small buyers feel every input swing.

Portfolio Architecture for Margin Defence

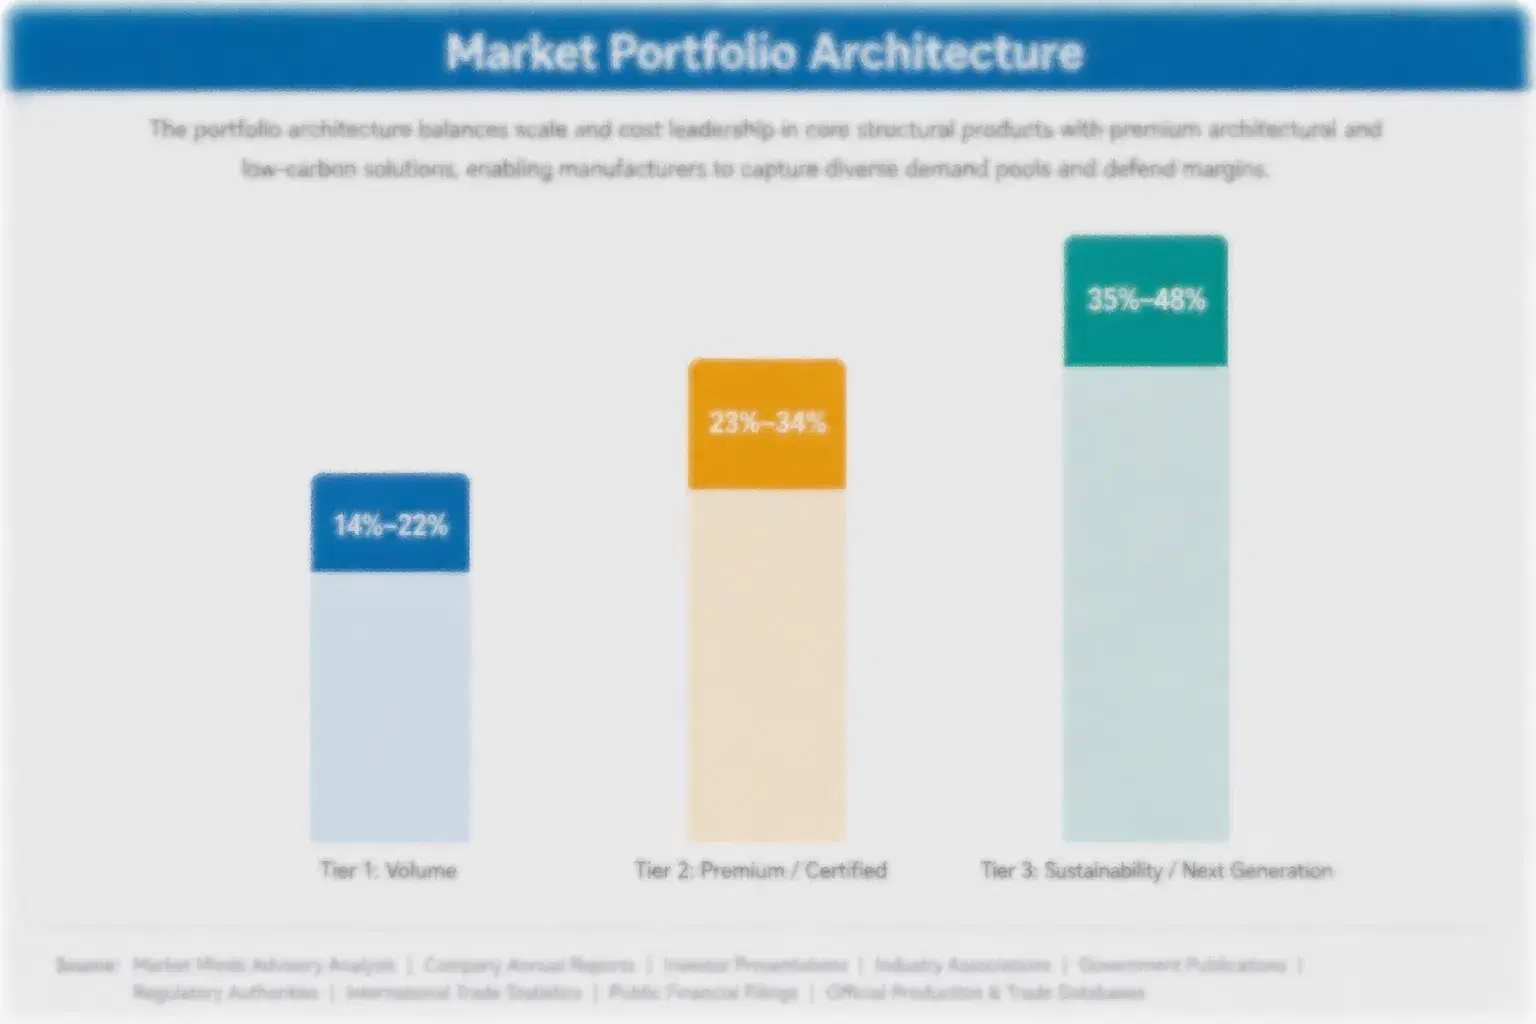
Margins run from moderate returns on white root and standard extract sold under annual contracts to strong returns on red ginseng brands, enriched, and fermented formats sold with origin and ginsenoside data. Three tiers separate volume products, certified premium lines, and next-generation formats, and each tier draws on different customer groups, root positions, and processing platforms in a moderately concentrated market.
The tension between volume and premium is sharp. White root and standard extract fill plants and protect grower contracts but face price competition and fraud risk, while red ginseng, enriched, and fermented formats earn higher margins on smaller volumes and depend on origin, evidence, and buyer trust. Houses that run only standard grades struggle when roots rise, while houses that run only premium lose volume. Buyers review suppliers every season.

High-value pools concentrate in ginsenoside-enriched and fermented ginseng sold to supplement and cosmetic brands and in authentic red ginseng sold as gifts and tonics. They gather where buyers pay for origin, evidence, and heritage rather than kilograms. American ginseng adds a steady pool in premium Asian channels. Supply contracts decide renewal. Delivery reliability decides supplier rankings. Margins follow sourcing discipline.

Volume / Commodity-Adjacent Tier

White and dried ginseng root, powder, and standard extract sold in bulk to supplement makers, traders, and food makers under annual contracts at moderate margins, with root cost pass-through and price competition. Batch records protect future sales.
Gross Margin: 18%-30%

Premium / Certified Tier

Red ginseng products and American ginseng with age grading, origin certificates, and residue results, sold to gift, tonic, and premium supplement buyers that require authenticity and documentation. Cost control separates leaders from followers.
Gross Margin: 26%-42%

Sustainability / Regulatory / Next-Generation Tier

Ginsenoside-enriched and fermented ginseng and functional extracts with absorption data, safety files, and technical service, sold to brands that pay for measurable actives and better absorption. Clear specifications build buyer trust. Small buyers feel every input swing.
Gross Margin: 34%-52%
ginseng-market-portfolio-architecture-1789883061169

High-value Sub-segments and Strategic Watch-out

Ginsenoside-Enriched and Fermented Ginseng

Ginsenoside-enriched and fermented ginseng combines the fastest growth with strong pricing, since brands pay for better absorption and measurable actives at gross margins of 34% to 52%. Absorption evidence and stable enzyme processes limit competition, and houses with fermentation know-how and laboratories win. Repeat supply builds through long programmes.
Gross Margin: 34%-52%

Ginseng Extracts and Functional Ingredients

Ginseng extracts and functional ingredients deliver firm growth and pricing, since brands adding ginseng to beverages, gummies, and skincare pay for soluble, taste-masked grades at gross margins of 26% to 42%. Formulation skill and clear claims form the entry barrier, and extractors with laboratories win. Audits repeat every year.
Gross Margin: 26%-42%

Red Ginseng Products

Red ginseng products are the value core, sold as gifts, tonics, and premium supplements under brand and channel agreements. Value grows about 5.6% a year, and origin, age grading, and brand trust decide profit. Houses anchor sales on gifting seasons and long relationships with department stores and importers.
Gross Margin: 28%-44%

White and Dried Ginseng Root and Powder

White and dried ginseng root and powder are the volume core and strategic watch-out, since growth of about 4.6% a year trails the market, fraud risk is high, and price competition is strong. Houses should manage this line for cash and steer capacity toward red, enriched, and extract formats.
Gross Margin: 14%-26%

Why Tonic Buyers Keep Reordering

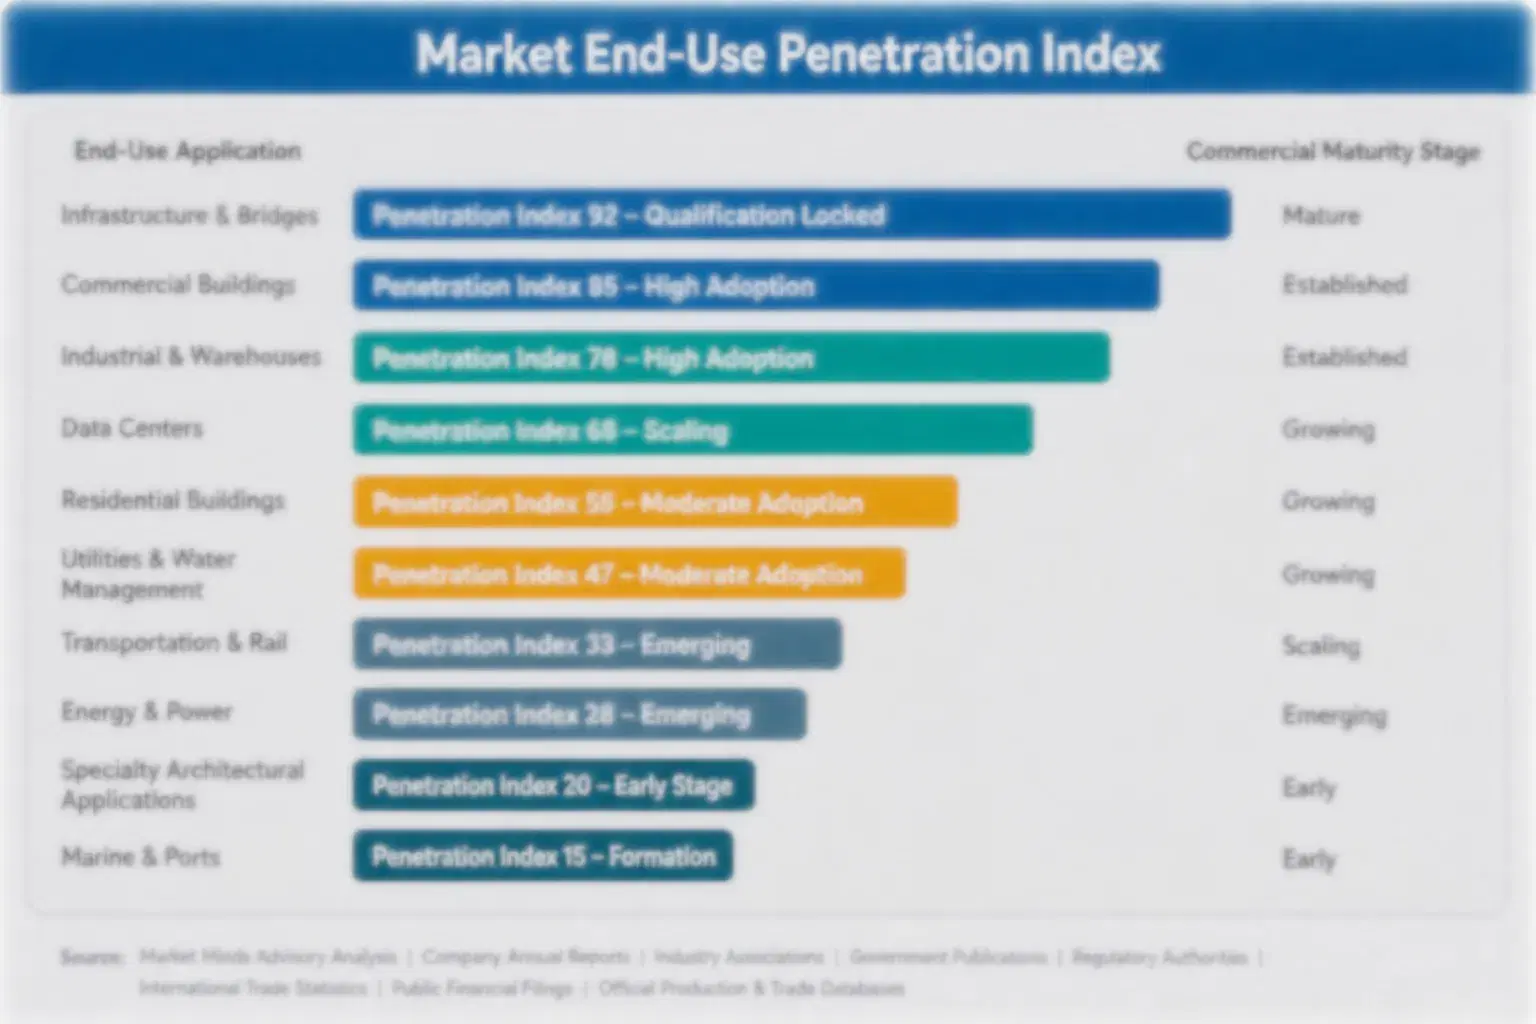
Ginseng demand behaves like an annuity attached to family habits, gift traditions, and approved supplement formulas. Once a household, brand, or pharmacy qualifies a ginseng whose origin, ginsenoside content, and documentation it trusts, it repeats the order every season, and switching means new identity checks, taste panels, and loss of a trusted name. Buyers use last year's consistency to fix renewals, so houses with clean records earn steadier
Adoption stickiness differs by end-use vertical. Traditional medicine and gift buyers are the deepest, since the brand and origin carry the value and change only when trust fails. Supplement brands follow ginsenoside data. Beverage makers are moderate and switch on cost, while cosmetic makers are shallow and try actives for short campaigns. Buyers review suppliers every season. Supply contracts decide renewal. Delivery reliability decides supplier rankings.

Buyer profiles are shifting between generations. Older buyers bought ginseng on family tradition and brand loyalty, while younger consumers ask for ginsenoside data, convenient formats, origin proof, and clean labels. Importers add a third group that sets residue and identity rules. Houses that publish origin and ginsenoside data win younger buyers and keep them as formats widen. Margins follow sourcing discipline.
ginseng-market-end-use-penetration-index-1789883061492

MMA Verdict on Ginseng Strategy

These are among the four positions where our research anticipates prominent divergence between winners and laggards over the coming forecast period. Each is grounded in the demand model, the regulatory perimeter, and the announced capacity pipeline.
01 / ENRICHED GINSENG STRATEGY

Shift Volume Into Enriched and Extract Formats Before Rivals Lock Format-Led Buyers

Ginsenoside-Enriched and Fermented Ginseng grows at 11.0% a year, about 1.83 times the overall market rate, and gross margins of 34% to 52% compare with 18% to 30% for standard extracts. Houses should invest $2 million to $8 million in fermentation, enzyme processing, and analytical laboratories, shift 10% of volume into enriched and extract formats, and lift gross margin by 6 to 10 points. Those that stay in plain root will lose margin as root costs rise, while houses with premium formats keep brand accounts.
02 / EXTRACT FORMAT STRATEGY

Secure Soluble Taste-Masked Grades and Application Support Before Rivals Lock Beverage Programmes

Ginseng Extracts and Functional Ingredients grows at 7.8% a year, about 1.30 times the overall market rate, and gross margins of 26% to 42% reflect buyer demand for soluble, stable, taste-masked grades. Houses should invest in application laboratories, standardised grades, and supply agreements, target beverage, gummy, and cosmetic brands first, and publish stability data, lifting sales per customer by 10% to 18%. Those without application support will lose programmes, and early movers hold premiums for years, and buyers reward that support.
03 / ROOT SUPPLY STRATEGY

Contract Multi-Year Root Supply and Stock Before Cultivation Cycles Erase Margins Again

Roots take about 43% of cost, roots need 4 to 6 years to mature, and weather and disease swing supply, so houses without contracts or stock face price spikes and gaps. Houses should sign multi-year grower contracts in several countries, fund new land, hold root stock, index selling prices, and cut spot purchases by 30% to 50%. Those that stay on spot markets will absorb every swing, while houses with contracted supply hold margin, volume, and buyer confidence, and buyers reward that reliability.
04 / ORIGIN ASSURANCE STRATEGY

Certify Origin and Residue Compliance Before Fraud Cases Push Importers Away

Origin fraud and residue rejections, which hit 5% to 10% of lots in some channels, make importers audit heavily and prefer houses with traceability and testing. Houses should invest $0.5 million to $2 million in field-to-extract traceability, pesticide and identity testing, and third-party origin certification, target Japanese, Korean, and North American importers first, and publish audit outcomes, lifting contract renewals by 8% to 15%. Those that ignore assurance will lose accounts, while certified houses hold premium relationships for years, and buyers reward that record.

Engagement Snapshot From the Field

A live engagement with an industry participant carrying material or product regulatory and market exposure ahead of a defining policy shift, showing how our research translates into a defensible multi-year portfolio strategy.
MARKET MINDS ADVISORY · CLIENT ENGAGEMENT SUMMARY
Ginseng Producer Strategic Portfolio Review and Transition Roadmap 2026·Investment Scenario on Ginseng Exposure Evaluation 2025-26
CLIENT PROFILE
The client is a mid-sized Southeast Asian supplement and beverage brand with annual sales near $240 million (client-reported, unverified by MMA), selling energy shots, tonic drinks, and capsules through retail, pharmacy, and online channels in six countries. It bought standard ginseng extract from two traders, held 60 days of stock, and had faced one lot with high pesticide residue and one price rise.
STRATEGIC CHALLENGE
A ginseng lot failed a residue test at an importer, the traders proposed a price increase after a poor harvest, and a competitor launched a fermented ginseng drink with a strong absorption story. Management needed to decide whether to buy certified origin extract, adopt an enriched grade, or reduce ginseng in the range, with limited compliance staff and a retailer review date.
MMA APPROACH
MMA analysed lot, residue, and cost data across 14 lots, interviewed eight supplement and beverage technologist and procurement experts and four suppliers, and ran a consumer survey on ginseng trust across three countries. It modelled cost by sourcing scenario, tested price and quality cases, and ranked options by payback and execution risk.
KEY FINDINGS
  1. A certified origin producer with residue certificates would add about 18% to extract cost but meet importer requirements (client-reported, unverified by MMA). Batch records protect future sales.
  2. An enriched fermented grade would add about 40% to extract cost and allow a 30% lower dose per serving. Cost control separates leaders from followers.
  3. Consumers rated origin certificates and ginsenoside labels highly, and retailers accepted a price rise of about 6%. Clear specifications build buyer trust. Small buyers feel every input swing.
  4. Two qualified suppliers would add about 2% to cost but cut supply risk by about half. Technical reach compounds over time. Audits repeat every year.
CLIENT PROFILE
The client is a mid-sized Southeast Asian supplement and beverage brand with annual sales near $240 million (client-reported, unverified by MMA), selling energy shots, tonic drinks, and capsules through retail, pharmacy, and online channels in six countries. It bought standard ginseng extract from two traders, held 60 days of stock, and had faced one lot with high pesticide residue and one price rise.
STRATEGIC CHALLENGE
A ginseng lot failed a residue test at an importer, the traders proposed a price increase after a poor harvest, and a competitor launched a fermented ginseng drink with a strong absorption story. Management needed to decide whether to buy certified origin extract, adopt an enriched grade, or reduce ginseng in the range, with limited compliance staff and a retailer review date.
MMA APPROACH
MMA analysed lot, residue, and cost data across 14 lots, interviewed eight supplement and beverage technologist and procurement experts and four suppliers, and ran a consumer survey on ginseng trust across three countries. It modelled cost by sourcing scenario, tested price and quality cases, and ranked options by payback and execution risk.
KEY FINDINGS
  1. A certified origin producer with residue certificates would add about 18% to extract cost but meet importer requirements (client-reported, unverified by MMA). Batch records protect future sales.
  2. An enriched fermented grade would add about 40% to extract cost and allow a 30% lower dose per serving. Cost control separates leaders from followers.
  3. Consumers rated origin certificates and ginsenoside labels highly, and retailers accepted a price rise of about 6%. Clear specifications build buyer trust. Small buyers feel every input swing.
  4. Two qualified suppliers would add about 2% to cost but cut supply risk by about half. Technical reach compounds over time. Audits repeat every year.
RECOMMENDED STRATEGY
Phase 1: Phase 1 (Months 1-6): Qualify a certified origin supplier, test every lot for residues, and agree indexed pricing. Buyers review suppliers every season. Phase 2: Phase 2 (Months 7-24): Launch an enriched fermented ginseng drink and sign multi-year contracts with two suppliers. Supply contracts decide renewal. Phase 3: Phase 3 (Months 25-42): Audit suppliers yearly, review lot data quarterly, and extend enriched grades to capsules. Delivery reliability decides supplier rankings.
OUTCOME
Within 42 months, all lots carried residue and origin certificates, residue rejections fell to zero, and the enriched drink reached 15% of sales (client-reported, unverified by MMA). Gross margin held within 0.5 points, repurchase rose by 4%, and the client held supply through one root price spike. Margins follow sourcing discipline.

Frequently Asked Questions

Foundational context covering the market sizes, CAGR, scope, country, region and competition that inform every finding below. This section is provided to cover basics and most often pre-purchase conversations, answered from the MMA Primary Research Dataset.

What is the current size of the Ginseng Market?

The global ginseng market was valued at $5.20 billion in 2025 on a producer-value basis. Growth is supported by ageing and immunity demand and enriched formats, offset by long cultivation cycles and origin fraud.

How large will the Ginseng Market be by 2036?

The market is projected to reach $9.87 billion by 2036, up from $5.51 billion in 2026. The increase of $4.36 billion reflects enriched ginseng, extracts, and red ginseng brands.

What is the CAGR for the Ginseng Market 2026 to 2036?

The market is forecast to grow at a 6.0% CAGR from 2026 to 2036. The bull case reaches 7.3% and the bear case 4.7%, depending on clinical evidence, enriched adoption, and harvest conditions.

Which segment is growing fastest?

Ginsenoside-Enriched and Fermented Ginseng is the fastest-growing segment at 11.0% CAGR, roughly 1.83 times the overall market rate. Ginseng Extracts and Functional Ingredients follows at 7.8% CAGR each year.

Who are the major companies in the Ginseng Market?

Major companies include Korea Ginseng Corporation, Beijing Tong Ren Tang, Amorepacific, Hsu's Ginseng Enterprises, and Givaudan. Chai-Na-Ta, Nong Woo Bio, Blackmores, and Shiseido also hold meaningful positions in ginseng.

Which country is growing fastest?

China is growing fastest at about 7.6% CAGR, because traditional medicine, supplement, and beverage demand are expanding and domestic cultivation is scaling. South Korea follows as red ginseng exports and enriched formats grow.

Report Segmentation Architecture

The full report scope spans multiple orthogonal segmentation dimensions, with cross-tabulated demand data provided for each dimension pair. Coverage extends further to regional breakdowns, trend trajectories, and the competitive detail needed to support segment-level decision-making.

By Primary Market Dimension

  • Red Ginseng Products
  • White and Dried Ginseng Root and Powder
  • American Ginseng
  • Ginseng Extracts and Functional Ingredients
  • Ginsenoside-Enriched and Fermented Ginseng

By End-Use Industry

  • Dietary Supplements
  • Traditional Medicine and Tonics
  • Beverages and Functional Foods
  • Cosmetics and Personal Care
  • Gifting and Premium Retail

By Commercial Dimension

  • Direct Brand and Farm Sales
  • Botanical Distributors
  • Department Store and Gifting Channels
  • Private Label Supply
  • Toll Extraction Services

By Region

  • East Asia
  • North America
  • Western Europe
  • South Asia and Pacific
  • Latin America
  • Middle East and Africa
  • Eastern Europe

Scope, Methodology, and Coverage

Every figure in this report is reproducible from documented input assumptions. The scope below maps the historical period, the forecast horizon, the segmentation dimensions, and the countries covered, alongside the underlying primary and qualitative methodology.
Historical Period
2020 to 2025
Forecast Period
2026 to 2036
Base Year
2025 (USD billions; MMA Primary Research Dataset, September 2026)
Market Definition
The market covers global sales of ginseng, valued at producer level, including red ginseng products, white and dried ginseng root and powder, American ginseng, ginseng extracts and functional ingredients, and ginsenoside-enriched and fermented ginseng sold to supplement, beverage, cosmetic, and traditional medicine makers. The scope excludes Siberian ginseng and other adaptogens sold under different names, and finished consumer products.
Quantitative Units
USD billions (producer value); kilograms and tonnes for volume references
Segmentation Dimensions
By Product Form and Grade; By End-Use Industry; By Commercial Dimension; By Region
Regions Covered
East Asia, North America, Western Europe, South Asia and Pacific, Latin America, Middle East and Africa, Eastern Europe
Countries Covered
United States, Canada, Mexico, Germany, Switzerland, France, United Kingdom, Poland, Russia, China, Japan, South Korea, India, Vietnam, Thailand, Australia, Brazil, Argentina, Turkey, Egypt, South Africa, Saudi Arabia, and additional markets relevant to this sector
Key Companies Profiled
Korea Ginseng Corporation, Beijing Tong Ren Tang, Amorepacific, Hsu's Ginseng Enterprises, Givaudan, Chai-Na-Ta, Nong Woo Bio, Ilhwa, Gaia Herbs, Nature's Way, Layn Natural Ingredients, Shaanxi Jiahe Phytochem, Bio-gen Extracts, Indena, Shiseido, Suntory Wellness, Kobayashi Pharmaceutical, Blackmores, Swisse Wellness, Bayer Consumer Health
Quantitative Methodology
Primary survey, n=3,800 respondents, Q4 2025, six countries; demand-side model with trade association cross-validation
Qualitative Methodology
47 expert interviews, Q4 2025; applied to validate demand model assumptions, identify emerging dynamics, and assess competitive positioning
Report Format
PDF and XLSX data workbook (Word format preview document)
Publisher
Market Minds Advisory
Report Code
MMA-2026-HLT-748
Published
September 2026
Contact
sales@marketmindsadvisory.com | www.marketmindsadvisory.com

Purchase the full Ginseng Market Report (2026 to 2036).

The full report delivers a detailed assessment of the global ginseng market through 2036, covering product form and grade, end-use, and regional forecasts, competitive benchmarking of leading suppliers, and input cost analysis. It combines MMA primary research, including a six-country survey of 3,800 respondents and 47 expert interviews, with public statistical and company data. Analysts also model root supply scenarios, origin fraud paths, and enriched format adoption. Clients receive segment margin ranges, sourcing maps, and a case study on ginseng sourcing strategy. Supplier programme and contract frameworks are also included for planning.
Ten-year product and end-use demand forecasts
Root, energy, and freight cost tracking
Competitive benchmarking of top twenty suppliers
Herbal medicine and supplement rule tracker
Regional market comparative analysis and forecasts included
Quarterly primary survey data update access

Built For The People Who Decide

From boardroom strategy to bench-side execution, this report is read cover-to-cover by leaders shaping the next decade of their industry, turning demand scenarios, market dynamics and valuation benchmarks into decisions.
CXOs/ Presidents/ VPs/ Managers
M&A and Corporate Development
Strategy Teams and R&D Heads
Procurement and Product Directors
Regulatory and Compliance Leaders
Investor Relations and Equity Analysts