Market Minds Advisory
Gigabit Passive Optical Network (GPON) Market

Gigabit Passive Optical Network (GPON) Market: Gigabit Passive Optical Network (GPON) Market. Fiber-to-the-Home Access Infrastructure and the XGS-PON Transition, 2026 to 2036

Broadband operators worldwide are racing to retire copper access networks, pushing fiber-to-the-home deployment past the point where GPON's shared-fiber economics beat point-to-point alternatives, even as XGS-PON threatens to displace it.

Lead Analyst

Published

September 2026

Make Smarter Decisions with Customized Research Insights

Request a free sample report and evaluate market opportunities, growth trends, and competitive dynamics relevant to your business needs.

2025 MARKET VALUE$8.5BMarket Size 2025
2036 FORECAST VALUE$20.9BBase Case , 2026 to 2036
CAGR 2026 TO 20368.5 %Bull 9.7% / Bear 7.3%
INCREMENTAL OPPORTUNITY$11.6BNet 10- year value creation
EXPANSION MULTIPLE2.26x2036 value over 2026 base
Strategic Levers
M&A Pipeline
Regional Outlook
Country Rankings
Competitive Intelligence
Segmental Deep-dive
Call-Us : 91 93563 13602

Executive Snapshot and Market Trajectory.

GPON has become the default fiber access technology for residential broadband deployment worldwide, but operators in developed markets are already planning its full replacement with XGS-PON even as emerging-market deployment continues accelerating rapidly on the older, cheaper standard across dozens of countries still actively building out coverage.
Emerging-market operators, particularly across India and Southeast Asia, are deploying GPON at record pace because equipment cost has fallen sharply while government fiber broadband subsidy programs push penetration into previously underserved rural areas lacking any prior broadband access whatsoever. Developed-market operators, having already achieved dense urban fiber coverage, increasingly specify XGS-PON for new builds while keeping existing GPON networks running for years longer than originally planned given the considerable sunk infrastructure cost already invested.
Competitive intensity centers on optical line terminal and network terminal equipment pricing, where Chinese vendors compete aggressively on cost against European and North American suppliers differentiating on software-defined network management capability, while operators increasingly demand equipment that supports both GPON and XGS-PON simultaneously on the same fiber to protect their capital investment during the multi-year technology transition now underway across most major markets globally.
Market Definition
The GPON Market covers optical line terminal and optical network terminal equipment, splitters, and associated network management software used to deliver gigabit-capable passive optical fiber broadband access. It excludes long-haul and metro optical transport equipment, active Ethernet fiber access alternatives, and customer premises Wi-Fi equipment unrelated to the optical access layer itself.
Base Year Value
$8.5B in 2025 (MMA Primary Research Dataset, September 2026)
Forecast Period
2026 to 2036, eleven discrete annual values
CAGR
8.5% base case. Bull 9.7%. Bear 7.3%.
Fastest Growth Segment
XGS-PON-Compatible Optical Line Terminals: 13.5% CAGR
Fastest Growth Country
India: 15.0% CAGR
Fastest Growth Region
South Asia and Pacific: 10.5% CAGR
Largest Region
East Asia: 30% of 2025 global value
Market Leaders
Huawei, Nokia, ZTE, Calix, and Adtran lead by optical line terminal shipment volume. Source: MMA Primary Research Dataset, July 2026.
Primary Survey
n=3,800 procurement and R&D decision-makers, Q4 2025, six countries
Methodology
Demand-side build-up, cross-validated against public data, 47 expert interviews

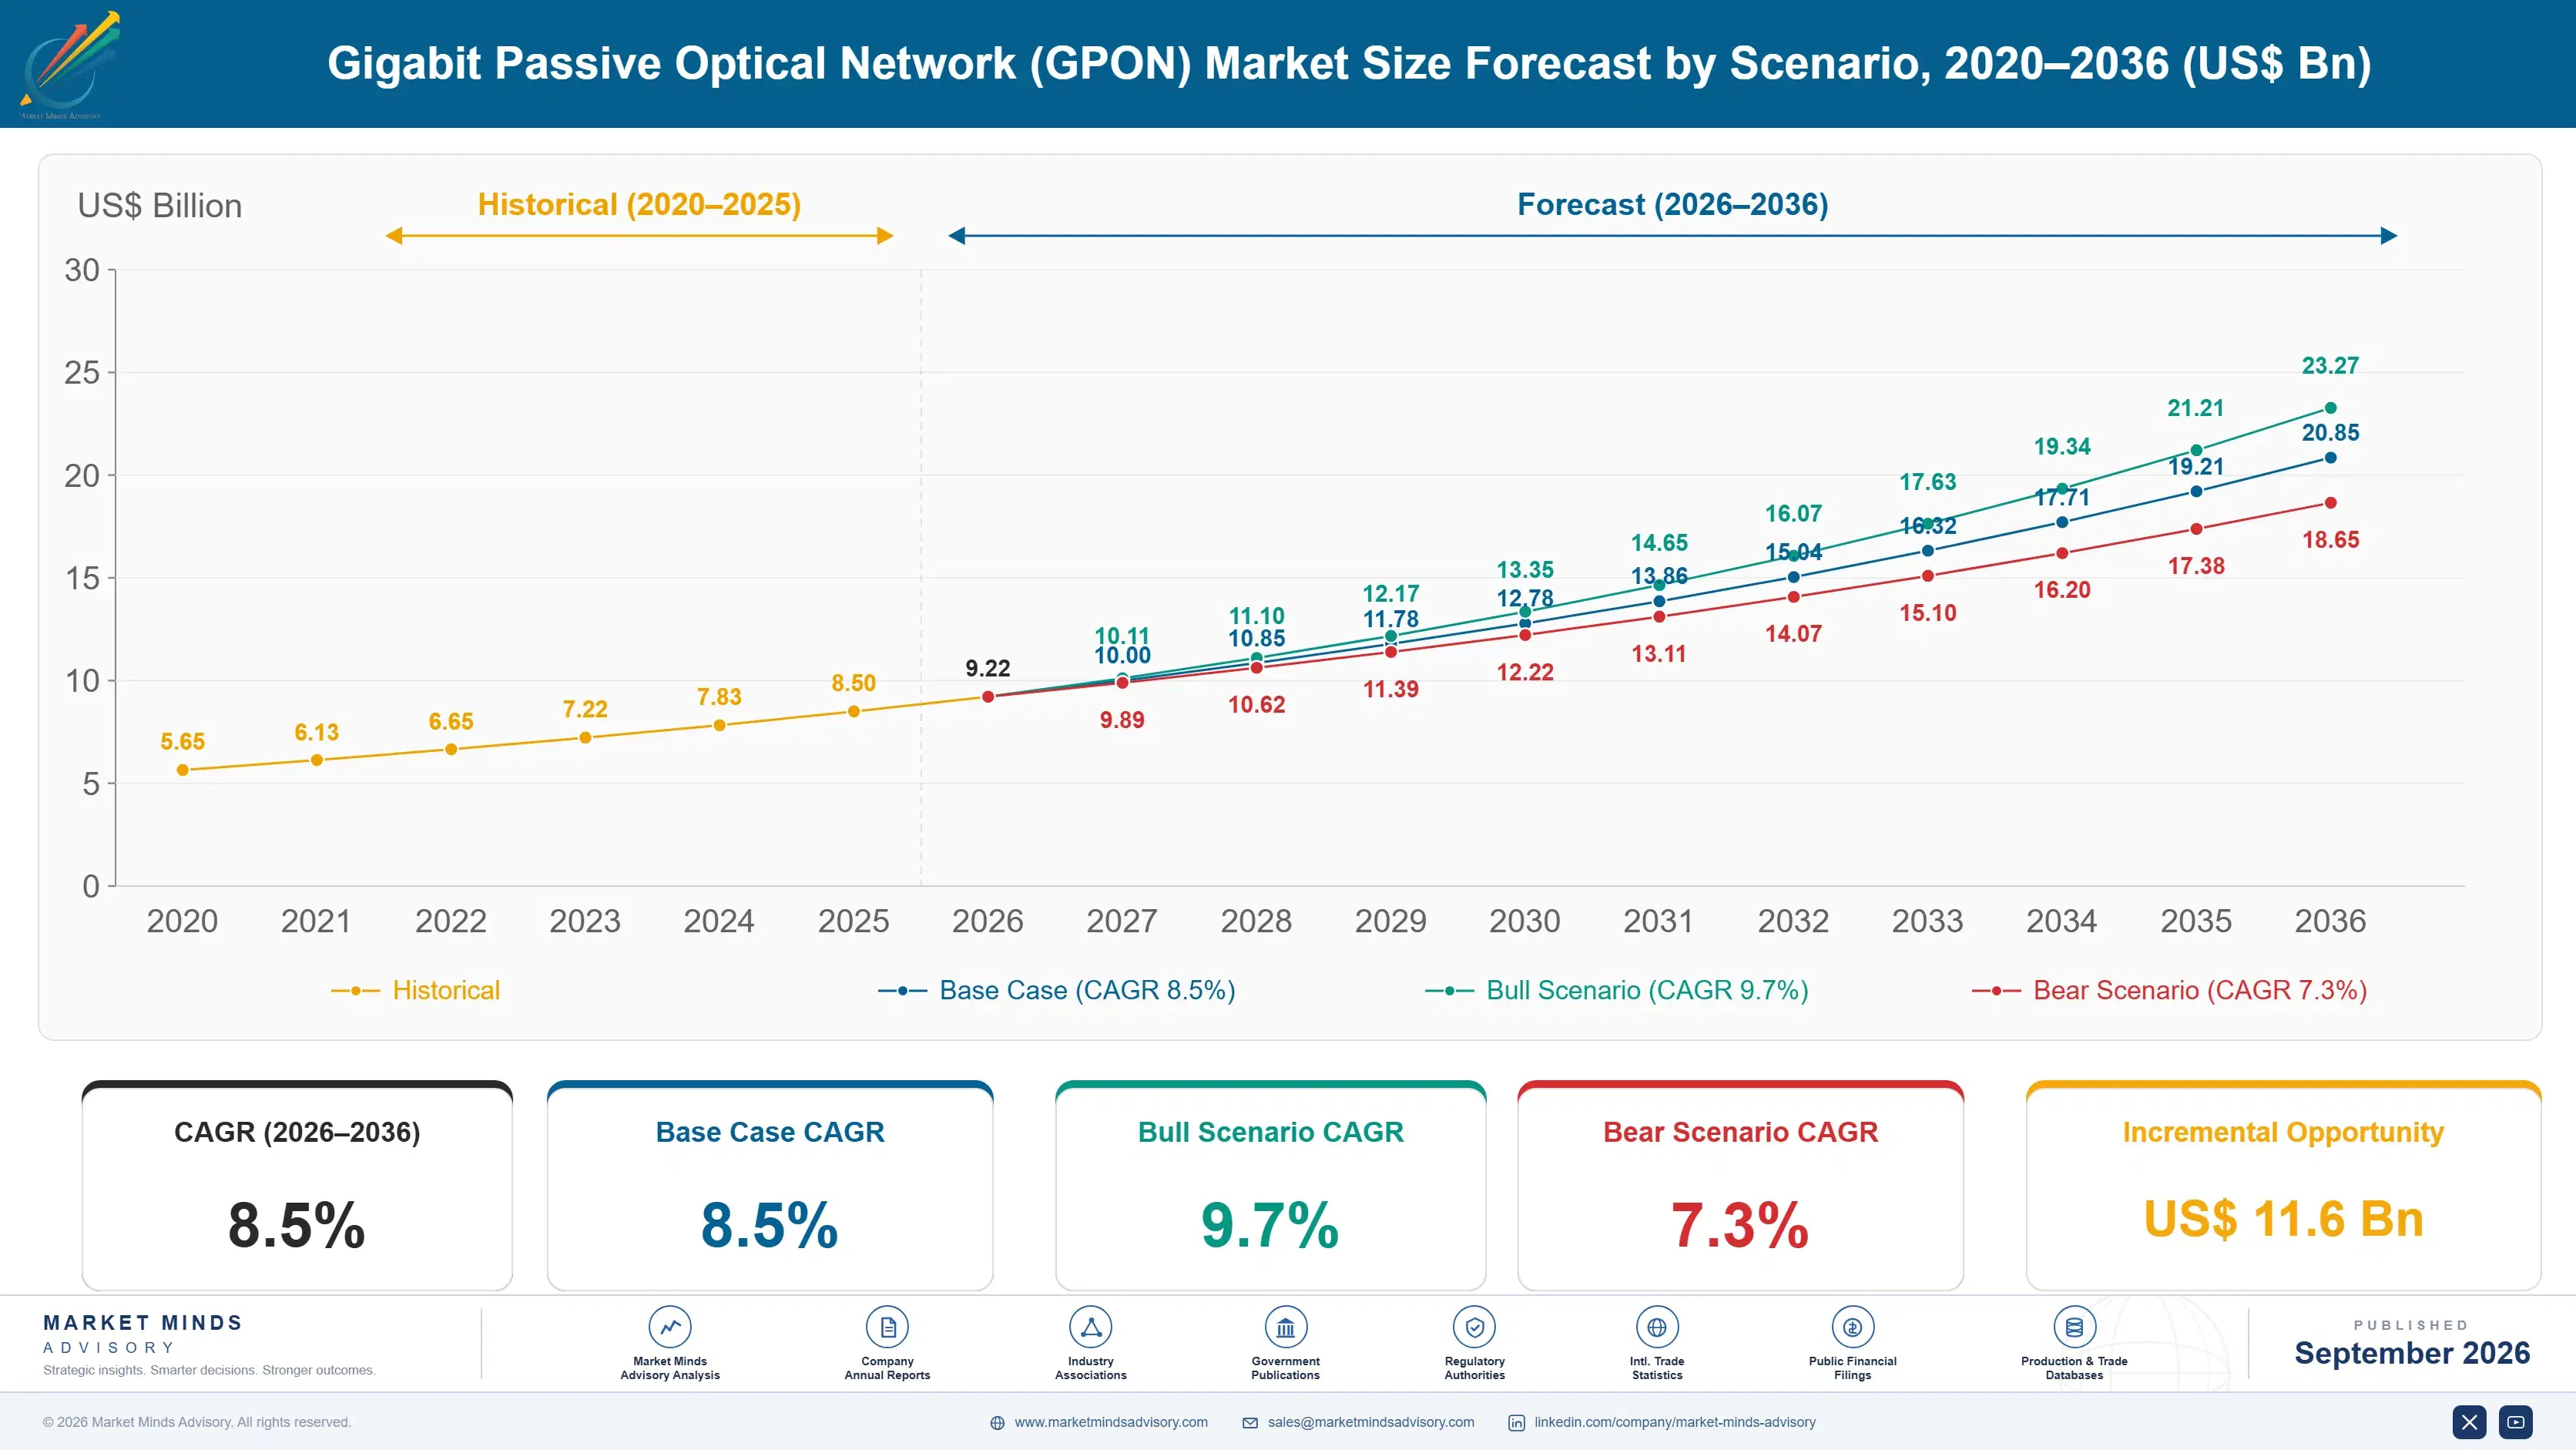
Gigabit Passive Optical Network (GPON) Market Forecast Scenarios

gigabit-passive-optical-network-market-size-forecast-scenario-1789988032859
Between 2020 and 2025, GPON deployment accelerated sharply as pandemic-driven broadband demand pushed governments and operators worldwide to fund fiber rollout programs, with equipment cost declines making gigabit fiber access economically viable in markets previously limited to lower-bandwidth copper or wireless alternatives, particularly across South Asia and parts of Sub-Saharan Africa lacking prior fixed broadband infrastructure entirely.
The base case assumes continued GPON deployment in emerging markets still building initial fiber coverage, gradual XGS-PON migration in developed markets extending rather than fully replacing existing infrastructure investment, and sustained government broadband subsidy programs lowering effective deployment cost for operators serving underserved populations. Together these three mechanisms sustain moderate growth through 2036, with India and Southeast Asian markets driving the bulk of unit volume even as developed-market revenue per port declines steadily.
A bull scenario assumes faster-than-expected emerging-market fiber subsidy program expansion pulling forward deployment volume considerably beyond current projections across multiple large developing economies simultaneously and unexpectedly. A bear scenario assumes accelerated XGS-PON price parity forces premature GPON network retirement in developed markets, shortening the equipment replacement cycle operators had originally planned around by several years.

Where Emerging-Market Volume Now Outpaces Developed Revenue

GPON has fully transitioned from an emerging technology to standard telecom infrastructure, with the market's center of gravity shifting decisively toward unit volume in markets still building initial fiber coverage rather than toward the developed-market revenue per port that once defined the category's growth story for most of the past decade.
MARKET CONCENTRATION (CR5)55%Top five equipment vendors hold roughly half of shipments
AVERAGE OLT PORT COST$45Typical per-port equipment cost for a standard deployment
SOUTH ASIA DEPLOYMENT SHARE34%Combined regional share of new fiber port deployment volume
XGS-PON MIGRATION RATE22%Developed-market ports upgraded from GPON to the newer standard
OPTICS SHARE OF COGS38%Portion of equipment cost from optical and semiconductor components
AVERAGE FIBER TAKE RATE48%Share of passed homes that subscribe to fiber service
India and Southeast Asia now account for the largest share of new port deployment, reflecting government fiber subsidy programs and equipment cost declines that have made gigabit fiber economically viable even in low-average-revenue-per-user markets previously considered unattractive for fiber investment. Chinese equipment vendors dominate this volume segment on cost, while European and North American vendors retain stronger positions in developed-market upgrade and replacement cycles.
XGS-PON migration in developed markets proceeds more gradually than early forecasts suggested, since operators with dense existing GPON networks find the business case for wholesale replacement weaker than the case for extending existing infrastructure through targeted capacity upgrades on high-usage segments only where genuine bandwidth constraints exist today. This has slowed the pace of pure XGS-PON greenfield deployment relative to what vendors originally anticipated when the standard first launched commercially.
"Every operator we talk to in Southeast Asia is building GPON as fast as vendors can ship it. Their counterparts in Europe are quietly asking when they get to stop supporting it."
Director, Broadband Access Infrastructure Practice · MMA Technology Practice · September 2026

Market Trends

Government Fiber Subsidy Programs Expand Rural Coverage

National broadband programs across India, Indonesia, and several African markets have expanded fiber subsidy funding meaningfully since 2024, directly lowering the effective cost operators face when extending GPON networks into rural and peri-urban areas previously judged commercially unviable without direct government support. This funding has pulled multiple new regional operators into the market who previously lacked the capital to justify fiber investment beyond dense urban cores. Equipment vendors have responded by developing lower-cost, ruggedized outdoor cabinet designs specifically suited to the harsher deployment conditions and thinner support infrastructure these subsidized rural programs typically involve, expanding the addressable equipment market considerably.
Market Impact: Equipment cost fell roughly 35%
Combo GPON and XGS-PON Equipment Gains Adoption

Equipment vendors increasingly offer optical line terminals supporting both GPON and XGS-PON wavelengths simultaneously on the same fiber, letting operators upgrade capacity for specific high-usage customers without a full network replacement or a disruptive splitter reconfiguration across the entire serving area involved in the upgrade. This combo approach has become the default specification for new equipment purchases among developed-market operators managing a gradual, multi-year migration rather than a single cutover event. Vendors offering combo-capable equipment report meaningfully stronger win rates in competitive tenders than vendors still selling single-standard equipment exclusively.
Market Impact: Copper retirement deadlines set for 2028

Market Opportunities and Growth Drivers

Equipment Cost Declines Make Fiber Viable in Low-ARPU Markets

Optical line terminal and network terminal equipment cost has fallen considerably over the past five years as manufacturing scale increased and component costs declined, making gigabit fiber access economically viable in markets with average revenue per user far below levels that historically justified fiber investment. This shift has opened rural and lower-income urban markets across South Asia, Southeast Asia, and parts of Africa that operators previously served only with copper or fixed wireless technology, creating a substantial new addressable customer base for fiber-based broadband service providers entering these regions for the first time.
Market Impact: XGS-PON offers 4x the bandwidth

Copper Network Retirement Accelerates in Developed Markets

Regulators and operators across multiple developed markets have formalized copper network retirement timelines since 2024, requiring a full transition to fiber or equivalent technology within defined multi-year windows that leave no viable long-term alternative to continued fiber investment whatsoever. This regulatory certainty has removed the option some operators previously had to delay fiber investment indefinitely while continuing to harvest declining copper network revenue, forcing capital allocation toward GPON and XGS-PON equipment purchases on a firm timeline rather than an opportunistic one, considerably accelerating near-term deployment volume across affected national markets.
Market Impact: Rural payback often exceeds 8 years

Market Restraints and Challenges

XGS-PON Threatens to Cannibalize GPON Equipment Demand

GPON faces a genuine long-term threat from XGS-PON, its own successor standard offering roughly four times the downstream bandwidth on largely compatible fiber infrastructure, and the root cause is straightforward technology succession within the same passive optical network family. The commercial impact falls hardest on GPON-only equipment vendors unable to offer combo or XGS-PON-capable products, who face declining orders from developed-market operators managing an active migration. Vendors are mitigating this by developing combo equipment supporting both standards simultaneously, extending GPON-related revenue even as pure GPON-only unit volume gradually declines across developed markets over time.
Market Impact: Subsidies cover up to 40%

Rural Deployment Economics Remain Marginal Without Subsidy

GPON deployment economics in the lowest-density rural areas remain marginal even after equipment cost declines, and the root cause is the fundamental mismatch between fixed per-kilometer fiber trenching cost and the small number of subscribers available to amortize that cost in sparsely populated regions. The commercial impact limits deployment to areas with either government subsidy support or unusually favorable trenching conditions, leaving genuinely remote populations underserved despite falling equipment prices. Operators are mitigating this by pursuing shared infrastructure arrangements and targeted fixed wireless alternatives for the least economical remaining pockets.
Market Impact: Combo equipment wins 65% of tenders
4 additional market trends, 3 additional growth drivers, and 4 additional restraints and challenges are covered in the full report. Contact sales@marketmindsadvisory.com to access the complete intelligence.

Segment CAGR and Growth Architecture

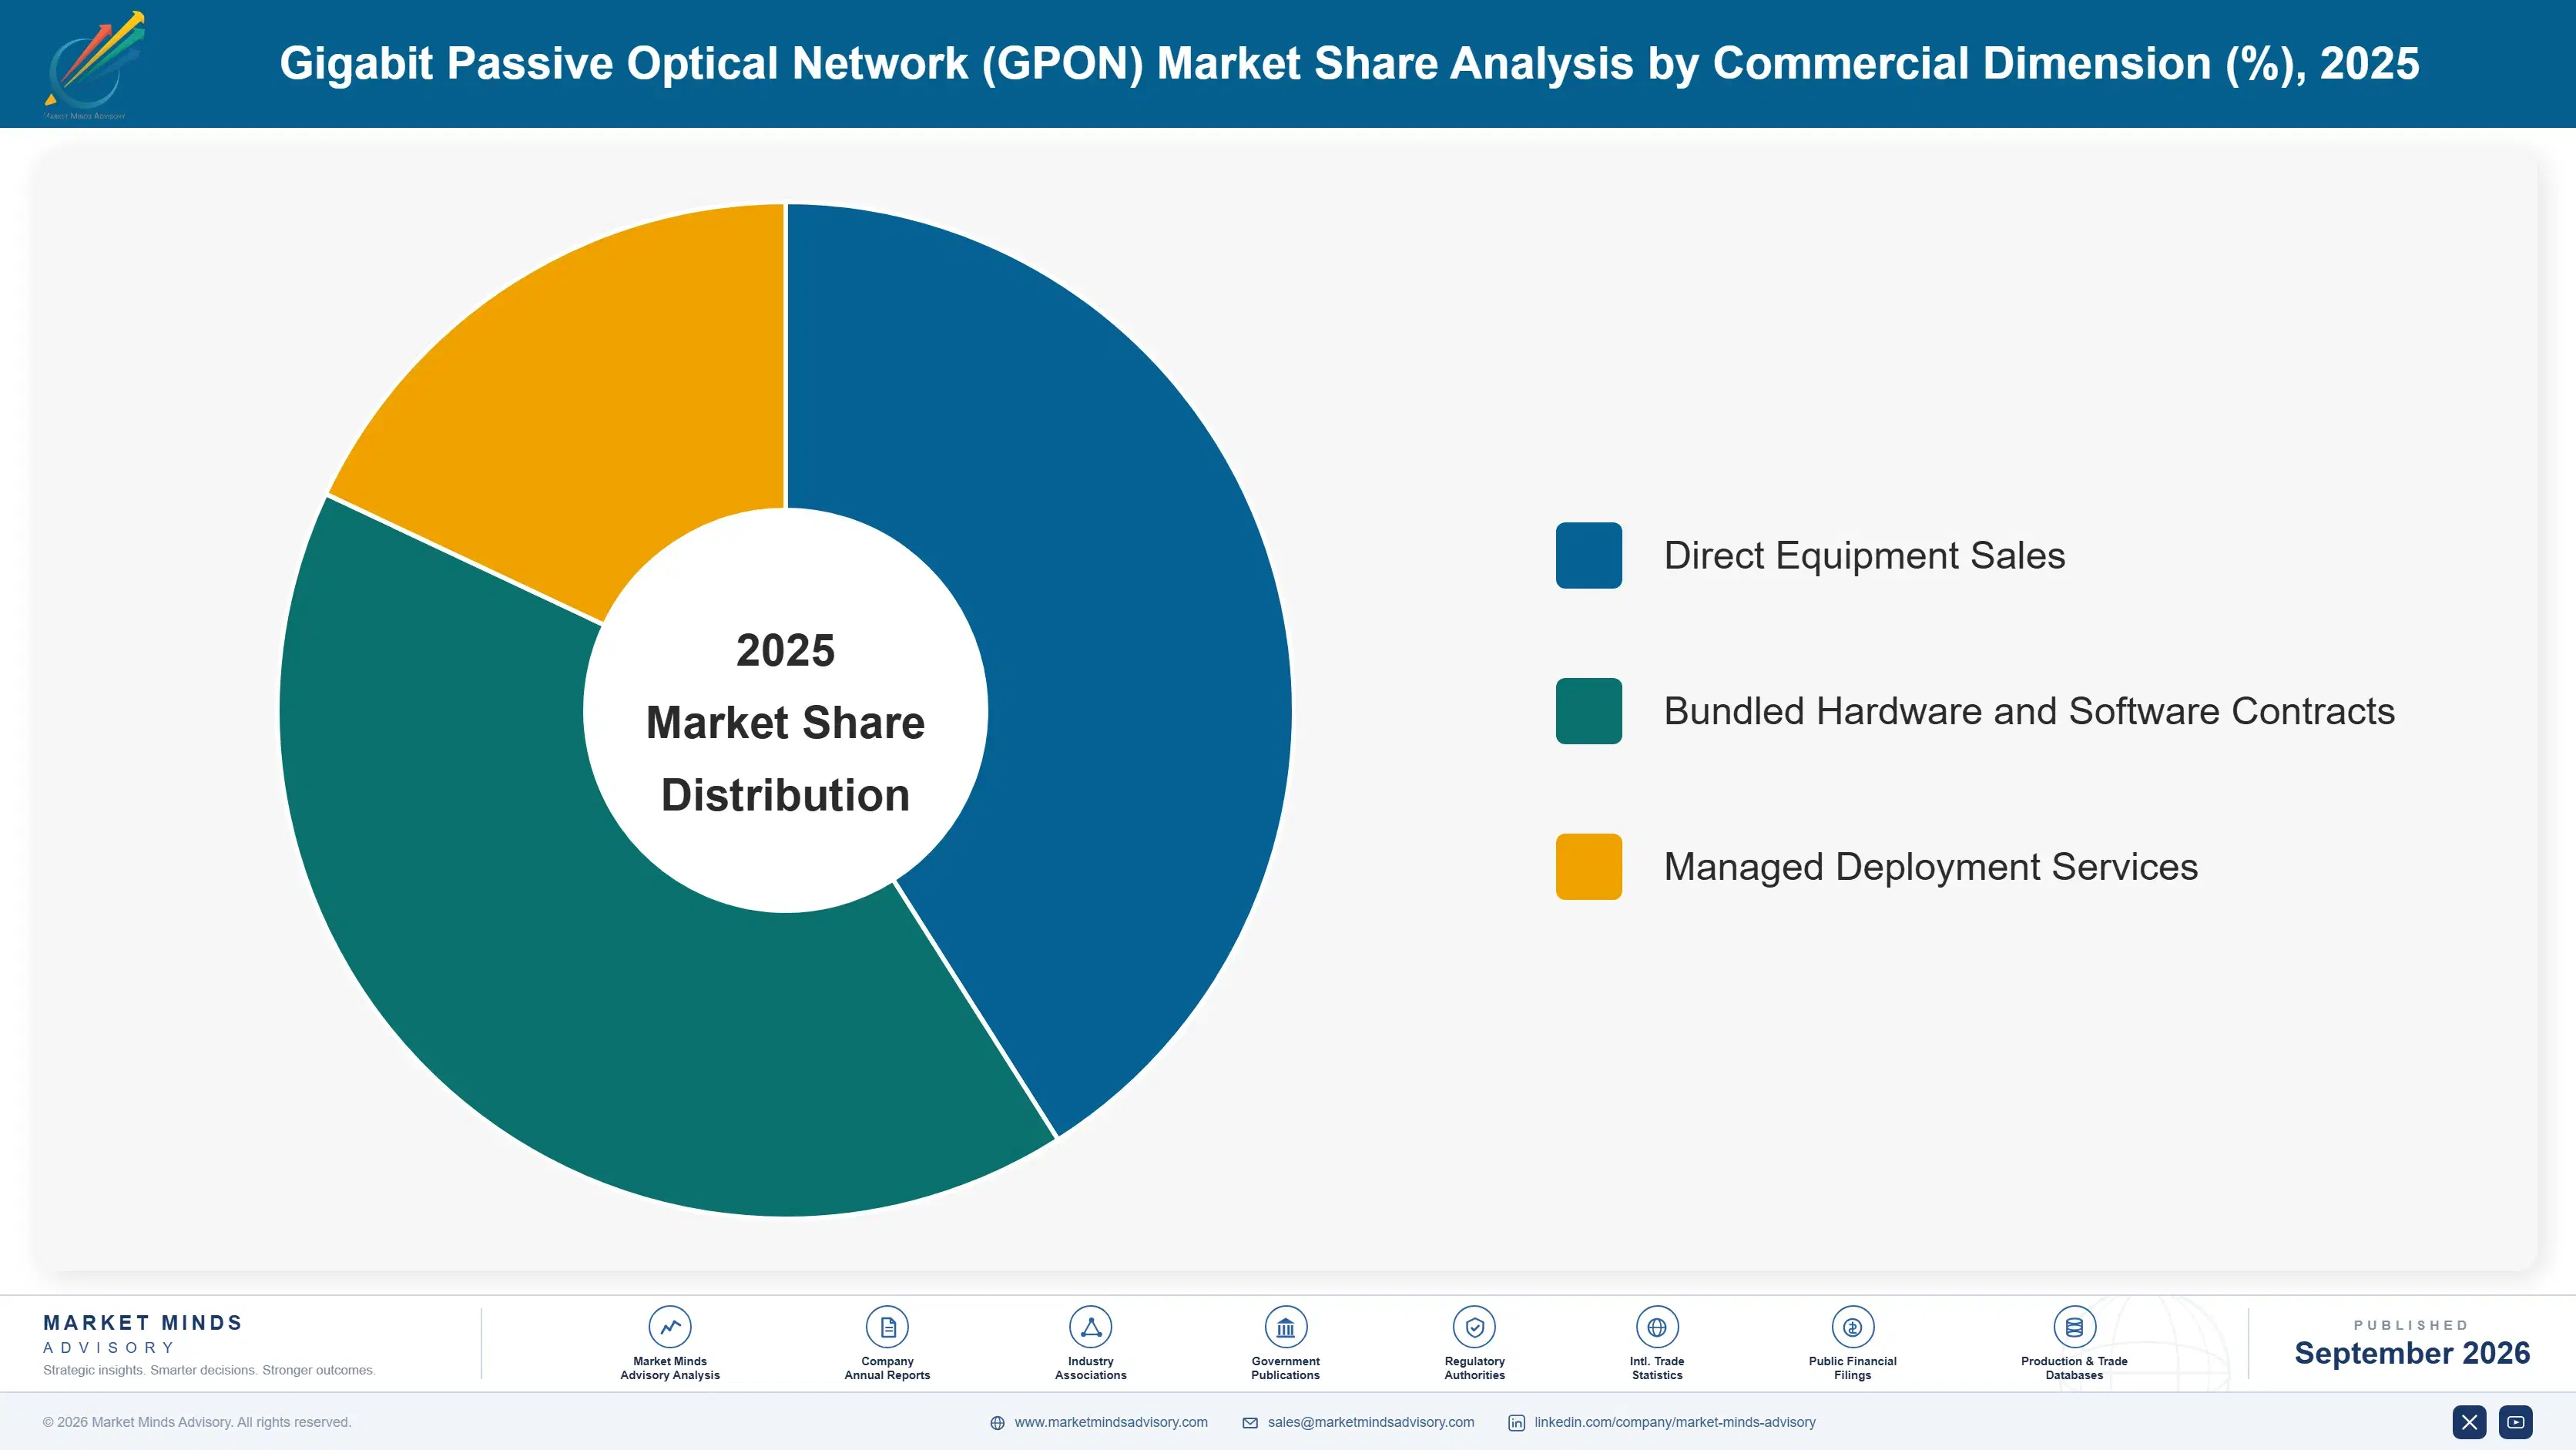
GPON equipment divides into five categories distinguished by function within the passive optical network architecture, from central office electronics through customer premises equipment and supporting infrastructure across the industry. Optical line terminals, optical network terminals, passive splitters and distribution components, XGS-PON-compatible optical line terminals, and network management software each carry distinct replacement cycles and margin profiles.
gigabit-passive-optical-network-market-market-share-analysis-1789988033427

XGS-PON-Compatible Optical Line Terminals

XGS-PON-compatible optical line terminals have become the fastest-growing category because they let operators support both GPON and the newer, higher-bandwidth XGS-PON standard simultaneously on the same fiber without requiring a disruptive splitter reconfiguration across the entire serving area involved in a typical deployment. Developed-market operators increasingly specify combo-capable equipment as the default for new purchases, treating single-standard GPON-only terminals as a declining legacy category reserved for the lowest-cost emerging-market deployments where XGS-PON demand has not yet materialized at all. Equipment vendors report combo-capable products now winning a clear majority of competitive tenders in developed markets, a reversal from just two years earlier when GPON-only equipment still dominated most procurement decisions.
CAGR 13.5%

Network Management and Orchestration Software

Network management and orchestration software has grown into a meaningful standalone category as operators managing mixed GPON and XGS-PON networks require centralized visibility and provisioning tools capable of handling both standards across a single unified management plane spanning the entire access network footprint nationwide and beyond. This software increasingly determines total deployment cost as much as the hardware itself, since operators value the ability to provision new subscribers and diagnose faults remotely without dispatching field technicians for issues resolvable through software alone. Vendors bundling sophisticated management software with hardware sales report stronger customer retention and considerably higher effective margins than vendors competing purely on hardware unit pricing across the industry.
CAGR 11.0%
Full segment breakdown across 5 segments available in the complete report.

Regional Architecture and Country Demand Map

East Asia leads global GPON deployment by a wide margin, reflecting China's enormous existing fiber-to-the-home installed base. South Asia and Pacific posts the fastest regional growth rate as India's national broadband program accelerates rural fiber rollout, while developed-market growth slows considerably as networks near full saturation.

North America

North America's GPON revenue reflects a mature, largely built-out fiber footprint where new deployment has slowed considerably and demand increasingly centers on XGS-PON upgrade cycles and equipment replacement rather than greenfield fiber-to-the-home rollout across most major metropolitan markets nationwide today and going forward more steadily. Regulatory pressure to retire copper networks entirely has provided a steady baseline of replacement demand even in areas where fiber penetration already exceeds most developed-market peers by a meaningful margin. Equipment vendors serving this region compete primarily on software-defined network management capability and combo GPON and XGS-PON support rather than on the raw unit pricing that dominates competitive dynamics in faster-growing emerging markets elsewhere globally.
Share: 24% | CAGR: 8.0% (2026 to 2036)

Western Europe

Western Europe's GPON revenue reflects a fiber rollout that proceeded somewhat more slowly than East Asia or North America through the 2010s but has accelerated meaningfully in several major markets since 2022 under coordinated national broadband strategies backed by substantial public funding. Germany and France in particular still carry meaningful greenfield deployment opportunity relative to more fully built-out neighbors like the Nordic countries, sustaining steadier equipment demand than the region's overall fiber maturity might otherwise suggest to outside observers. European Union digital infrastructure funding has supported rural deployment specifically, similar in spirit to programs seen in India though considerably smaller in absolute scale given the region's more modest rural population.
Share: 20% | CAGR: 7.0% (2026 to 2036)
Regional intelligence for 5 additional markets available in the complete report: East Asia, South Asia and Pacific, Latin America, Middle East and Africa, Eastern Europe. Contact sales@marketmindsadvisory.com.
gigabit-passive-optical-network-market-country-cagr-analysis-1789988033942

Where GPON Vendors Are Defending Margin

Equipment vendors are testing new commercial structures to defend margin as unit pricing compresses under intense Chinese vendor competition in high-volume emerging markets across the broader industry today and going forward. The levers below reflect where the industry is actively investing to build higher-margin revenue beyond basic hardware sales in a maturing, increasingly price-competitive category.

Bundling Network Management Software With Hardware Sales

Vendors are increasingly bundling sophisticated network management and orchestration software with optical line terminal hardware sales rather than selling software as a separate licensed product, commanding a price premium of 15 to 20 percent over hardware-only bids in competitive tenders across most markets today and tomorrow. This bundled approach also improves customer retention meaningfully, since operators find switching vendors mid-contract considerably more disruptive once management software is deeply integrated into daily network operations. Vendors without competitive management software increasingly lose tenders entirely to bundled competitors regardless of hardware price offered.
Market Impact: Commands a premium of 15 to 20 percent

Selling Combo GPON and XGS-PON Equipment at Premium Pricing

Vendors offering optical line terminals supporting both GPON and XGS-PON simultaneously charge 25 to 35 percent more than single-standard equivalents, since combo capability lets operators defer a full network replacement while still supporting XGS-PON customers on the same shared infrastructure without disruption. This premium has held steady even as overall unit pricing compresses, since the underlying value proposition, protecting existing capital investment during a multi-year technology transition, remains genuinely differentiated rather than easily commoditized like basic hardware. Adoption of combo equipment continues rising steadily among developed-market operators specifically each year.
Market Impact: Combo equipment commands 25 to 35 percent premium

Offering Managed Deployment Services in Emerging Markets

Vendors are increasingly offering managed deployment and installation services alongside hardware sales in emerging markets where operators often lack sufficient skilled field technician capacity to handle rapid fiber rollout independently, adding a service revenue stream worth roughly 10 to 15 percent of the total contract value overall. This approach also accelerates deployment timelines for operators racing to meet government subsidy program milestones, creating a mutual incentive for vendors to deliver quickly rather than simply shipping equipment and moving on to the next order. Several vendors report this service layer improving contract win rates considerably.
Market Impact: Services add 10 to 15 percent to contracts

Licensing Chipset Reference Designs to Regional Manufacturers

Larger vendors with proprietary optical line terminal chipset designs are increasingly licensing that intellectual property to smaller regional manufacturers serving markets the larger vendor cannot economically address directly, capturing a licensing royalty typically running 8 to 12 percent of the licensee's resulting equipment revenue each calendar year. This mirrors licensing strategies common in other telecom equipment categories, letting design owners monetize research investment across a broader manufacturing footprint than their own production capacity alone could support independently. Licensing revenue has grown steadily as more regional manufacturers enter price-sensitive emerging markets.
Market Impact: Licensing royalties typically run 8 to 12 percent

Who Controls the Margin Pool

GPON equipment shipment volume concentrates heavily at the top, with the five leading vendors holding roughly 55 percent combined share, reflecting the capital intensity and scale advantages that favor large telecom equipment manufacturers over smaller specialized entrants. Huawei and Nokia lead by this measure, drawing on massive manufacturing scale and deep existing operator relationships newer entrants cannot easily replicate. ZTE trails the two leaders somewhat in volume outside China but holds a dominant domestic position anchoring its overall global share considerably.
Current competitive activity centers on combo GPON and XGS-PON equipment development, as vendors race to offer products supporting the ongoing technology transition rather than committing customers to a single standard. Several vendors have announced expanded network management software platforms bundled with hardware sales, while Chinese vendors continue pressuring pricing across nearly every competitive tender globally.

Emerging pressure comes from smaller regional vendors in India and Southeast Asia building cost-optimized equipment for local government subsidy programs, capturing share where the largest global vendors compete less aggressively on price. Rankings among established vendors are likely to shift modestly as combo equipment adoption accelerates, favoring vendors with stronger XGS-PON engineering credentials over those still primarily focused on legacy GPON-only product lines.
gigabit-passive-optical-network-market-company-positioning-matrix-1789988034473

Competitive Moat and Risk Dimensions

HUAWEI

Moat: Massive Manufacturing Scale Advantage

Huawei's enormous manufacturing scale, built serving China's domestic fiber rollout and dozens of export markets simultaneously, gives it cost advantages smaller vendors cannot match on comparable equipment specifications. This scale lets Huawei compete aggressively on price in high-volume emerging-market tenders while maintaining margins that would prove unsustainable for less scaled competitors bidding on identical contracts.
HUAWEI

Risk: Restricted From Several Developed Markets

Huawei faces formal procurement restrictions across several developed markets over national security concerns, closing off a meaningful share of the highest-revenue-per-port developed-market opportunity that other vendors can pursue freely. This leaves Huawei disproportionately dependent on emerging-market volume, where per-unit revenue runs considerably lower than in restricted developed markets.
NOKIA

Moat: Trusted Developed-Market Vendor Status

Nokia's standing as a trusted, security-cleared vendor across North America, Western Europe, and allied markets gives it access to developed-market procurement that restricted competitors cannot pursue, letting Nokia command stronger pricing on the highest-margin XGS-PON upgrade contracts. This positioning has become increasingly valuable as geopolitical vendor restrictions have tightened since 2023.
NOKIA

Risk: Cost Disadvantage in Volume Markets

Nokia's cost structure, reflecting higher labor cost and a smaller manufacturing scale than Chinese competitors, limits its competitiveness in the highest-volume emerging-market tenders where price dominates procurement decisions over software sophistication. This confines Nokia's strongest growth opportunity largely to developed-market replacement and upgrade cycles rather than the fastest-growing volume segment of the overall market.

Players Tracked

Prominent Players

Huawei
Nokia
ZTE
Calix
Adtran

Other Key Players

Ciena
Sagemcom
Sumitomo Electric
Fiberhome Technologies
Dasan Zhone Solutions
UTStarcom
Vecima Networks
Ubiquoss
Telco Systems
Skyworth Digital
Ericsson
Tibit Communications
Sterlite Technologies
C-DOT
HFCL Limited

Recent Developments

FEBRUARY 2026

Huawei Expands Combo Equipment Line

Huawei launched an expanded combo GPON and XGS-PON optical line terminal product line targeting emerging-market operators beginning their initial XGS-PON evaluation while still deploying the bulk of new capacity on standard GPON equipment. The product line extends Huawei's cost advantage into the combo equipment category.
Signal: Signals combo equipment is expanding beyond developed markets into emerging-market procurement specifications increasingly and quickly nationwide
OCTOBER 2025

Nokia Launches Unified Management Platform

Nokia announced an expanded network management software platform supporting unified provisioning across mixed GPON and XGS-PON networks, targeting developed-market operators managing a gradual multi-year technology migration across their existing footprint. The platform bundles directly with Nokia's hardware sales rather than requiring a separate licensing arrangement.
Signal: Signals bundled software platforms are increasingly becoming a standard competitive differentiator across developed markets overall today
JUNE 2025

India Expands Fiber Subsidy Funding

India's national broadband program expanded fiber subsidy funding significantly during the year, prompting multiple domestic and international equipment vendors to announce new manufacturing capacity specifically serving the growing Indian market directly. The expansion reinforced India's position as one of the fastest-growing GPON deployment markets globally.
Signal: Signals government subsidy programs are directly shaping vendor manufacturing capacity investment decisions worldwide right now too

What Drives GPON Equipment Manufacturing Cost

Optical and semiconductor components represent the dominant input cost for GPON equipment, typically running 35 to 40 percent of total manufacturing cost, sourced primarily from specialized optical transceiver and laser diode manufacturers concentrated in East Asian and North American component supply chains. Printed circuit board assembly and enclosure manufacturing round out the remaining major cost categories.
Optical component pricing rose meaningfully during 2021 and 2022 as broader semiconductor supply constraints, documented extensively in industry supply chain reports covering that period, tightened availability of laser diodes and specialized optical transceivers across multiple telecom equipment categories competing for limited fabrication capacity. Vendors without long-term component supply agreements faced considerably longer lead times and higher spot market pricing during the tightest months of that period.

Smaller vendors without long-term component supply agreements or in-house optical manufacturing capability absorb price and lead-time volatility directly into equipment cost, pricing them out of competing for the largest volume government subsidy program contracts against better-capitalized rivals with locked-in supply terms. This dynamic favors vertically integrated vendors like Huawei that control significant portions of their own component production, while smaller specialized firms face considerably thinner margins on comparable equipment.
gigabit-passive-optical-network-market-cost-volatility-analysis-1789988034670

Securing Long-Term Optical Component Supply Agreements

Vendors are locking in multi-year optical transceiver and laser diode supply agreements with key component manufacturers, trading some pricing flexibility for protection against the spot market volatility and lead-time extension that squeezed the industry badly during 2021 and 2022 across nearly every product category. This approach requires sufficient purchasing volume to interest suppliers in long-term commitments.

Vertically Integrating Optical Component Production

Larger vendors are acquiring or building internal optical component manufacturing capability rather than remaining fully dependent on external transceiver and laser diode suppliers, capturing margin previously paid to third parties while gaining direct control over supply reliability during periods of volatility across the broader supply chain. This requires substantial capital investment smaller vendors typically cannot justify.

Standardizing Chipset Designs Across Product Lines

Vendors are consolidating optical chipset choices across multiple product lines rather than maintaining separate designs for each equipment model, reducing duplicate component qualification effort and enabling larger consolidated purchase orders that improve negotiating leverage with component suppliers on unit pricing across the entire product portfolio and its many configurations sold to customers worldwide each year.

Portfolio Architecture for Margin Defence

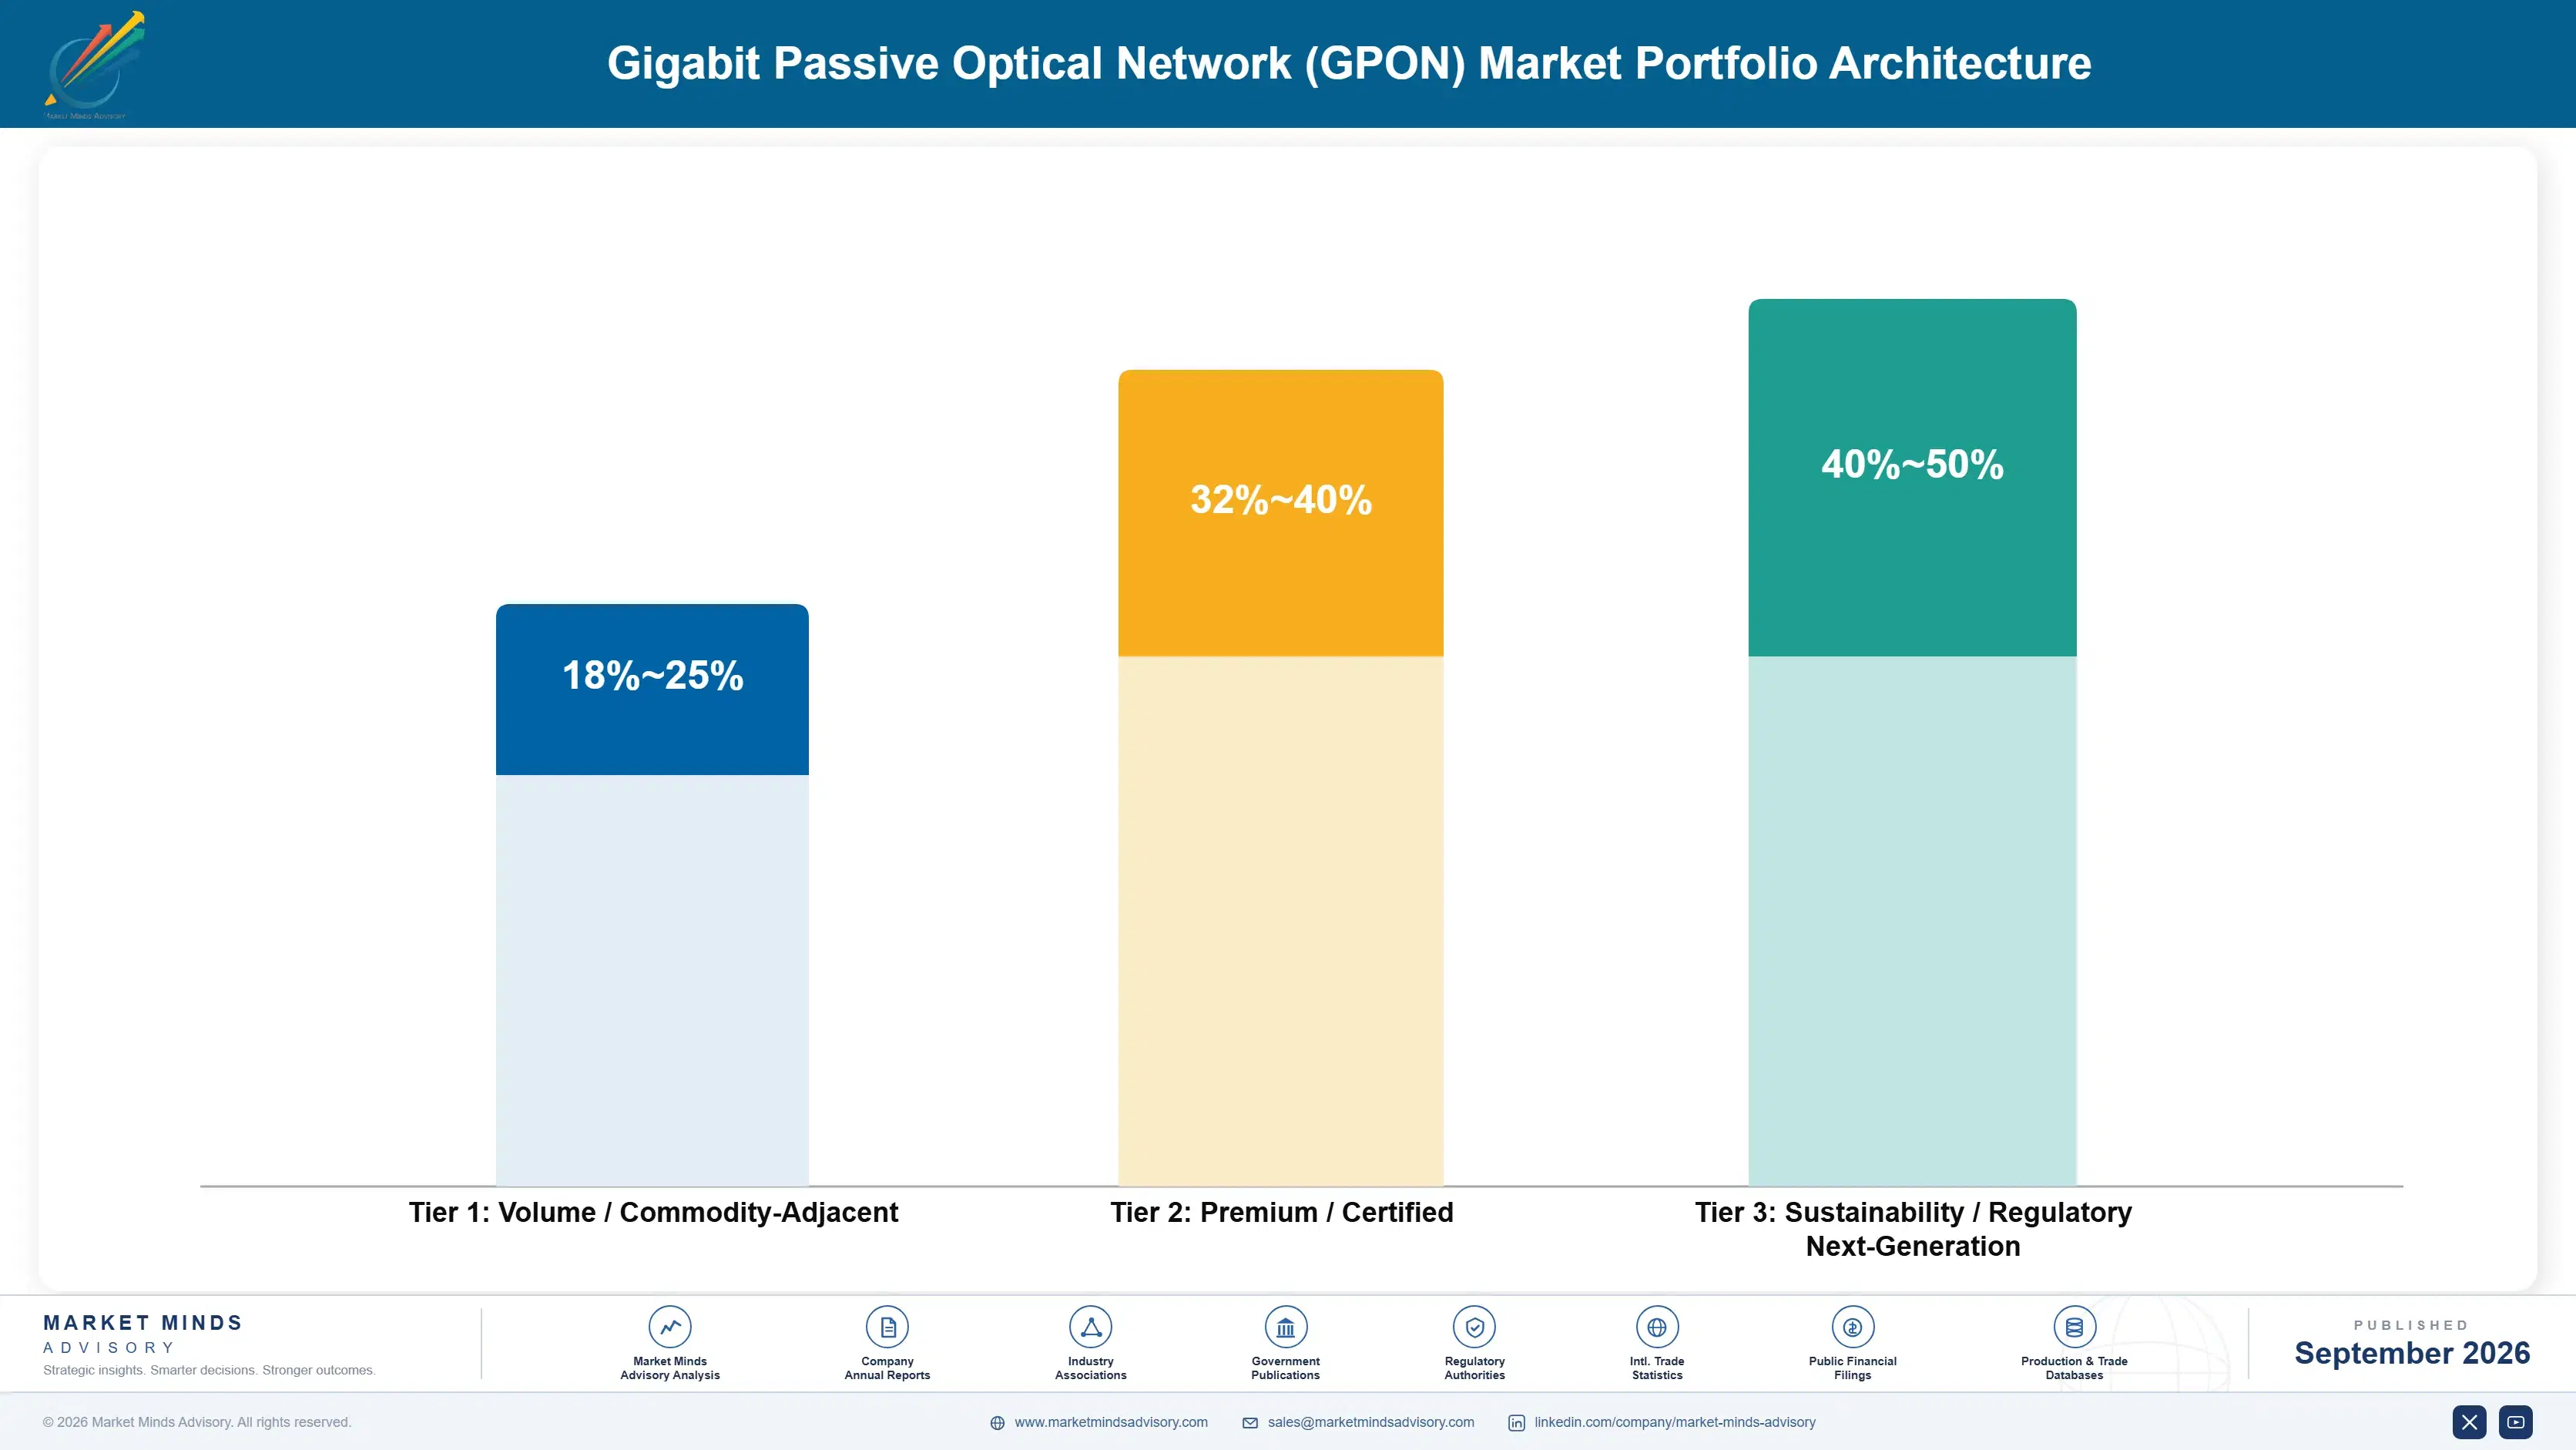
GPON equipment splits into three margin tiers reflecting technology generation and commercial sophistication across the industry today. Standardized GPON-only equipment for high-volume emerging-market deployment runs on volume economics with thinner per-unit margins, while combo GPON and XGS-PON equipment and bundled network management software command materially higher margins given their differentiated capability.
Tension between volume and premium tiers shows up in how vendors allocate engineering investment, since combo equipment and software development require ongoing capability that standardized GPON-only manufacturing no longer needs at the same intensity as before across most product lines and configurations. Vendors increasingly treat mature GPON-only products as a stable volume generator, funding premium combo equipment and software development from that steadier baseline revenue stream.

High-value margin pools concentrate specifically in combo GPON and XGS-PON equipment, network management software, and managed deployment services, all of which combine strong pricing power with meaningful barriers to entry from engineering and integration complexity across the entire broader industry today. Standardized GPON-only equipment represents the largest volume pool but the thinnest margins, having become increasingly commoditized as Chinese manufacturing scale drives unit pricing down steadily each year.

Volume / Commodity-Adjacent

Standardized GPON-only optical line terminals and network terminals sold at accessible unit pricing across high-volume emerging-market deployment programs to maximize shipment volume broadly across the market and its many national subsidy programs.
Gross Margin: 18-25%

Premium / Certified

Combo GPON and XGS-PON equipment sold as differentiated products commanding stronger per-unit pricing power than commodity single-standard alternatives available broadly across the market and its developed-market customer base today and tomorrow.
Gross Margin: 32-40%

Sustainability / Regulatory / Next-Generation

Network management software, managed deployment services, and chipset licensing addressing the industry's ongoing technology transition and its evolving commercial requirements across most markets and vendor categories worldwide today and tomorrow.
Gross Margin: 40-50%
gigabit-passive-optical-network-market-portfolio-architecture-1789988035172

High-value Sub-segments and Strategic Watch-out

Combo GPON and XGS-PON Equipment

Combo GPON and XGS-PON equipment combines strong growth with strong margins, driven by developed-market operators protecting existing fiber investment during a multi-year technology transition rather than committing to a disruptive full network replacement all at once across their entire existing footprint and full customer base.
Gross Margin: 38-46%

Network Management and Orchestration Software

Network management and orchestration software posts healthy margins and steady growth as operators managing mixed-standard networks increasingly value centralized visibility and provisioning tools across their networks, though absolute revenue remains smaller than hardware categories given the market's still-developing software attach rate across most deployment programs worldwide.
Gross Margin: 42-50%

Optical Line Terminals (OLT)

Standardized GPON-only equipment remains the volume core of the market, shipping into the vast majority of emerging-market deployment programs at accessible pricing, and vendors rely heavily on this segment for stable baseline revenue even as margins continue compressing steadily under sustained Chinese manufacturing scale pressure.
Gross Margin: 18-24%

Passive Splitters and Distribution Components

Passive splitters and distribution components warrant close monitoring as commoditization pressure intensifies fastest in this category, where limited differentiation opportunity leaves smaller vendors most exposed to Chinese manufacturing scale advantages that continue driving unit pricing steadily lower across nearly every deployment program worldwide today and tomorrow.
Gross Margin: 15-20%

Why GPON Revenue Compounds Regionally

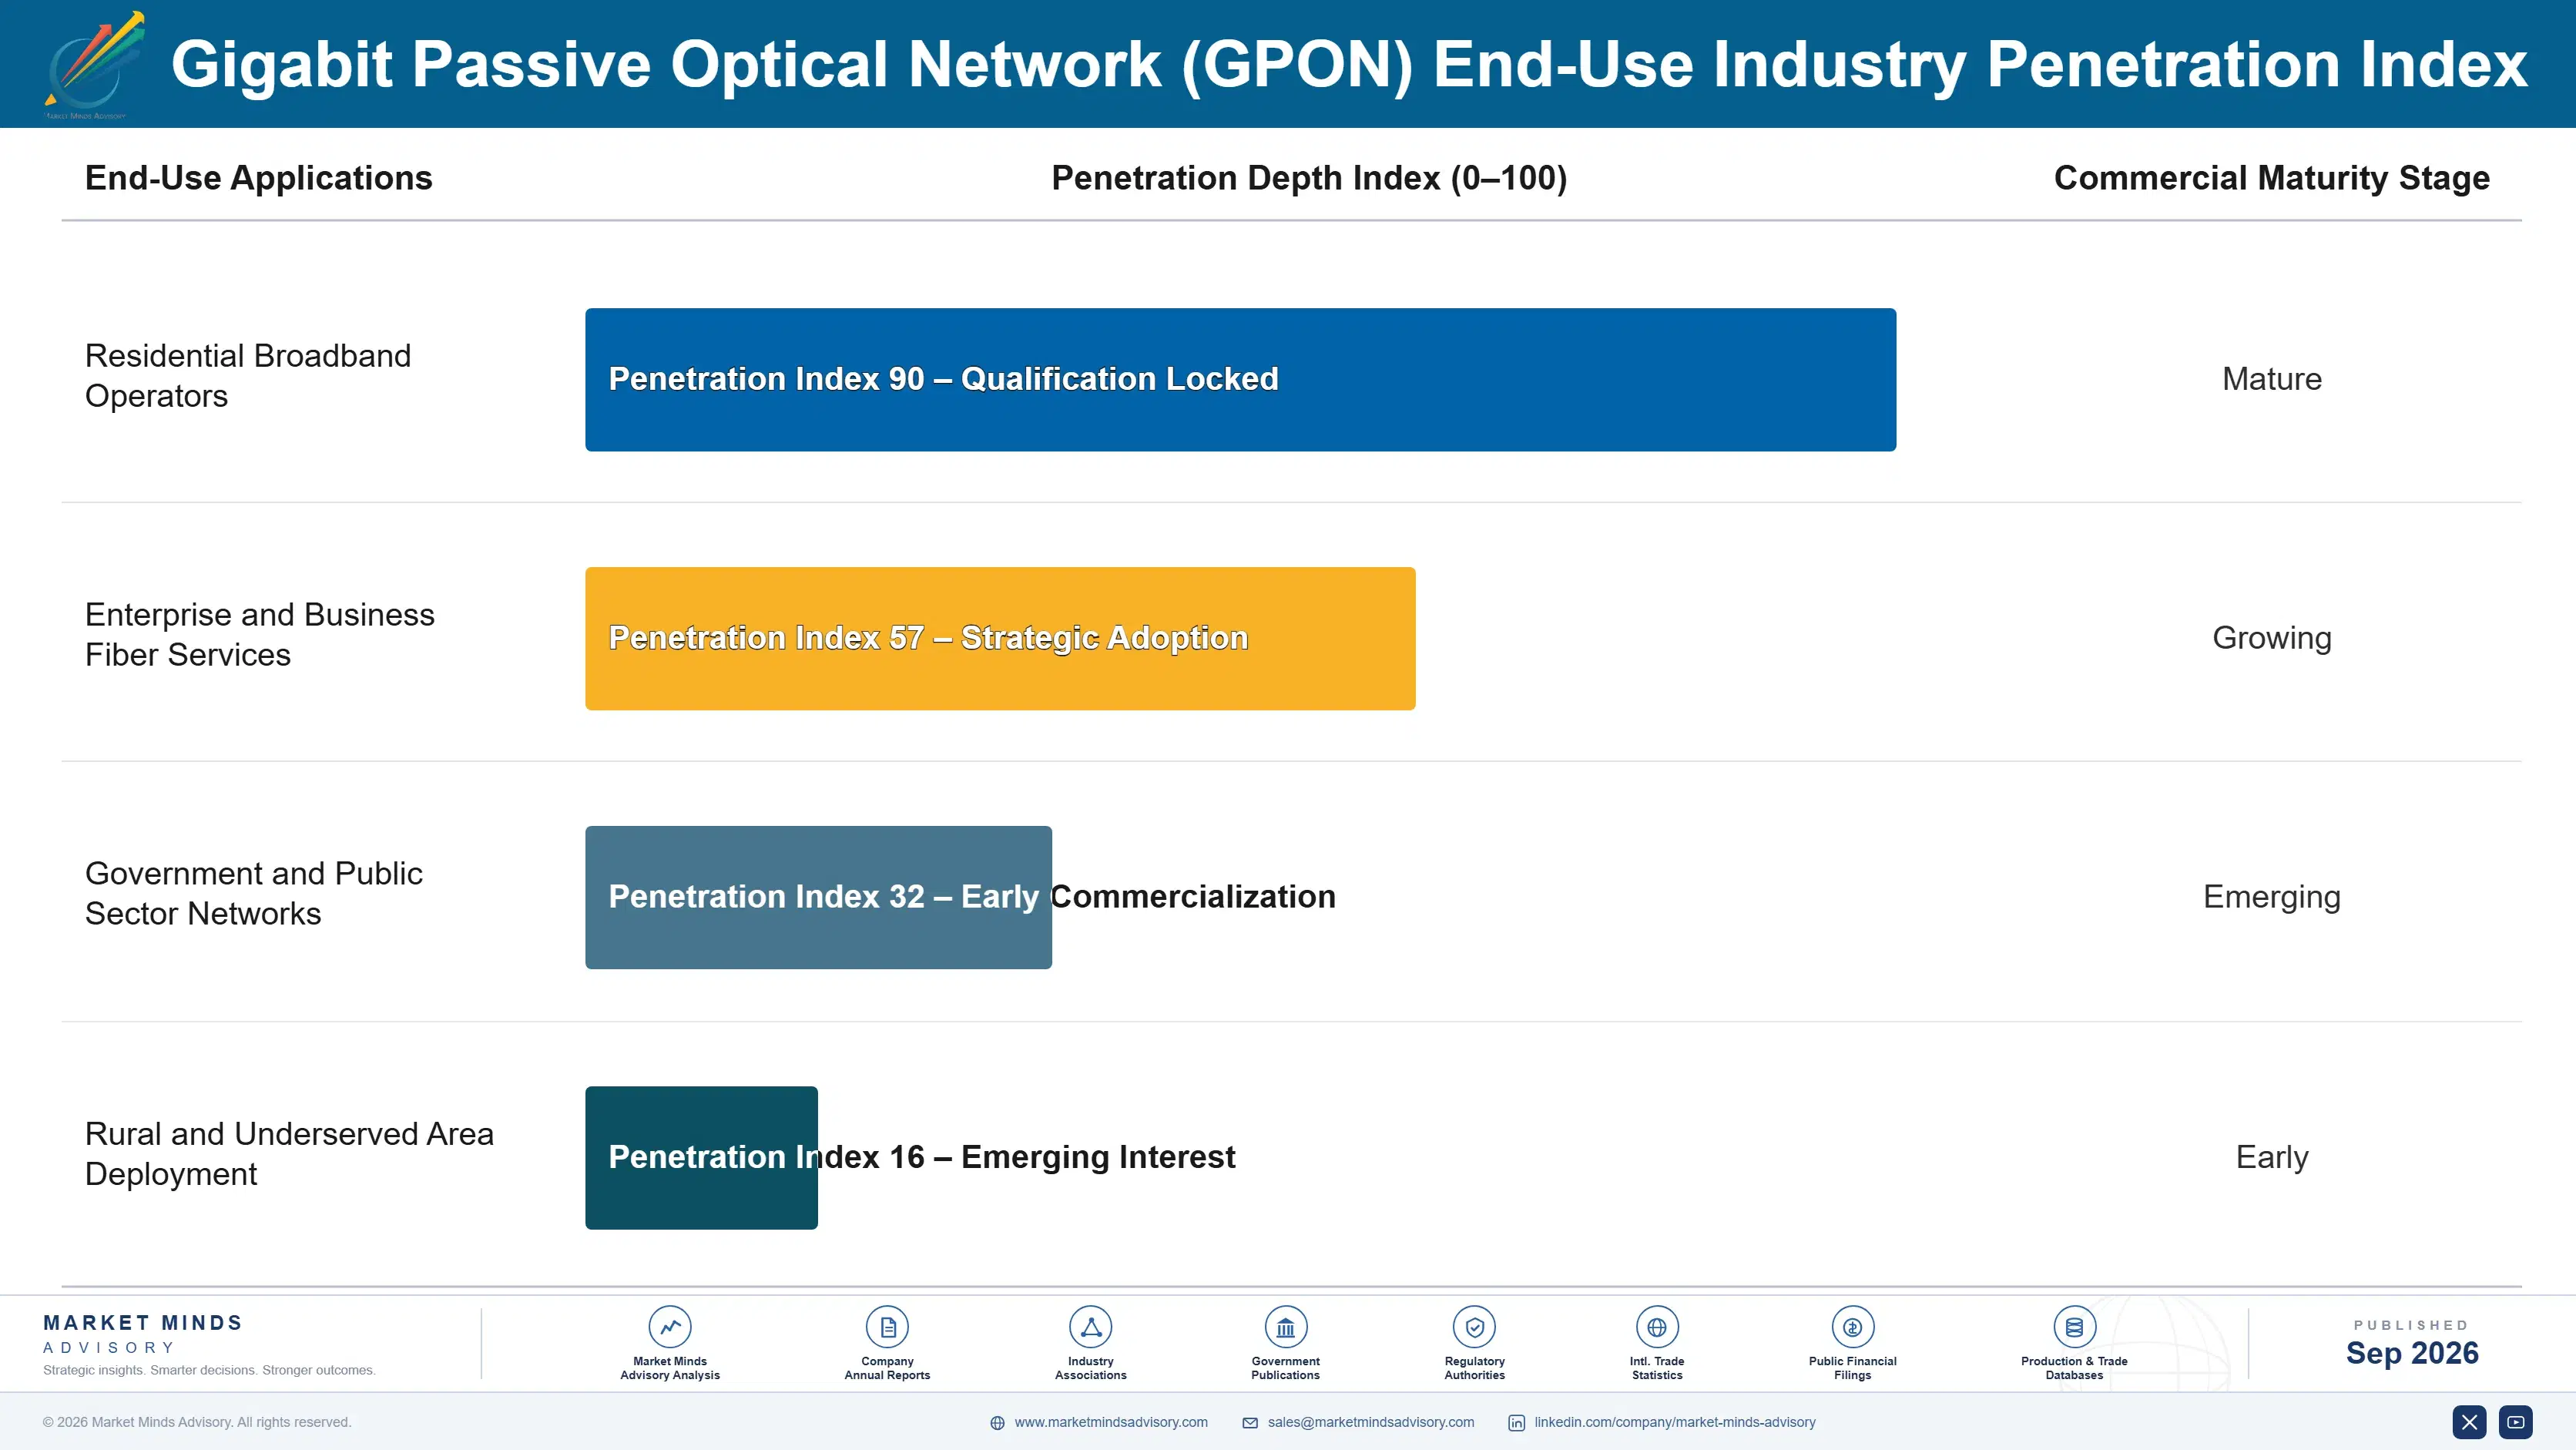
GPON equipment behaves less like a traditional annuity business and more like a construction project, since the bulk of vendor revenue arrives during the deployment phase rather than through recurring subscription-style payments after installation is complete. Once a network is built, vendor revenue shifts toward the considerably smaller replacement and expansion cycle rather than continuing at deployment-phase intensity for years afterward.
Adoption stickiness varies considerably by end-use vertical: government-subsidized rural deployment programs favor whichever vendor wins the initial subsidy tender, often locking in a multi-year exclusive relationship across the entire program, while urban commercial deployment sees more frequent multi-vendor competition on individual contracts. This basic difference in procurement mechanics shapes which vendors compete most aggressively in which market segment and geography.

Buyer profiles are shifting generationally as telecom procurement teams increasingly include dedicated network software specialists rather than relying solely on traditional hardware engineering leadership, pushing vendors to demonstrate software platform credibility alongside basic equipment specifications during procurement evaluation. This generational shift favors vendors who can speak credibly to both software capability and traditional telecom engineering requirements simultaneously across the full range of buyer types.
gigabit-passive-optical-network-market-end-use-penetration-index-1789988035666

Priorities for GPON Equipment Vendors

These are among the four positions where our research anticipates prominent divergence between winners and laggards over the coming forecast period. Each is grounded in the demand model, the regulatory perimeter, and the announced capacity pipeline.
01 / COMBO EQUIPMENT DEVELOPMENT PRIORITY

Build Combo GPON and XGS-PON Products Now

Developed-market operators increasingly specify combo-capable equipment as the default for new purchases, treating single-standard GPON-only terminals as a declining legacy category vendors cannot rely on for future revenue growth across their remaining product portfolio and full customer relationships. Vendors who build genuine combo capability now capture the highest-margin developed-market upgrade contracts, while those still selling single-standard equipment exclusively lose tenders entirely to better-prepared competitors offering broader capability. Waiting risks permanent exclusion from the fastest-growing, highest-margin segment of the overall market.
02 / EMERGING-MARKET COST OPTIMIZATION

Design Lower-Cost Equipment for Subsidy-Funded Deployment

Government fiber subsidy programs across India, Indonesia, and parts of Africa reward vendors who can deliver ruggedized, cost-optimized equipment suited to harsher rural deployment conditions and thinner local support infrastructure than developed-market norms typically require of comparable equipment sold elsewhere. Vendors who design specifically for these conditions, rather than adapting developed-market products with minor modifications, win a disproportionate share of subsidy-funded tenders against competitors offering unmodified equipment. This volume opportunity will only grow as more governments expand rural broadband funding.
03 / BUNDLED SOFTWARE PLATFORM STRATEGY

Bundle Network Management Software Rather Than License Separately

Operators managing mixed GPON and XGS-PON networks increasingly value centralized management software as much as the underlying hardware itself, and vendors bundling sophisticated software directly with equipment sales command meaningful pricing premiums over hardware-only competitors across most competitive tenders held worldwide each year. This bundled approach also improves customer retention considerably, since switching vendors becomes far more disruptive once management software is deeply integrated into daily network operations. Vendors without competitive software risk losing tenders entirely regardless of hardware quality offered.
04 / COMPONENT SUPPLY CHAIN SECURITY

Lock in Long-Term Optical Component Supply Agreements

Optical component price volatility during 2021 and 2022 squeezed margins hardest for vendors dependent on spot market purchasing rather than locked-in long-term supply relationships with established transceiver and laser diode manufacturers across the supply chain. Vendors who secure multi-year agreements trade some short-term pricing flexibility for meaningful protection against future volatility, a trade generally worth making given how frequently component supply disruptions have recurred across the industry. Vendors still purchasing entirely on the spot market face real earnings risk going forward.

Engagement Snapshot From the Field

A live engagement with an industry participant carrying material or product regulatory and market exposure ahead of a defining policy shift, showing how our research translates into a defensible multi-year portfolio strategy.
MARKET MINDS ADVISORY · CLIENT ENGAGEMENT SUMMARY
Gigabit Passive Optical Network (GPON) Producer Strategic Portfolio Review and Transition Roadmap 2026·Investment Scenario on Gigabit Passive Optical Network (GPON) Exposure Evaluation 2025-26
CLIENT PROFILE
The client is a regional broadband operator serving roughly 1.2 million homes across a very broad mix of urban and semi-rural territory, planning a multi-year fiber-to-the-home expansion funded partly through a national broadband subsidy program requiring vendor selection within a compressed procurement timeline set by the government funding agency overseeing the entire national subsidy program.
STRATEGIC CHALLENGE
The operator needed to select an equipment vendor balancing near-term GPON deployment cost against the longer-term possibility of an XGS-PON upgrade path, without knowing precisely how quickly its subscriber base would demand bandwidth beyond what GPON could reasonably provide within the network's expected operating lifespan of roughly a full decade.
MMA APPROACH
MMA evaluated five equipment vendors against a consistent framework covering upfront cost, combo GPON and XGS-PON upgrade capability, network management software sophistication, and long-term component supply chain stability, modeling total cost of ownership across a full ten-year operating horizon under multiple different subscriber bandwidth demand growth scenarios considered very carefully.
KEY FINDINGS
  1. Combo-capable equipment cost 22 percent more upfront than GPON-only alternatives but eliminated the need for a costly full network replacement in later years.
  2. Total cost of ownership over ten years favored combo equipment in every bandwidth demand scenario modeled, including the most conservative growth assumption.
  3. Bundled network management software reduced projected field technician dispatch volume meaningfully by simplifying remote fault diagnosis across the entire network footprint considerably.
  4. The selected vendor's long-term component supply agreements reduced projected deployment delay risk relative to vendors sourcing components entirely on the spot market.
CLIENT PROFILE
The client is a regional broadband operator serving roughly 1.2 million homes across a very broad mix of urban and semi-rural territory, planning a multi-year fiber-to-the-home expansion funded partly through a national broadband subsidy program requiring vendor selection within a compressed procurement timeline set by the government funding agency overseeing the entire national subsidy program.
STRATEGIC CHALLENGE
The operator needed to select an equipment vendor balancing near-term GPON deployment cost against the longer-term possibility of an XGS-PON upgrade path, without knowing precisely how quickly its subscriber base would demand bandwidth beyond what GPON could reasonably provide within the network's expected operating lifespan of roughly a full decade.
MMA APPROACH
MMA evaluated five equipment vendors against a consistent framework covering upfront cost, combo GPON and XGS-PON upgrade capability, network management software sophistication, and long-term component supply chain stability, modeling total cost of ownership across a full ten-year operating horizon under multiple different subscriber bandwidth demand growth scenarios considered very carefully.
KEY FINDINGS
  1. Combo-capable equipment cost 22 percent more upfront than GPON-only alternatives but eliminated the need for a costly full network replacement in later years.
  2. Total cost of ownership over ten years favored combo equipment in every bandwidth demand scenario modeled, including the most conservative growth assumption.
  3. Bundled network management software reduced projected field technician dispatch volume meaningfully by simplifying remote fault diagnosis across the entire network footprint considerably.
  4. The selected vendor's long-term component supply agreements reduced projected deployment delay risk relative to vendors sourcing components entirely on the spot market.
RECOMMENDED STRATEGY
Phase 1: Phase one: select a combo-capable equipment vendor with proven long-term component supply agreements and competitive total cost of ownership over time. Phase 2: Phase two: deploy GPON equipment across the initial subsidy-funded territory while retaining the combo upgrade path for future bandwidth needs. Phase 3: Phase three: monitor subscriber bandwidth demand closely and selectively activate XGS-PON capability on high-usage segments as genuine demand materializes over time.
OUTCOME
The operator completed its subsidy-funded deployment on schedule using combo-capable equipment, preserving the option to activate XGS-PON on high-usage segments without a future network replacement (client-reported, unverified by MMA). The operator has since expanded its relationship with the selected vendor to a second funding phase.

Frequently Asked Questions

Foundational context covering the market sizes, CAGR, scope, country, region and competition that inform every finding below. This section is provided to cover basics and most often pre-purchase conversations, answered from the MMA Primary Research Dataset.

What is the current size of the GPON Market?

The GPON Market was valued at $8.5 billion in 2025. This figure covers optical line terminal and network terminal equipment, splitters, and network management software for gigabit fiber broadband access.

How large will the GPON Market be by 2036?

MMA projects the market will reach $20.85 billion by 2036, up from $9.22 billion in 2026. This represents a 2.26-times expansion over the forecast decade.

What is the CAGR for the GPON Market 2026 to 2036?

The market is projected to grow at an 8.5% compound annual growth rate between 2026 and 2036. This compares to a historical CAGR of roughly 7.5% between 2020 and 2025.

Which segment is growing fastest?

XGS-PON-compatible optical line terminals lead all segments at a 13.5% CAGR, roughly 1.59 times the overall market rate. Network management and orchestration software follows at 11.0%.

Who are the major companies in the GPON Market?

Huawei, Nokia, ZTE, Calix, and Adtran lead by optical line terminal shipment volume. Fiberhome Technologies and Sumitomo Electric hold strong positions in specific regional markets.

Which country is growing fastest?

India is the fastest-growing major market at a 15.0% CAGR, driven by national broadband subsidy funding accelerating rural fiber rollout. This pace outstrips nearly every other large market.

Report Segmentation Architecture

The full report scope spans multiple orthogonal segmentation dimensions, with cross-tabulated demand data provided for each dimension pair. Coverage extends further to regional breakdowns, trend trajectories, and the competitive detail needed to support segment-level decision-making.

By Primary Market Dimension

  • Optical Line Terminals (OLT)
  • Optical Network Terminals and ONUs
  • Passive Splitters and Distribution Components
  • XGS-PON-Compatible Optical Line Terminals
  • Network Management and Orchestration Software

By End-Use Industry

  • Residential Broadband Operators
  • Enterprise and Business Fiber Services
  • Government and Public Sector Networks
  • Rural and Underserved Area Deployment

By Commercial Dimension

  • Direct Equipment Sales
  • Bundled Hardware and Software Contracts
  • Managed Deployment Services

By Region

  • North America
  • Western Europe
  • East Asia
  • South Asia and Pacific
  • Latin America
  • Middle East and Africa
  • Eastern Europe

Scope, Methodology, and Coverage

Every figure in this report is reproducible from documented input assumptions. The scope below maps the historical period, the forecast horizon, the segmentation dimensions, and the countries covered, alongside the underlying primary and qualitative methodology.
Historical Period
2020 to 2025
Forecast Period
2026 to 2036
Base Year
2025 (USD billions; MMA Primary Research Dataset, September 2026)
Market Definition
The GPON Market covers optical line terminal and optical network terminal equipment, splitters, and associated network management software used to deliver gigabit-capable passive optical fiber broadband access. It excludes long-haul and metro optical transport equipment, active Ethernet fiber access alternatives, and customer premises Wi-Fi equipment unrelated to the optical access layer itself.
Quantitative Units
USD Billion, Optical Line Terminal Port Cost, CAGR %
Segmentation Dimensions
Equipment Category, End-Use Industry, Commercial Dimension, Region
Regions Covered
North America, Western Europe, East Asia, South Asia and Pacific, Latin America, Middle East and Africa, Eastern Europe
Countries Covered
United States, Canada, Germany, France, United Kingdom, China, Japan, South Korea, India, Indonesia, Vietnam, Brazil, Mexico, United Arab Emirates, South Africa
Key Companies Profiled
Huawei, Nokia, ZTE, Calix, Adtran, Ciena, Sagemcom, Sumitomo Electric, Fiberhome Technologies, Dasan Zhone Solutions, UTStarcom, Vecima Networks, Ubiquoss, Telco Systems, Skyworth Digital, Ericsson, Tibit Communications, Sterlite Technologies, C-DOT, HFCL Limited
Quantitative Methodology
Primary survey, n=3,800 respondents, Q4 2025, six countries; demand-side model with trade association cross-validation
Qualitative Methodology
47 expert interviews, Q4 2025; applied to validate demand model assumptions, identify emerging dynamics, and assess competitive positioning
Report Format
PDF and XLSX data workbook (Word format preview document)
Publisher
Market Minds Advisory
Report Code
MMA-2026-TEC-196
Published
September 2026
Contact
sales@marketmindsadvisory.com | www.marketmindsadvisory.com

Purchase the full Gigabit Passive Optical Network (GPON) Market Report (2026 to 2036).

This report examines the GPON Market across five equipment categories and seven demand regions. It analyzes the competitive dynamics reshaping how vendors price and deliver fiber access equipment during the ongoing XGS-PON technology transition. The analysis quantifies market size, growth, and segment-level trends through 2036, drawing on primary survey data covering three thousand eight hundred respondents and forty-seven expert interviews conducted in the fourth quarter of 2025. It also covers input cost pressure and revenue strategies available to vendors navigating a maturing, increasingly price-competitive category.
Ten-Year Market Sizing and Forecast Model
Five-Segment MECE Equipment Category Classification Taxonomy
Seven-Region Demand Breakdown and Growth Analysis
Competitive Benchmarking of Twenty Named Vendors
Revenue Lever and Margin Economics Analysis
Anonymized Client Engagement Case Study Review

Built For The People Who Decide

From boardroom strategy to bench-side execution, this report is read cover-to-cover by leaders shaping the next decade of their industry, turning demand scenarios, market dynamics and valuation benchmarks into decisions.
CXOs/ Presidents/ VPs/ Managers
M&A and Corporate Development
Strategy Teams and R&D Heads
Procurement and Product Directors
Regulatory and Compliance Leaders
Investor Relations and Equity Analysts