Market Minds Advisory
Geomembranes Market

Geomembranes Market: Seam Failure Economics, Leak Detection Reality, and Tailings Governance After Two Disasters

Electrical leak surveys find damage on 96% of the installations they examine. The sheet almost never fails. The seam and the installation crew are where every containment failure actually originates.

Lead Analyst

Bilal Shaikh

Published

September 2026

Make Smarter Decisions with Customized Research Insights

Request a free sample report and evaluate market opportunities, growth trends, and competitive dynamics relevant to your business needs.

2025 MARKET VALUE$3.6BMarket Size 2025
2036 FORECAST VALUE$7.0BBase Case , 2026 to 2036
CAGR 2026 TO 20366.2 %Bull 7.4% / Bear 5.0%
INCREMENTAL OPPORTUNITY$3.2BNet 10- year value creation
EXPANSION MULTIPLE1.82x2036 value over 2026 base
Strategic Levers
M&A Pipeline
Regional Outlook
Country Rankings
Competitive Intelligence
Segmental Deep-dive
Call-Us : 91 93563 13602

Executive Snapshot and Market Trajectory

Geomembranes almost never fail as materials. They fail at seams, at penetrations, and where somebody drove a loader across an unprotected liner, and electrical leak surveys locate damage on 96% of the installations they examine. The material is rarely the problem here, and the specification rarely says so.
Commercial advantage belongs to suppliers who control installation quality rather than those competing on sheet properties, because 44% of installed cost and effectively all of the failure risk sits with the welding crew. Bituminous and specialty composite geomembranes grow fastest at 8.8%, roughly 1.42 times the market. East Asia holds the largest position at 29% of value on landfill, mining, and water infrastructure together.
Concentration sits at roughly 38% for the top five, held by installation networks and project engineering rather than by extrusion capacity anybody could buy. Mining takes 31% of volume and pays best, particularly since tailings governance tightened globally. Resin at 62% of material cost governs pricing far more than any producer does. Project prices fixed at tender months before manufacture leave producers carrying that exposure with nothing at all to recover it against.
Market Definition
The market comprises polymeric and composite geomembrane liners supplied for containment applications, covering HDPE, LLDPE, PVC, EPDM and elastomeric, reinforced polypropylene, and bituminous or specialty composite geomembranes. Value is measured at manufacturer level including material supplied to installation contracts. Geotextiles, geosynthetic clay liners, geogrids and geocomposite drainage products, installation labour contracted separately, leak detection survey services, and civil earthworks fall outside scope.
Base Year Value
$3.6B in 2025 (MMA Primary Research Dataset, August 2026)
Forecast Period
2026 to 2036, eleven discrete annual values
CAGR
6.2% base case. Bull 7.4%. Bear 5.0%.
Fastest Growth Segment
Bituminous and Specialty Composite Geomembranes: 8.8% CAGR
Fastest Growth Country
Chile: 9.6% CAGR
Fastest Growth Region
South Asia and Pacific: 8.4% CAGR
Largest Region
East Asia: 29% of 2025 global value
Market Leaders
Solmax, Agru, NAUE, Atarfil, and Officine Maccaferri lead on geomembrane supply revenue. Source: company annual reports and MMA Analysis, July 2026.
Primary Survey
n=3,800 procurement and R&D decision-makers, Q4 2025, six countries
Methodology
Demand-side build-up, cross-validated against public data, 47 expert interviews

Geomembranes Market Forecast Scenarios

geomembranes-market-trends-size-forecast-scenario-1787551524157
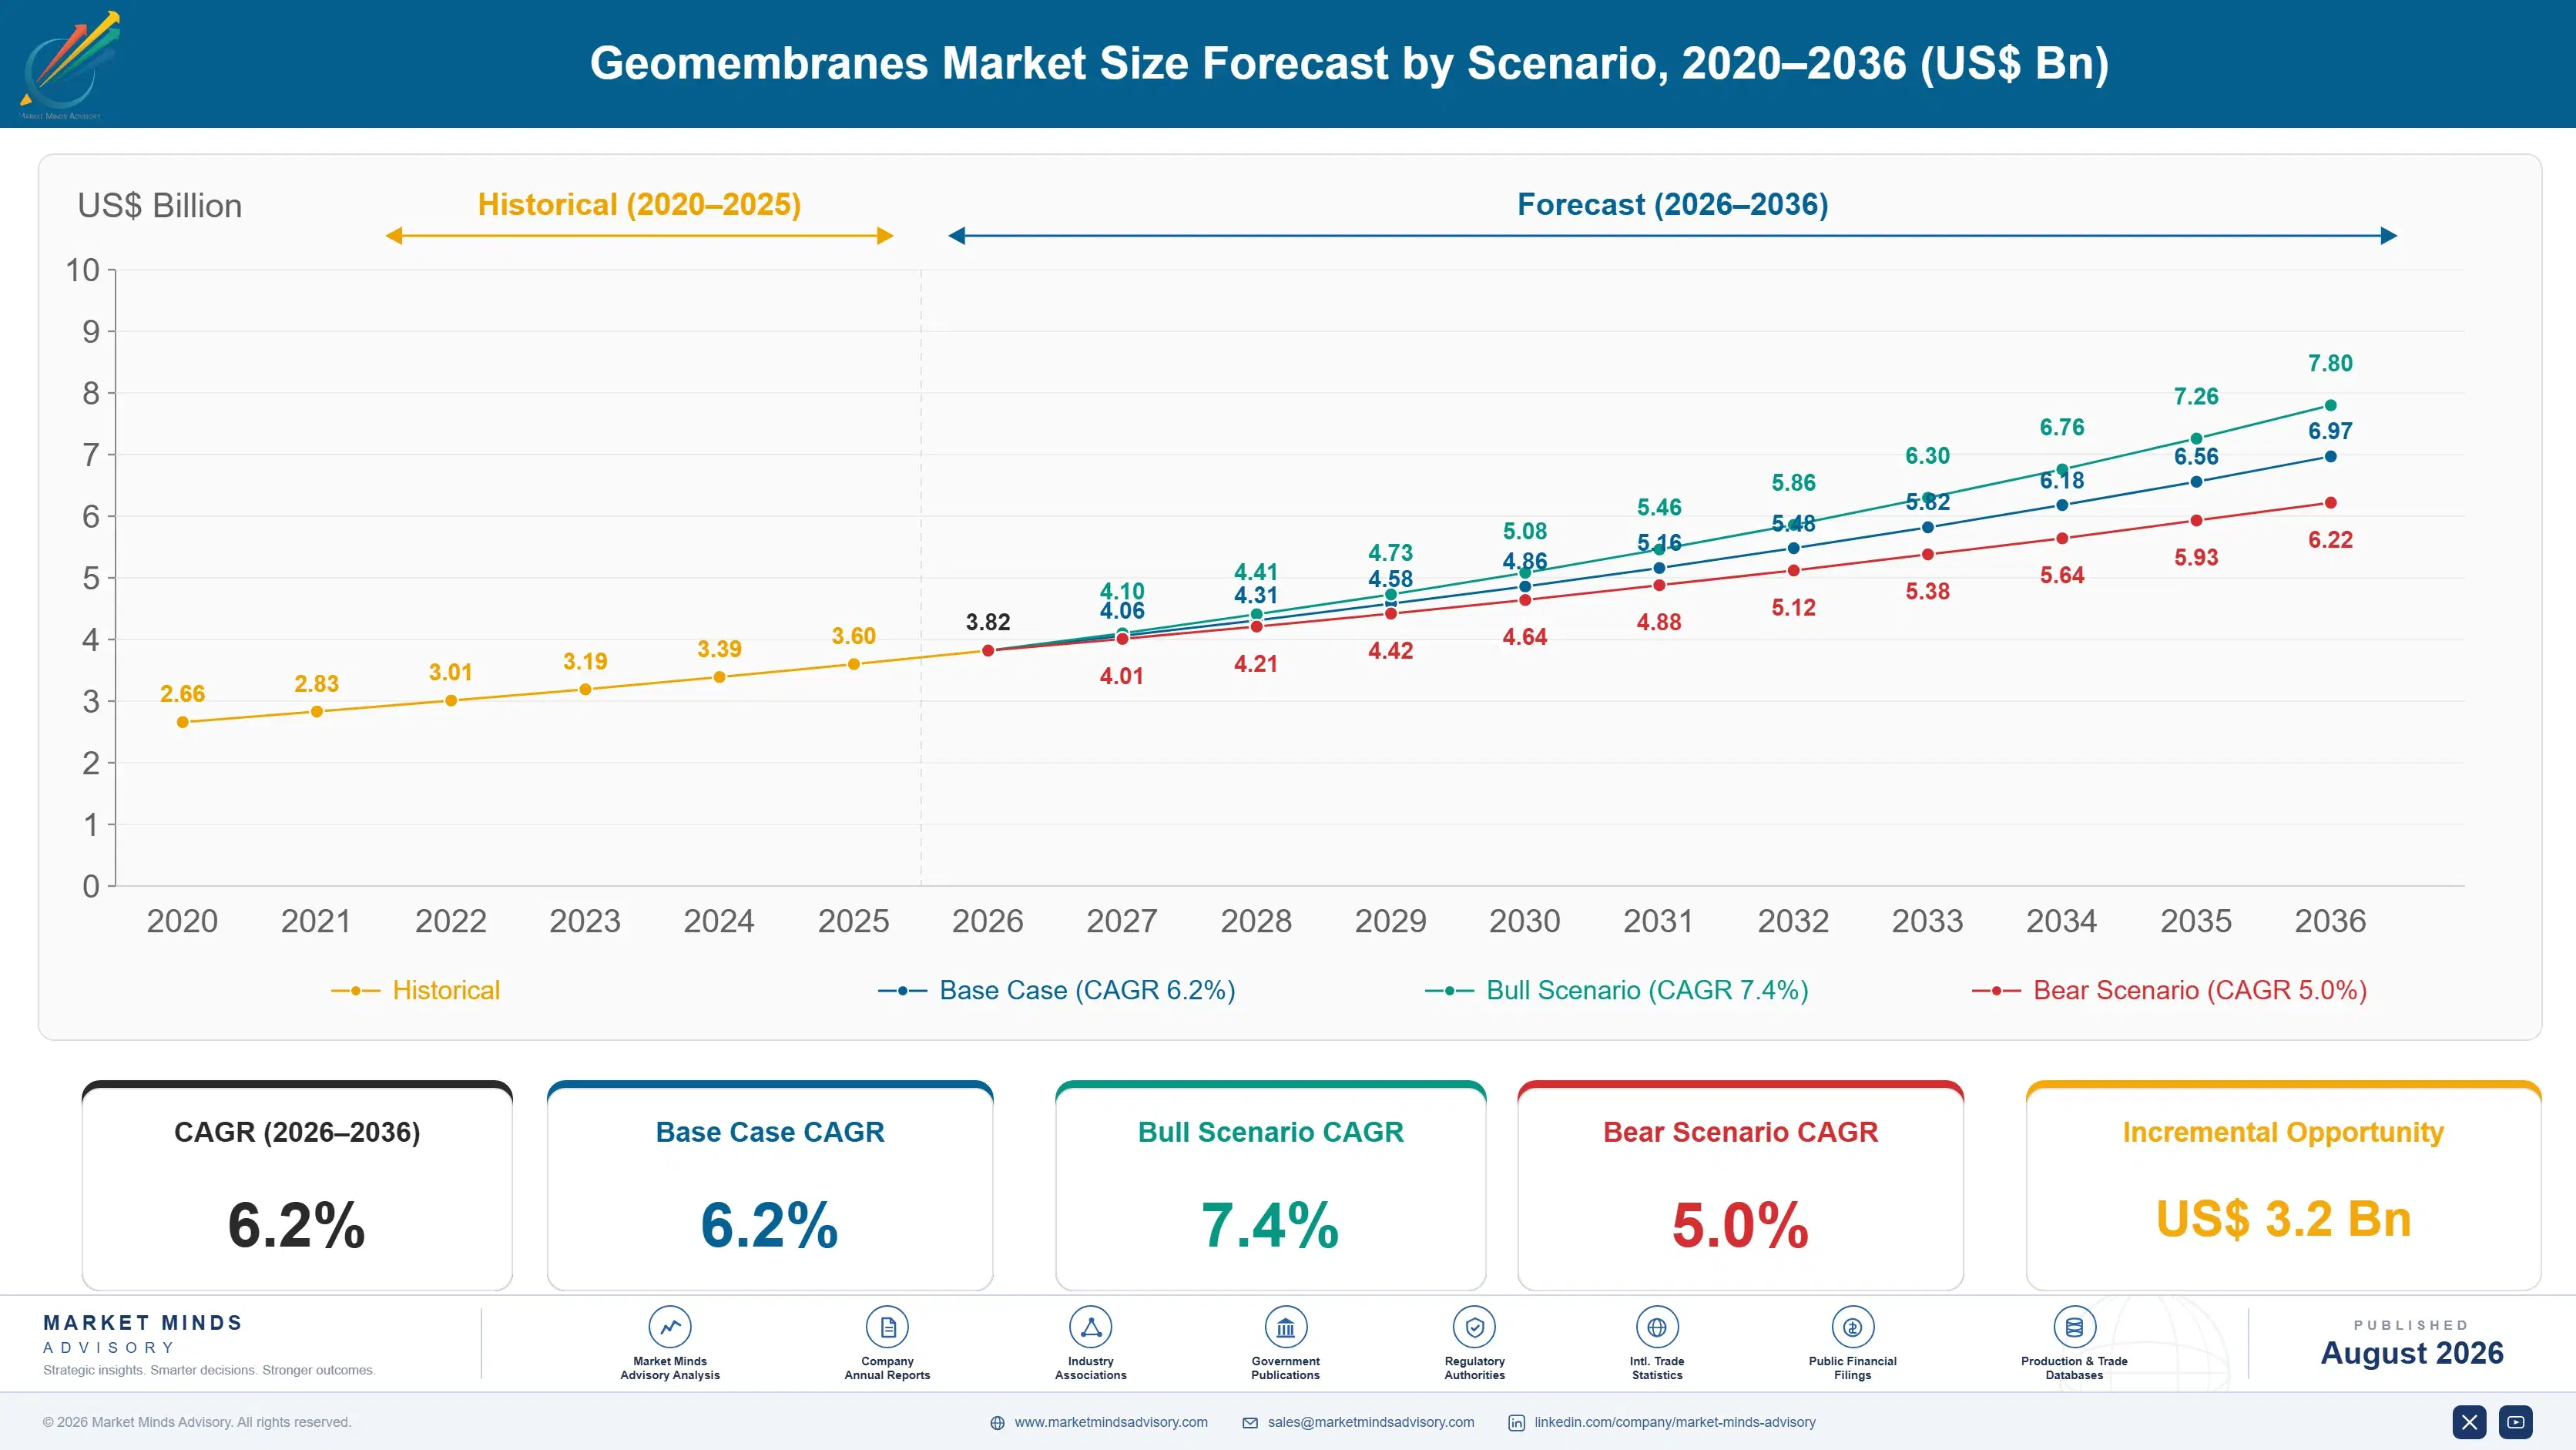
Between 2020 and 2025 the mining application was reshaped by governance rather than by demand. Tailings dam failures had already forced a global standard on storage facility management, and operators responded by upgrading containment design across existing and planned facilities. Landfill demand grew steadily in Asia while remaining flat across mature markets. The 4.9% historical rate combines a mining upgrade cycle with volume applications moving at different speeds.
The 6.2% base case rests on three mechanisms. Tailings governance keeps driving containment upgrades across an installed base of storage facilities that will take a decade to work through properly. Water conservation projects in India, China, and the Gulf continue lining canals and reservoirs to reduce seepage losses. And landfill construction across Asia keeps expanding as waste management formalises in cities that previously had none. None of the three depends on commodity prices doing anything in particular.
The 7.4% bull case assumes mining capital investment accelerates on critical mineral demand while water infrastructure funding holds. The 5.0% bear case reflects mining capital deferral under commodity price weakness, resin cost increases squeezing a market where polymer is 62% of material cost, and landfill volumes plateauing in Asia sooner than waste projections currently assume.

The Seam Is the Product

The failure mode here is what everything else follows from. A geomembrane is expected to last around 48 years and the sheet itself generally will, but seams welded on a windy site by a crew paid by the metre are a different proposition entirely. Electrical leak location surveys find damage on 96% of installations examined. Almost none of it is material defect.
TOP-FIVE CONCENTRATION38%Combined share of geomembrane supply held by leading producers
INSTALLATION COST SHARE44%Portion of installed cost attributable to deployment and welding
LEAK DETECTION FIND RATE96%Share of surveyed installations where damage is actually located
MINING APPLICATION SHARE31%Portion of volume entering heap leach and tailings containment
RESIN COST SHARE62%Portion of material cost accounted for by polymer
DESIGN SERVICE LIFE48 yearsTypical specified durability for a high-consequence containment installation
That reality should put installation at the centre of every buying decision and frequently does not. Deployment and welding represent 44% of installed cost and effectively all of the risk, yet specifications routinely detail resin properties at length and treat installer certification as a box to tick. Owners who have suffered a containment failure never make that mistake twice.
Mining pays best and demands most. Heap leach pads and tailings storage facilities carry consequences that landfill and water applications do not, and the global tailings standard adopted after two catastrophic dam failures has pushed containment design and monitoring requirements upward across the industry. Mining takes 31% of volume and a considerably larger share of the value that suppliers actually realise. That gap is where the money in this market sits.
"Every specification I read spends four pages on stress crack resistance and one paragraph on the welding crew. Then the leak survey comes back with eleven holes, all of them from installation, and everybody looks at the resin certificate as though it might explain something."
Practice Director, Geosynthetics and Environmental Containment · MMA Geosynthetics and Containment Materials Practice · August 2026

Market Trends

Leak Detection Surveys Reframe the Quality Conversation

Electrical leak location surveys pass current through a liner to find breaches, and they locate damage on 96% of installations examined, almost all of it caused during deployment rather than by any material defect. High-consequence projects increasingly specify the survey as standard rather than as an optional check. That evidence has moved the argument from sheet properties toward installation control, which suits suppliers holding certified installer networks and disadvantages those selling material into whoever wins the labour contract. Owners who have seen one survey result rarely accept an installation without another afterwards.
Market Impact: Water projects add 19% of demand
Tailings Governance Drives a Decade-Long Upgrade Cycle

Catastrophic dam failures produced a global standard on tailings storage facility management that operators are now applying across existing and planned facilities alike. Containment design, monitoring, and closure requirements all moved upward together. Mining already takes 31% of volume and pays the best realised prices in this market. The upgrade programme runs across an installed base that will take a decade to work through, which makes it unusually visible demand for anybody willing to track facility-level compliance schedules. Facility-level assessment schedules are published, which makes this the most trackable demand pipeline in the market.
Market Impact: East Asia holds 29% of value

Market Opportunities and Growth Drivers

Water Conservation Projects Line Canals and Reservoirs

Seepage losses from unlined irrigation canals and storage reservoirs run at levels that make lining economic wherever water has genuine scarcity value, and Indian, Chinese, and Gulf programmes have funded that work at considerable scale. The application favours lower-cost polymers and rewards installation speed over exotic material properties. Project sizes are large and specification standards vary enormously between funding authorities. Growth here is policy-driven rather than commercial, which makes it predictable in direction and difficult to time. Publicly funded specification standards vary enormously, which makes installation quality the least controlled part of the whole application.
Market Impact: Installation is 44% of cost

Asian Landfill Construction Formalises Waste Management

Cities across China, India, and Southeast Asia are replacing uncontrolled dumping with engineered landfill, and every engineered cell requires a lined base and eventually a capping system as well. That converts waste volumes that previously consumed no containment material at all into steady demand. East Asia holds 29% of value largely on this and mining together. Specification standards are rising as environmental enforcement strengthens, though installation quality control lags the material specifications considerably in most markets. Capping systems follow base lining by a decade or two, which builds a second demand wave into every cell constructed today.
Market Impact: Resin is 62% of material cost

Market Restraints and Challenges

Installation Contracting Separates Material From Risk

Owners frequently procure liner material and installation labour separately, which leaves the material supplier carrying reputational exposure for seams welded by a contractor it did not select and cannot supervise. The root cause is a procurement convention that treats the liner as a commodity input. Suppliers mitigate by refusing to warrant material installed by uncertified crews, by offering supply-and-install packages that consolidate the responsibility, and by funding installer certification programmes that raise the floor across the whole industry. Owners who have experienced a seam dispute abandon separated procurement and rarely go back to it.
Market Impact: Surveys find damage on 96% examined

Resin Pricing Governs Margin More Than Producers Do

Polyethylene resin represents 62% of material cost and moves on petrochemical cycles no geomembrane producer influences at all, while project pricing is frequently fixed at tender many months before delivery. The root cause is a long gap between bid and manufacture on capital projects. Producers mitigate through resin price escalation clauses in tender documents, through hedging where liquid contracts exist, and by weighting the portfolio toward specialty composites where resin is a smaller share of the total. Hedging works only where liquid polymer contracts exist, which is not the case in every producing region.
Market Impact: Mining takes 31% of total volume
3 additional market trends, 4 additional growth drivers, and 2 additional restraints and challenges are covered in the full report. Contact sales@marketmindsadvisory.com to access the complete intelligence.

Segment CAGR and Growth Architecture

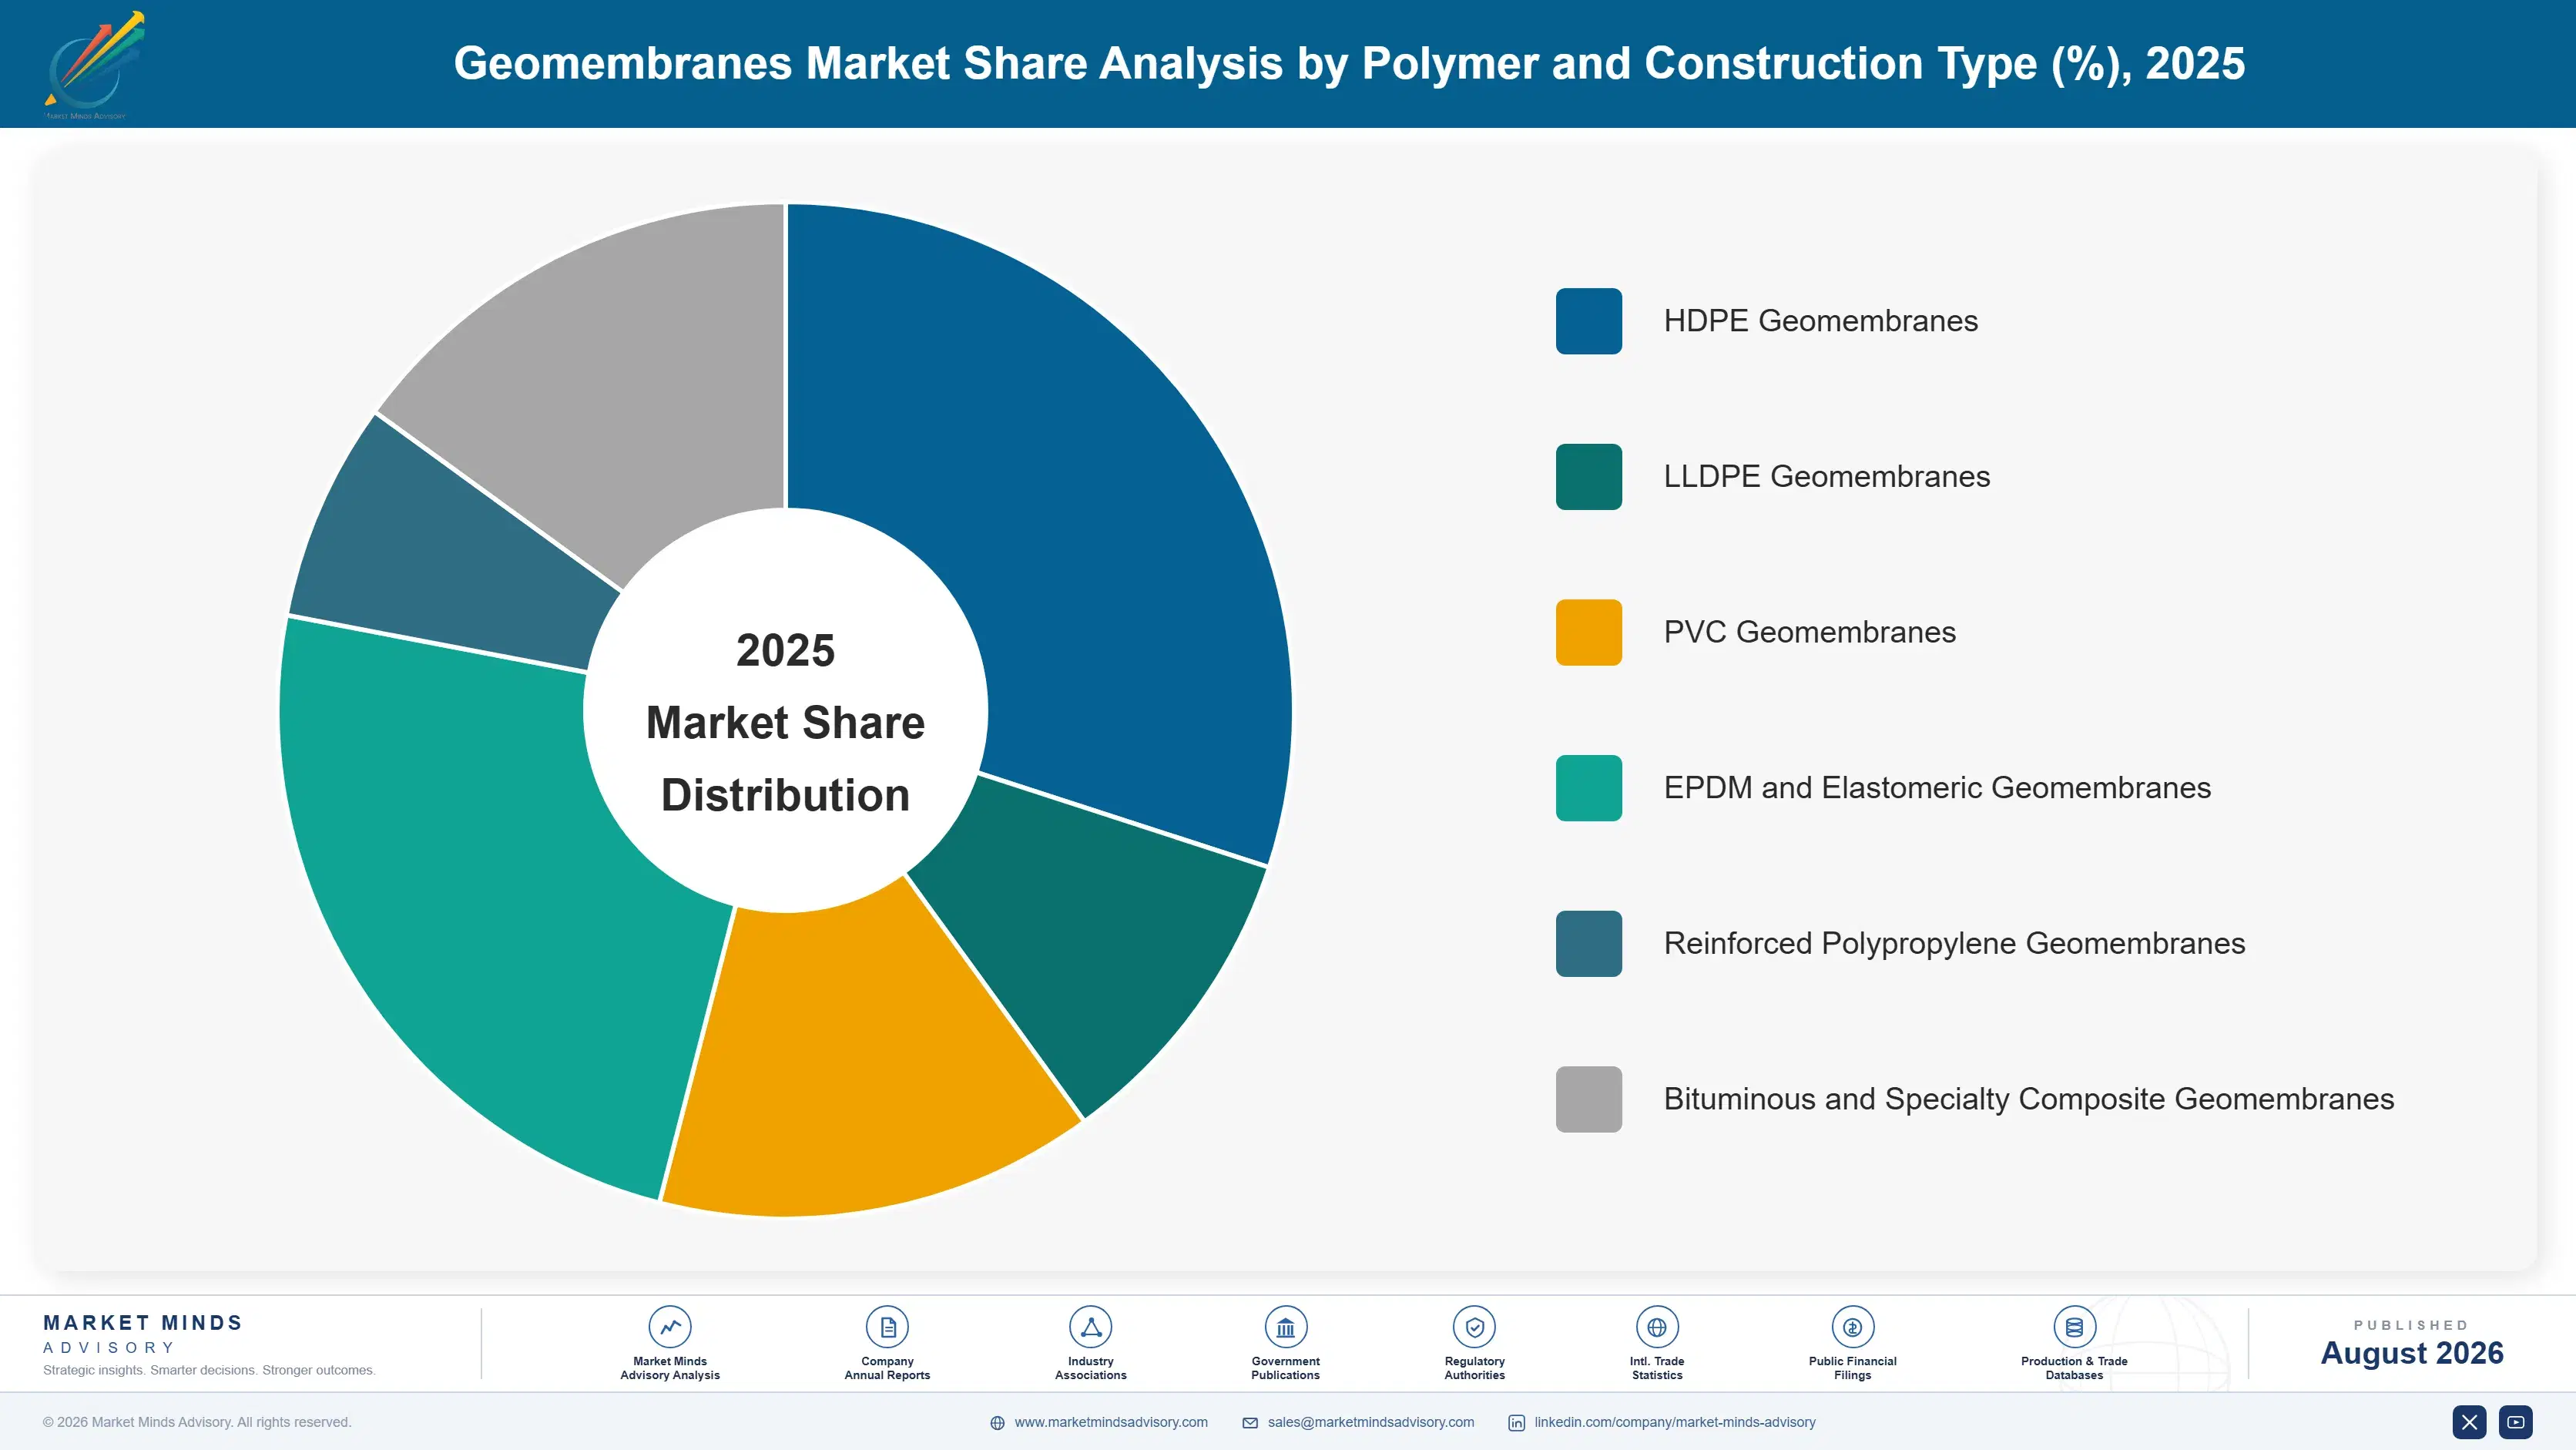
Segmentation follows polymer and product construction, because chemical resistance, flexibility, welding method, and installed cost all differ enough to determine which applications a material can serve. Six types cover commercial supply, and the divide between commodity polyethylene sheet competing on resin cost and engineered composites competing on performance matters more than any single property comparison.
geomembranes-market-trends-market-share-analysis-1787551524691

Bituminous and Specialty Composite Geomembranes

The fastest type at 8.8%, roughly 1.42 times the market, using a bitumen-impregnated geotextile core rather than a polymer sheet. The construction tolerates rough subgrade far better than polyethylene, resists puncture during placement, and can be installed at temperatures where welding thermoplastic becomes difficult. Mining, hydraulic works, and tunnel applications drive most demand, and installation uses torching rather than extrusion welding. Material cost per square metre runs well above polyethylene while total installed cost frequently does not, once subgrade preparation and damage rates are properly counted. Torching rather than extrusion welding also changes which contractors can install it, which narrows the qualified crew pool and raises the value of supplier-controlled installation considerably.
CAGR 8.8%

Reinforced Polypropylene Geomembranes

Second fastest at 7.4%, using a scrim reinforcement between polypropylene layers to deliver dimensional stability and puncture resistance that unreinforced sheet cannot match. Floating covers, potable water reservoirs, and exposed applications where wind uplift and thermal movement matter are the natural fit. Panels can be factory-fabricated into large sections, which cuts field seaming considerably and therefore cuts the failure risk that field welding introduces. Higher material cost is offset by faster deployment and fewer field seams, which is the argument that actually wins these specifications. Panel size is limited by what can be transported and handled on site rather than by anything in the fabrication process, which shapes how the advantage is realised in practice.
CAGR 7.4%
Full segment breakdown across 6 segments available in the complete report.

Regional Architecture and Country Demand Map

Regional shares follow mining investment, landfill construction, and water infrastructure spending rather than economic size. All seven regions sit inside the standard bands, with East Asia leading on the combination of all three rather than dominance in any one. Application mix rather than population predicts value here.

North America

Landfill regulation established the modern geomembrane specification here decades ago, and the installed base now generates steady replacement and capping demand alongside new cell construction. Mining containment for copper, gold, and increasingly lithium operations carries the highest realised pricing. Installer certification programmes are the most developed anywhere, and electrical leak location surveys are close to routine on high-consequence projects. Solmax holds a strong regional manufacturing and installation position. Growth of 6.0% reflects mining investment and landfill capping more than any expansion in new landfill construction. Owners consolidating material and installation into single contracts have advanced further here than anywhere, driven largely by the commercial disputes that separated procurement produced repeatedly.
Share: 24% | CAGR: 6.0% (2026 to 2036)

Western Europe

Landfill diversion policy has reduced new cell construction substantially, since material sent to energy recovery and recycling never reaches a lined facility at all. What remains is capping of closed sites, water infrastructure, and containment for industrial and contaminated land applications. Specification and installation standards are the most demanding anywhere, with third-party quality assurance routinely mandated. Agru, NAUE, Atarfil, and Maccaferri hold established engineering positions. Growth of 4.6% is the slowest anywhere, constrained by a waste policy that deliberately reduces the largest historical application. Consulting engineers hold unusual influence over specification here, writing containment requirements during facility design years before any tender, which rewards suppliers engaged at that stage rather than at bidding.
Share: 18% | CAGR: 4.6% (2026 to 2036)
Regional intelligence for 5 additional markets available in the complete report: East Asia, South Asia and Pacific, Latin America, Middle East and Africa, Eastern Europe. Contact sales@marketmindsadvisory.com.
geomembranes-market-trends-country-cagr-analysis-1787551525205

Four Moves Worth Real Capital

Advantage here comes from owning installation quality, following governance-driven upgrade cycles, and escaping resin cost exposure where product construction allows it. Four moves justify capital across the forecast period, and the first addresses where every containment failure in this industry actually begins. Extrusion capacity does not appear among the four of them in any form.

Consolidate supply and installation into one responsibility

Deployment and welding represent 44% of installed cost and effectively all of the failure risk, yet owners routinely procure material and labour separately and leave the supplier carrying reputational exposure for seams it never supervised. Supply-and-install packages consolidate that responsibility and command pricing separated procurement never will. Refusing to warrant material installed by uncertified crews is uncomfortable commercially and it is also the only position that survives a leak survey finding eleven holes. Owners who have already experienced a seam dispute abandon separated procurement permanently, which makes each failure somebody else suffers a commercial opportunity for whoever offers consolidation.
Market Impact: Controls the 44% of cost carrying all risk

Track tailings compliance schedules facility by facility

The global tailings standard applies to individual storage facilities on assessment timetables that operators publish, which makes this the most visible demand pipeline in the market for anybody prepared to track it. Mining already takes 31% of volume at the best realised prices available anywhere here. The upgrade programme runs across an installed base needing a decade to work through. Suppliers responding to tenders rather than tracking compliance schedules arrive after the specification has been written. Consulting engineers write containment requirements years before construction, so the useful conversation happens well upstream of any procurement department.
Market Impact: Serves the 31% of volume at best prices

Sell factory-fabricated panels to cut field seams

Field welding is where installations fail, and factory fabrication of large panels removes a substantial proportion of field seams before anybody reaches the site. Reinforced polypropylene grows at 7.4% partly on exactly this argument. Higher material cost is offset by faster deployment and materially lower failure risk, which is the comparison an owner cares about rather than cost per square metre. Suppliers quoting sheet price into that conversation are answering the wrong question entirely. Panel size is limited by transport and site handling rather than by fabrication, which is where the practical design work actually sits.
Market Impact: Reduces exposure to a 96% installation damage rate

Escape resin exposure through composite construction

Polyethylene resin represents 62% of material cost and moves on petrochemical cycles no producer influences, against project prices fixed at tender months before delivery. Bituminous and specialty composites carry a fundamentally different cost structure and grow at 8.8%, the fastest here. They also tolerate rough subgrade and install in conditions where thermoplastic welding becomes unreliable. Portfolio weight toward composites addresses margin volatility and application growth through the same investment. Torching rather than extrusion welding narrows the qualified installer pool as well, which raises the value of supplier-controlled installation on exactly the projects that pay best.
Market Impact: Reduces exposure to resin at 62% of cost

Who Controls the Margin Pool

Concentration sits at roughly 38% for the top five on geomembrane supply revenue, held by installation networks, project engineering, and specification presence rather than by extrusion capacity that any converter could purchase. Solmax holds the broadest international manufacturing and installation position. Agru and NAUE bring German engineering depth across demanding applications, Atarfil is strong in water and mining, and Maccaferri spans the wider geosynthetics range. Nobody buys a liner on extrusion quality.
Competition runs on three dimensions. Installation network control is the first and it determines who carries the failure risk credibly. Project engineering and specification presence is the second, since a liner is designed into a facility long before anybody tenders. Regional manufacturing is the third, because freight on bulky rolls limits how far any plant can economically reach. None of the three is a manufacturing capability at all.

Pressure is building from two directions. Domestic Chinese and Indian producers supply commodity polyethylene sheet at prices international manufacturers cannot match. Owners increasingly specify leak location surveys that expose installation quality directly. Rankings will shift toward suppliers holding certified installation capability rather than toward whoever extrudes most cheaply. Extrusion cost decides only the tonnage nobody differentiates.
geomembranes-market-trends-company-positioning-matrix-1787551525722

Competitive Moat and Risk Dimensions

SOLMAX

Moat: Manufacturing and installation network breadth

Solmax combines geomembrane manufacturing with installation capability across multiple continents, which lets it take responsibility for the seams rather than supplying material into whoever wins a separate labour contract. That consolidation is what an owner facing a leak survey actually wants. Regional plant coverage also solves the freight economics that limit how far any single manufacturing site can serve.
SOLMAX

Risk: Commodity sheet price pressure

Domestic producers in China and India supply commodity polyethylene liner at prices no international manufacturer matches, and a substantial share of landfill and water application volume is bought on exactly that basis. Installation capability defends the high-consequence work and not the tonnage underneath it. Ceding that volume improves mix while worsening plant utilisation across a capital-intensive extrusion base.
AGRU

Moat: Engineering depth in demanding applications

Agru holds specification presence in applications where containment failure carries severe consequences, built on material engineering and technical support that owners and consulting engineers rely on during design rather than at tender. That relationship shapes the specification before anybody bids on it. Depth across conductive liners and specialised welding systems reaches work that commodity suppliers cannot credibly quote against.
AGRU

Risk: Limited installation network reach

Engineering strength does not extend to controlling the crews who weld the seams, which is where 44% of installed cost and essentially all of the failure risk actually sits. Owners consolidating responsibility into supply-and-install contracts favour suppliers who can take both. Building installation capability across many regions is expensive and sits well outside a materials engineering operating model.

Players Tracked

Prominent Players

Solmax
Agru
NAUE
Atarfil
Officine Maccaferri

Other Key Players

Firestone Building Products
Plastika Kritis
Sotrafa
Juta
Colorado Lining International
Layfield Group
Aquatan
Genap
Carlisle Companies
Coletanche
Titan Environmental
Global Synthetics
Taian Modern Plastic
Shandong Zhengfeng
Huikwang Corporation

Recent Developments

FEBRUARY 2025

Mining operator mandates leak location survey on every new pad

A copper producer made electrical leak location surveys a standing requirement on all new heap leach and tailings containment, after a survey on one facility located multiple installation breaches that conventional quality assurance had passed. Repair costs were trivial against the contamination liability avoided. Nobody objected.
Signal: Leak surveys are now moving from optional verification to standing requirement on every high-consequence containment project
JUNE 2025

Owner consolidates liner supply and installation into single contract

A waste management operator abandoned separate procurement of liner material and installation labour, awarding a combined supply-and-install contract after repeated disputes over responsibility for seam defects found during commissioning. Pricing rose and total project risk fell substantially in the operator's assessment. The disputes stopped entirely afterwards.
Signal: Separated procurement is being abandoned permanently wherever an owner has actually experienced a serious seam dispute
OCTOBER 2025

Tailings facility upgrade programme specifies composite containment

A mining group applying the global tailings standard across its facilities specified bituminous composite containment on upgrades where subgrade conditions made polyethylene placement risky. Material cost was higher and projected damage rates during installation were substantially lower on the difficult ground. Total installed cost was comparable.
Signal: Composite construction wins wherever installed damage risk rather than material price is what decides the specification

What Sits Under the Roll

Polyethylene resin dominates at roughly 62% of material cost, purchased from petrochemical producers whose pricing follows ethylene and crude cycles entirely. Carbon black and stabiliser packages take a further 11%, and their quality determines whether a liner reaches its specified service life under ultraviolet exposure. Extrusion energy absorbs 9%. Freight on bulky rolls carries most of the remainder and limits the economic radius of any single plant considerably.
Polyethylene resin pricing moved sharply through 2021 and 2022 on feedstock and logistics disruption, and producers holding project prices fixed at tender many months before delivery absorbed the increase entirely. Solmax and Agru both discussed raw material cost pressure in their reporting for those years. Freight rates moved independently and hit exporters serving distant projects far harder than producers manufacturing within a regional radius. Regional manufacture proved the better hedge.

Exposure divides on contract structure and product construction rather than on scale. Producers quoting fixed prices at tender on long-lead capital projects carry months of resin exposure with no mechanism to recover it. Those including escalation clauses carry very little. Composite and bituminous constructions carry a different cost structure where resin matters far less, which is a genuine hedge.
geomembranes-market-trends-cost-volatility-analysis-1787551525916

Write resin escalation into every tender submission

Project prices fixed at tender many months before manufacture transfer the entire resin exposure to the producer on a line representing 62% of material cost. Escalation clauses tied to published polymer references remove that mismatch and rarely lose a tender on their own. Producers quoting firm on twelve-month lead projects are carrying a commodity position nobody deliberately decided to hold.

Manufacture within the freight economic radius

Geomembrane rolls are bulky relative to their value, which makes freight a genuine constraint rather than a line item and limits how far any plant can serve economically. Regional manufacturing near major project pipelines beats distant capacity regardless of extrusion scale. This is why concentration stays near 38% and why plant location decisions matter more than production efficiency here.

Weight the portfolio toward composite construction

Bituminous and specialty composites carry a cost structure where polymer resin matters far less than it does in polyethylene sheet, which reduces exposure to petrochemical cycles considerably. They also grow at 8.8% against a market rate of 6.2%. The hedge and the growth arrive through the same portfolio decision, which is unusual enough to be worth acting on deliberately.

Portfolio Architecture for Margin Defence

Margin architecture follows consequence rather than material. Commodity polyethylene sheet into landfill base and water lining competes against domestic Chinese and Indian producers on resin cost and freight, and earns accordingly. Engineered applications in mining and industrial containment earn considerably more, because the owner is buying certainty rather than square metres. Composite constructions earn best where difficult subgrade makes polyethylene placement genuinely risky.
The volume and premium tension is really about who carries the seam. A producer supplying material into somebody else's installation contract earns a materials margin and inherits reputational risk it cannot manage. A supply-and-install contractor earns considerably more and controls the variable that decides whether the installation works. Very few producers have built installation capability at the scale that consolidation requires across regions. That consolidation is expensive and it is also the whole answer.

High-value pools concentrate in mining containment under tailings governance, supply-and-install packages that consolidate responsibility, and composite constructions where installed damage risk decides the specification. Each is defended by installation capability, engineering presence, or product construction rather than by extrusion cost, which regional producers will always contest successfully. Extrusion cost is the one thing regional producers always win.

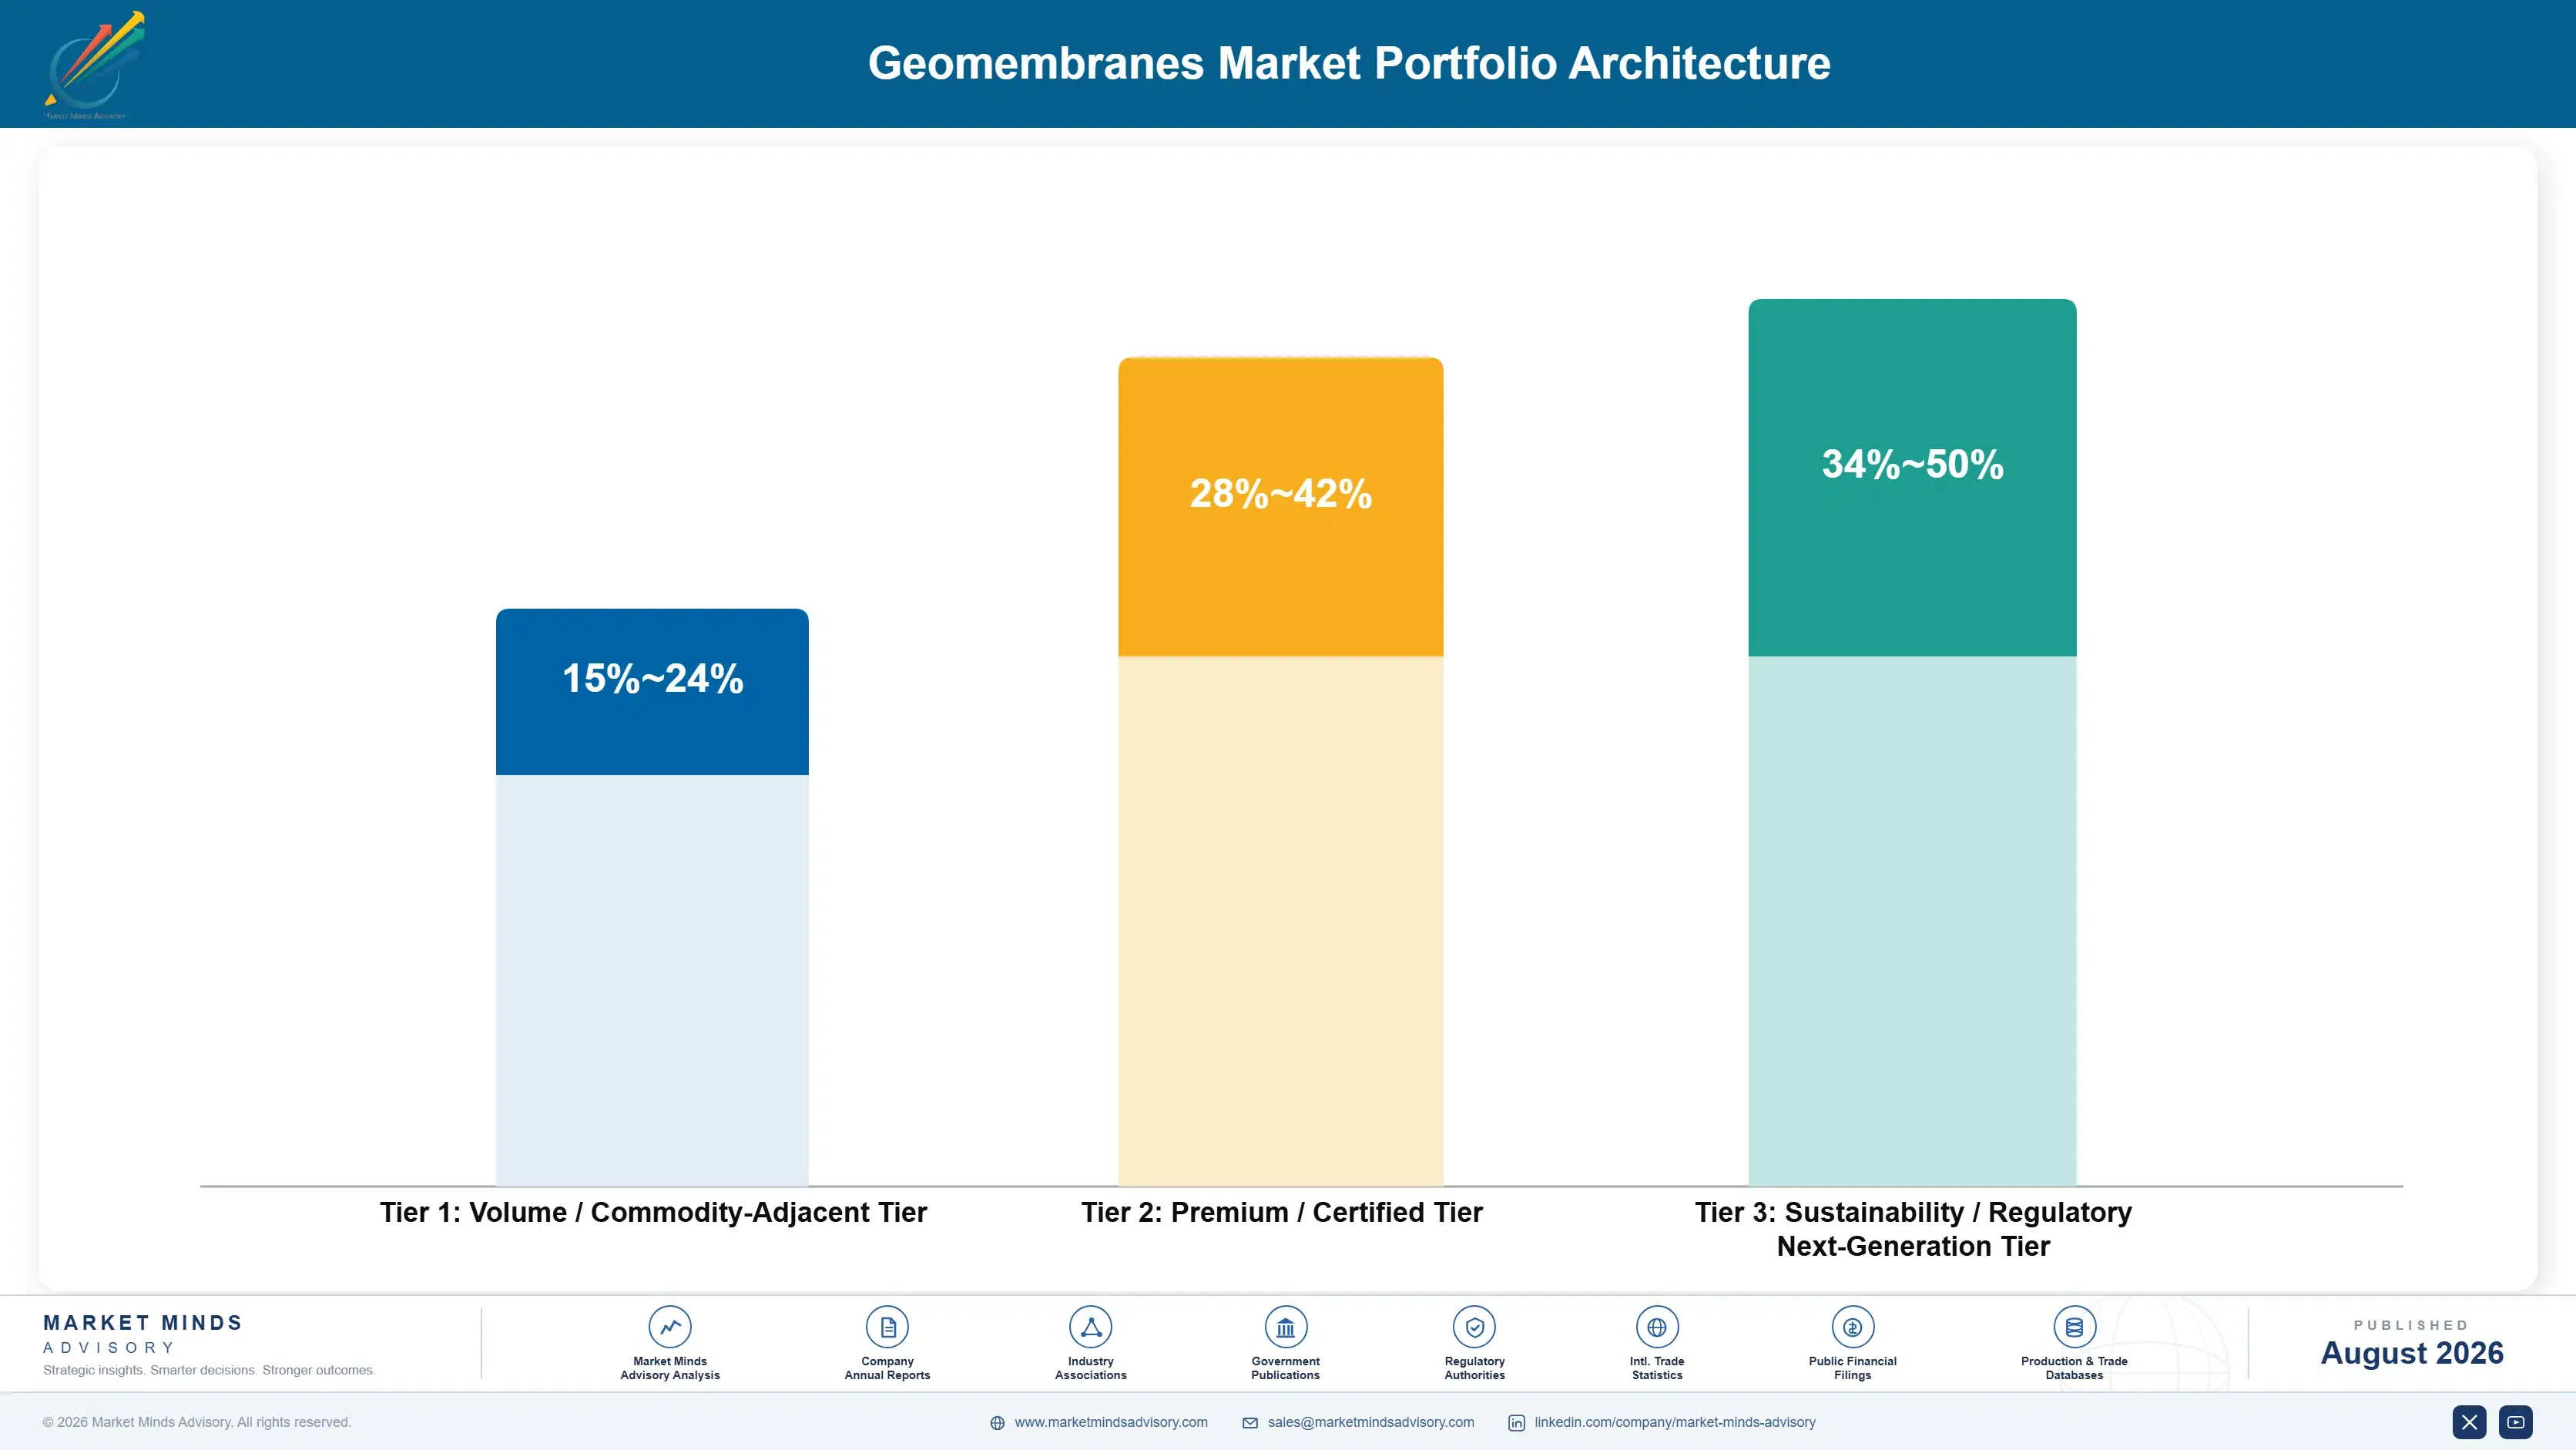
Volume / Commodity-Adjacent Tier

Standard HDPE and LLDPE sheet into landfill base lining and water containment, competing against domestic producers on resin cost and freight radius. Nothing in the material defends any position at all.
Gross Margin: 15%-24%

Premium / Certified Tier

Engineered containment for mining, industrial, and contaminated land applications supported by project engineering and certified installation. Consequence rather than specification supports pricing. The range reflects wide variation between supply-only and supply-and-install contracts.
Gross Margin: 28%-42%

Sustainability / Regulatory / Next-Generation Tier

Bituminous and composite constructions for difficult subgrade, conductive liners enabling leak location, and containment specified under global tailings governance. Product construction and compliance positioning both defend pricing. The range is wide because application severity varies enormously.
Gross Margin: 34%-50%
geomembranes-market-trends-portfolio-architecture-1787551526413

High-value Sub-segments and Strategic Watch-out

Tailings Governance Upgrades

Mining takes 31% of volume at the best realised prices anywhere here, and the global standard applies facility by facility on published assessment timetables that make demand unusually visible to anybody tracking them. Suppliers waiting for tenders to appear arrive after the specification has been written.
Gross Margin: 34%-46%

Supply-and-Install Packages

Consolidating the 44% of installed cost carrying all the failure risk earns pricing that separated procurement never will, and it is the only position that survives a leak survey finding multiple breaches. Owners who have suffered a single seam dispute never separate the procurement again.
Gross Margin: 32%-44%

Composite Constructions

Growing at 8.8% because installed damage risk rather than material price decides specifications on difficult subgrade, and the cost structure escapes resin exposure that governs polyethylene sheet margins entirely. Torching rather than extrusion welding narrows the installer pool. That helps the supplier who controls installation.
Gross Margin: 34%-48%

Commodity Polyethylene Sheet

The strategic watch-out. Domestic Chinese and Indian producers set pricing, resin at 62% of material cost governs the margin, and freight limits how far any plant can defend its own radius. Escalation clauses written into tenders are the only mechanism that recovers any of it.
Gross Margin: 15%-24%

How Liner Gets Onto a Project

Demand originates in design rather than procurement, which is the single most important thing about selling into this market. A consulting engineer specifies the containment system during facility design, frequently years before construction, and writes material type, thickness, and quality assurance requirements into documents that a tender then prices. Suppliers engaged at design stage shape what gets specified. Those arriving at tender are pricing somebody else's decision against competitors doing exactly the same thing.
Stickiness depends on who was persuaded and when. A specification naming a construction type holds through the project. Owner-level framework agreements across multiple facilities hold for years. Supply into a separately procured installation contract holds for one delivery and confers nothing at all afterwards. Nothing about the material itself holds anything in place.

The deciding buyer for high-consequence work has shifted toward environmental and tailings governance functions at mining and waste operators, who evaluate containment against regulatory exposure rather than against cost per square metre. Those people read leak survey results. Suppliers presenting material datasheets to a procurement department are addressing a decision that was effectively made elsewhere. Reaching them requires engineering people rather than commercial ones.
geomembranes-market-trends-end-use-penetration-index-1787551526899

Where the Risk and Return Sit

These are among the four positions where our research anticipates prominent divergence between winners and laggards over the coming forecast period. Each is grounded in the demand model, the regulatory perimeter, and the announced capacity pipeline.
01 / INSTALLATION RESPONSIBILITY CONSOLIDATION

Take the seams or stop pretending to guarantee anything

Deployment and welding account for 44% of installed cost and effectively all of the failure risk, while owners routinely procure material and labour separately and leave the supplier holding reputational exposure for seams it never supervised or selected in the first place. Electrical leak surveys locate damage on 96% of installations examined and almost none of it is material defect of any kind. Supply-and-install packages consolidate that responsibility and command pricing that separated procurement will never generate for anybody at all.
02 / TAILINGS COMPLIANCE TRACKING

Follow the assessment schedules, not the tenders

The global tailings standard adopted after two catastrophic dam failures applies to individual storage facilities on assessment timetables that operators publish, making this the most visible demand pipeline available anywhere in the entire market. Mining already takes 31% of volume at the best realised prices anywhere, and the upgrade programme runs across an installed base needing a full decade to work through. Suppliers waiting for tenders to appear arrive well after the containment specification has already been written into the design.
03 / FIELD SEAM REDUCTION

Fabricate in the factory, weld less on site

Field welding on a windy site by a crew paid by the metre is where containment installations fail, and leak location surveys confirm that on 96% of the projects they examine across every application they cover. Factory fabrication of large panels removes a substantial proportion of field seams before anybody reaches the site at all. Higher material cost is offset by faster deployment and materially lower failure risk, which is the comparison an owner facing contamination liability genuinely cares about most.
04 / COMPOSITE PORTFOLIO WEIGHTING

Move away from resin, toward difficult ground

Polyethylene resin represents 62% of material cost and moves on petrochemical cycles no geomembrane producer influences, against project prices frequently fixed at tender many months before manufacture even begins at the plant. Bituminous and specialty composites carry a fundamentally different cost structure and grow at 8.8%, the fastest rate anywhere in this market, while tolerating rough subgrade that makes thermoplastic placement genuinely risky to attempt. The margin hedge and the growth opportunity arrive through exactly the same single portfolio decision here.

Engagement Snapshot From the Field

A live engagement with an industry participant carrying material or product regulatory and market exposure ahead of a defining policy shift, showing how our research translates into a defensible multi-year portfolio strategy.
MARKET MINDS ADVISORY · CLIENT ENGAGEMENT SUMMARY
Geomembranes Producer Strategic Portfolio Review and Transition Roadmap 2026·Investment Scenario on Geomembranes Exposure Evaluation 2025-26
CLIENT PROFILE
An international geomembrane manufacturer with revenue near USD 280 million (client-reported, unverified by MMA), extruding polyethylene sheet for landfill, water, and mining applications across three continents. Installation was left entirely to third-party contractors, no composite products existed, and project margins had compressed for four consecutive years running. Resin escalation clauses had never once entered a tender.
STRATEGIC CHALLENGE
Two mining projects had produced seam failure disputes where the client supplied material into installation contracts it neither selected nor supervised, and both cost more in commercial settlement than the contracts had earned. Domestic producers were undercutting commodity sheet everywhere. Resin exposure on fixed-price tenders was unmanaged. Design-stage engagement did not exist.
MMA APPROACH
MMA analysed margin and dispute history by contract structure, assessed installation capability build against acquisition of regional installers, and modelled composite product entry against the tailings upgrade pipeline. Forty-seven expert interviews with mining environmental teams, consulting engineers, installation contractors, and leak survey specialists established how specifications are genuinely written. Three years of dispute files were reviewed in full.
KEY FINDINGS
  1. Both seam disputes had arisen on separately procured installation contracts, and every project where the client had controlled installation had closed without any commercial claim at all.
  2. Consulting engineers wrote containment specifications during facility design years before tender, and the client's commercial team engaged almost exclusively at tender stage instead.
  3. Resin exposure on fixed-price tenders had cost more across three years than every operational efficiency programme in the same period had managed to save.
  4. Two tailings upgrade programmes within the client's regions had specified composite construction the business could not supply, and neither had been contested on price at any point.
CLIENT PROFILE
An international geomembrane manufacturer with revenue near USD 280 million (client-reported, unverified by MMA), extruding polyethylene sheet for landfill, water, and mining applications across three continents. Installation was left entirely to third-party contractors, no composite products existed, and project margins had compressed for four consecutive years running. Resin escalation clauses had never once entered a tender.
STRATEGIC CHALLENGE
Two mining projects had produced seam failure disputes where the client supplied material into installation contracts it neither selected nor supervised, and both cost more in commercial settlement than the contracts had earned. Domestic producers were undercutting commodity sheet everywhere. Resin exposure on fixed-price tenders was unmanaged. Design-stage engagement did not exist.
MMA APPROACH
MMA analysed margin and dispute history by contract structure, assessed installation capability build against acquisition of regional installers, and modelled composite product entry against the tailings upgrade pipeline. Forty-seven expert interviews with mining environmental teams, consulting engineers, installation contractors, and leak survey specialists established how specifications are genuinely written. Three years of dispute files were reviewed in full.
KEY FINDINGS
  1. Both seam disputes had arisen on separately procured installation contracts, and every project where the client had controlled installation had closed without any commercial claim at all.
  2. Consulting engineers wrote containment specifications during facility design years before tender, and the client's commercial team engaged almost exclusively at tender stage instead.
  3. Resin exposure on fixed-price tenders had cost more across three years than every operational efficiency programme in the same period had managed to save.
  4. Two tailings upgrade programmes within the client's regions had specified composite construction the business could not supply, and neither had been contested on price at any point.
RECOMMENDED STRATEGY
Phase 1: Phase one: acquire or build regional installation capability in mining markets, and stop supplying material into installation contracts the business cannot supervise. Phase 2: Phase two: place engineering resource with consulting engineers during facility design, shaping specifications well before any tender document is issued. Phase 3: Phase three: add composite product capability targeting tailings upgrades on difficult subgrade, and write resin escalation into every fixed-price tender submitted.
OUTCOME
The client acquired a regional installer and moved mining work onto supply-and-install terms within a year. Design-stage engagement began with four consulting practices, resin escalation entered all tenders, and blended gross margin improved 8.1 percentage points (client-reported, unverified by MMA). Composite product development entered technical evaluation afterwards.

Frequently Asked Questions

Foundational context covering the market sizes, CAGR, scope, country, region and competition that inform every finding below. This section is provided to cover basics and most often pre-purchase conversations, answered from the MMA Primary Research Dataset.

What is the current size of the Geomembranes Market?

The market was valued at USD 3.6 billion in 2025, rising to an estimated USD 3.82 billion in 2026. East Asia holds the largest regional share at 29% of value.

How large will the Geomembranes Market be by 2036?

MMA forecasts USD 6.98 billion by 2036 under the base case, an expansion multiple of 1.82 times the 2026 value. That represents USD 3.16 billion of incremental value.

What is the CAGR for the Geomembranes Market 2026 to 2036?

The base case CAGR is 6.2%, with a bull case of 7.4% and a bear case of 5.0%. The spread reflects uncertainty over mining capital cycles and resin pricing.

Which segment is growing fastest?

Bituminous and specialty composite geomembranes grow fastest at 8.8%, roughly 1.42 times the market rate. Reinforced polypropylene follows at 7.4% on factory fabrication that cuts field seaming.

Who are the major companies in the Geomembranes Market?

Solmax, Agru, NAUE, Atarfil, and Officine Maccaferri lead, holding roughly 38% between them. Installation networks and project engineering rather than extrusion capacity sustain that position.

Which country is growing fastest?

Chile grows fastest at 9.6%, driven by copper heap leach and tailings containment upgrades under the global tailings standard applying to its major mining operations.

Report Segmentation Architecture

The full report scope spans multiple orthogonal segmentation dimensions, with cross-tabulated demand data provided for each dimension pair. Coverage extends further to regional breakdowns, trend trajectories, and the competitive detail needed to support segment-level decision-making.

By Polymer and Construction Type

  • HDPE Geomembranes
  • LLDPE Geomembranes
  • PVC Geomembranes
  • EPDM and Elastomeric Geomembranes
  • Reinforced Polypropylene Geomembranes
  • Bituminous and Specialty Composite Geomembranes

By End-Use Industry

  • Landfill Base Lining and Capping
  • Mining Heap Leach and Tailings
  • Water Reservoirs and Canal Lining
  • Aquaculture and Agricultural Ponds
  • Oil, Gas and Industrial Containment
  • Biogas Digesters and Floating Covers

By Sales Model

  • Supply-and-Install Contracts
  • Material Supply to Contractors
  • Framework Agreements with Owners
  • Distributor and Stockist Supply
  • Design-Specified Project Awards

By Region

  • North America
  • Western Europe
  • East Asia
  • South Asia and Pacific
  • Latin America
  • Middle East and Africa
  • Eastern Europe

Scope, Methodology, and Coverage

Every figure in this report is reproducible from documented input assumptions. The scope below maps the historical period, the forecast horizon, the segmentation dimensions, and the countries covered, alongside the underlying primary and qualitative methodology.
Historical Period
2020 to 2025
Forecast Period
2026 to 2036
Base Year
2025 (USD billions; MMA Primary Research Dataset, August 2026)
Market Definition
The market comprises polymeric and composite geomembrane liners supplied for containment applications, covering HDPE, LLDPE, PVC, EPDM and elastomeric, reinforced polypropylene, and bituminous or specialty composite geomembranes. Value is measured at manufacturer level including material supplied under supply-and-install contracts. Geotextiles, geosynthetic clay liners, geogrids and geocomposite drainage products, installation labour contracted separately from material, leak detection survey services, subgrade preparation, and civil earthworks fall outside scope.
Quantitative Units
USD billions (current prices); million square metres supplied annually; USD per square metre by polymer type and thickness
Segmentation Dimensions
By Polymer and Construction Type; By End-Use Industry; By Sales Model; By Region
Regions Covered
North America, Western Europe, East Asia, South Asia and Pacific, Latin America, Middle East and Africa, Eastern Europe
Countries Covered
China, Japan, South Korea, India, Australia, Indonesia, Vietnam, Thailand, United States, Canada, Mexico, Germany, France, Italy, Spain, Netherlands, United Kingdom, Austria, Poland, Romania, Serbia, Czechia, Chile, Peru, Brazil, Argentina, Saudi Arabia, United Arab Emirates, Egypt, South Africa
Key Companies Profiled
Solmax, Agru, NAUE, Atarfil, Officine Maccaferri, Firestone Building Products, Plastika Kritis, Sotrafa, Juta, Colorado Lining International, Layfield Group, Aquatan, Genap, Carlisle Companies, Coletanche, Titan Environmental, Global Synthetics, Taian Modern Plastic, Shandong Zhengfeng, Huikwang Corporation
Quantitative Methodology
Primary survey, n=3,800 respondents, Q4 2025, six countries; demand-side model with trade association cross-validation
Qualitative Methodology
47 expert interviews, Q4 2025; applied to validate demand model assumptions, identify emerging dynamics, and assess competitive positioning
Report Format
PDF and XLSX data workbook (Word format preview document)
Publisher
Market Minds Advisory
Report Code
MMA-2026-CHM-419
Published
August 2026
Contact
sales@marketmindsadvisory.com | www.marketmindsadvisory.com

Purchase the full Geomembranes Market Report (2026 to 2036).

The full report sizes geomembrane demand across six construction types, six end-use industries, and seven regions with 2026 to 2036 forecasts under base, bull, and bear cases. It treats installation quality as the central commercial variable rather than material specification, since leak surveys confirm that is where containment actually fails. Competitive profiles cover twenty suppliers assessed consistently on geomembrane supply revenue, installation network reach, and design-stage engineering presence. Cost analysis traces resin, additive, and freight exposure against tender contract structures. Commercial guidance addresses installation consolidation, tailings compliance tracking, field seam reduction, and composite portfolio weighting.
Six construction types sized separately by region
Installation cost and failure risk separated from material supply
Tailings governance upgrade pipeline mapped by facility
Leak location survey findings analysed by damage cause
Resin cost exposure modelled against tender lead times
Freight economics assessed as manufacturing radius by region

Built For The People Who Decide

From boardroom strategy to bench-side execution, this report is read cover-to-cover by leaders shaping the next decade of their industry, turning demand scenarios, market dynamics and valuation benchmarks into decisions.
CXOs/ Presidents/ VPs/ Managers
M&A and Corporate Development
Strategy Teams and R&D Heads
Procurement and Product Directors
Regulatory and Compliance Leaders
Investor Relations and Equity Analysts