Market Minds Advisory
Gas Jet Compressor Market

Gas Jet Compressor Market: Thermodynamically Poor, Mechanically Unbeatable

An ejector burns roughly three times the energy a mechanical compressor needs for the same duty. It keeps winning anyway, because it has no moving parts and the fluids involved would destroy a machine.

Lead Analyst

Published

September 2026

Make Smarter Decisions with Customized Research Insights

Request a free sample report and evaluate market opportunities, growth trends, and competitive dynamics relevant to your business needs.

2025 MARKET VALUE$0.8BMarket Size 2025
2036 FORECAST VALUE$1.6BBase Case , 2026 to 2036
CAGR 2026 TO 20365.8 %Bull 7.0% / Bear 4.6%
INCREMENTAL OPPORTUNITY$0.7BNet 10- year value creation
EXPANSION MULTIPLE1.76x2036 value over 2026 base
Strategic Levers
M&A Pipeline
Regional Outlook
Country Rankings
Competitive Intelligence
Segmental Deep-dive
Call-Us : 91 93563 13602

Executive Snapshot and Market Trajectory

A gas jet compressor uses roughly three times the energy a mechanical machine would need for exactly the same compression duty. Every few years an engineer proposes replacing them on that basis. It does not work, because the fluids involved destroy machines. The market reaches USD 0.85 billion in 2025.
High-pressure gas motive ejectors grow fastest at 8.7%, exactly 1.50 times the market rate, driven by flare gas recovery mandates on streams that are wet, sour, and variable in a way that no mechanical compressor tolerates. East Asia holds 30% of value on refining and petrochemical capacity. Middle East and Africa takes 12%, above the band this framework applies, on Gulf gas processing and thermal desalination.
Concentration reaches 46% across the top five, and every one of them is a specialist engineering house rather than a division of some larger general equipment maker. Competition turns on computational modelling accuracy, on erosion allowance in nozzle design, and on whether the supplier will guarantee performance at off-design conditions. Almost every ejector complaint arising in service traces back to operation away from the point it was originally sized for.
Market Definition
The gas jet compressor market covers ejectors and thermocompressors that raise the pressure of a suction gas stream using the kinetic energy of a higher pressure motive fluid, with no moving parts, supplied to refining, petrochemical, gas processing, power, and process industries. Mechanical compressors and blowers, liquid ring and dry vacuum pumps, steam turbines, venturi flow meters, and complete vacuum systems sold as packaged skids including mechanical stages are excluded.
Base Year Value
$0.8B in 2025 (MMA Primary Research Dataset, August 2026)
Forecast Period
2026 to 2036, eleven discrete annual values
CAGR
5.8% base case. Bull 7.0%. Bear 4.6%.
Fastest Growth Segment
High-Pressure Gas Motive Ejectors: 8.7% CAGR
Fastest Growth Country
Saudi Arabia: 8.4% CAGR
Fastest Growth Region
South Asia and Pacific: 7.8% CAGR
Largest Region
East Asia: 30% of 2025 global value
Market Leaders
Korting Hannover, Graham Corporation, GEA Wiegand, Schutte and Koerting, Transvac Systems. Source: MMA Primary Research Dataset, July 2026.
Primary Survey
n=3,800 procurement and R&D decision-makers, Q4 2025, six countries
Methodology
Demand-side build-up, cross-validated against public data, 47 expert interviews

Gas Jet Compressor Market Forecast Scenarios

gas-jet-compressor-market-size-forecast-scenario-1786463159245
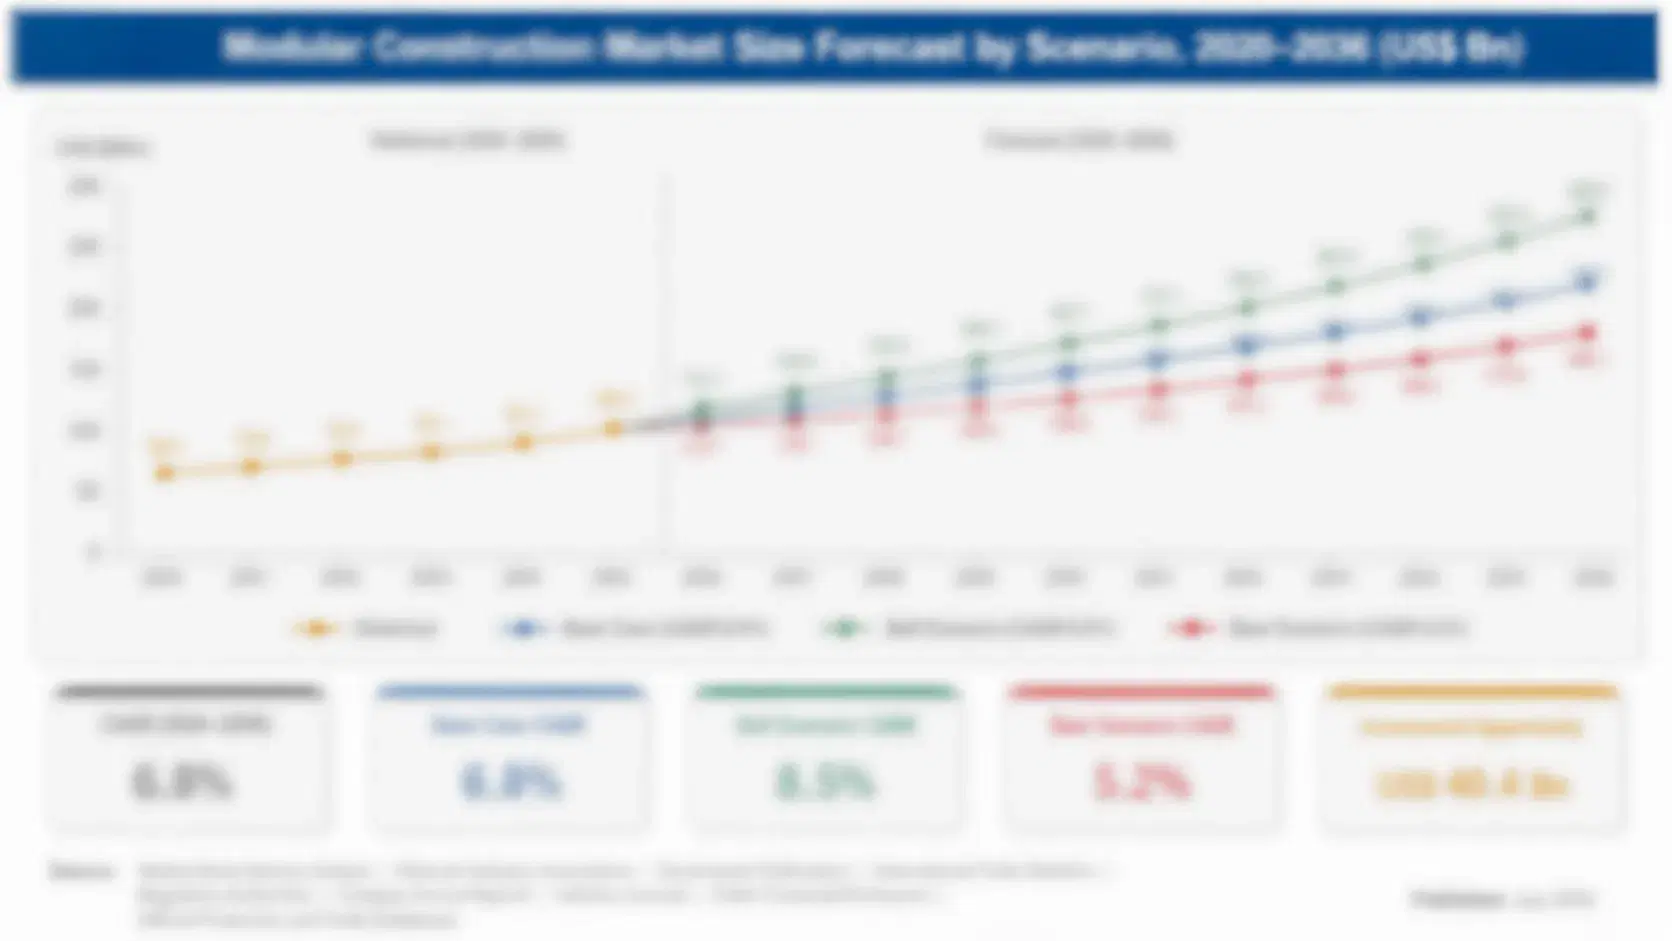
Between 2020 and 2025 the market followed process industry capital spending, with a long pause and a narrow recovery. Refining and petrochemical projects stalled in 2020 and much of 2021, and ejector orders sit late enough in a project to feel that with a lag. Recovery from 2022 came mainly from the Gulf and from Asian petrochemical build. A 4.7% historical CAGR reflects the pause.
Three mechanisms carry the 5.8% base case. Flare gas recovery obligation is the largest, since regulators across the Gulf, North America, and West Africa are tightening routine flaring rules and the recovered gas is exactly the wet, sour, variable stream that ruins a mechanical compressor. Asian petrochemical capacity is the second. And evaporator and dryer thermocompression is the third, growing with food, dairy, and chemical concentration duty. None of the three depends on any technology change.
The 7.0% bull case turns on flaring enforcement actually biting rather than being deferred again, which would convert a large pipeline of studied projects into orders. The 4.6% bear case is petrochemical overcapacity in Asia stalling new plant sanctions, since a large share of ejector demand arrives bundled into vacuum distillation and vapour recovery scope on greenfield projects.

No Moving Parts, And That Is The Point

On any energy balance the gas jet compressor loses. Expanding a high-pressure motive stream through a nozzle to entrain and recompress a low-pressure one wastes most of the available work, and the motive flow required typically runs three times the suction flow. A mechanical compressor doing the same job consumes roughly a third of the energy. Engineers rediscover this regularly and propose the swap.
TOP FIVE CONCENTRATION46%Specialist engineering houses divide a technically demanding niche between them
MOVING PARTS COUNT0Mechanical components inside the compression device itself, by design
MOTIVE FLOW RATIO3 to 1Motive flow required against the suction flow being entrained
TYPICAL SERVICE LIFE25 yearsOperating years before erosion demands nozzle or diffuser replacement
ENERGY PENALTY MULTIPLE3 timesEnergy consumed against an equivalent mechanical compressor duty
FLARE RECOVERY PAYBACK18 monthsMonths before a recovery installation repays its installed capital cost
Then they look at the fluid. Suction streams in vapour recovery, flare headers, and vacuum distillation carry liquid slugs, corrosive condensate, catalyst fines, and a composition that changes hour to hour. A centrifugal machine handling that needs knockout drums, filtration, seal systems, condition monitoring, and a maintenance crew. An ejector needs a flange and somewhere for the motive line to come from.
That is the whole commercial argument, and it holds because it is about total cost rather than efficiency. Twenty-five years of unattended operation in a hazardous area with no power supply, no lubrication, and no rotating seals beats a thermodynamic advantage that assumes the machine keeps running. Suppliers who sell efficiency comparisons are arguing the case their competitors would prefer.
"Every plant has a story about the mechanical compressor that was going to replace the ejectors and save a fortune. Ask what happened to it. It is usually still there, bypassed, with the ejector doing the work."
Principal, Process Equipment Practice · MMA Energy Practice ·

Market Trends

Flare Recovery Mandates Favour No Moving Parts

Regulators across the Gulf, North America, and West Africa have tightened routine flaring rules, and operators now need to recover gas they previously burned. That stream is the worst possible feed for rotating equipment: wet, frequently sour, carrying liquid carryover, and swinging in composition and flow with whatever the plant is doing upstream. An ejector driven by available high-pressure gas absorbs all of it without complaint. Recovery projects that a compressor would make marginal on reliability grounds become straightforward, which is why this application is growing at 8.7% against a market at 5.8%.
Market Impact: Asia adds 3 million barrels capacit

Computational Modelling Replaces Empirical Sizing Methods

Ejector performance was historically predicted from correlations built on decades of test data, which worked well at design point and poorly everywhere else. Computational fluid dynamics now resolves shock structure, mixing, and off-design behaviour well enough that suppliers can predict the whole operating envelope rather than a single duty. That matters commercially because almost every field complaint traces to operation away from the design point. Suppliers with validated modelling capability guarantee performance across a range, which is a claim empirical sizing could never support. Empirical correlation could never support that claim. Test data is what makes the difference.
Market Impact: Thermocompression cuts steam 30 per

Market Opportunities and Growth Drivers

Asian Petrochemical Capacity Carries Vacuum Distillation Scope

Chinese and Indian refinery and petrochemical complexes commissioned across this decade each carry vacuum distillation, vapour recovery, and deaeration duty that arrives as ejector scope inside the licensor package. A large integrated complex can specify dozens of stages across its units. Those orders are bundled into engineering procurement contracts rather than tendered separately, which means the licensor and the engineering contractor decide the supplier long before any operator sees a quotation. Capacity additions in the region continue well past the point where Western refining stopped growing. Supplier selection happens well before any operator sees a price.
Market Impact: Ejectors use 3 times the energy

Thermocompression Cuts Steam Use In Evaporation Duty

Multiple-effect evaporators in dairy, sugar, chemical, and desalination service use thermocompressors to recycle vapour back into the heating side, which cuts live steam consumption substantially against an equivalent plant without them. Energy cost across Europe since 2022 made that retrofit case considerably stronger than it had been, and operators who had never modelled steam economy started doing so. The equipment is inexpensive relative to the saving and installs during a normal shutdown. Payback frequently lands inside two years at current industrial steam prices. The saving repeats every hour the plant runs. Nobody has to change how the process works.
Market Impact: Off-design drives 70% of claims

Market Restraints and Challenges

Energy Efficiency Comparisons Invite Constant Challenge

An ejector consumes roughly three times the energy of a mechanical compressor performing the same duty, and that number appears in every energy audit a plant commissions. The root cause is thermodynamic and permanent: expanding motive fluid through a nozzle to entrain a suction stream discards most of the available work. Commercially this puts installed ejectors under repeated review and forces suppliers to defend positions they already hold. Participants are mitigating by quantifying total cost including knockout, filtration, seals, monitoring, and maintenance crew, which is where the comparison reverses. Very few suppliers prepare that case properly.
Market Impact: Recovery payback runs 18 months

Off-Design Operation Produces Most Field Complaints

An ejector sized precisely for one duty performs poorly when suction pressure, motive pressure, or composition drifts away from that point, and plants rarely operate where the datasheet assumed. The root cause is that entrainment depends on a shock structure inside the diffuser that collapses outside a fairly narrow window. Commercially it generates warranty disputes where nobody is clearly at fault, since the equipment met specification and the plant did not. Mitigation runs toward computational modelling of the full envelope, spindle-adjustable nozzles, and multiple parallel units staged for turndown. Turndown design is the harder half of the problem.
Market Impact: Off-design causes 70% of complaints
3 additional market trends, 2 additional growth drivers, and 4 additional restraints and challenges are covered in the full report. Contact sales@marketmindsadvisory.com to access the complete intelligence.

Segment CAGR and Growth Architecture

Segmentation follows motive fluid, because what drives the ejector determines its nozzle geometry, the compression ratio it can achieve, the utility infrastructure a site must already have in place, and the operating cost of every hour the device runs. Application, stage count, and materials of construction are handled in the framework and commentary instead.
gas-jet-compressor-market-market-share-analysis-1786463159407

High-Pressure Gas Motive Ejectors

Gas motive ejectors grow fastest at 8.7%, exactly 1.50 times the market rate, and flare recovery obligation is doing almost all of the work. Where a plant already has high-pressure gas available, using it to entrain low-pressure flare or vapour recovery streams needs no utility that does not already exist and no power supply at the location. The suction stream is wet, often sour, and swings with whatever happens upstream, which is precisely the duty that makes a mechanical compressor unreliable. Payback on recovery installations frequently lands inside eighteen months once flaring penalties are counted properly. Unmanned locations are where the argument becomes decisive, since there is no power supply to install and nothing to attend.
CAGR 8.7%

Process Vapour Motive Thermocompressors

Process vapour motive units grow at 7.0%, recycling vapour generated by the process itself back into the heating side of an evaporator or dryer rather than condensing it and starting again. Multiple-effect evaporation in dairy, sugar, chemical concentration, and thermal desalination all depend on the arrangement to hold steam economy at workable levels. European energy costs since 2022 made the retrofit case considerably stronger and pushed operators who had never modelled steam economy into doing so. The hardware is inexpensive relative to the saving and fits inside a normal shutdown window without major pipework changes. Steam economy improvements of this size were simply not worth chasing at pre-2022 energy prices anywhere.
CAGR 7.0%
Full segment breakdown across 5 segments available in the complete report.

Regional Architecture and Country Demand Map

Regional shares here follow process plant capacity rather than energy consumption, because an ejector gets bought when a distillation column, evaporator, or recovery system is built. Flare recovery obligation is now shifting that pattern toward the gas producing regions faster than refining capacity alone would.

East Asia

East Asia holds 30% of value, at the ceiling of the band this framework applies, and Chinese process capacity explains most of it. China now refines more crude than any other country and has added petrochemical capacity at a pace nowhere else has matched, with vacuum distillation and vapour recovery scope arriving on every complex. Japanese and Korean plants are mature and technically demanding, buying replacement and upgrade rather than greenfield scope. Domestic Chinese ejector makers supply the bulk of standard duty at prices European specialists cannot approach, while difficult services still route to imported equipment. Growth at 6.4% exceeds the global rate on continued complex commissioning. Licensor packages decide most of the supplier selection here.
Share: 30% | CAGR: 6.4% (2026 to 2036)

Middle East and Africa

Middle East and Africa takes 12% of value against a 6% ceiling in this framework, and three separate demands explain the breach. Gulf gas processing carries extensive vapour recovery and vacuum duty on sour streams that rotating equipment handles poorly. Thermal desalination across Saudi Arabia, the United Arab Emirates, and Kuwait uses thermocompression to hold steam economy in multi-effect plants. And flaring elimination commitments across Iraq, Nigeria, Algeria, and the Gulf are converting studied recovery projects into orders. North African refining adds a smaller stream. Growth at 6.2% exceeds the global rate, driven by enforcement timing rather than by commercial return. No other region combines those three demands at once. Timing is the only real uncertainty.
Share: 12% | CAGR: 6.2% (2026 to 2036)
Regional intelligence for 5 additional markets available in the complete report: North America, Western Europe, South Asia and Pacific, Latin America, Eastern Europe. Contact sales@marketmindsadvisory.com.
gas-jet-compressor-market-country-cagr-analysis-1786463159573

Where Ejector Suppliers Actually Earn Margin

An ejector is a nozzle, a mixing chamber, and a diffuser welded together, and a competent fabricator anywhere can build one to a drawing. Margin comes from knowing what the drawing should say: modelling the full operating envelope, guaranteeing performance away from design point, and owning the retrofit case that energy prices have handed the industry.

Guarantee Performance Across The Operating Envelope

Roughly 70% of field complaints trace to operation away from the design point, and most suppliers quote a single duty because that is all empirical sizing ever supported. Validated computational modelling lets a supplier guarantee entrainment across a stated range of suction and motive conditions, which prices 20% to 30% above single-point quotations. Plants pay it because the alternative is a warranty dispute where nobody is clearly at fault. It also converts an argument about equipment into an argument about who understood the process better. Very few competitors can make the same offer credibly.
Market Impact: Envelope guarantees add 20 to 30 pe

Sell The Total Cost Case Against Rotating Equipment

Energy audits show an ejector consuming three times what a mechanical compressor would, and that number wins the argument unless somebody quantifies the rest. Knockout drums, filtration, seal systems, condition monitoring, spares holding, and a maintenance crew typically add USD 300,000 to USD 900,000 across a compressor's life on a dirty service. Suppliers who present that comparison defend installed positions that efficiency figures alone would lose. Very few of them prepare it properly, which leaves the argument to whoever commissioned the audit. The audit arrives whether or not anybody has prepared for it.
Market Impact: Total cost gap reaches 900,000 doll

Convert Steam Prices Into Thermocompression Retrofits

European industrial steam costs since 2022 made evaporator thermocompression retrofits pay back inside two years where they had previously looked marginal, and most operators have never modelled their own steam economy carefully enough to know it. Suppliers who arrive with a plant-specific steam balance rather than a product brochure are creating orders that were never in anybody's capital plan. The hardware is inexpensive, installs in a normal shutdown, and cuts live steam consumption by around 30% on a typical multiple-effect arrangement. An application engineer creates these orders, not a salesperson. Competitors are rarely even in the room.
Market Impact: Retrofits cut steam use by 30 perce

Who Controls the Margin Pool

Concentration reaches 46% across the top five, measured on gas jet compressor revenue, and every one of them is a specialist rather than a division of a general equipment maker. Korting Hannover and Graham Corporation lead on difficult service and on modelling depth, with GEA Wiegand strong in evaporation thermocompression and Schutte and Koerting and Transvac holding solid process positions. The gap to regional fabricators is engineering rather than welding.
Competition currently turns on three things. Whether the supplier can predict performance away from the design point, which decides who carries the risk when the plant drifts. Erosion allowance and materials selection on abrasive or corrosive service, which decides how long the nozzle lasts. And engineering contractor relationships, because most ejector scope is decided inside a licensor package before any operator is consulted.

Pressure comes from Chinese and Indian fabricators who now build competent standard-duty equipment at a fraction of European pricing, and from process licensors who increasingly specify by performance rather than by named supplier. Rankings will shift toward whoever can demonstrate modelled envelope performance, because that is the one claim a low-cost fabricator cannot make credibly without the test data behind it.
gas-jet-compressor-market-company-positioning-matrix-1786463159739

Competitive Moat and Risk Dimensions

KORTING HANNOVER

Moat: Modelling depth on difficult service

Korting has built ejector design capability over more than a century and holds test data across service conditions that newer entrants cannot replicate quickly. On sour, abrasive, or wide-turndown duty a contractor specifies the supplier whose predictions have held before, because the cost of getting it wrong lands on the contractor rather than the equipment maker.
KORTING HANNOVER

Risk: German cost on standard duty

Straightforward vacuum and vapour recovery duty accounts for most units sold, and on that work a competent Chinese or Indian fabricator delivers acceptable equipment at a fraction of German cost. As those suppliers accumulate reference installations, the ground where Korting's engineering genuinely earns its premium narrows toward the difficult minority of applications.
GRAHAM CORPORATION

Moat: Refining and defence qualification depth

Graham holds long-standing qualification across North American refining and a separate naval and defence business that imposes documentation and quality discipline well beyond commercial process norms. That combination gives it credibility on critical service and a revenue base that does not move with the petrochemical cycle, which few specialists in this market can claim.
GRAHAM CORPORATION

Risk: Concentration in mature refining

North American and European refining capacity is flat to declining, and Graham's strongest positions sit exactly there while growth is in Asian petrochemical build and Gulf gas processing. Building comparable engineering contractor relationships in those regions takes years, and licensor packages are frequently decided before any supplier outside the incumbent circle is even approached.

Players Tracked

Prominent Players

Korting Hannover
Graham Corporation
GEA Wiegand
Schutte and Koerting
Transvac Systems

Other Key Players

Croll-Reynolds
Fox Venturi Products
Gardner Denver Nash
Mazda Limited
Venturi Jet Pumps
Ejector Systems
Artisan Industries
Hijet Engineering
Jet Vacuum Systems
Chem Process Systems
Everest Transmission
Wintek Corporation
Kadant Johnson
Sterling SIHI
Gujarat Otofilt

Recent Developments

MARCH 2025

Gulf operator awarded flare recovery ejector scope across gathering sites

A Gulf operator awarded ejector-based flare gas recovery scope across a group of gathering stations, using available high-pressure gas as motive fluid rather than installing compressors at unmanned locations. The recovered stream carried liquid slugs and sour content that rotating equipment would have struggled to handle reliably.
Signal: Recovery projects are being specified arou
AUGUST 2024

Supplier published modelled off-design performance envelopes

An ejector specialist began publishing computationally modelled performance envelopes covering the full range of suction and motive conditions rather than only a single design point. The change followed field data showing that most performance disputes involved plants operating well away from their original sizing condition.
Signal: Guaranteeing an envelope rather than a poi
DECEMBER 2024

Dairy processor retrofitted thermocompression on evaporator train

A dairy processor retrofitted thermocompressors across a multiple-effect evaporator train, cutting live steam consumption substantially against the European gas prices that had made the previous configuration uneconomic to keep running. Installation was completed inside a scheduled maintenance shutdown without any modification to the existing vessels.
Signal: Energy prices rather than any technology c

Stainless, Exotic Alloys, And Machining

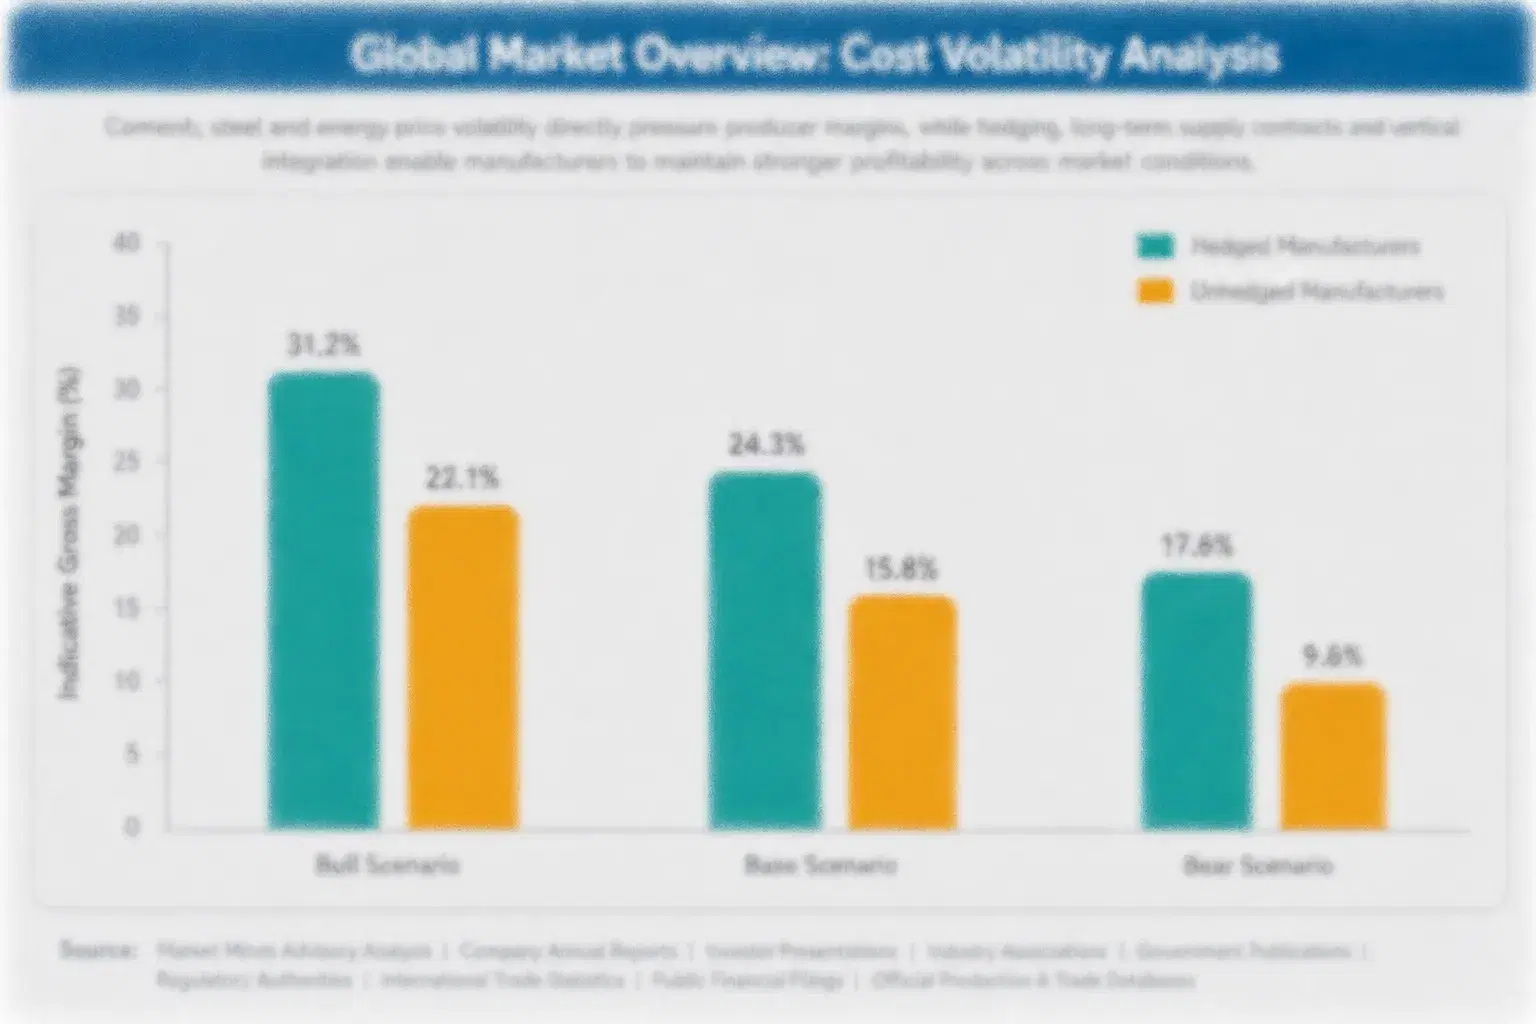
Austenitic and duplex stainless steel carries roughly 32% to 40% of cost of goods, with nickel alloys, titanium, and hastelloy on sour or chloride service pushing material content far higher on individual units. Precision machining of nozzle and diffuser profiles adds 20% to 26%, and it is skilled work that cannot be rushed. Fabrication, welding, inspection, and documentation account for most of the remainder.
Nickel prices moved violently in March 2022 when the London Metal Exchange suspended and cancelled trades, reaching around USD 100,000 per tonne intraday, and stainless surcharges followed within weeks. Outokumpu and Alleima both recorded alloy surcharge effects across that period. Ejector suppliers holding firm project prices on engineering procurement contracts absorbed the increase directly, because a bundled equipment price inside a lump sum contract cannot be reopened.

Exposure divides by contract type rather than by geography. Suppliers selling standard units through distribution reprice each quarter and pass movement through quickly. Those bidding lump sum project scope on multi-year delivery schedules carry the full risk between quotation and fabrication. Small specialists sit worst, since they buy exotic alloy in quantities too small to negotiate and cannot hold inventory across the grade range that difficult service demands.
gas-jet-compressor-market-cost-volatility-analysis-1786463159914

Attach alloy index clauses to project quotations

Lump sum engineering procurement contracts written against alloys that reprice weekly leave the supplier carrying a risk it cannot manage across a two-year delivery schedule. Index clauses tied to published stainless and nickel benchmarks are standard throughout the alloy supply chain and translate directly, provided they are agreed at bid stage rather than raised afterwards.

Standardise nozzle and diffuser machining families

Every ejector is sized for its duty, but the machining programmes behind nozzles and diffusers can be organised into families that share setup and tooling rather than being treated as bespoke each time. That cuts skilled machining hours substantially, which is the second largest cost line. The constraint is engineering discipline against a sales habit of promising complete customisation.

Match material grade to actual rather than assumed service

Exotic alloy frequently gets specified against a worst case nobody has measured, and duplex stainless handles a great deal of service that gets quoted in nickel alloy by default. Persuading a client to characterise the stream properly cuts material cost sharply and improves the bid. It also requires the supplier to carry corrosion expertise, which few of them staff for.

Portfolio Architecture for Margin Defence

Margin here tracks how difficult the service is rather than how large the unit happens to be. Standard vacuum and vapour recovery duty is close to a fabrication business, competed against regional shops that build acceptable equipment from a drawing at a fraction of European cost. Sour, abrasive, wide-turndown, and high-vacuum multi-stage service is an engineering business, and it prices as one accordingly.
The volume tension runs between project scope and retrofit work. Greenfield project orders arrive bundled inside licensor packages, come in quantity, and get priced against a bid list the contractor assembled purely on cost. Retrofit and replacement work arrives one unit at a time, requires an engineer to develop the case with the plant, and earns considerably better margins. Suppliers geared entirely to project bidding never build the second business.

High-value pools sit in three places. Guaranteed envelope performance on services that drift, thermocompression retrofits sold on a plant-specific steam balance, and flare recovery scope where the fluid rules out rotating equipment entirely. All three are won by engineering effort ahead of the enquiry rather than by pricing a drawing somebody else prepared.

Volume / Commodity-Adjacent Tier

Standard stainless ejectors for clean vacuum and vapour recovery duty, bid against drawings inside contractor packages. Regional fabricators compete directly, and the range reflects how differently European and Asian cost bases carry identical scope.
Gross Margin: 16-24%

Premium / Certified Tier

Multi-stage vacuum systems and units in duplex or nickel alloy for sour and abrasive service. Corrosion engineering and erosion allowance rather than fabrication skill sustain the margin, since a wrong material selection fails inside a year.
Gross Margin: 28-38%

Sustainability / Regulatory / Next-Generation Tier

Flare recovery scope, thermocompression energy retrofits, and guaranteed envelope performance contracts. The wide range reflects genuinely different economics between regulatory-driven project work and energy retrofits sold directly to operating plants.
Gross Margin: 34-48%
gas-jet-compressor-market-portfolio-architecture-1786463160107

High-value Sub-segments and Strategic Watch-out

Flare Gas Recovery Ejectors

Growing at 8.7% because regulators are forcing recovery of streams that would wreck a compressor within months of commissioning. Available high-pressure gas provides the motive fluid, so unmanned sites need no power supply and no maintenance attendance at all. Nothing else can serve those sites at all.
Gross Margin: 34-46%

Thermocompression Energy Retrofits

Growing on European steam prices rather than on any technology change at all. Payback inside two years on most multiple-effect evaporators, and the order usually appears in nobody's capital plan until a supplier arrives with a proper steam balance. The competitor in most of these deals is inaction.
Gross Margin: 32-44%

Standard Vacuum And Vapour Duty

The volume base of this market and the part regional fabricators contest hardest, since a drawing is a drawing wherever it gets welded. It funds workshop utilisation and provides the reference installations that difficult service work is eventually awarded against. References earned here decide the difficult work later.
Gross Margin: 16-24%

Sour And Abrasive Service Units

High margin because a wrong material or erosion allowance fails within a year and everybody involved remembers it. The watch-out is that exotic alloy content makes these units unusually exposed to nickel price movement between quotation and fabrication. Index clauses are the only real protection available.
Gross Margin: 30-42%

What Follows The Installed Unit

An ejector generates less recurring revenue than almost any other process equipment, and suppliers who ignore that build the wrong business around it. Twenty-five years without moving parts means no seals, no bearings, no lubrication, and no condition monitoring contract. What does recur is erosion: nozzles and diffusers on abrasive service wear predictably, and a supplier tracking its own installed base knows when each one is due.
Stickiness depends almost entirely on how the unit was specified. Equipment supplied against a named-supplier licensor package is effectively locked for the plant's life, because requalifying an alternative means reopening a vacuum system design nobody wants to touch. Performance-specified scope is the opposite and gets rebid every time. Retrofit work sits in between, sticky through the engineer who developed the case rather than through any contractual position.

Buyer profiles have moved toward energy management and away from rotating equipment engineering. The specification used to sit with a mechanical engineer comparing compression options. It increasingly involves whoever owns steam and utility cost, and on flare recovery whoever owns environmental compliance. Those buyers respond to a steam balance or a penalty calculation, not to a datasheet, and most suppliers are still sending datasheets.
gas-jet-compressor-market-end-use-penetration-index-1786463160292

Where To Compete Here

These are among the four positions where our research anticipates prominent divergence between winners and laggards over the coming forecast period. Each is grounded in the demand model, the regulatory perimeter, and the announced capacity pipeline.
01 / ENVELOPE PERFORMANCE GUARANTEE

Guarantee the range, not the design point

Roughly 70% of field complaints involve plants operating well away from the condition the ejector was originally sized for, and most suppliers still quote a single duty because empirical correlations never supported anything more than that. Validated computational modelling allows a guarantee across a stated range of suction and motive conditions, which prices a fifth to a third above single-point quotations. Plants pay that willingly, because the alternative is a warranty argument in which nobody involved is clearly at fault.
02 / TOTAL COST ARGUMENT OWNERSHIP

Answer the energy audit before it lands

Every energy audit shows an ejector consuming three times what a mechanical compressor would need, and that single figure wins the argument unless somebody has already quantified everything sitting around it. Knockout drums, filtration, seal systems, condition monitoring, spares holding, and a maintenance crew add several hundred thousand dollars across a compressor's working life on dirty service. Suppliers who prepare that comparison in advance defend installed positions that efficiency numbers alone would eventually lose to a consultant with a spreadsheet.
03 / FLARE RECOVERY POSITIONING

Chase the fluid nobody else can handle

Flare and vapour recovery streams are wet, frequently sour, and swing in composition with whatever the plant upstream happens to be doing at the time, which is the exact duty that makes rotating equipment unreliable in service. Regulators across the Gulf, North America, and West Africa are now forcing recovery whether or not the economics look attractive. That combination hands ejector suppliers an application in which the competing technology is not merely more expensive but genuinely unsuitable for the duty.
04 / STEAM BALANCE SELLING

Arrive with the plant's numbers, not a brochure

Most evaporation operators have never modelled their own steam economy carefully enough to realise that thermocompression now pays back inside two years at the European energy prices they are currently paying. A supplier who builds that plant-specific balance is creating an order which appeared in nobody's capital plan at all, and competing against nobody for it. It takes a proper application engineer rather than a salesperson to do, which is precisely why so few competitors anywhere are attempting it today.

Engagement Snapshot From the Field

A live engagement with an industry participant carrying material or product regulatory and market exposure ahead of a defining policy shift, showing how our research translates into a defensible multi-year portfolio strategy.
MARKET MINDS ADVISORY · CLIENT ENGAGEMENT SUMMARY
Gas Jet Compressor Producer Strategic Portfolio Review and Transition Roadmap 2026·Investment Scenario on Gas Jet Compressor Exposure Evaluation 2025-26
CLIENT PROFILE
A national oil company operating gathering and processing infrastructure across a mature onshore field system, with routine flaring volumes that regulatory commitments required eliminating within a defined timeframe. Annual capital available for the programme stood near USD 240 million (client-reported, unverified by MMA), spread across several hundred gathering stations of widely varying size and remoteness.
STRATEGIC CHALLENGE
An initial engineering study had specified reciprocating compressors at every recovery point, and the resulting capital estimate exceeded the available budget by a wide margin before any allowance for power supply at unmanned sites. Early pilot installations had also suffered repeated failures on liquid carryover, which raised doubts about whether the approach would work even if funded.
MMA APPROACH
MMA characterised the recovery streams by liquid content, sour gas fraction, and flow variability across a representative sample of stations, then grouped sites by whether high-pressure motive gas was already available locally. Ejector and compressor options were costed on installed capital plus ten-year operating and maintenance exposure rather than on equipment price alone.
KEY FINDINGS
  1. Roughly 62% of gathering stations already had high-pressure gas available on site, making ejector recovery possible without any additional utility or power connection.
  2. Compressor pilot failures traced entirely to liquid carryover rather than to sour content, a condition ejectors tolerated in parallel testing at the same locations.
  3. Installed cost per recovery point using ejectors ran approximately 45% below the compressor case once power supply and knockout equipment were included (client-reported, unverified by MMA).
  4. The remaining stations lacked sufficient motive gas pressure and genuinely required mechanical compression, which concentrated the expensive scope into a manageable minority.
CLIENT PROFILE
A national oil company operating gathering and processing infrastructure across a mature onshore field system, with routine flaring volumes that regulatory commitments required eliminating within a defined timeframe. Annual capital available for the programme stood near USD 240 million (client-reported, unverified by MMA), spread across several hundred gathering stations of widely varying size and remoteness.
STRATEGIC CHALLENGE
An initial engineering study had specified reciprocating compressors at every recovery point, and the resulting capital estimate exceeded the available budget by a wide margin before any allowance for power supply at unmanned sites. Early pilot installations had also suffered repeated failures on liquid carryover, which raised doubts about whether the approach would work even if funded.
MMA APPROACH
MMA characterised the recovery streams by liquid content, sour gas fraction, and flow variability across a representative sample of stations, then grouped sites by whether high-pressure motive gas was already available locally. Ejector and compressor options were costed on installed capital plus ten-year operating and maintenance exposure rather than on equipment price alone.
KEY FINDINGS
  1. Roughly 62% of gathering stations already had high-pressure gas available on site, making ejector recovery possible without any additional utility or power connection.
  2. Compressor pilot failures traced entirely to liquid carryover rather than to sour content, a condition ejectors tolerated in parallel testing at the same locations.
  3. Installed cost per recovery point using ejectors ran approximately 45% below the compressor case once power supply and knockout equipment were included (client-reported, unverified by MMA).
  4. The remaining stations lacked sufficient motive gas pressure and genuinely required mechanical compression, which concentrated the expensive scope into a manageable minority.
RECOMMENDED STRATEGY
Phase 1: Phase one: deploy ejector recovery at the stations with existing high-pressure motive gas, covering the majority of flared volume at the lowest cost per unit recovered. Phase 2: Phase two: reserve mechanical compression for the minority of sites without motive pressure, sizing knockout and filtration properly this time. Phase 3: Phase three: negotiate framework supply on ejector scope rather than tendering each station separately, given the volume and repeatability involved.
OUTCOME
The client redirected the majority of its recovery programme to ejector installations and reported total programme capital falling roughly USD 85 million below the original compressor-based estimate (client-reported, unverified by MMA). Flared volume reduction targets were met within the regulatory timeframe, and the framework supply arrangement cut delivery lead times across the remaining phases.

Frequently Asked Questions

Foundational context covering the market sizes, CAGR, scope, country, region and competition that inform every finding below. This section is provided to cover basics and most often pre-purchase conversations, answered from the MMA Primary Research Dataset.

What is the current size of the Gas Jet Compressor Market?

The market reached USD 0.85 billion in 2025 and is forecast at USD 0.90 billion for 2026. Demand follows process plant construction plus a growing regulatory stream from flare recovery obligation.

How large will the Gas Jet Compressor Market be by 2036?

MMA forecasts USD 1.58 billion by 2036, an increase of USD 0.68 billion over 2026. That represents an expansion multiple of 1.76 times across the forecast period.

What is the CAGR for the Gas Jet Compressor Market 2026 to 2036?

The base case CAGR is 5.8%, with a bull case at 7.0% and a bear case at 4.6%. The bull case depends on flaring enforcement biting rather than being deferred again.

Which segment is growing fastest?

High-pressure gas motive ejectors grow fastest at 8.7%, exactly 1.50 times the market rate. Flare recovery streams are wet, sour, and variable, which is the duty that makes rotating equipment unreliable.

Who are the major companies in the Gas Jet Compressor Market?

Korting Hannover, Graham Corporation, GEA Wiegand, Schutte and Koerting, and Transvac Systems lead the market. The top five hold roughly 46% of gas jet compressor revenue, and all of them are specialists rather than general equipment makers.

Which country is growing fastest?

Saudi Arabia grows fastest at 8.4%, driven by gas processing expansion, thermal desalination thermocompression, and flaring elimination commitments across its gathering infrastructure. Very little of that demand is replacement of existing equipment.

Report Segmentation Architecture

The full report scope spans multiple orthogonal segmentation dimensions, with cross-tabulated demand data provided for each dimension pair. Coverage extends further to regional breakdowns, trend trajectories, and the competitive detail needed to support segment-level decision-making.

By Motive Fluid

  • High-Pressure Gas Motive Ejectors
  • Process Vapour Motive Thermocompressors
  • Liquid Motive Ejectors
  • Air Motive Ejectors
  • Steam Motive Ejectors

By End-Use Industry

  • Refining and Petrochemicals
  • Oil and Gas Production and Processing
  • Chemicals and Fertilisers
  • Food, Dairy and Sugar Processing
  • Power Generation and Desalination

By Commercial Dimension

  • Licensor Package Scope
  • Engineering Contractor Procurement
  • Direct Operator Retrofit Supply
  • Distributor and Stockist Channel
  • Replacement and Spare Parts

By Region

  • East Asia
  • Middle East and Africa
  • North America
  • Western Europe
  • South Asia and Pacific
  • Latin America
  • Eastern Europe

Scope, Methodology, and Coverage

Every figure in this report is reproducible from documented input assumptions. The scope below maps the historical period, the forecast horizon, the segmentation dimensions, and the countries covered, alongside the underlying primary and qualitative methodology.
Historical Period
2020 to 2025
Forecast Period
2026 to 2036
Base Year
2025 (USD billions; MMA Primary Research Dataset, August 2026)
Market Definition
The gas jet compressor market comprises ejectors and thermocompressors that raise the pressure of a suction gas or vapour stream using the kinetic energy of a higher pressure motive fluid expanded through a nozzle, containing no moving parts, valued at manufacturer selling prices to process licensors, engineering contractors, plant operators, and distributors. It spans units driven by high-pressure gas, process vapour, liquid, compressed air, and live steam, in single and multi-stage arrangements, together with the nozzles, diffusers, condensers, and replacement components supplied with them. Mechanical compressors, blowers and fans, liquid ring and dry vacuum pumps, steam turbines, venturi and orifice flow measurement devices, eductors used solely for liquid or solids transfer, and packaged vacuum systems incorporating mechanical stages are excluded.
Quantitative Units
USD billions (current prices); volume in units shipped
Segmentation Dimensions
By Motive Fluid; By End-Use Industry; By Commercial Dimension; By Region
Regions Covered
East Asia, Middle East and Africa, North America, Western Europe, South Asia and Pacific, Latin America, Eastern Europe
Countries Covered
China, Japan, South Korea, Taiwan, India, Singapore, Malaysia, Thailand, Indonesia, Australia, Saudi Arabia, United Arab Emirates, Kuwait, Qatar, Oman, Iraq, Egypt, Algeria, Nigeria, South Africa, USA, Canada, Mexico, Brazil, Argentina, Colombia, Chile, Germany, Netherlands, Italy, France, UK, Belgium, Spain, Poland, Hungary, Romania, Turkey, and additional markets relevant to this sector
Key Companies Profiled
Korting Hannover, Graham Corporation, GEA Wiegand, Schutte and Koerting, Transvac Systems, Croll-Reynolds, Fox Venturi Products, Gardner Denver Nash, Mazda Limited, Venturi Jet Pumps, Ejector Systems, Artisan Industries, Hijet Engineering, Jet Vacuum Systems, Chem Process Systems, Everest Transmission, Wintek Corporation, Kadant Johnson, Sterling SIHI, Gujarat Otofilt
Quantitative Methodology
Primary survey, n=3,800 respondents, Q4 2025, six countries; demand-side model with trade association cross-validation
Qualitative Methodology
47 expert interviews, Q4 2025; applied to validate demand model assumptions, identify emerging dynamics, and assess competitive positioning
Report Format
PDF and XLSX data workbook (Word format preview document)
Publisher
Market Minds Advisory
Report Code
MMA-2026-ENE-631
Published
August 2026
Contact
sales@marketmindsadvisory.com | www.marketmindsadvisory.com

Purchase the full Gas Jet Compressor Market Report (2026 to 2036).

The full report examines gas jet compressor demand across seven regions and five motive fluids, with particular attention to why a thermodynamically poor device keeps winning on fluids that destroy rotating equipment. It quantifies the flare recovery pipeline created by tightening flaring rules and sizes the thermocompression retrofit opportunity that European steam prices have opened. Competitive analysis covers twenty participants assessed on ejector revenue, including how performance-based licensor specification is opening scope to lower-cost fabricators. Regional chapters map process plant capacity and recovery obligation against installed base.
Seven-region process capacity and recovery obligation analysis
Five motive fluid segmentation with growth rates
Twenty participant competitive assessment and engineering positioning
Total cost comparison against mechanical compression on dirty service
Flare recovery project pipeline and payback benchmarking
Thermocompression retrofit sizing against industrial steam prices

Built For The People Who Decide

From boardroom strategy to bench-side execution, this report is read cover-to-cover by leaders shaping the next decade of their industry, turning demand scenarios, market dynamics and valuation benchmarks into decisions.
CXOs/ Presidents/ VPs/ Managers
M&A and Corporate Development
Strategy Teams and R&D Heads
Procurement and Product Directors
Regulatory and Compliance Leaders
Investor Relations and Equity Analysts