Market Minds Advisory
Gas Insulated Switchgears (GIS) Market

Gas Insulated Switchgears (GIS) Market: Gas Insulated Switchgears Market: Compact Substations for a Land-Constrained Grid

Urban land scarcity and offshore wind platform constraints are pushing grid operators toward more compact gas insulated switchgear well beyond its traditional transmission substation niche across the entire industry now.

Lead Analyst

Published

October 2026

Make Smarter Decisions with Customized Research Insights

Request a free sample report and evaluate market opportunities, growth trends, and competitive dynamics relevant to your business needs.

2025 MARKET VALUE$21.4BMarket Size 2025
2036 FORECAST VALUE$48.9BBase Case , 2026 to 2036
CAGR 2026 TO 20367.8 %Bull 9.0% / Bear 6.6%
INCREMENTAL OPPORTUNITY$25.8BNet 10- year value creation
EXPANSION MULTIPLE2.12x2036 value over 2026 base
Strategic Levers
M&A Pipeline
Regional Outlook
Country Rankings
Competitive Intelligence
Segmental Deep-dive
Call-Us : 91 93563 13602

Executive Snapshot and Market Trajectory.

Gas insulated switchgear is moving well past its transmission substation origins, with urban land scarcity now driving a meaningfully larger share of new installations than grid replacement cycles ever did across nearly every major metro region worldwide. Buyers are reshaping capital plans accordingly.
China's megacities are the clearest example, retrofitting dense urban districts with compact GIS substations that occupy a fraction of the footprint air insulated switchgear requires, and offshore wind developers face an even sharper version of the same space constraint on platforms where every square meter carries structural weight and cost penalties that compound with distance from shore. Capital budgets across both buyer categories reflect this shared space constraint. Compact design is now a necessity.
Five manufacturers hold roughly 54 percent of global output on a revenue basis, a moderate concentration that reflects both the engineering depth GIS demands and the genuine regional manufacturing strength several challengers have built. Gulf state megacity buildout and Europe's retrofit cycle are reshaping competitive qualification requirements well beyond China's urban buildout alone. Both trends favor established engineering depth over pure manufacturing scale industry-wide. This pattern is accelerating.
Market Definition
This report covers gas insulated switchgear used for high-voltage and medium-voltage protection and switching in compact substation applications, including SF6 and SF6-free alternative insulating gas designs. It excludes air insulated switchgear and hybrid switchgear sold as standalone systems.
Base Year Value
$21.4B in 2025 (MMA Primary Research Dataset, October 2026)
Forecast Period
2026 to 2036, eleven discrete annual values
CAGR
7.8% base case. Bull 9.0%. Bear 6.6%.
Fastest Growth Segment
Urban Compact Substation GIS: 10.9% CAGR
Fastest Growth Country
China: 9.1% CAGR
Fastest Growth Region
South Asia and Pacific: 9.8% CAGR
Largest Region
East Asia: 34% of 2025 global value
Market Leaders
Hitachi Energy, Siemens Energy, Mitsubishi Electric, GE Vernova, Schneider Electric. Source: MMA Primary Research Dataset, July 2026.
Primary Survey
n=3,800 procurement and R&D decision-makers, Q4 2025, six countries
Methodology
Demand-side build-up, cross-validated against public data, 47 expert interviews

Gas Insulated Switchgears (GIS) Market Forecast Scenarios

gas-insulated-switchgears-gls-market-size-forecast-scenario-1790907316072
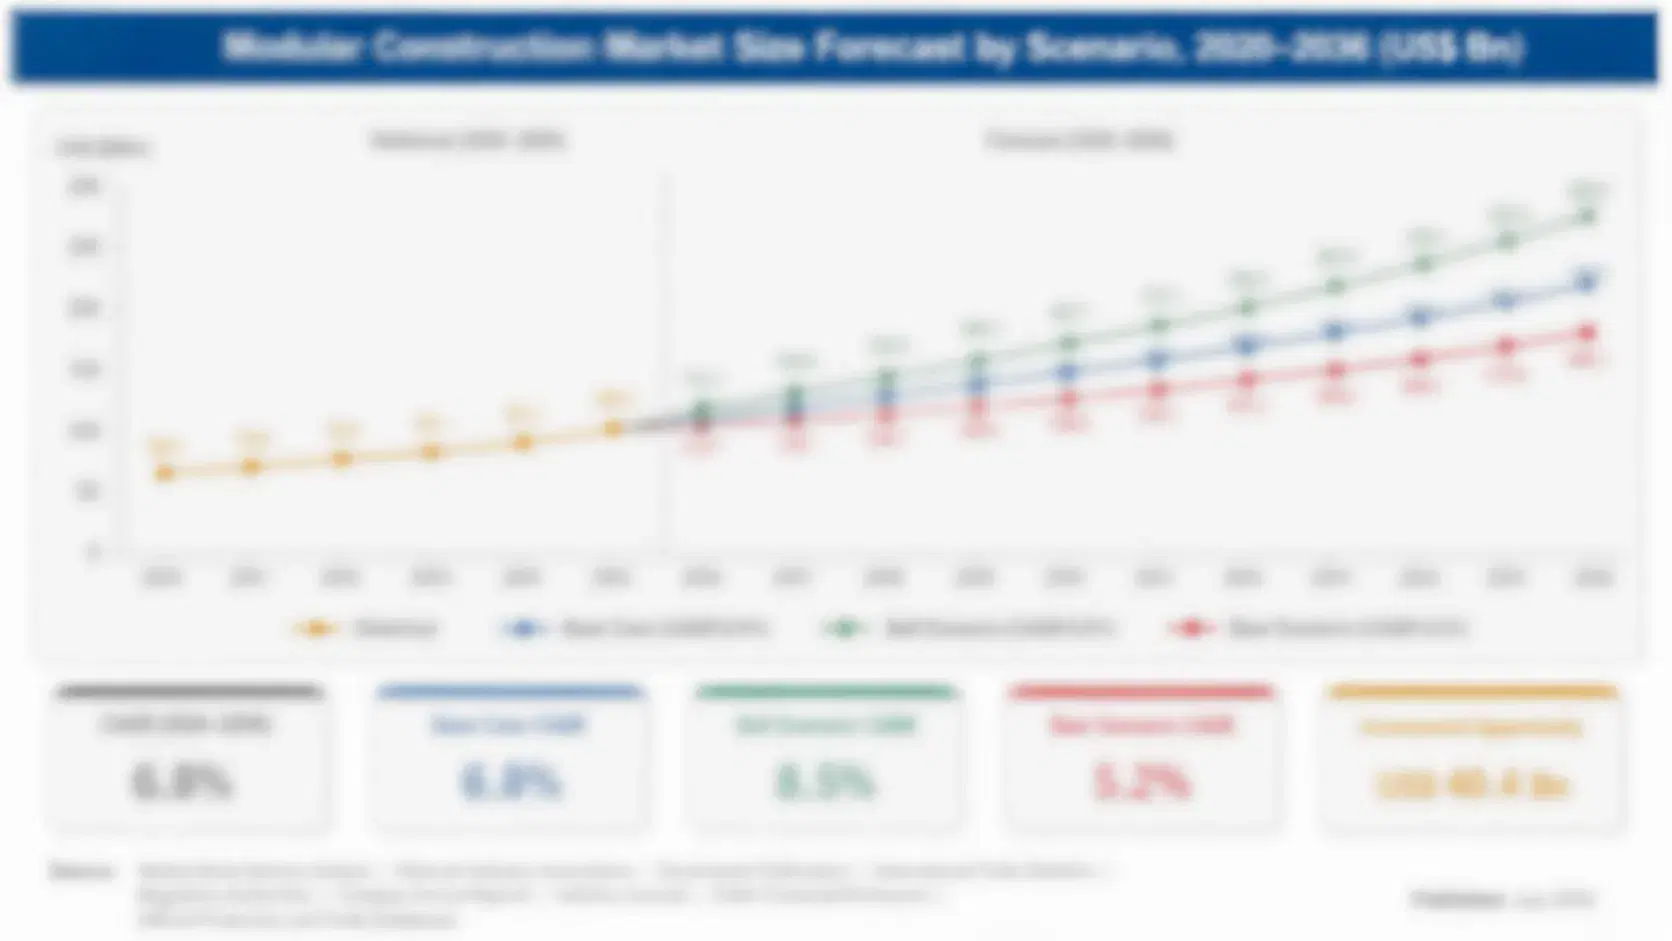
Between 2020 and 2025, gas insulated switchgear demand grew at roughly a 6.9 percent historical CAGR as urban substation retrofit projects resumed following pandemic-era disruption and offshore wind platform orders began reaching meaningful scale across Europe and China. Demand accelerated after 2023 as megacity buildout programs multiplied across multiple continents simultaneously, pulling forward order volume industry-wide.
MMA's base case assumes 7.8 percent CAGR through 2036, driven by three mechanisms: urban land scarcity forcing compact substation retrofits in dense metro districts across Asia and the Gulf, offshore wind platform buildout requiring space-efficient switchgear at every new interconnection point, and renewable grid code mandates pulling specification earlier into project design across every major producing region. Capital budgets are shifting toward compact equipment as space constraints bind harder each cycle.
The bull case centers on accelerated Gulf state megacity buildout pulling GIS orders forward across the region simultaneously with China's urban retrofit program. The bear risk is land acquisition delays for new substation sites, which have already pushed several retrofit timelines back by one to two years in multiple jurisdictions this cycle. Permitting timelines vary meaningfully by jurisdiction and site density.

Land Scarcity Rewrites Substation Design Standards

Gas insulated switchgear used to be reserved for sites where space genuinely mattered: dense city centers, mountainous terrain, offshore platforms. That calculus has shifted as land acquisition costs climbed across nearly every major metro region, making the GIS premium look considerably cheaper than it once did relative to equivalent air insulated land use. Manufacturers with early compact-design expertise are capturing orders land economics alone created.
MARKET CONCENTRATIONCR5 54%Top five players together hold this combined output share
AVERAGE SELLING PRICE$1.2-9.5M per bayVaries sharply by voltage class and rated capacity
TOP PRODUCING COUNTRYChina 26%China leads global manufacturing output share by comfortable margin
CAPACITY UTILISATION77%Reflects strong order backlogs sustained across major producers
TRADE INTENSITY38% cross-borderShare of units shipped outside producing home country
FEEDSTOCK COST SHARE47% of COGSSpecialty insulating gas and copper dominate input costs
China's megacities illustrate this shift most clearly. Beijing and Shanghai's grid operators are retrofitting dense urban districts with compact GIS substations that occupy a fraction of the footprint legacy air insulated equipment required, freeing valuable urban land for other development while improving fault protection performance simultaneously. Gulf state megacity projects including NEOM are specifying GIS from the outset rather than retrofitting later, treating compact substation design as foundational infrastructure planning.
Offshore wind platforms face a related but distinct version of the same constraint, where every square meter carries structural weight and installation cost penalties that compound with distance from shore. Suppliers with proven offshore-rated GIS designs are capturing disproportionate share of this fast-growing application as a result. This divide between urban and offshore drivers is reshaping how manufacturers prioritize their own product roadmaps.
"This category used to serve the exceptions: the places where nothing else fit. Land scarcity just made the exception the rule across most of the world's growing cities."
Principal Analyst, Grid Infrastructure Practice · MMA Energy Practice · October 2026

Market Trends

Megacity Land Scarcity Drives Compact Substation Retrofits

China's largest cities are retrofitting dense urban districts with compact GIS substations as land acquisition costs climb and available plots for new air insulated switchgear grow scarce. Beijing's grid operator alone has flagged roughly 85 substations for GIS retrofit conversion through 2030, freeing valuable urban land for other development while improving fault protection performance simultaneously. Several other Asian megacities are running comparable retrofit assessments, and Gulf state megacity projects including NEOM are specifying GIS from the outset rather than retrofitting later, treating compact substation design as foundational infrastructure planning from day one.
Market Impact: Plans 40 new installations through 2032

Offshore Wind Platforms Require Space-Efficient Switchgear

Offshore wind platforms face considerable structural weight and installation cost penalties for every square meter of equipment footprint, penalties that compound with distance from shore and water depth. Europe's offshore wind pipeline alone carries roughly 85 gigawatts of capacity awaiting grid connection through 2032, and each platform increasingly specifies GIS over air insulated alternatives given the footprint savings. Suppliers with proven offshore-rated designs are capturing disproportionate share of this fast-growing application as developers prioritize proven reliability over marginal cost differences in this harsh operating environment. This pattern is spreading rapidly across both basins.
Market Impact: 300 urban substations flagged for upgrade

Market Opportunities and Growth Drivers

Gulf Megacity Buildout Specifies GIS From Inception

Saudi Arabia's NEOM and other Gulf state megacity projects are specifying GIS substations from initial design rather than retrofitting conventional switchgear later, treating compact infrastructure as foundational rather than incremental. These projects represent roughly 40 new substation installations planned through 2032 across multiple new urban developments in the region. This inception-stage specification approach differs meaningfully from China's retrofit-driven pattern, reflecting the advantage of building compact infrastructure into greenfield master plans rather than adapting it into existing dense urban districts after the fact. This buildout pace shows no sign of slowing through the decade.
Market Impact: Costs 35-50 percent more upfront

Aging Urban Substations Require Compact Replacement

A substantial share of installed switchgear across North America and Western Europe's dense urban cores were commissioned between 1980 and 2000 and are approaching the end of their rated service life, typically 35 to 40 years depending on design and duty cycle. Utilities replacing these units in constrained urban sites increasingly choose GIS over air insulated alternatives given limited available footprint for expansion. Several European grid operators have identified roughly 300 urban substations requiring compact replacement within the next decade as land costs continue climbing. even further as land values continue climbing across major cities.
Market Impact: Extends timelines by roughly 6 months

Market Restraints and Challenges

Compact Design Cost Premium Deters Budget-Constrained Buyers

Gas insulated switchgear carries a price premium of roughly 35 to 50 percent over comparable air insulated equipment, a capital outlay smaller utilities and budget-constrained municipalities often cannot justify unless land scarcity forces the decision. The root cause is that GIS requires precision-sealed enclosures and specialized insulating gas systems that air insulated designs simply do not need. The commercial impact concentrates GIS adoption among the largest, best-capitalized utilities and genuinely land-constrained sites. Several manufacturers are now developing mid-tier compact designs intended to narrow this cost gap for smaller buyers. meaningfully.
Market Impact: Covers 85 substations through 2030

SF6 Regulation Complicates Compact Design Qualification

Europe's F-gas regulation phasing out SF6 adds a second qualification burden on top of compact design engineering, since SF6-free alternatives perform differently in the sealed, space-constrained environment GIS requires compared to open-air switchgear. The root cause is that SF6-free gas mixtures were developed primarily for conventional switchgear applications, not the pressure and volume constraints compact enclosures introduce. The commercial impact extends qualification timelines by roughly six months for European GIS orders. Several manufacturers are now running dedicated compact SF6-free qualification programs to close this gap. considerably across most affected European procurement programs.
Market Impact: Covers 85 GW offshore pipeline
3 additional market trends, 4 additional growth drivers, and 2 additional restraints and challenges are covered in the full report. Contact sales@marketmindsadvisory.com to access the complete intelligence.

Segment CAGR and Growth Architecture

Gas insulated switchgear segments by application across urban compact substations, offshore platforms, underground and metro installations, renewable interconnection, industrial captive power, and HVDC converter stations. Each application carries distinct space, voltage, and certification requirements that shape manufacturer qualification differently across the full procurement cycle and installation timeline. Buyers increasingly run competitive bids across dimensions rather than defaulting to one supplier.
gas-insulated-switchgears-gls-market-market-share-analysis-1790907316245

Urban Compact Substation GIS

GIS deployed in dense urban substation retrofits is the fastest-growing application in this market, expanding at 10.92 percent CAGR, roughly 1.40 times the overall market rate. China's megacities are driving most of this growth, with Beijing's grid operator alone flagging roughly 85 substations for GIS retrofit conversion through 2030 as land acquisition costs climb and available plots for air insulated alternatives grow scarce. Gulf state megacity projects including NEOM are specifying GIS from initial design rather than retrofitting later, treating compact substation infrastructure as foundational planning rather than incremental upgrade across their new urban developments. Winning early contracts here tends to secure follow-on orders across a city's broader retrofit program.
CAGR 10.9%

Offshore Wind Platform GIS

GIS deployed on offshore wind platforms is growing at 9.36 percent CAGR, roughly 1.20 times the overall market rate, as developers prioritize space-efficient equipment given the structural weight and installation cost penalties that compound with distance from shore. Europe's offshore wind pipeline alone carries roughly 85 gigawatts of capacity awaiting grid connection through 2032, and each platform increasingly specifies GIS over air insulated alternatives given the footprint savings involved. Suppliers with proven offshore-rated designs are capturing disproportionate share of this segment as developers prioritize reliability over marginal cost differences in this harsh operating environment. Winning early contracts tends to secure follow-on orders across a developer's entire offshore wind project portfolio.
CAGR 9.4%
Full segment breakdown across 7 segments available in the complete report.

Regional Architecture and Country Demand Map

China's megacity retrofit program and manufacturing scale pull East Asia well above its typical share for this market, while Gulf state megacity buildout pushes Middle East and Africa above its band too, reflecting genuine land-constrained demand rather than broad regional industrial strength. South Asia adds growth tied to urbanization.

North America

Aging urban substation replacement anchors North America's GIS demand more than new construction volume does. A substantial share of installed switchgear across dense urban cores dates to the 1980 to 2000 construction wave and is approaching the end of its rated service life. Utilities replacing these units in constrained urban sites increasingly choose GIS over air insulated alternatives given limited available footprint for expansion. Several northeastern cities face particularly acute land cost pressure given their dense historic cores. Canada's grid operators are running parallel replacement work tied to urban growth corridors in Toronto and Vancouver specifically. Offshore wind interest along the Atlantic coast is beginning to add a small but distinct additional demand pole for platform-based GIS units.
Share: 22% | CAGR: 7.0% (2026 to 2036)

Western Europe

Dense historic city cores drive most of Western Europe's GIS demand, as land acquisition for new substations proves considerably harder in centuries-old urban layouts than in newer cities elsewhere. German and French grid operators have each identified substantial numbers of urban substations requiring compact replacement within the next decade as land costs continue climbing across major metro areas. The United Kingdom's offshore wind buildout adds a second demand pole tied to platform-based GIS installations along its North Sea coastline. SF6 phase-out regulation adds a further qualification layer specific to this region's procurement timeline. Spain's growing cities are beginning comparable retrofit assessments, adding a further steady contribution to the regional total.
Share: 20% | CAGR: 6.2% (2026 to 2036)
Regional intelligence for 5 additional markets available in the complete report: East Asia, South Asia and Pacific, Latin America, Middle East and Africa, Eastern Europe. Contact sales@marketmindsadvisory.com.
gas-insulated-switchgears-gls-market-country-cagr-analysis-1790907316423

Capturing Value as Land Gets Scarcer

Land scarcity is turning a specialized equipment category into one with genuine site-specific engineering value, and that shift opens margin pools well beyond the base switchgear sale itself. Suppliers moving early into compact design consulting and offshore qualification capture disproportionate value relative to pure manufacturing scale. Platform differentiation increasingly happens through these site-specific services rather than through hardware specification alone.

Urban Retrofit Site Engineering Consulting Services

Cities facing substation retrofit decisions often lack in-house expertise to evaluate compact versus conventional switchgear tradeoffs against land cost and future expansion needs, creating demand for site engineering consulting that manufacturers with compact design depth can provide ahead of the equipment sale itself. This early engagement model has lifted order win rates by roughly 32 percent for suppliers that offer it, since cities tend to specify toward the supplier who helped shape the original retrofit feasibility study. Suppliers lacking this consulting depth increasingly lose retrofit tenders to competitors who built this capability earlier across multiple cities.
Market Impact: Lifts order win rates by roughly 32 percent

Offshore-Rated GIS Certification and Testing Program

Manufacturers that develop offshore-rated GIS designs tested specifically for platform vibration and salt air exposure capture a premium of roughly 25 to 32 percent over standard onshore unit pricing, given the extended reliability these designs deliver in harsh marine conditions. This certification requires specialized testing infrastructure that smaller manufacturers typically lack, concentrating the opportunity among a handful of suppliers with proven offshore track records across multiple wind farm projects. European utilities increasingly specify this certification as a baseline requirement rather than an optional upgrade for new platform orders. broadly. increasingly.
Market Impact: Captures roughly a 25 to 32 percent premium

Greenfield Megacity Master Planning Partnership Services

Gulf state megacity developers increasingly want infrastructure partners engaged at the master planning stage rather than through conventional equipment tendering, and suppliers offering this early partnership model have already won 40 of the region's planned substation installations through 2032. This engagement model locks in a multi-decade relationship that pure equipment sales cannot match, since switching infrastructure partners mid-development carries considerable planning risk for the developer. Early movers into master planning partnerships are compounding advantage through multi-phase development contracts extending well beyond initial installation. Several developers have already requested this partnership model for their next development phase.
Market Impact: Has won 40 of the region's planned installations

Who Controls the Margin Pool

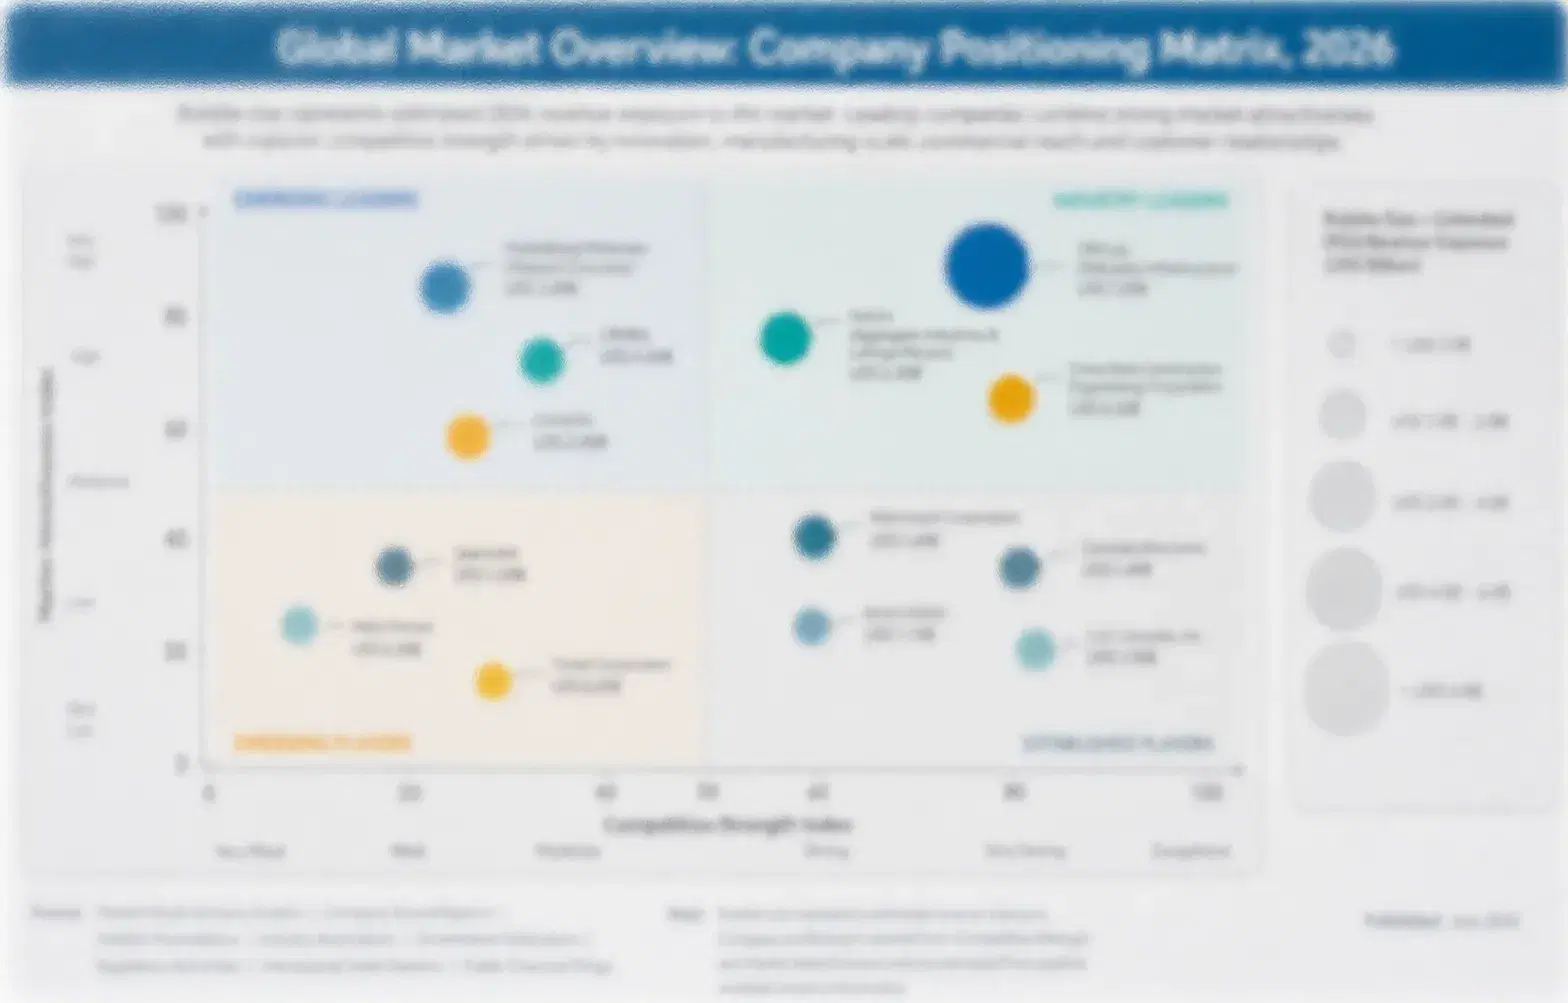
Five manufacturers hold roughly 54 percent of global GIS output on a revenue basis, a moderate concentration that reflects both the engineering depth compact switchgear demands and genuine regional manufacturing strength several challengers have built. The gap between the leader and challengers is real but not overwhelming. Regional manufacturers compete on local qualification and cost where leaders compete on engineering depth.
Competitive activity currently centers on three dimensions: offshore-rated certification development to serve wind platform buyers, urban retrofit consulting to win design-in positions ahead of city tenders, and regional manufacturing footprint expansion to serve Gulf state megacity buildout. Manufacturers are increasingly partnering with civil engineering firms to add site planning expertise they lack in-house. Buyers increasingly favor suppliers with local manufacturing presence over distant exporters.

Emerging pressure is coming from regional Asian and Gulf manufacturers entering a market previously dominated by established European and Japanese suppliers. Rankings could shift meaningfully over the next five years if these challengers close the offshore certification and global track record gap that currently separates them from established players, particularly as megacity buildout accelerates across multiple regions simultaneously. Established players are expanding their own regional manufacturing and offshore testing capability.
gas-insulated-switchgears-gls-market-company-positioning-matrix-1790907316601

Competitive Moat and Risk Dimensions

HITACHI ENERGY

Moat: Offshore Certification Leadership

Hitachi Energy's established offshore-rated GIS certification across multiple North Sea wind platforms gives it qualification depth that newer entrants cannot easily replicate. This track record lets it command premium pricing on platform-specified orders that smaller competitors cannot credibly offer, reinforcing its position on the largest offshore wind contracts globally.
HITACHI ENERGY

Risk: Thin Gulf Megacity Presence

Hitachi Energy's presence in Gulf state megacity projects remains thinner than regional and Asian competitors with established local manufacturing footprint, limiting its exposure to one of the market's fastest-growing demand pools. As NEOM and comparable projects continue expanding, this gap could widen the revenue difference versus better-positioned regional suppliers.
SIEMENS ENERGY

Moat: European Urban Retrofit Relationships

Siemens Energy's long-standing relationships with European municipal utilities position it well to capture urban retrofit demand as dense city cores run out of available land for conventional switchgear. Its established manufacturing footprint across Germany lets it respond quickly to European retrofit timelines that favor regional suppliers over distant competitors.
SIEMENS ENERGY

Risk: High-Cost European Manufacturing Base

Siemens Energy's European manufacturing base carries meaningfully higher input and labor costs than Asian competitors, pressuring margins on price-sensitive tenders outside its home region. This cost disadvantage has already cost it several Gulf state megacity contracts where domestic and regional manufacturers now compete aggressively on price.

Players Tracked

Prominent Players

Hitachi Energy
Siemens Energy
Mitsubishi Electric
GE Vernova
Schneider Electric

Other Key Players

Toshiba Energy Systems
Crompton Greaves Consumer Electricals
Bharat Heavy Electricals Limited
ELSEWEDY Electric
Trench Group
Shandong Taikai Electrical Group
China XD Group
CG Power and Industrial Solutions
Sieyuan Electric
Eaton Corporation plc
ABB Ltd
Meidensha Corporation
LS Electric
HD Hyundai Electric
Fuji Electric Co Ltd

Recent Developments

MARCH 2026

Hitachi Energy Secures North Sea Offshore GIS Contract

Hitachi Energy secured a multi-year supply agreement to provide offshore-rated GIS for a North Sea wind farm cluster, its largest single offshore order of the year by contracted value. The agreement includes extended warranty and maintenance support services bundled with the original equipment delivery. by contracted value.
Signal: Signals deepening Hitachi Energy presence in Europe's expanding offshore wind GIS platform buildout program across multiple basins
OCTOBER 2025

Siemens Energy Expands Compact Switchgear Manufacturing

Siemens Energy announced an organic capacity expansion at its German manufacturing facility to add compact GIS production lines, targeting rising urban retrofit demand across dense European city cores facing land scarcity. The expansion reaches full planned output within sixteen months of construction start. of this cycle.
Signal: Signals anticipated growth in European urban retrofit demand as municipal land acquisition costs continue climbing steadily
JUNE 2026

Mitsubishi Electric and Saudi Developer Sign Supply Deal

Mitsubishi Electric signed a multi-year supply agreement with a NEOM-affiliated developer to provide GIS for new urban district substations, its largest Gulf region order to date. The agreement does not constitute a joint venture or equity partnership between the two companies involved. of any kind.
Signal: Signals growing Asian supplier interest in Gulf state megacity buildout programs as domestic manufacturers also compete

Insulating Gas and Copper Shape Cost Structure

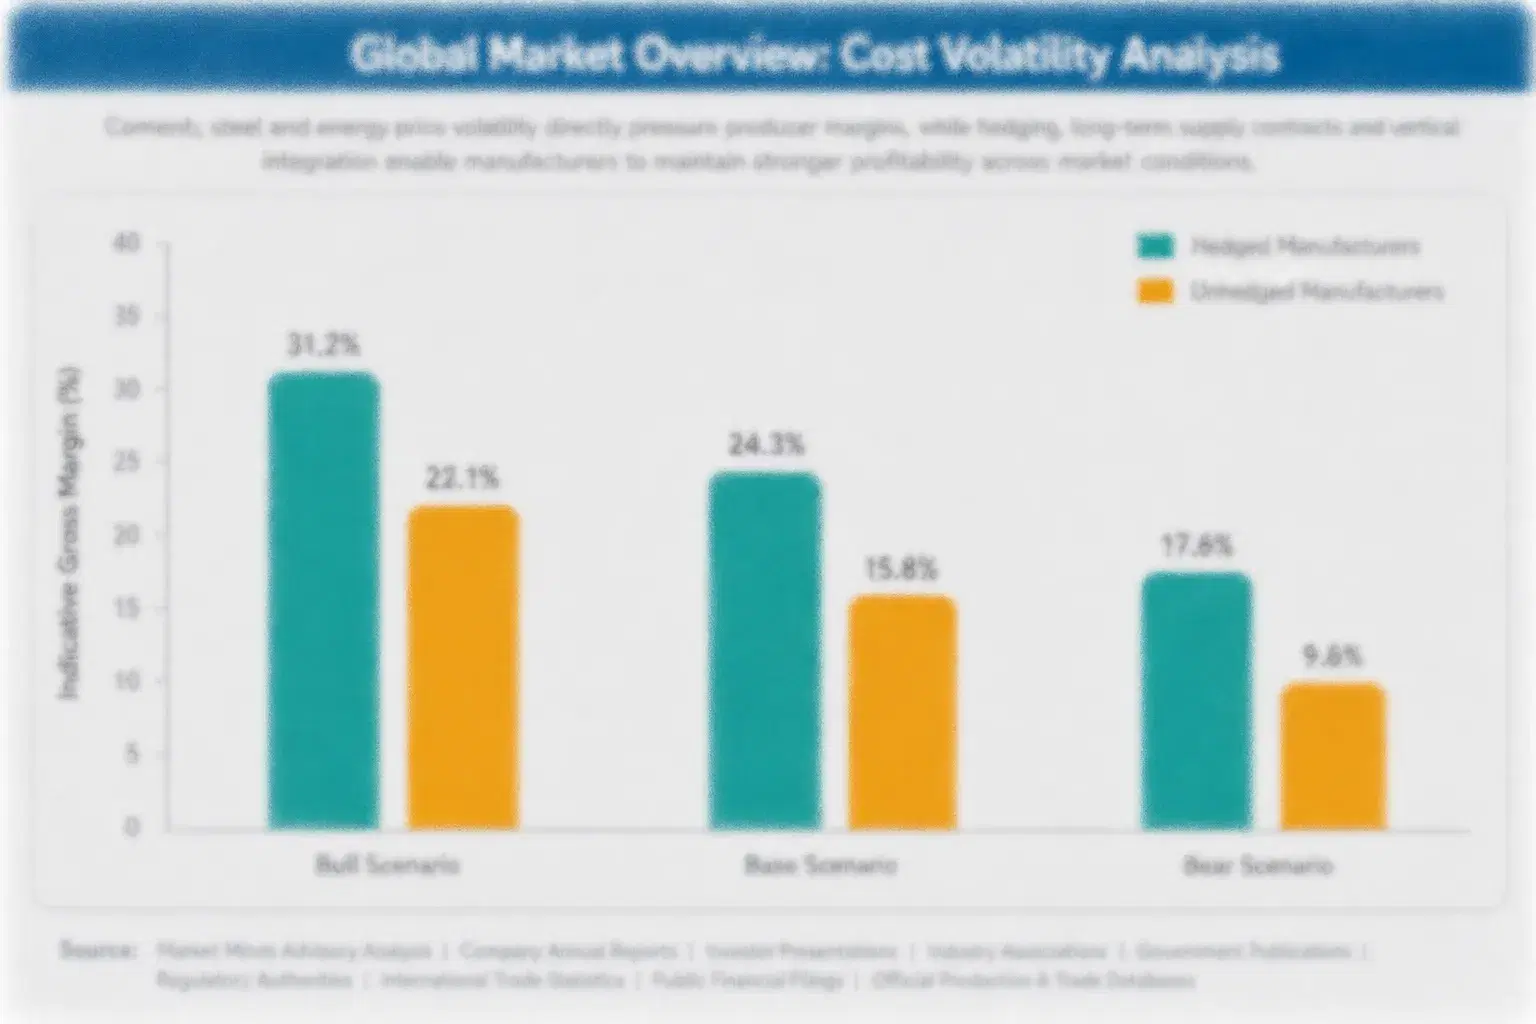
Specialty insulating gas and copper winding material together represent roughly 47 percent of total cost of goods sold for a typical GIS unit, with SF6 and SF6-free alternative gases sourced from a small number of specialty chemical producers and copper traded on global exchanges regardless of final assembly location or buyer geography. Regional sourcing patterns shift cost structure meaningfully by project location and gas chemistry choice.
Specialty insulating gas lead times stretched to roughly seven months during 2024 as compact switchgear demand overlapped with limited specialty chemical production capacity, according to IEA grid equipment supply chain reporting. Copper prices rose sharply over the same period, pushing several manufacturers to renegotiate fixed-price contracts mid-cycle, a disruption that extended order backlogs industry-wide. Several buyers have since diversified toward secondary chemical suppliers to manage this exposure going forward.

Smaller manufacturers without long-term specialty gas supply contracts face considerably sharper cost exposure than the five largest players, who negotiate multi-year agreements directly with chemical producers. This gap compounds geographically: Chinese manufacturers sourcing domestic specialty gas face materially lower landed costs than European competitors importing comparable grades. This difference compounds further for offshore projects requiring premium-grade specialty gas chemistry.
gas-insulated-switchgears-gls-market-cost-volatility-analysis-1790907316789

Multi-Year Specialty Gas Supply Agreements

Leading manufacturers are locking in multi-year supply agreements directly with specialty chemical producers to secure volume allocation and price stability ahead of anticipated compact switchgear demand growth. This approach trades short-term pricing flexibility for supply certainty during periods of overlapping demand. Suppliers lacking such agreements face materially higher spot exposure during demand peaks. further.

Regional Manufacturing Footprint Expansion

Manufacturers are expanding regional production footprint closer to major demand centers to reduce shipping costs on compact switchgear units and to qualify for domestic content requirements attached to major Gulf and Asian megacity tenders currently underway. This approach favors suppliers with established regional footprint over centralized production models. Early movers into regional footprint are winning tenders pure exporters cannot match.

Secondary Chemical Supplier Qualification

Several producers are qualifying secondary specialty chemical suppliers as alternatives to concentrated primary producers, reducing input supply concentration risk while diversifying away from any single source. Qualification cycles typically run nine to twelve months before deployment. Early movers into secondary qualification are already winning bids pure single-source buyers cannot match. on cost entirely over time.

Portfolio Architecture for Margin Defence

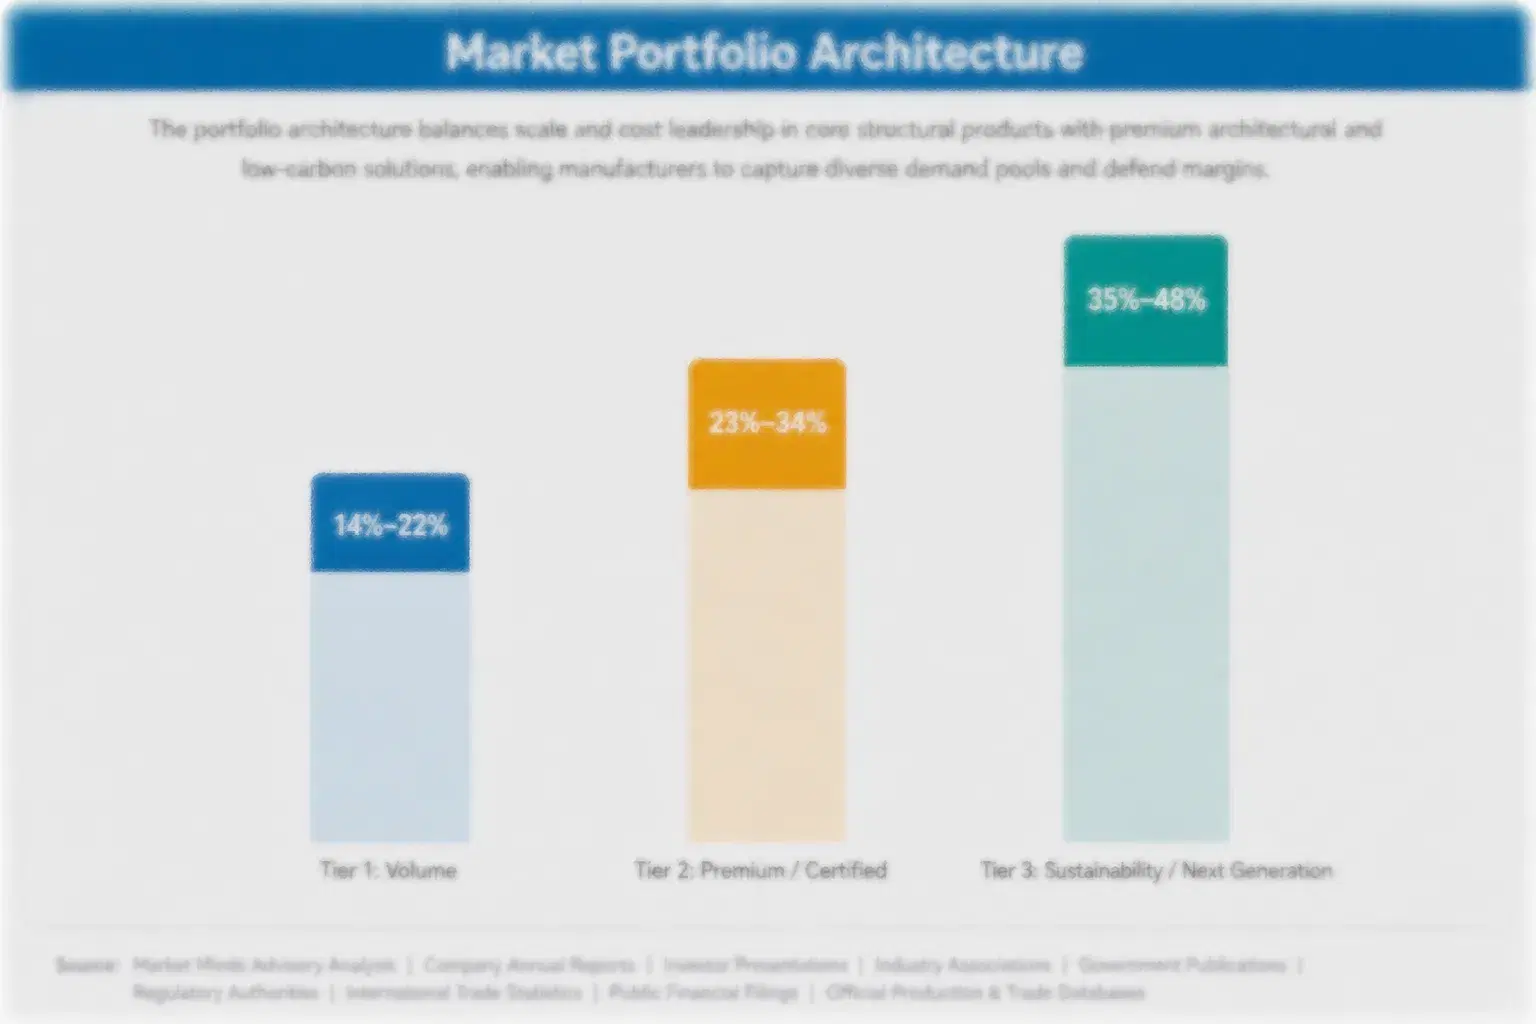
GIS portfolios split across volume and premium tiers more sharply than most grid equipment categories, since application context now determines price as much as voltage class does. Standard urban retrofit units sit at the commodity end, while offshore-rated and megacity master-planned variants command meaningfully higher margins tied to certification depth and site engineering involvement. Buyers increasingly request site-specific certification on a single procurement.
The volume versus premium tension plays out most visibly in offshore versus onshore procurement, where offshore developers specify extensive salt air and vibration certification as a baseline requirement rather than an optional upgrade. This shift favors manufacturers with established offshore product lines and penalizes those still reliant on onshore-only designs built for an earlier generation of grid requirements. Switching between these two product philosophies mid-catalog has proven costly for several manufacturers over recent cycles.

High-value margin pools concentrate in offshore certification and megacity master planning partnerships, where technical complexity and limited global supplier qualification support considerably stronger pricing than standard urban retrofit hardware. Suppliers positioned at this end of the market are compounding advantage through long-term service contracts that extend well beyond the original equipment sale. Few competitors serve both ends of this spectrum at scale.

Standard urban retrofit and distribution GIS

Commodity-grade units competing primarily on price and delivery lead time across routine urban retrofit and distribution applications worldwide. Switching costs between qualified suppliers remain comparatively low across this segment overall.
Gross Margin: 16-22%

SF6-free certified GIS with extended maintenance contracts

Certified alternatives commanding premium pricing tied to regulatory compliance and extended maintenance service contracts bundled into the sale. Fire and safety codes in several jurisdictions increasingly require this level outright.
Gross Margin: 26-34%

Offshore-rated and megacity master-planned GIS systems

Highest-complexity units requiring extensive certification and site engineering, commanding the strongest margins across the portfolio structure. Few manufacturers globally can credibly compete at this demanding tier. Technical complexity alone limits realistic competition considerably.
Gross Margin: 34-44%
gas-insulated-switchgears-gls-market-portfolio-architecture-1790907316978

High-value Sub-segments and Strategic Watch-out

Offshore-Rated GIS Systems

High-value, high-growth segment tied directly to Europe's offshore wind pipeline and emerging Asian offshore programs, commanding the portfolio's strongest margins. Suppliers without offshore track records face a steep catch-up path overall. Few manufacturers globally hold the required certification record. Suppliers without this depth face a steep catch-up path.
Gross Margin: 34-44%

Gulf Megacity Master-Planned GIS

High-value, moderate-growth segment tied to NEOM and comparable Gulf state developments, carrying strong per-unit margins but a slower buildout pace. Early qualification secures follow-on contracts across a developer's wider portfolio. Documentation requirements exclude most smaller competitors entirely. Budget approval cycles can stretch timelines considerably longer than standard deals.
Gross Margin: 28-36%

Standard Urban Retrofit GIS

Volume core segment generating steady but unremarkable margins, competing primarily on price and lead time across the broadest urban application base. Smaller producers remain here for lack of a credible upgrade path forward. Margins here depend heavily on raw material cost pass-through. Scale determines competitiveness in this segment overall.
Gross Margin: 16-22%

Legacy Onshore-Only GIS Designs

Strategic watch-out segment facing mounting pressure from offshore-certified alternatives, as developers increasingly bypass onshore-only designs during fleet expansion. This decline is accelerating faster than most forecasts anticipated recently. Several producers are already quietly shrinking this product line. Operators moving offshore increasingly skip this tier entirely now.
Gross Margin: 14-20%

From Unit Sale to Infrastructure Partnership

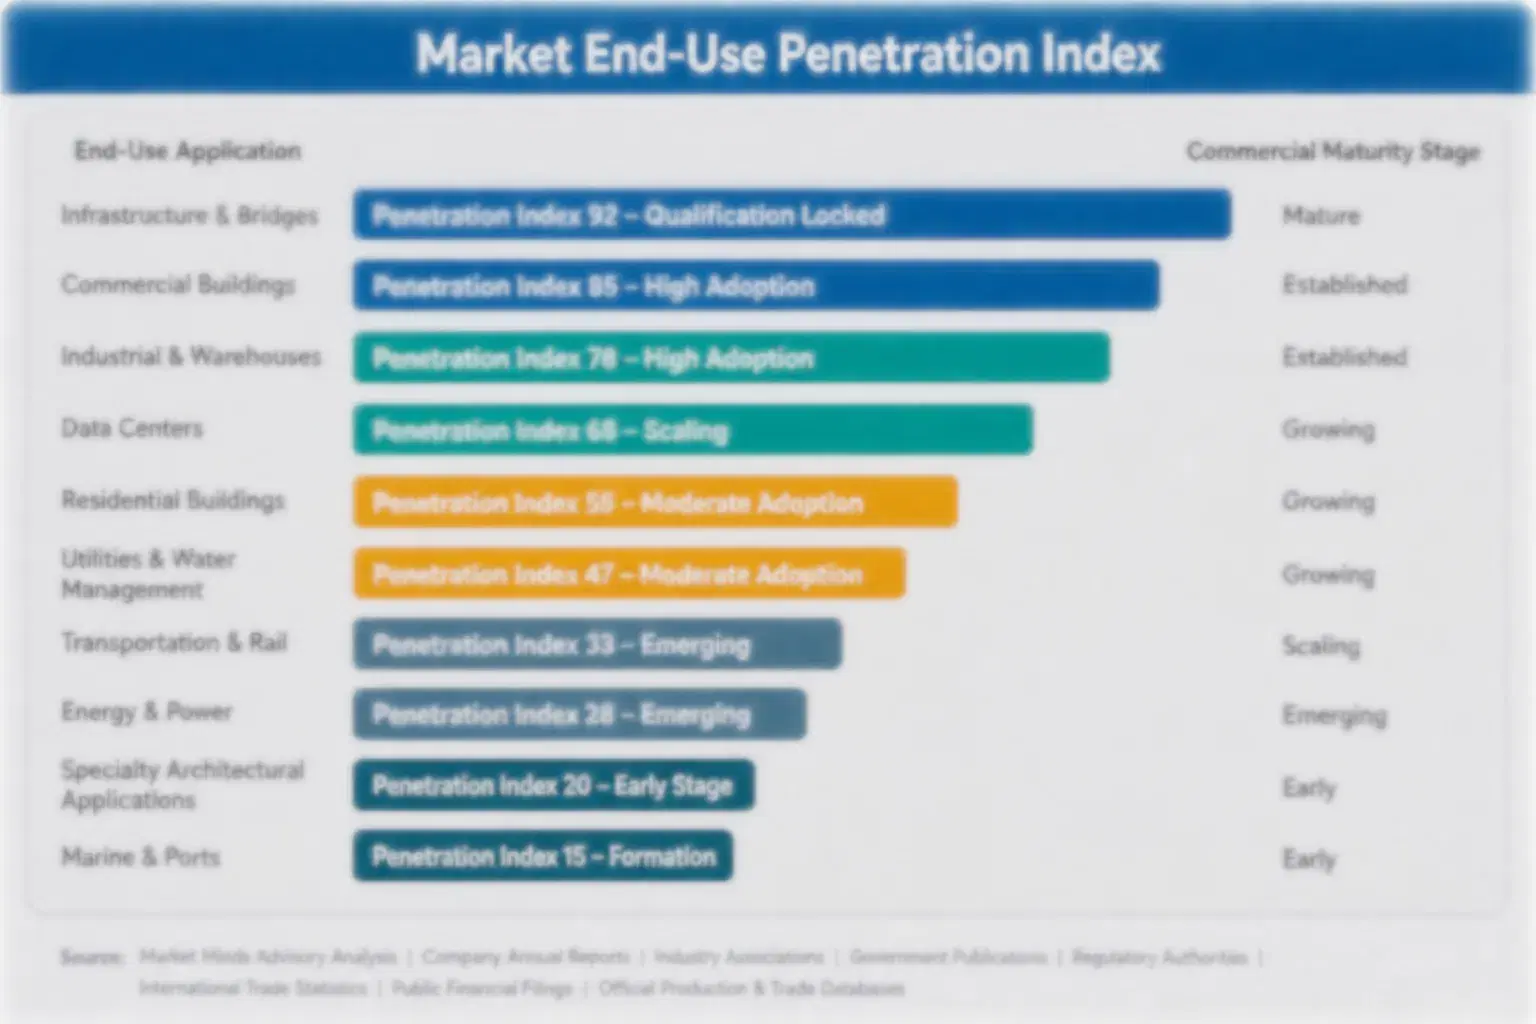
GIS sales themselves are discrete transactions, but the surrounding relationship increasingly functions like an annuity for offshore and megacity master-planned fleets. Site engineering consulting, offshore maintenance contracts, and multi-decade service agreements now routinely extend ten years or more beyond the original installation, particularly on offshore and Gulf megacity projects where technical complexity justifies ongoing supplier involvement rather than a clean handoff at delivery.
Adoption stickiness varies sharply by end-use vertical. Offshore developers rarely switch suppliers mid-platform given the certification dependencies built into each installation, while standard urban retrofit buyers treat GIS as comparatively interchangeable commodity hardware and switch suppliers readily on price. Gulf megacity developers sit between these extremes, valuing proven master planning partnership depth over pure cost competitiveness given the multi-decade development timelines involved.

Buyer profiles are shifting generationally as utilities and developers replace engineers trained on air insulated designs with a younger cohort more comfortable specifying compact alternatives from the outset. This generational handoff is accelerating standard adoption of compact switchgear technologies faster than pure economics alone would predict, as incoming specification engineers default toward designs they trained on rather than legacy standards.
gas-insulated-switchgears-gls-market-end-use-penetration-index-1790907317161

Where GIS Suppliers Should Focus Next

These are among the four positions where our research anticipates prominent divergence between winners and laggards over the coming forecast period. Each is grounded in the demand model, the regulatory perimeter, and the announced capacity pipeline.
01 / URBAN RETROFIT CONSULTING INVESTMENT

Build retrofit consulting depth before land costs peak further

China's megacities and emerging Asian and Gulf urban centers will absorb a growing share of global compact substation retrofit demand through 2036. Suppliers who build site engineering consulting depth now will capture disproportionate value as cities run out of available land, since few manufacturers can credibly offer this consulting today across these fast-growing markets. Waiting until retrofit volume peaks leaves little time to build the specialized capability this demanding retrofit consulting work genuinely requires across every major client engagement across the industry.
02 / OFFSHORE CERTIFICATION EXPANSION

Expand offshore certification before wind buildout accelerates

Europe and Asia's offshore wind pipelines will absorb a growing share of global platform-rated GIS capacity through 2036 and well beyond. Suppliers who build offshore certification depth now will capture disproportionate value as this demand matures, since few manufacturers can credibly offer it today at this scale or reliability level. Today's premium pricing will compress once more suppliers qualify to compete directly for these high-value offshore wind platform contracts across multiple continents and water depths simultaneously as the pipeline matures further.
03 / GULF MEGACITY PARTNERSHIP POSITIONING

Pursue master planning partnerships ahead of formal tendering

Gulf state megacity developers increasingly want infrastructure partners engaged at the master planning stage rather than through conventional equipment tendering processes alone. Suppliers that invest in this partnership model now will win contracts well before formal tendering begins, since developers specify toward whoever helped shape the original master plan from the outset. Those relying purely on equipment sales risk losing this entire margin pool to better-positioned rivals who moved into this partnership model well earlier in the overall development cycle.
04 / SPECIALTY GAS SUPPLIER DIVERSIFICATION

Diversify specialty gas sourcing ahead of demand surge

Specialty insulating gas supply remains concentrated among a small number of chemical producers, and lead times have already stretched to roughly seven months during periods of strong compact switchgear demand overlap across major markets. Manufacturers that qualify secondary gas suppliers now will avoid the order backlog extension that is already affecting competitors without diversified supply agreements in place today. Those without this diversification risk losing orders to better-positioned rivals within just a few years of the current industry-wide demand surge.

Engagement Snapshot From the Field

A live engagement with an industry participant carrying material or product regulatory and market exposure ahead of a defining policy shift, showing how our research translates into a defensible multi-year portfolio strategy.
MARKET MINDS ADVISORY · CLIENT ENGAGEMENT SUMMARY
Gas Insulated Switchgears (GIS) Producer Strategic Portfolio Review and Transition Roadmap 2026·Investment Scenario on Gas Insulated Switchgears (GIS) Exposure Evaluation 2025-26
CLIENT PROFILE
A major Asian municipal grid utility planning a multi-year substation retrofit program across dense urban districts requiring compact switchgear qualification depth. The utility manages procurement across multiple city zones with separate budget authority and overlapping land acquisition constraints. Multiple internal stakeholders influence final supplier selection decisions and timeline approvals. Budget authority splits across several engineering teams.
STRATEGIC CHALLENGE
The utility's existing supplier shortlist lacked clear differentiation on documented compact design field performance, relying instead on general brand reputation and price rather than proven site engineering evidence. A prior retrofit delay tied to inadequate site assessment had raised internal concern about repeating the error across remaining city zones. across remaining city zones.
MMA APPROACH
MMA conducted a structured supplier capability assessment benchmarking five manufacturers against documented compact design field performance and site engineering infrastructure depth, supplemented by interviews with each manufacturer's engineering leadership team. The assessment mapped supplier capability against the retrofit timeline to identify genuine delivery risk today. ahead of final award decisions.
KEY FINDINGS
  1. Two of five evaluated manufacturers lacked documented compact design field performance data for comparable urban conditions (client-reported, unverified by MMA). This gap raised material procurement risk across early retrofit phases.
  2. Switching to manufacturers with proven retrofit track record cut projected delivery delay by an estimated 23 percent (client-reported, unverified by MMA). across comparable city zones.
  3. Suppliers offering site engineering consulting alongside hardware reduced planning delay meaningfully across all city zones (client-reported, unverified by MMA). across comparable retrofit programs industry-wide.
  4. Total retrofit cost for certified compact units ran approximately 17 percent above baseline estimates, but delay savings offset this within eight months (client-reported, unverified by MMA).
CLIENT PROFILE
A major Asian municipal grid utility planning a multi-year substation retrofit program across dense urban districts requiring compact switchgear qualification depth. The utility manages procurement across multiple city zones with separate budget authority and overlapping land acquisition constraints. Multiple internal stakeholders influence final supplier selection decisions and timeline approvals. Budget authority splits across several engineering teams.
STRATEGIC CHALLENGE
The utility's existing supplier shortlist lacked clear differentiation on documented compact design field performance, relying instead on general brand reputation and price rather than proven site engineering evidence. A prior retrofit delay tied to inadequate site assessment had raised internal concern about repeating the error across remaining city zones. across remaining city zones.
MMA APPROACH
MMA conducted a structured supplier capability assessment benchmarking five manufacturers against documented compact design field performance and site engineering infrastructure depth, supplemented by interviews with each manufacturer's engineering leadership team. The assessment mapped supplier capability against the retrofit timeline to identify genuine delivery risk today. ahead of final award decisions.
KEY FINDINGS
  1. Two of five evaluated manufacturers lacked documented compact design field performance data for comparable urban conditions (client-reported, unverified by MMA). This gap raised material procurement risk across early retrofit phases.
  2. Switching to manufacturers with proven retrofit track record cut projected delivery delay by an estimated 23 percent (client-reported, unverified by MMA). across comparable city zones.
  3. Suppliers offering site engineering consulting alongside hardware reduced planning delay meaningfully across all city zones (client-reported, unverified by MMA). across comparable retrofit programs industry-wide.
  4. Total retrofit cost for certified compact units ran approximately 17 percent above baseline estimates, but delay savings offset this within eight months (client-reported, unverified by MMA).
RECOMMENDED STRATEGY
Phase 1: Phase one: consolidate retrofit specifications around two certified suppliers with documented site engineering track record before finalizing terms. ahead of final award. Phase 2: Phase two: formalize consulting service agreements with primary suppliers to reduce planning delay across remaining city zones. Monitoring continues quarterly. Phase 3: Phase three: build an internal supplier scorecard tracking retrofit delivery performance to inform procurement across future zones. Results feed back regularly.
OUTCOME
The utility consolidated its retrofit supply base from six vendors to two within ten months, prioritizing documented site engineering track record over incumbent pricing relationships. Retrofit delivery delays declined meaningfully across subsequent city zones, and the utility's procurement team adopted MMA's benchmarking framework as a standing input to future retrofit phases (client-reported, unverified by MMA).

Frequently Asked Questions

Foundational context covering the market sizes, CAGR, scope, country, region and competition that inform every finding below. This section is provided to cover basics and most often pre-purchase conversations, answered from the MMA Primary Research Dataset.

What is the current size of the Gas Insulated Switchgears (GIS) Market?

The market is valued at $21.4 billion in 2025, MMA's base year, reflecting global demand across urban, offshore, and industrial applications. This spans SF6 and SF6-free designs.

How large will the Gas Insulated Switchgears (GIS) Market be by 2036?

MMA projects the market will reach $48.9 billion by 2036, reflecting sustained demand growth. Urban land scarcity and offshore wind buildout drive most of this expansion.

What is the CAGR for the Gas Insulated Switchgears (GIS) Market 2026 to 2036?

The market is forecast to grow at a 7.8 percent CAGR between 2026 and 2036. Bull and bear scenarios range from 6.6 to 9.0 percent.

Which segment is growing fastest?

Urban Compact Substation GIS leads at a 10.92 percent CAGR, roughly 1.40 times the overall market rate. China's megacity retrofit program drives most of this growth gap.

Who are the major companies in the Gas Insulated Switchgears (GIS) Market?

Leading suppliers include Hitachi Energy, Siemens Energy, Mitsubishi Electric, GE Vernova, and Schneider Electric. These five companies hold a combined 54 percent of global output.

Which country is growing fastest?

China leads growth, driven by its megacity retrofit program and dominant manufacturing scale across the region. Beijing alone has flagged 85 substations for conversion through 2030.

Report Segmentation Architecture

The full report scope spans multiple orthogonal segmentation dimensions, with cross-tabulated demand data provided for each dimension pair. Coverage extends further to regional breakdowns, trend trajectories, and the competitive detail needed to support segment-level decision-making.

By Primary Market Dimension

  • Urban Compact Substation GIS
  • Offshore Wind Platform GIS
  • Underground and Metro GIS
  • Renewable Interconnection GIS
  • Industrial and Captive Power GIS
  • HVDC Converter Station GIS

By End-Use Industry

  • Municipal and Urban Utilities
  • Offshore Wind Energy
  • Electric Utilities and Transmission Operators
  • Industrial and Captive Power

By Commercial Dimension

  • Direct Municipal and Utility Procurement
  • Engineering, Procurement, and Construction Contractors
  • Original Equipment Manufacturers
  • Aftermarket Replacement Channels

By Region

  • North America
  • Western Europe
  • East Asia
  • South Asia and Pacific
  • Latin America
  • Middle East and Africa
  • Eastern Europe

Scope, Methodology, and Coverage

Every figure in this report is reproducible from documented input assumptions. The scope below maps the historical period, the forecast horizon, the segmentation dimensions, and the countries covered, alongside the underlying primary and qualitative methodology.
Historical Period
2020 to 2025
Forecast Period
2026 to 2036
Base Year
2025 (USD billions; MMA Primary Research Dataset, October 2026)
Market Definition
This report covers gas insulated switchgear used for high-voltage and medium-voltage protection and switching in compact substation applications, including SF6 and SF6-free alternative insulating gas designs. It excludes air insulated switchgear and hybrid switchgear sold as standalone systems.
Quantitative Units
USD billions (current prices); unit shipment volume where disclosed
Segmentation Dimensions
By Application; By End-Use Industry; By Commercial Dimension; By Region
Regions Covered
North America, Western Europe, East Asia, South Asia and Pacific, Latin America, Middle East and Africa, Eastern Europe
Countries Covered
China, USA, Germany, India, UK, France, Japan, South Korea, Netherlands, Saudi Arabia, UAE, Brazil, Mexico, Canada, Australia, Vietnam, Philippines, Indonesia, Argentina, South Africa, Poland, Romania, Hungary, Spain, Taiwan, Kuwait, Bahrain, Qatar, and additional markets relevant to this sector
Key Companies Profiled
Hitachi Energy, Siemens Energy, Mitsubishi Electric, GE Vernova, Schneider Electric, Toshiba Energy Systems, Crompton Greaves Consumer Electricals, Bharat Heavy Electricals Limited, ELSEWEDY Electric, Trench Group, Shandong Taikai Electrical Group, China XD Group, CG Power and Industrial Solutions, Sieyuan Electric, Eaton Corporation plc, ABB Ltd, Meidensha Corporation, LS Electric, HD Hyundai Electric, Fuji Electric Co Ltd
Quantitative Methodology
Primary survey, n=3,800 respondents, Q4 2025, six countries; demand-side model with trade association cross-validation
Qualitative Methodology
47 expert interviews, Q4 2025; applied to validate demand model assumptions, identify emerging dynamics, and assess competitive positioning
Report Format
PDF and XLSX data workbook (Word format preview document)
Publisher
Market Minds Advisory
Report Code
MMA-2026-ENE-934
Published
October 2026
Contact
sales@marketmindsadvisory.com | www.marketmindsadvisory.com

Purchase the full Gas Insulated Switchgears (GIS) Market Report (2026 to 2036).

This report provides a comprehensive analysis of the global Gas Insulated Switchgears Market, covering market sizing, segmentation, and competitive dynamics through 2036. It examines demand drivers across urban land scarcity, offshore wind platform buildout, and Gulf state megacity development, alongside regional breakdowns spanning all seven major geographies. The analysis includes detailed competitive profiling of leading manufacturers, input cost exposure, and portfolio strategy guidance for participants across applications. It closes with forward-looking guidance on where land constraints are reshaping supplier qualification requirements. It also benchmarks input cost exposure and portfolio tier economics by application.
Ten-year market sizing and forecast model
Seven-region demand and growth breakdown overview
Competitive benchmarking of twenty key manufacturers
Input cost and supply chain exposure analysis
Portfolio tier and margin economics framework
Primary research from 3,800 survey respondents

Built For The People Who Decide

From boardroom strategy to bench-side execution, this report is read cover-to-cover by leaders shaping the next decade of their industry, turning demand scenarios, market dynamics and valuation benchmarks into decisions.
CXOs/ Presidents/ VPs/ Managers
M&A and Corporate Development
Strategy Teams and R&D Heads
Procurement and Product Directors
Regulatory and Compliance Leaders
Investor Relations and Equity Analysts