Market Minds Advisory
Gas Generating Systems Market

Gas Generating Systems Market: Onsite Hydrogen Adoption and the Cylinder Delivery Displacement

Onsite hydrogen and nitrogen generation systems are displacing cylinder and bulk gas delivery across electronics, food packaging, and industrial decarbonization applications, rewarding suppliers who can guarantee purity consistency and uptime reliability.

Lead Analyst

David Horsley

Published

September 2026

Make Smarter Decisions with Customized Research Insights

Request a free sample report and evaluate market opportunities, growth trends, and competitive dynamics relevant to your business needs.

2025 MARKET VALUE$4.6BMarket Size 2025
2036 FORECAST VALUE$9.5BBase Case , 2026 to 2036
CAGR 2026 TO 20366.8 %Bull 8.0% / Bear 5.7%
INCREMENTAL OPPORTUNITY$4.6BNet 10- year value creation
EXPANSION MULTIPLE1.93x2036 value over 2026 base
Strategic Levers
M&A Pipeline
Regional Outlook
Country Rankings
Competitive Intelligence
Segmental Deep-dive
Call-Us : 91 93563 13602

Executive Snapshot and Market Trajectory

Gas generating systems demand is shifting decisively toward onsite hydrogen and nitrogen generation today, where purity consistency and supply reliability now drive purchasing decisions across most major electronics and industrial manufacturers worldwide this current product cycle and the next entire capital planning season.
Electronics manufacturing capacity expansion, tightening industrial decarbonization mandates, and rising food packaging shelf-life requirements together drive most incremental revenue, concentrated among suppliers who hold onsite generation certification across multiple gas categories simultaneously and can scale production reliably at short notice. East Asia has become the largest single regional market by installed electronics and industrial gas demand, while South Asia and Pacific expands fastest as domestic manufacturing investment accelerates across the region and neighboring countries.
Competitive character increasingly rewards purity consistency and system uptime over unit price, since industrial buyers cannot easily requalify a generator supplier mid-operation without risking costly production line stoppage and product contamination that can run into significant losses and delays. Rising membrane and catalyst input costs and tightening industrial emissions regulation are reshaping which suppliers can defend margin across every major producing region this current product cycle and the next one.
Market Definition
This market covers onsite gas generating systems, including hydrogen, nitrogen, and oxygen generation equipment used to replace cylinder and bulk gas delivery across industrial and electronics applications. It excludes large-scale centralized gas production plants and bottled gas distribution infrastructure.
Base Year Value
$4.6B in 2025 (MMA Primary Research Dataset, August 2026)
Forecast Period
2026 to 2036, eleven discrete annual values
CAGR
6.8% base case. Bull 8.0%. Bear 5.7%.
Fastest Growth Segment
Hydrogen Generation Systems: 11.5% CAGR
Fastest Growth Country
India: 9.3% CAGR
Fastest Growth Region
South Asia and Pacific: 8.8% CAGR
Largest Region
East Asia: 30% of 2025 global value
Market Leaders
Air Products and Chemicals, Linde plc, Air Liquide, Atlas Copco, Parker Hannifin. Source: MMA Analysis based on company annual reports.
Primary Survey
n=3,800 procurement and R&D decision-makers, Q4 2025, six countries
Methodology
Demand-side build-up, cross-validated against public data, 47 expert interviews

Gas Generating Systems Market Forecast Scenarios

gas-generating-systems-market-size-forecast-scenario-1787551786268
Gas generating systems demand grew steadily and quite consistently between 2020 and 2025 at roughly 5.9 percent annually, supported by recovering electronics and industrial manufacturing volumes following earlier pandemic-era disruption across major producing and consuming regions worldwide during that entire period, without any single major disruptive event reshaping the category's underlying trajectory or pricing behavior.
The base case rests on three commercial mechanisms operating together across the entire forecast window: expanding electronics manufacturing capacity pulling qualified onsite nitrogen generation demand steadily through 2036, tightening industrial decarbonization mandates driving conversion toward onsite hydrogen generation systems across every major producing country and manufacturing hub, and steadily rising food packaging shelf-life requirements across emerging consumer markets, particularly East Asia and South Asia and Pacific, where manufacturing capacity keeps expanding.
A bull scenario turns on faster-than-expected industrial decarbonization investment pulling forward hydrogen generation demand well ahead of current baseline projections across every major manufacturing-producing region worldwide and emerging cluster alike, while the bear case centers on prolonged membrane and catalyst feedstock cost pressure that squeezes margins hardest among unqualified commodity generator producers lacking long-term supply contracts and pricing protection.

Onsite Generation Scale-Up and Decarbonization Dynamics

Industrial decarbonization mandates, electronics manufacturing capacity expansion, and rising food packaging shelf-life requirements are converging together to reshape gas generating systems sourcing decisions across every major manufacturing producing region simultaneously, a pace of change the category has not experienced in more than a decade of relatively stable, commodity-weighted equipment demand and predictable industrial pricing behavior among established buyers and long-standing supplier relationships spanning the entire value chain.
MARKET CONCENTRATIONCR5 46%Moderate concentration among top certified generator producers today
AVERAGE SELLING PRICE$25K-450K/unitWide range reflecting gas type and system capacity scale
TOP PRODUCING COUNTRYChina 23%Leading electronics and industrial manufacturing capacity found globally
CAPACITY UTILIZATION74%Moderate headroom remains across qualified equipment production lines
MEMBRANE COST SHARE38%Membrane and catalyst inputs dominate total generator cost structure
SYSTEM CYCLE LENGTH10-15 yearsReflects industrial installation lifecycle and replacement interval length
The market increasingly rewards purity consistency and system uptime over raw output scale, favoring suppliers who invested early in onsite generation certification and industrial reliability documentation well ahead of buyer deadlines that most competitors are only now beginning to address seriously and urgently across their own manufacturing operations, often at considerable capital cost and meaningful operational disruption along the way.
Membrane and catalyst input cost volatility, alongside expanding regional electronics and industrial manufacturing capacity particularly across East Asia and South Asia and Pacific, will keep reshaping competitive positioning through the next decade as buyers reward supply security alongside documented purity performance, pushing laggard producers toward consolidation or exit from unqualified commodity channels entirely over the coming years and forecast cycles.
"Plant managers no longer ask what a generator costs first. They ask whether it survived the uptime audit, and that answer is worth more than any per-unit discount."
Director, Process Equipment and Industrial Systems Practice · MMA Process Equipment and Industrial Systems Practice · August 2026

Market Trends

Onsite Hydrogen Generation Systems Gain Industrial Adoption Rapidly

Industrial manufacturers increasingly specify onsite hydrogen generation systems over cylinder and bulk delivery, citing tightening decarbonization mandates and downstream supply chain reliability commitments across major manufacturing markets and export corridors. Several major industrial gas consumers have already completed conversion of core operations to onsite hydrogen generation entirely, retiring legacy delivery contracts across their facilities. Onsite hydrogen systems now account for a growing share of new equipment orders, and that share continues widening as remaining delivery-dependent buyers face growing pressure from decarbonization regulators and energy auditors across major industrial markets worldwide.
Market Impact: Adds demand across 24 new facilities
Nitrogen Generation Adoption Expands Across Electronics Manufacturing

Electronics manufacturers worldwide transitioning wafer processing and component assembly to onsite nitrogen generation require systems capable of maintaining consistent purity levels without compromising production yield across finished semiconductor and electronics components and subassemblies. Multiple leading electronics manufacturers have upgraded gas supply platforms within the past two years to incorporate onsite nitrogen generation across core production lines and cleanroom facilities. Each transition requires dedicated system requalification under industrial-grade testing conditions, creating durable, long-lead purchasing relationships between manufacturers and a limited pool of certified suppliers capable of meeting exacting purity standards consistently.
Market Impact: Lifts hydrogen system share 27 percent

Market Opportunities and Growth Drivers

Electronics Manufacturing Capacity Expansion Drives System Demand

Global electronics manufacturing capacity continues expanding steadily as semiconductor and component production scales across emerging manufacturing markets, requiring proportionally more onsite gas generation capacity to support growing wafer processing and cleanroom operations across international supply chains and manufacturing hubs. New fabrication and assembly facilities coming online over the next several years each require qualified gas generation systems sized to specific purity and volume requirements. This pulls sustained incremental demand into industrial-grade generation system production, particularly among suppliers who can guarantee consistent purity performance across large production batches without introducing quality variability.
Market Impact: Adds compliance cost across 15 markets

Industrial Decarbonization Mandates Expand Hydrogen System Demand

Industrial manufacturers across major consuming markets are steadily tightening decarbonization commitments that extend to onsite gas generation infrastructure, pushing manufacturers toward certified hydrogen generation systems over standard cylinder delivery across every major industrial category and product line worldwide. Several major industrial groups have already published decarbonization targets that extend upstream into gas supply chain specifications and equipment sourcing protocols. This shift favors generation system suppliers who can document consistent purity and reliability performance, since manufacturers cannot easily tolerate certification gaps without risking loss of decarbonization compliance and regulatory market access.
Market Impact: Raises system input costs 21 percent

Market Restraints and Challenges

Industrial Safety Standards Raise Compliance Cost Burden

Regulators across the European Union and several other jurisdictions are tightening industrial safety certification requirements for onsite hydrogen and nitrogen generation systems, creating friction for suppliers whose equipment designs still rely on standard commercial-grade safety systems without extensive pressure containment validation. The root cause traces to mounting concern over onsite hydrogen storage and handling risk across industrial manufacturing environments. Suppliers face rising certification cost and potential future restrictions on certain pressure vessel designs used in generation system construction. Many are pursuing enhanced containment engineering and third-party safety audits to stay ahead of anticipated regulatory tightening.
Market Impact: Shifts 40% of hydrogen supply onsite

Membrane and Catalyst Feedstock Volatility Squeezes Producer Margins

Specialty membrane materials and catalyst metals, the primary inputs underlying most gas generation system designs, have experienced sustained cost volatility tied to broader specialty materials supply disruptions across major producing regions and shipping corridors. The root cause lies in generation system producers' dependence on a feedstock market driven mainly by unrelated downstream electronics and automotive catalyst demand, leaving limited pricing leverage during shortages. Producers without long-term supply agreements absorb cost spikes directly, compressing margin fastest among smaller commodity-focused equipment suppliers. Many are pursuing indexed multi-year contracts and material diversification to reduce this exposure going forward.
Market Impact: Expands generation across 55% of fabs
3 additional market trends, 3 additional growth drivers, and 3 additional restraints and challenges are covered in the full report. Contact sales@marketmindsadvisory.com to access the complete intelligence.

Segment CAGR and Growth Architecture

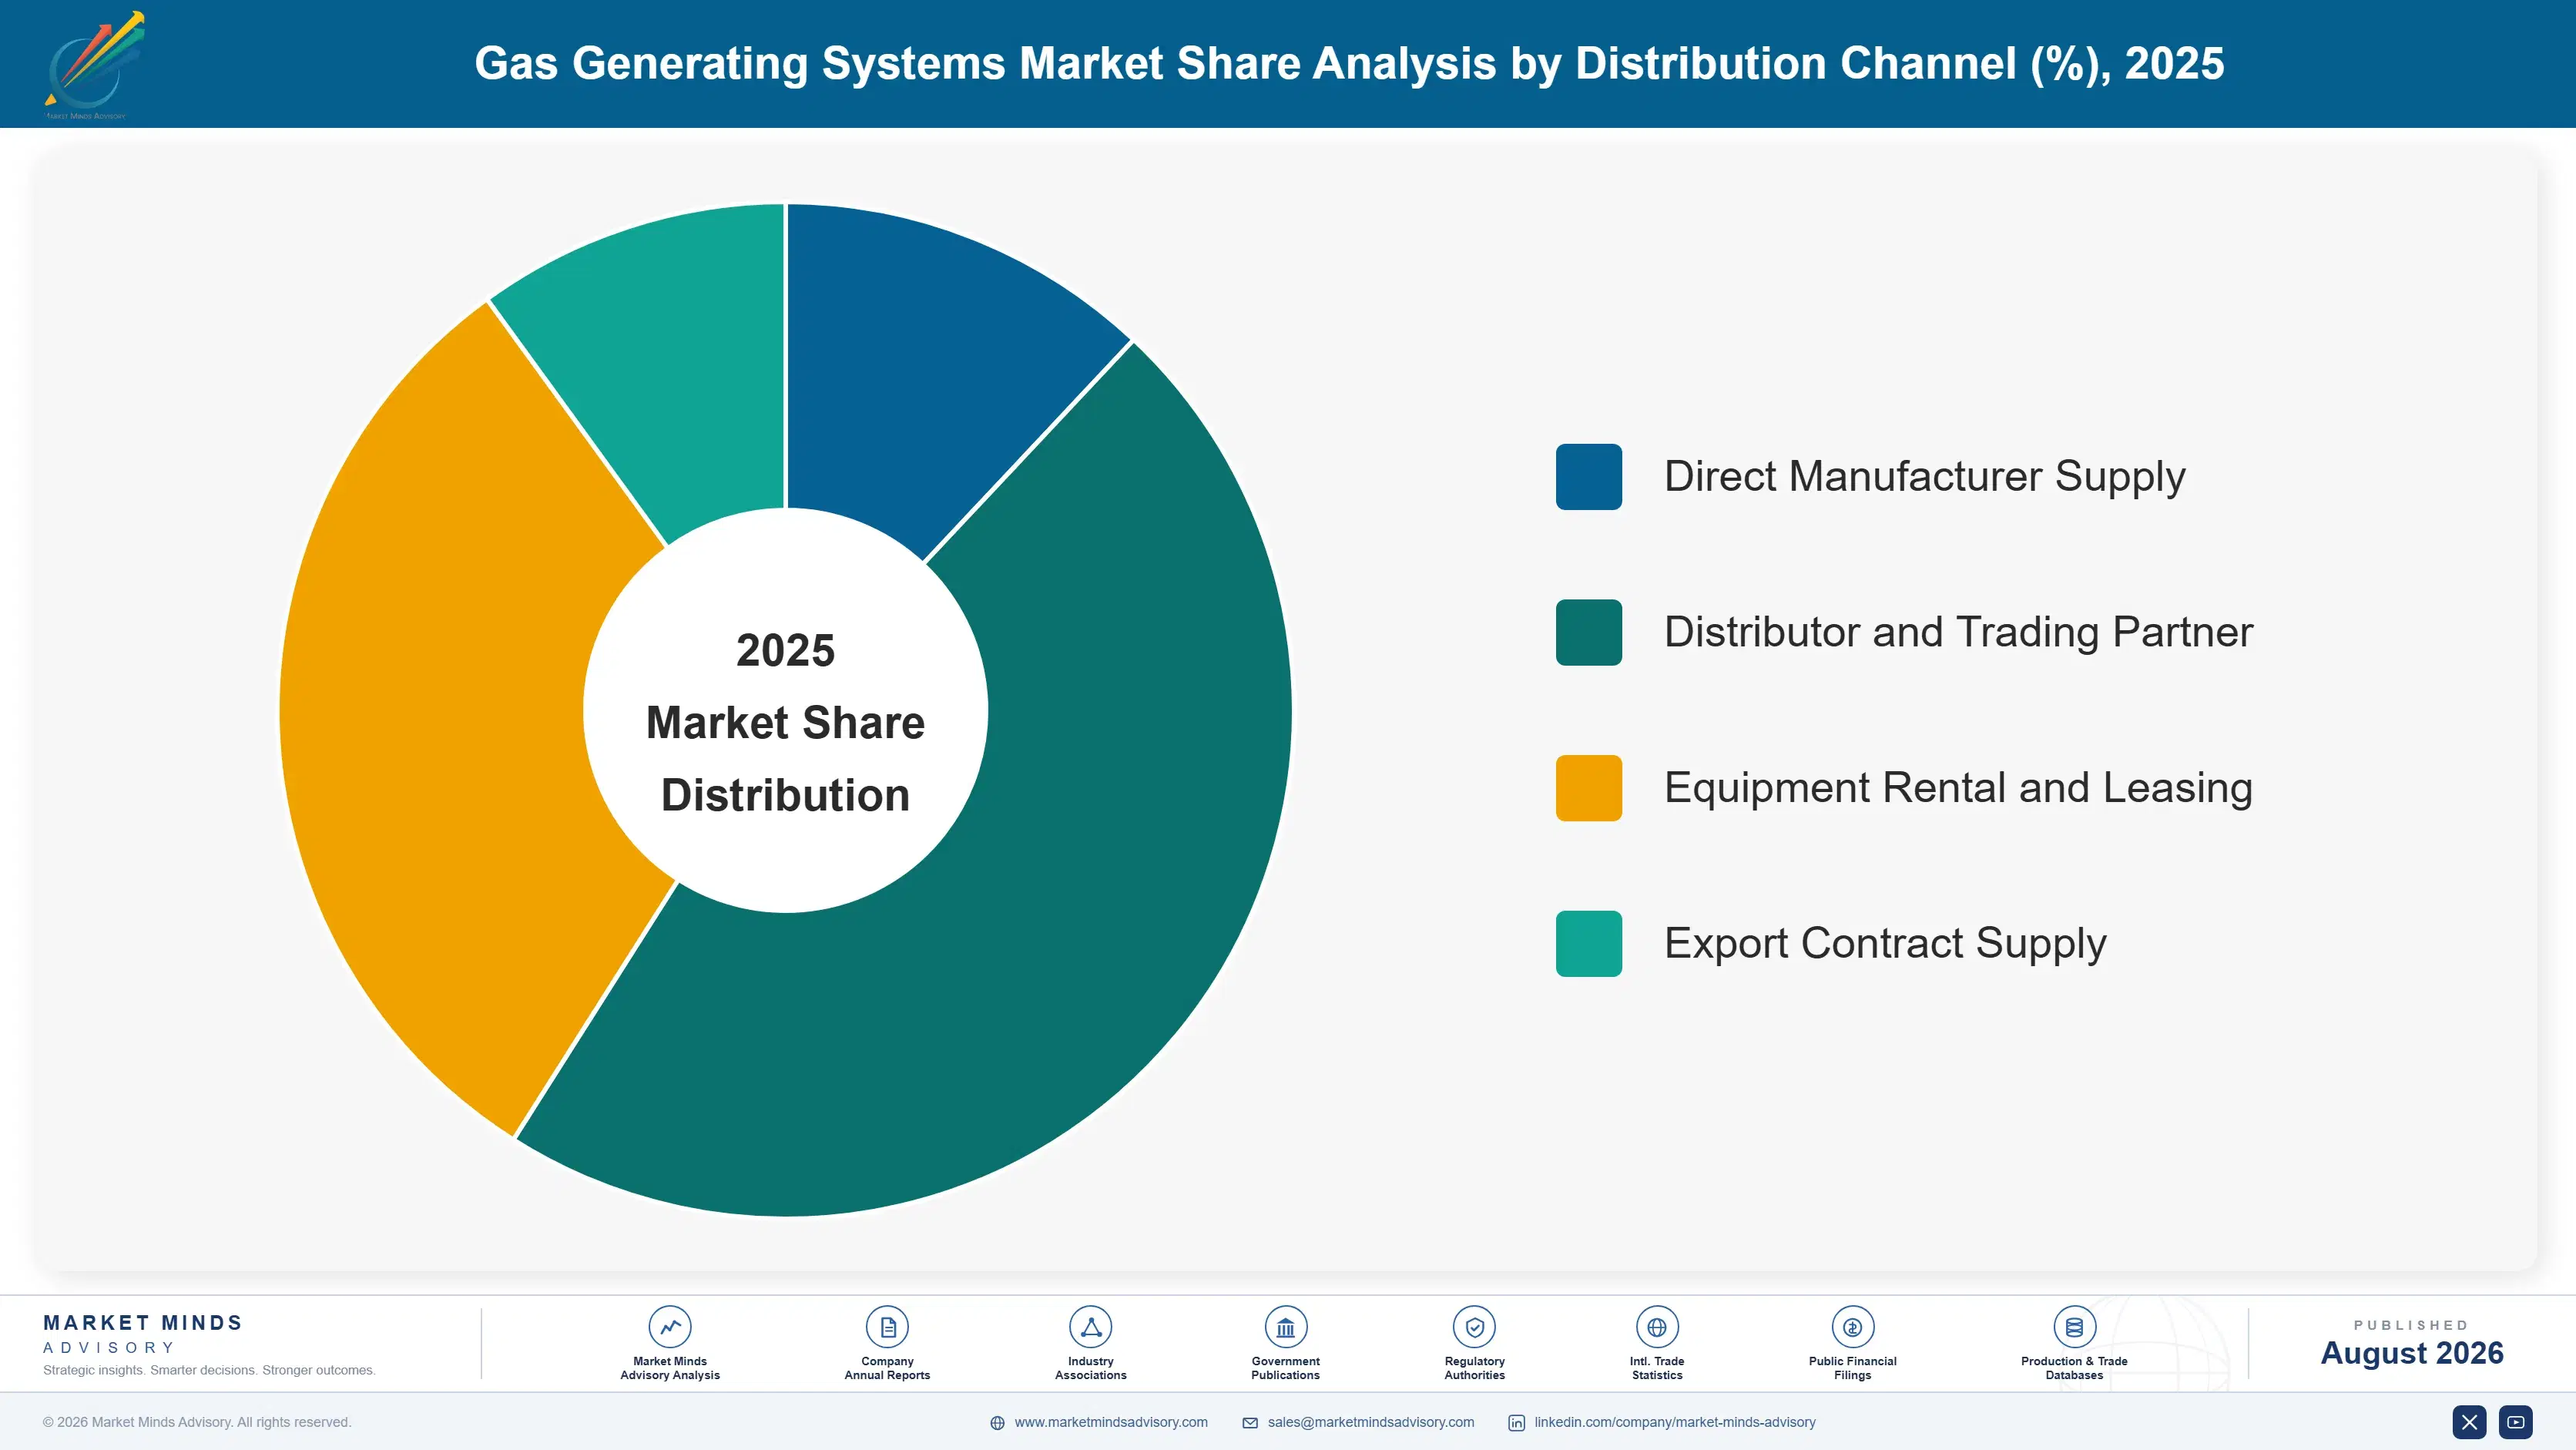
Gas generating systems are segmented here by gas type, the classification buyers and producers use most consistently across the entire value chain, since purity requirements, safety certification, and pricing structures differ sharply between hydrogen, nitrogen, and oxygen generation channels, each governed by distinct regulatory and commercial standards that shape how suppliers pursue export qualification.
gas-generating-systems-market-market-share-analysis-1787551786803

Hydrogen Generation Systems

Hydrogen generation systems are growing fastest of any gas generating systems category, driven by expanding industrial decarbonization mandates and fuel cell adoption across developed and emerging manufacturing markets worldwide. Buyers require pressure containment certification that meets exacting safety specifications, creating qualification cycles that typically run twelve to eighteen months before a supplier wins meaningful volume commitments from any single industrial manufacturer. Once qualified, relationships tend to persist for the life of a facility installation, since requalifying a new equipment supplier means repeating costly safety validation testing from the beginning. This segment commands the highest per-unit pricing of any gas generating systems category, reflecting the cost of pressure containment engineering rather than the underlying equipment itself.
CAGR 11.5%

Nitrogen Generation Systems

Nitrogen generation systems represent the second-fastest-growing gas generating systems segment as electronics manufacturers and food packaging converters transition away from cylinder delivery to onsite generation across major consuming markets and manufacturing hubs worldwide and across every major regional cluster and country. Growth here tracks closely with electronics manufacturing capacity expansion, since each new fabrication facility requires a fully requalified nitrogen generation train sized to its specific purity and volume requirements from the very outset. Suppliers who can document consistent purity performance and low downtime rates are capturing a disproportionate share of this conversion-driven demand as manufacturers expand production capacity ahead of anticipated volume growth across major producing regions and export corridors.
CAGR 9.4%
Full segment breakdown across 6 segments available in the complete report.

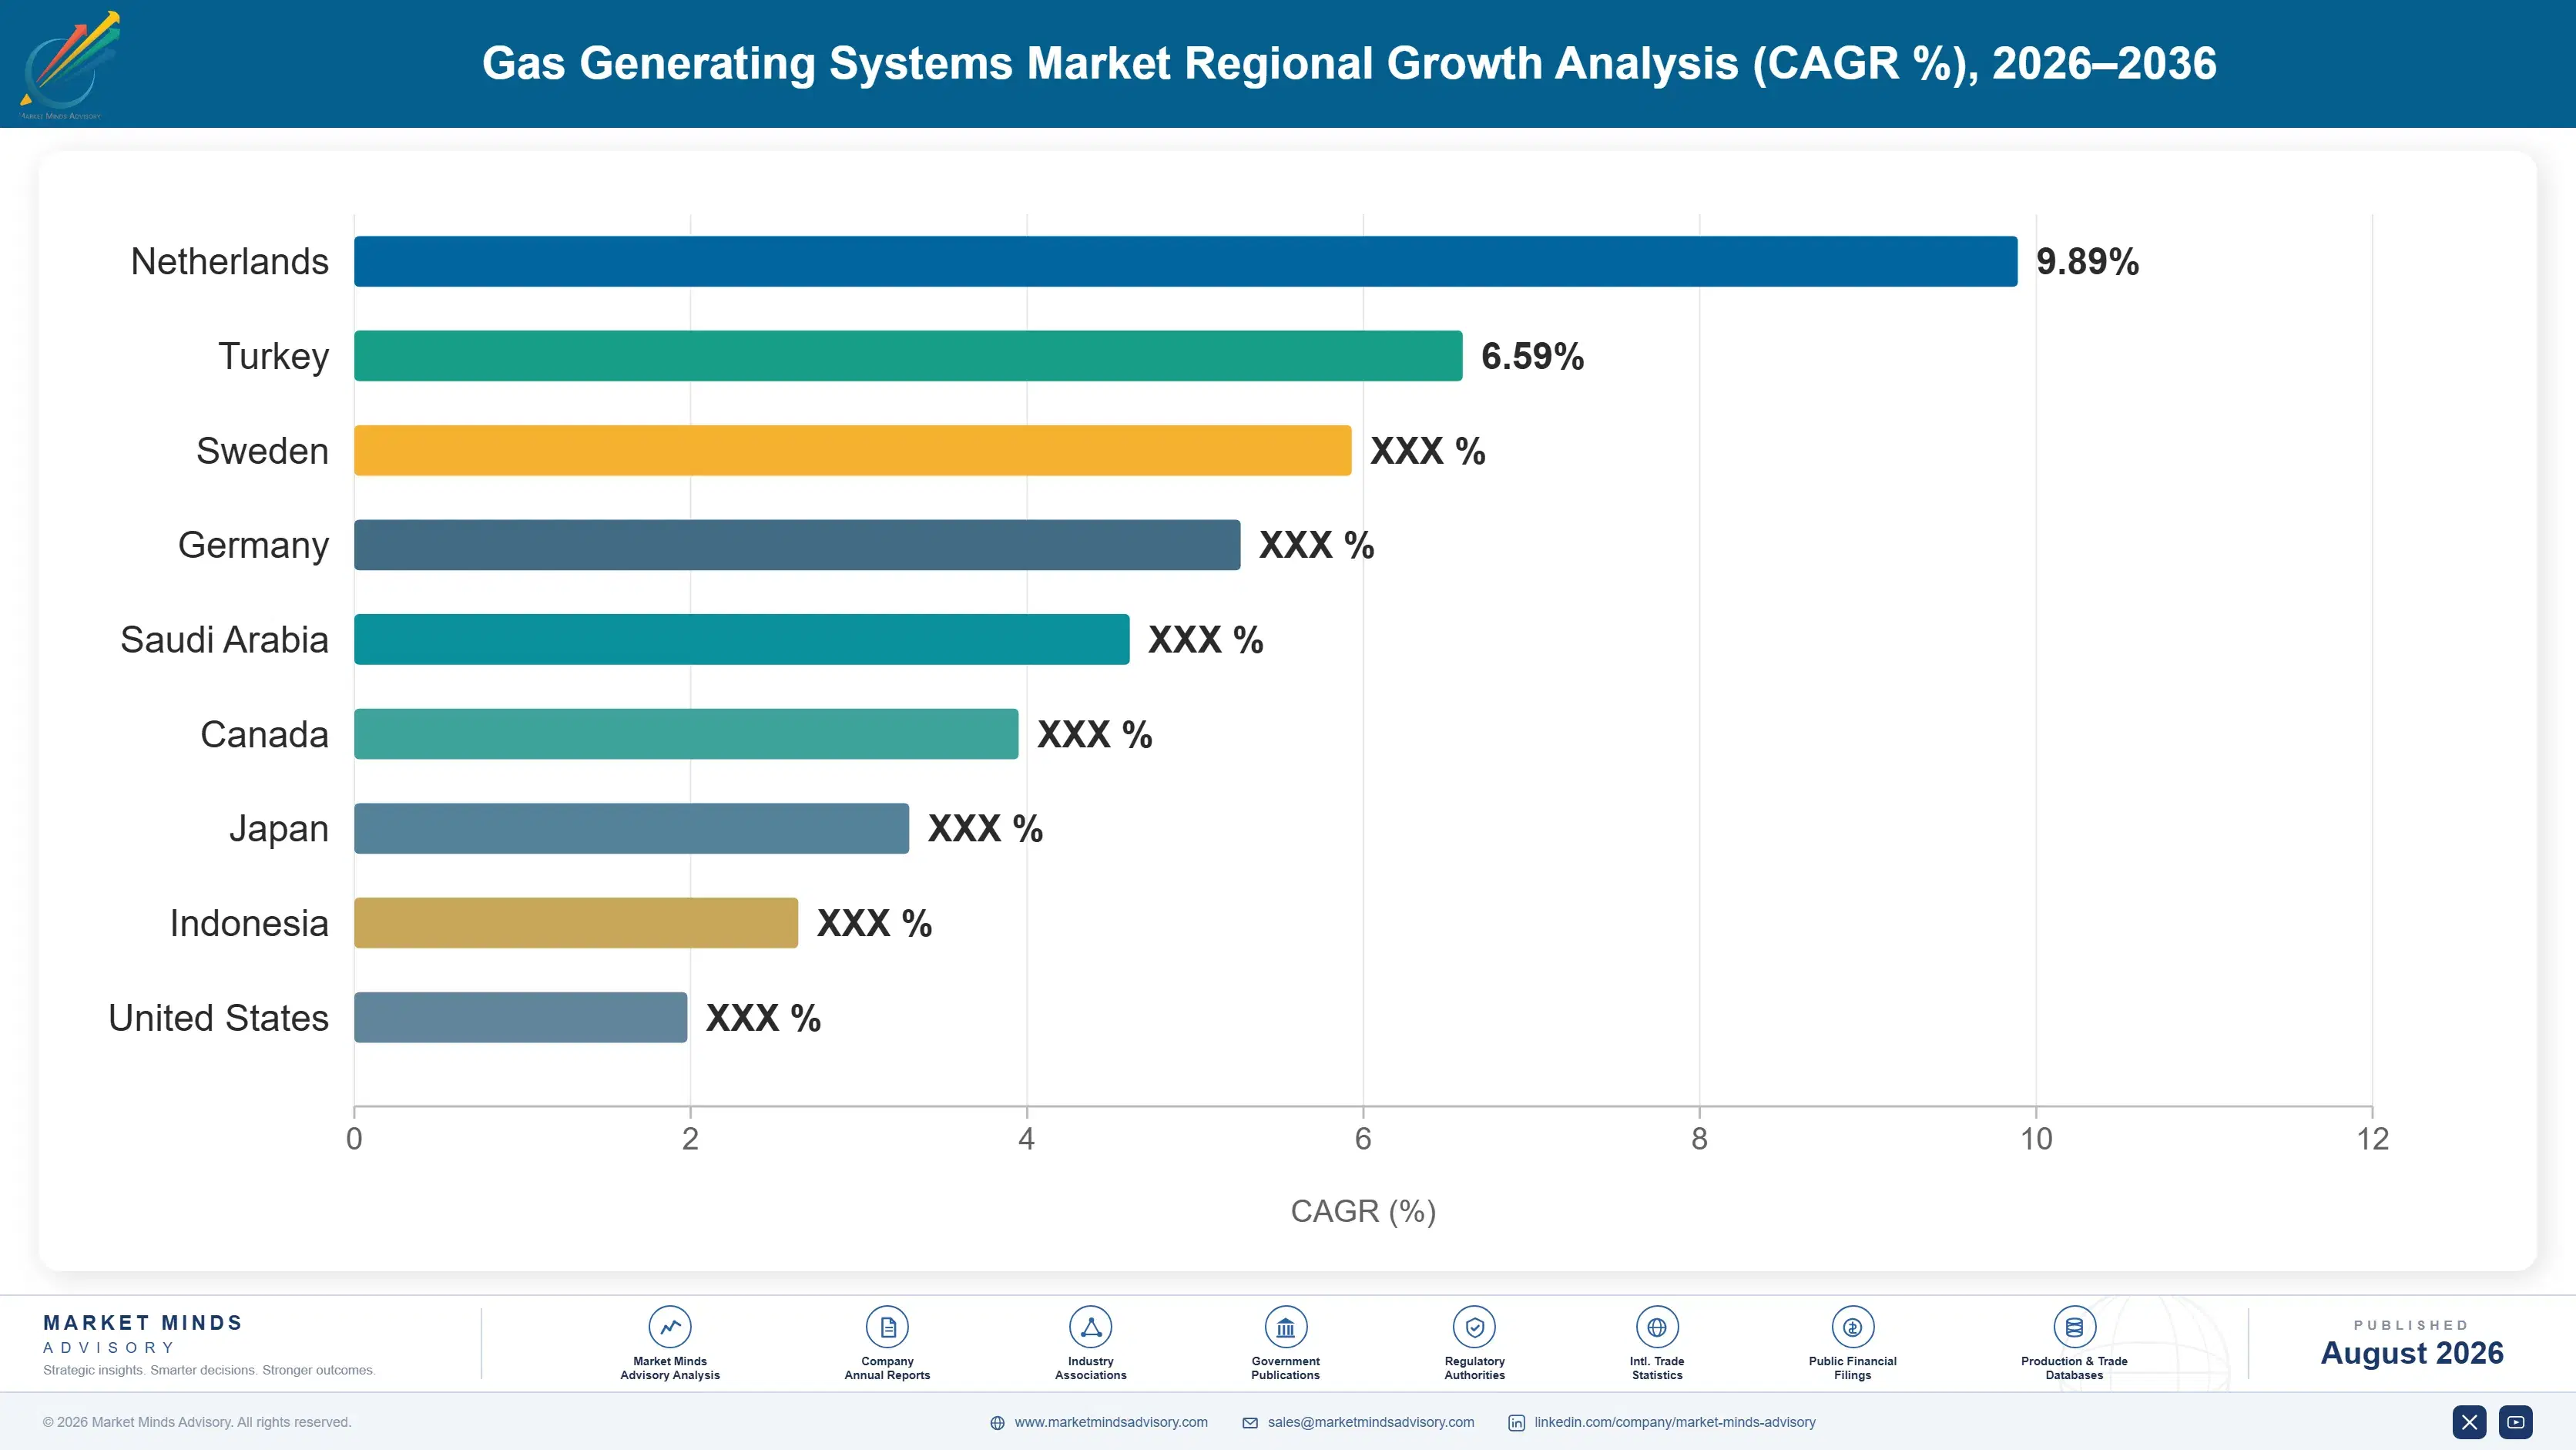
Regional Architecture and Country Demand Map

East Asia holds the largest regional share of gas generating systems demand today by a clear margin, while South Asia and Pacific expands fastest as domestic electronics and industrial manufacturing investment accelerates steadily across multiple countries in that region, ahead of every other tracked market.

North America

Electronics manufacturing capacity anchors North American demand, with major fabrication facilities running active onsite nitrogen generation conversion programs across export-focused production lines nationwide and across multiple manufacturing sites, contract facilities, and regional processors and cooperatives nationwide. Industrial decarbonization investment, concentrated in a handful of heavy manufacturing clusters, adds supplementary hydrogen generation demand as compliance requirements expand domestically across several states. Producers serving this market must maintain industrial safety certification alongside purity documentation simultaneously, a dual burden that favors larger, established suppliers over smaller regional entrants lacking scale. Growth remains steady rather than fast, reflecting the region's already mature qualification base relative to faster-growing emerging manufacturing hubs elsewhere in the world.
Share: 22% | CAGR: 6.0% (2026 to 2036)

Western Europe

Western Europe's industrial decarbonization cluster, particularly across Germany, France, and the Netherlands, makes the region a major center of validated hydrogen generation adoption, with manufacturers steadily reformulating gas supply specifications toward certified onsite generation ahead of tightening emissions expectations from regulators and industrial customers alike across the entire industry and its broader supply base, vendor network, and equipment portfolio. Electronics manufacturing activity adds a smaller but stable secondary layer, supported by established specialty manufacturers across several countries in the region. Growth trails the global average because the region's electronics and industrial manufacturing markets are both largely mature, with incremental demand coming mostly from equipment conversion rather than genuinely new production volume.
Share: 18% | CAGR: 5.3% (2026 to 2036)
Regional intelligence for 5 additional markets available in the complete report: East Asia, South Asia and Pacific, Latin America, Middle East and Africa, Eastern Europe. Contact sales@marketmindsadvisory.com.
gas-generating-systems-market-country-cagr-analysis-1787551787310

Where Gas Generating System Suppliers Defend Margin

Suppliers face a widening gap between standard commodity equipment pricing and certified hydrogen and nitrogen generation premiums across nearly every regional market tracked in this report today. These four levers describe how qualified suppliers can capture more of that widening premium rather than competing purely on volume and price against unqualified commodity rivals worldwide.

Hydrogen Generation Safety Certification Program Investment Initiatives

Investing in dedicated pressure containment engineering and safety certification documentation systems lets suppliers pursue the highest-margin segment of gas generating systems demand rather than competing solely on commodity equipment pricing against dozens of unqualified suppliers. Qualification is slow, typically twelve to eighteen months, but relationships that follow tend to persist for the life of a facility installation since requalifying elsewhere means repeating the full certification process from scratch. Suppliers who commit early to this investment capture certified pricing that runs 32 to 46 percent above standard commodity equipment, a durable premium that compounds across every subsequent installation renewal cycle.
Market Impact: Adds 32 to 46 percent certified pricing premium

Nitrogen Generation Purity Formulation Development Programs

Developing dedicated nitrogen generation systems qualified for high-purity electronics manufacturing lets suppliers capture share as fabrication facilities transition gas supply away from cylinder delivery across most major electronics categories worldwide and every major fabrication node. This requires upfront engineering investment and close collaboration with fabrication equipment integrators, but it positions suppliers ahead of rivals still selling legacy delivery models into a shrinking market segment. Suppliers with qualified high-purity nitrogen portfolios report revenue per unit roughly 33 percent above legacy delivery sales, reflecting the premium fabricators pay for validated purity performance.
Market Impact: Lifts revenue per unit by 33 percent overall

Direct Industrial Manufacturer Relationship Building Programs

Building direct relationships with industrial manufacturer procurement teams, rather than selling exclusively through distributors, gives suppliers earlier visibility into upcoming facility gas generation needs and more control over contract terms and delivery scheduling across every installation cycle and expansion phase. This channel shift requires dedicated technical sales capability but removes distributor margin from the value chain and strengthens switching barriers once a relationship is firmly established between both parties involved. Suppliers pursuing direct manufacturer relationships report contract renewal rates roughly 28 points higher than those relying primarily on distributor-mediated sales.
Market Impact: Lifts contract renewal rate by 28 points overall

Onsite Installation Technical Support Service Programs

Developing dedicated technical support for manufacturers expanding into new onsite generation programs creates an early foothold before a facility moves to full commercial equipment volume and scale across every market segment and installation type. This channel carries lower initial volume but materially higher per-unit pricing, and early involvement in installation testing tends to carry through to the eventual commercial supply contract once the facility finally scales. Suppliers active in this channel report revenue per unit roughly 31 percent above standard commercial-market sales, reflecting the premium manufacturers pay for responsive technical partnership.
Market Impact: Lifts revenue per unit by 31 percent overall

Who Controls the Margin Pool

The top five producers hold an estimated 46 percent combined share on a revenue basis, leaving meaningful room for mid-sized challengers to compete effectively for hydrogen and nitrogen generation accounts, though the gap between leading certified suppliers and unqualified commodity producers has widened considerably as safety certification becomes a stronger differentiator than raw production scale across nearly every account relationship in the market.
Current competitive activity centers on three dimensions: expanding hydrogen generation safety certification across additional equipment lines, securing nitrogen generation purity design wins ahead of cylinder delivery retirement, and qualifying decarbonization compliance systems for industrial customer programs across major consumer markets and retail channels. Suppliers investing across all three dimensions are pulling steadily ahead of competitors focused narrowly on commodity volume and price alone.

Emerging pressure comes from Asian industrial equipment producers rapidly building safety certification capability at meaningfully lower cost bases than established Western suppliers currently maintain across their operations. Rankings could shift meaningfully over the forecast period if these challengers close the qualification gap with major electronics and industrial manufacturers before incumbent producers can further lock in existing relationships across their core accounts and renewal cycles.
gas-generating-systems-market-company-positioning-matrix-1787551787832

Competitive Moat and Risk Dimensions

AIR PRODUCTS AND CHEMICALS

Moat: Safety Certification Depth

Air Products and Chemicals' decades of industrial gas manufacturing give it audit-ready safety certification systems and manufacturer relationships that newer entrants cannot replicate quickly. This depth lets it qualify faster for new hydrogen generation programs than competitors still building comparable compliance infrastructure, securing early positioning on emerging certified equipment volume before rivals can compete for it.
AIR PRODUCTS AND CHEMICALS

Risk: Premium Cost Base Exposure

Air Products and Chemicals' extensive compliance infrastructure carries meaningfully higher fixed costs than leaner regional competitors, a disadvantage in commodity equipment segments where buyers remain highly price-sensitive. If hydrogen generation volume growth slows unexpectedly, this cost structure could compress margins faster than at more narrowly focused commodity producers overall.
LINDE PLC

Moat: Fabrication Equipment Relationships

Linde plc's direct relationships with electronics fabrication equipment integrators give it early visibility into gas supply chain transitions, positioning it to qualify nitrogen generation systems ahead of competitors still selling legacy cylinder delivery models. This channel proximity converts into faster revenue capture whenever a major fabricator needs to requalify its gas supply chemistry.
LINDE PLC

Risk: Hydrogen Segment Underexposure

Linde plc's strength is concentrated in nitrogen and industrial gas delivery, leaving it comparatively underexposed to the faster-growing hydrogen generation segment relative to more diversified competitors. Should hydrogen demand accelerate faster than nitrogen volume, competitors with broader qualification portfolios could capture a disproportionate share of incremental market growth.

Players Tracked

Prominent Players

Air Products and Chemicals
Linde plc
Air Liquide
Atlas Copco
Parker Hannifin

Other Key Players

Generon IGS
Peak Scientific
NEL Hydrogen
Plug Power
ITM Power
McPhy Energy
On Site Gas Systems
Domnick Hunter
Pure Gas Products
Sysadvance
Bauer Compressors
Absolute Gas Systems
Novair
Cummins
Praxair Distribution

Recent Developments

MARCH 2026

Air Products and Chemicals Expands Hydrogen Generation Capacity

Air Products and Chemicals announced expanded pressure containment production capacity dedicated to certified hydrogen generation system supply, aimed at supporting growing decarbonization compliance demand from multiple industrial manufacturer programs across several regions. The expansion adds meaningful throughput without requiring entirely new facility investment or additional headcount.
Signal: Signals established suppliers are steadily expanding capacity ahead of anticipated hydrogen generation adoption across the broader industry
SEPTEMBER 2025

Linde plc Signs Multi-Year Nitrogen Generation Agreement

Linde plc entered a multi-year supply agreement with a leading electronics fabrication group covering a majority of its projected nitrogen generation system needs through 2029, reducing conversion risk ahead of anticipated cylinder delivery retirement across multiple manufacturing facilities. The agreement includes defined annual volume commitments.
Signal: Signals long-term equipment supply agreements becoming a standard risk management practice among leading industrial gas suppliers globally
JANUARY 2026

Air Liquide Expands Pressure Vessel Safety Engineering Research

Air Liquide expanded dedicated research and development capacity for pressure vessel safety engineering, responding to growing demand from manufacturers navigating tightening industrial safety certification requirements across major markets worldwide this year and the next. The investment adds meaningful engineering capacity ahead of anticipated program growth and expansion.
Signal: Signals industrial manufacturer demand for certified safety engineering accelerating faster than most suppliers currently anticipated across the industry

Membrane and Catalyst Cost Exposure

Specialty membrane materials and catalyst metals account for roughly 38 percent of cost of goods sold for a typical gas generating systems producer, sourced primarily from manufacturers in the United States, Germany, and Japan. Pressure vessels, control electronics, and safety compliance testing make up most of the remaining cost base, since equipment assembly requires limited additional raw material beyond these categories.
Global specialty materials supply disruption in 2024 pushed catalyst metal spot prices sharply higher within a single quarter according to IEA and national statistical office manufacturing data alongside producer annual report disclosures. Producers without long-term supply contracts absorbed the spike directly, some passing over 17 percent of the increase straight into manufacturer pricing within two quarters, a speed of pass-through rarely seen on less volatile industrial equipment inputs.

The competitive disadvantage falls hardest on mid-sized producers that buy membrane and catalyst materials on spot markets rather than through multi-year supply agreements, since they cannot smooth cost volatility across a longer contract horizon the way larger integrated producers can. Exposure also varies by geography: producers concentrated in a single materials sourcing region carry materially more risk than those diversified across multiple specialty materials supply chains simultaneously.
gas-generating-systems-market-cost-volatility-analysis-1787551788026

Multi-Year Membrane and Catalyst Supply Contracts With Indexed Pricing

Leading producers are locking in multi-year membrane and catalyst volumes with indexed pricing floors rather than accepting pure spot exposure, trading some short-term upside flexibility for predictable cost planning across annual budget cycles. This shields margin during sharp materials spikes and lets sales teams quote firmer manufacturer pricing well ahead of scheduled delivery windows.

Regional Materials Diversification Across Multiple Specialty Suppliers

Producers are qualifying second and third membrane and catalyst suppliers across separate geographic regions instead of relying on a single sourcing corridor, reducing exposure to any one country's export restriction or capacity disruption. Dual sourcing adds modest logistics cost but materially cuts the risk of a single-point supply interruption reaching downstream production lines and customer commitments.

Backward Integration Into Membrane Synthesis Capability

A handful of larger equipment groups are investing directly in membrane synthesis capability, capturing the intermediate margin internally rather than buying it externally at prevailing spot prices across the market. This approach is capital intensive but removes a major recurring cost variable for producers with sufficient scale and balance sheet strength to justify the up-front investment.

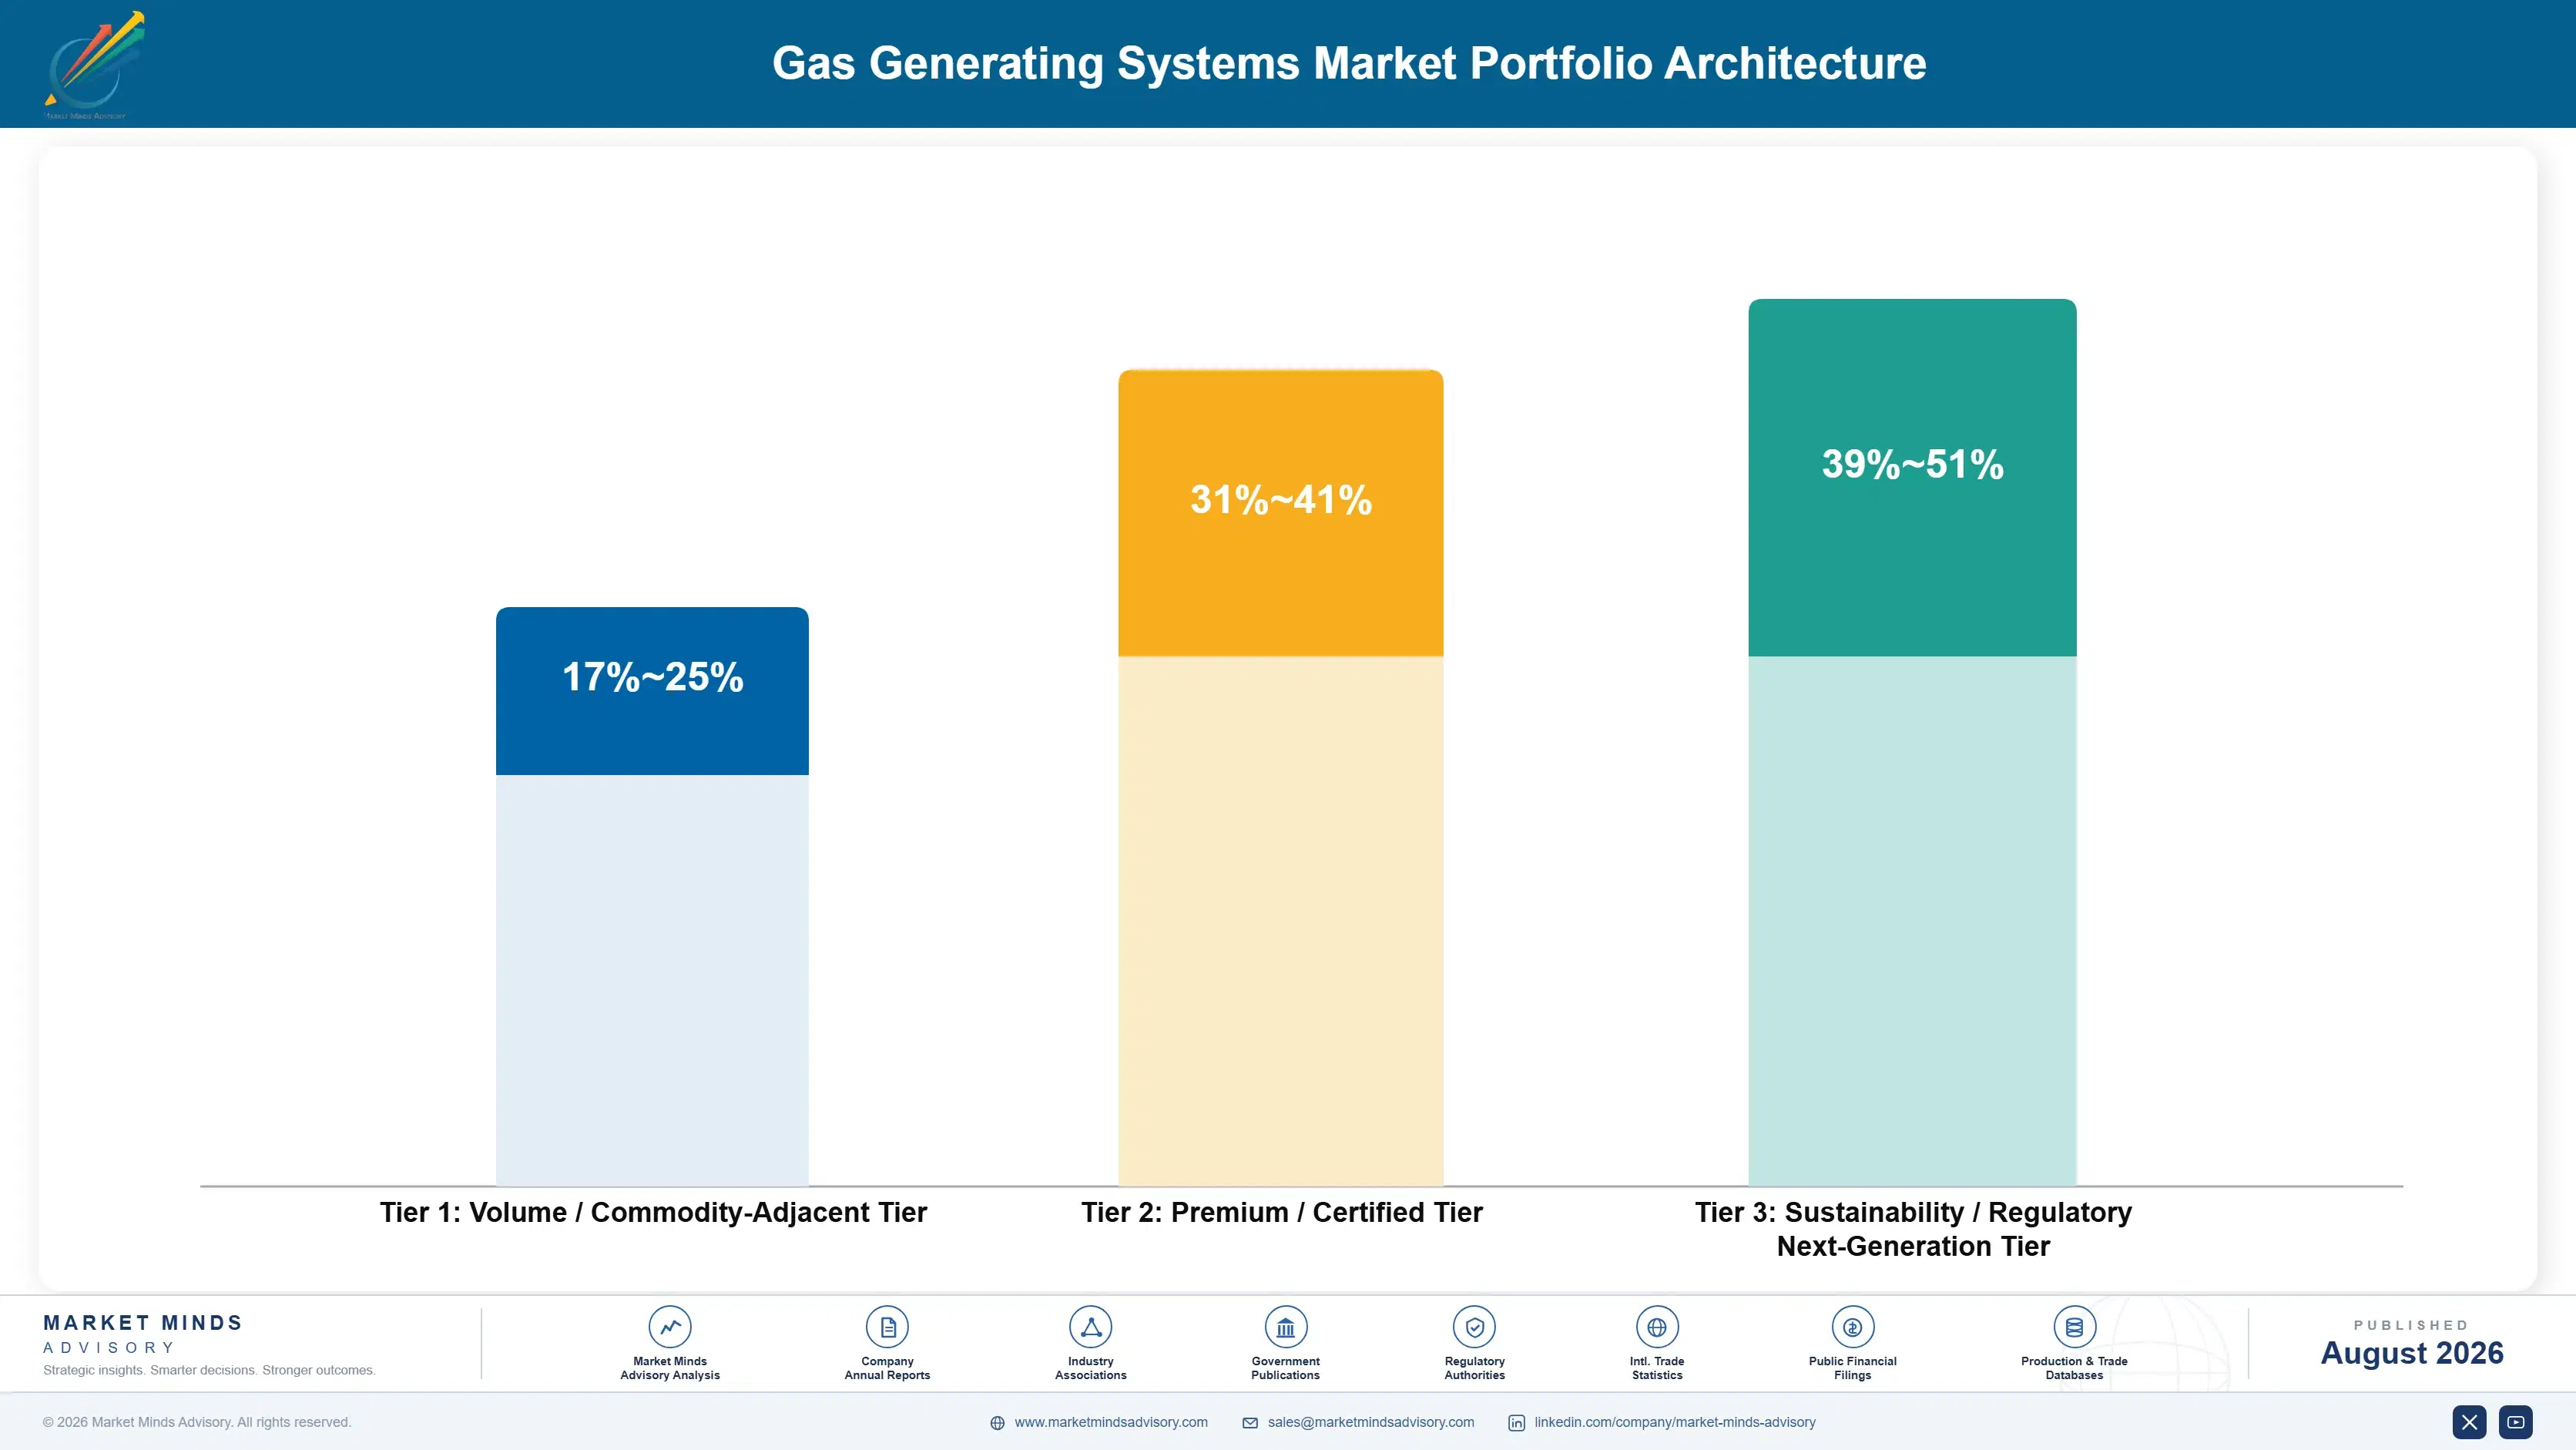
Portfolio Architecture for Margin Defence

Gas generating systems sit across a wide margin range depending on gas type and certification depth. Commodity nitrogen and oxygen generation equipment sold into general industrial applications carries thin, volume-driven margins set largely by feedstock cost, while certified hydrogen generation and high-purity electronics systems command a meaningfully higher price per unit because buyers pay for safety engineering and purity documentation rather than the equipment itself.
The volume versus premium tension shapes how producers allocate capacity across their manufacturing plants and regional facilities. Commodity output keeps facilities running and covers fixed cost, but the incremental margin dollar increasingly comes from smaller, certified production runs sold directly into hydrogen generation and high-purity electronics channels, where switching cost and safety barriers protect pricing far more effectively than scale alone ever could.

High-value pools concentrate at the intersection of hydrogen generation safety certification and high-purity nitrogen generation, both of which reward suppliers who can document consistent reliability across full facility lifecycles and multiple export corridors. Producers chasing only volume growth in commodity channels will find margin capture there thinning further as equipment supply expands faster than underlying commodity demand across most producing regions.

Volume / Commodity-Adjacent Tier

General nitrogen and oxygen generation equipment sold on tight per-unit price competition with limited product differentiation beyond basic purity specification, where the largest volume producers set the effective market price for everyone else.
Gross Margin: 17-25%

Premium / Certified Tier

Certified hydrogen generation and high-purity electronics grade systems sold under export quality agreements that command a durable premium over commodity industrial equipment, reflecting the cost of safety engineering and purity documentation buyers now require.
Gross Margin: 31-41%

Sustainability / Regulatory / Next-Generation Tier

Next-generation ultra-efficient and fully traceable generation designs positioned ahead of tightening decarbonization and industrial safety regulation, where early qualification with major manufacturers builds a lasting supply relationship across future facility cycles.
Gross Margin: 39-51%
gas-generating-systems-market-portfolio-architecture-1787551788523

High-value Sub-segments and Strategic Watch-out

Hydrogen Generation Systems

Hydrogen generation systems combine high per-unit pricing with the fastest unit volume growth of any gas generating systems end-use, driven by tightening industrial decarbonization mandates and steady fuel cell adoption demand across developed and emerging manufacturing markets, a combination that keeps qualified suppliers booked well in advance.
Gross Margin: 39-51%

Nitrogen Generation Systems

Nitrogen generation systems carry strong margins and steady double-digit growth, supported by manufacturers steadily reformulating entire gas supply portfolios to meet tightening purity requirements without losing the reliability performance fabricators already expect from established generation systems across every major export corridor, product category, and market.
Gross Margin: 31-41%

General Nitrogen and Oxygen Generation Equipment

General nitrogen and oxygen generation equipment for mass-market industrial applications remains the largest volume pool and the primary revenue base for most producers, but pricing power there continues to erode as additional certified capacity comes online across multiple producing regions and undercuts legacy contract pricing for unqualified buyers.
Gross Margin: 17-25%

Legacy Cylinder Delivery Infrastructure

Legacy cylinder delivery infrastructure faces mounting obsolescence risk as manufacturers accelerate onsite generation conversion, a watch-out for the handful of producers still dependent on delivery logistics rather than fully requalified, onsite-generation architectures that satisfy strict buyer requirements going forward across every major industrial category and market.
Gross Margin: 19-27%

Recurring Demand Patterns in Gas Systems

Gas generating systems demand behaves like an annuity once a supplier qualifies with a manufacturer, particularly in hydrogen generation supply where switching triggers a full safety revalidation cycle that can run well beyond a full facility lifecycle. Manufacturers show similar stickiness across nitrogen generation: once a system clears purity validation testing, redesigning around a new supplier risks production yield and delaying facility launch timelines.
Adoption depth varies sharply by end-use vertical. Certified hydrogen generation buyers commit to long, audited supply relationships because safety qualification is expensive and slow to repeat, while general commodity equipment compounders treat generation systems as a more interchangeable input and switch suppliers readily on price alone. Nitrogen generation formulators sit between these two extremes, valuing consistency but remaining price-sensitive at the margin.

A generational shift is underway in buyer profiles as younger sourcing and sustainability teams at manufacturers push harder for documented, traceable equipment supply chains over legacy cylinder delivery relationships their predecessors relied on for many decades. This buyer cohort weighs safety defensibility and decarbonization documentation alongside price, a departure from purchasing habits that dominated the category a decade ago.
gas-generating-systems-market-end-use-penetration-index-1787551789009

MMA Strategic Guidance for Gas Systems

These are among the four positions where our research anticipates prominent divergence between winners and laggards over the coming forecast period. Each is grounded in the demand model, the regulatory perimeter, and the announced capacity pipeline.
01 / CERTIFICATION INVESTMENT STRATEGY

Prioritize Hydrogen Safety Certification Over Commodity Volume

Suppliers chasing commodity equipment volume alone will find margin capture thinning further as additional manufacturing capacity comes online across multiple producing regions over the next several years. Hydrogen generation supply pays a durable premium precisely because safety qualification is slow and expensive to repeat, locking in multi-facility relationships once a supplier clears the full audit process. MMA recommends suppliers direct incremental capital toward hydrogen generation safety certification and audit readiness rather than simply adding general-purpose equipment capacity that competes on price alone.
02 / FEEDSTOCK RISK MANAGEMENT

Lock In Multi-Year Membrane Contracts Before Next Spike

Membrane and catalyst materials account for roughly 38 percent of cost of goods sold, and the 2024 volatility episode showed how quickly spot exposure erodes margin when specialty materials supply tightens without warning. Producers without indexed multi-year contracts absorbed the shock directly and, in several documented cases, passed over 17 percent of the increase straight through to manufacturer buyers within two quarters. MMA recommends securing broader materials coverage now, well ahead of the next disruption cycle, rather than negotiating reactively during a price spike.
03 / REGIONAL EXPANSION PRIORITY

Build East Asian Capacity Ahead of Regional Demand Growth

East Asia already carries the largest regional share of gas generating systems demand and is forecast to grow faster than every region except South Asia and Pacific through 2036. Manufacturers across the region increasingly expect local or regionally proximate supply rather than relying solely on European or North American producers for lead times and documentation turnaround times. MMA recommends suppliers evaluate regional capacity or joint venture partnerships in East Asia now, before competitors establish entrenched local relationships with key accounts.
04 / ONSITE CONVERSION POSITIONING

Get Ahead of the Onsite Generation Conversion Transition

Onsite gas generation adoption continues accelerating across export-focused manufacturing operations, and suppliers who wait for manufacturers to finalize conversion decisions before requalifying equipment designs will lose design-win time to competitors who moved earlier in the cycle. Certified onsite generation systems already command a meaningful premium over legacy cylinder delivery models, rewarding early engineering investment with pricing power that persists across the facility lifecycle. MMA recommends suppliers treat onsite generation capability as a commercial asset rather than an engineering cost, since it supports premium pricing conversations with manufacturers.

Engagement Snapshot From the Field

A live engagement with an industry participant carrying material or product regulatory and market exposure ahead of a defining policy shift, showing how our research translates into a defensible multi-year portfolio strategy.
MARKET MINDS ADVISORY · CLIENT ENGAGEMENT SUMMARY
Gas Generating Systems Producer Strategic Portfolio Review and Transition Roadmap 2026·Investment Scenario on Gas Generating Systems Exposure Evaluation 2025-26
CLIENT PROFILE
The client is a mid-sized European industrial gas equipment producer supplying nitrogen and hydrogen generation systems into both electronics and heavy manufacturing channels, with revenue in the low hundreds of millions of dollars (client-reported, unverified by MMA). The company had historically sourced membrane and catalyst materials on spot markets and sold primarily into commodity domestic accounts, with only limited hydrogen safety certification experience.
STRATEGIC CHALLENGE
Margin compression from rising materials volatility and intense commodity equipment price competition pushed the client to seek a higher-value revenue mix within a reasonable investment horizon. Leadership wanted to understand whether pursuing hydrogen generation safety certification justified the capital and multi-year time investment relative to simply expanding existing commodity equipment capacity further.
MMA APPROACH
MMA combined its primary survey dataset with 47 expert interviews across manufacturer procurement and engineering teams to map qualification timelines, pricing premiums, and supplier switching behavior by channel. The engagement then benchmarked the client's full cost structure against five comparable producers using a single, consistent revenue-based comparison basis throughout the analysis.
KEY FINDINGS
  1. Hydrogen generation buyers pay a substantial premium over commodity equipment pricing, but full safety certification typically takes twelve to eighteen months to complete from initial application through approval.
  2. The client's existing membrane and catalyst sourcing relied entirely on spot purchasing, exposing roughly 38 percent of cost of goods sold to materials volatility with no contractual price protection or lead-time guarantee whatsoever in place.
  3. Five benchmarked competitors with hydrogen generation certification captured materially higher revenue per unit than the client's commodity-weighted product mix, even after accounting for their additional certification and compliance overhead costs.
  4. High-purity nitrogen generation systems showed the second-strongest margin opportunity behind hydrogen generation certification, requiring lower capital investment than full safety qualification while still commanding a meaningful price premium.
CLIENT PROFILE
The client is a mid-sized European industrial gas equipment producer supplying nitrogen and hydrogen generation systems into both electronics and heavy manufacturing channels, with revenue in the low hundreds of millions of dollars (client-reported, unverified by MMA). The company had historically sourced membrane and catalyst materials on spot markets and sold primarily into commodity domestic accounts, with only limited hydrogen safety certification experience.
STRATEGIC CHALLENGE
Margin compression from rising materials volatility and intense commodity equipment price competition pushed the client to seek a higher-value revenue mix within a reasonable investment horizon. Leadership wanted to understand whether pursuing hydrogen generation safety certification justified the capital and multi-year time investment relative to simply expanding existing commodity equipment capacity further.
MMA APPROACH
MMA combined its primary survey dataset with 47 expert interviews across manufacturer procurement and engineering teams to map qualification timelines, pricing premiums, and supplier switching behavior by channel. The engagement then benchmarked the client's full cost structure against five comparable producers using a single, consistent revenue-based comparison basis throughout the analysis.
KEY FINDINGS
  1. Hydrogen generation buyers pay a substantial premium over commodity equipment pricing, but full safety certification typically takes twelve to eighteen months to complete from initial application through approval.
  2. The client's existing membrane and catalyst sourcing relied entirely on spot purchasing, exposing roughly 38 percent of cost of goods sold to materials volatility with no contractual price protection or lead-time guarantee whatsoever in place.
  3. Five benchmarked competitors with hydrogen generation certification captured materially higher revenue per unit than the client's commodity-weighted product mix, even after accounting for their additional certification and compliance overhead costs.
  4. High-purity nitrogen generation systems showed the second-strongest margin opportunity behind hydrogen generation certification, requiring lower capital investment than full safety qualification while still commanding a meaningful price premium.
RECOMMENDED STRATEGY
Phase 1: Phase 1 (Months 1-6): Begin hydrogen generation safety certification with two target manufacturer accounts identified during expert interviews, prioritizing facilities with near-term volume needs. Phase 2: Phase 2 (Months 6-18): Negotiate multi-year membrane and catalyst contracts covering at least half of projected volume, reducing spot market exposure ahead of the next cycle. Phase 3: Phase 3 (Months 18-30): Reallocate a portion of commodity equipment capacity toward certified high-purity nitrogen production once qualification milestones are met.
OUTCOME
Within eighteen months of the engagement, the client secured qualification with one manufacturer group and began formal audit with a second, alongside a three-year membrane and catalyst contract covering 55 percent of volume (client-reported, unverified by MMA). Blended revenue per unit rose steadily over the qualification period.

Frequently Asked Questions

Foundational context covering the market sizes, CAGR, scope, country, region and competition that inform every finding below. This section is provided to cover basics and most often pre-purchase conversations, answered from the MMA Primary Research Dataset.

What is the current size of the Gas Generating Systems Market?

The Gas Generating Systems Market reached an estimated 4.6 billion dollars in 2025, spanning hydrogen, nitrogen, and oxygen generation equipment used across electronics, industrial, and food packaging applications globally.

How large will the Gas Generating Systems Market be by 2036?

The Gas Generating Systems Market is projected to reach approximately 9.48 billion dollars by 2036, driven by expanding industrial decarbonization mandates and rising electronics manufacturing capacity across major markets.

What is the CAGR for the Gas Generating Systems Market 2026 to 2036?

The Gas Generating Systems Market is forecast to grow at a compound annual growth rate of 6.8 percent between 2026 and 2036, reflecting steady expansion across both hydrogen and nitrogen generation channels.

Which segment is growing fastest?

Hydrogen generation systems are growing fastest, at roughly 11.5 percent CAGR, about 1.69 times the overall market rate, driven by expanding industrial decarbonization mandates and fuel cell adoption.

Who are the major companies in the Gas Generating Systems Market?

Major companies include Air Products and Chemicals, Linde plc, Air Liquide, Atlas Copco, and Parker Hannifin, alongside a broader group of industrial gas equipment producers competing on certification depth rather than price alone.

Which country is growing fastest?

South Asia and Pacific is the fastest-growing region, expanding as domestic electronics and industrial manufacturing investment accelerates, though East Asia retains the largest overall share of global gas generating systems demand.

Report Segmentation Architecture

The full report scope spans multiple orthogonal segmentation dimensions, with cross-tabulated demand data provided for each dimension pair. Coverage extends further to regional breakdowns, trend trajectories, and the competitive detail needed to support segment-level decision-making.

By Gas Type

  • Hydrogen Generation Systems
  • Nitrogen Generation Systems
  • Oxygen Generation Systems
  • Ozone Generation Systems
  • Specialty and Mixed Gas Systems
  • Compressed Dry Air Systems

By End-Use Industry

  • Electronics and Semiconductors
  • Industrial Manufacturing
  • Food and Beverage Packaging
  • Healthcare and Laboratories
  • Energy and Utilities

By Distribution Channel

  • Direct Manufacturer Supply
  • Distributor and Trading Partner
  • Equipment Rental and Leasing
  • Export Contract Supply

By Region

  • North America
  • Western Europe
  • East Asia
  • South Asia and Pacific
  • Latin America
  • Middle East and Africa
  • Eastern Europe

Scope, Methodology, and Coverage

Every figure in this report is reproducible from documented input assumptions. The scope below maps the historical period, the forecast horizon, the segmentation dimensions, and the countries covered, alongside the underlying primary and qualitative methodology.
Historical Period
2020 to 2025
Forecast Period
2026 to 2036
Base Year
2025 (USD billions; MMA Primary Research Dataset, August 2026)
Market Definition
This report covers the global market for onsite gas generating systems, including hydrogen, nitrogen, and oxygen generation equipment used to replace cylinder and bulk gas delivery across industrial and electronics applications. It excludes large-scale centralized gas production plants and bottled gas distribution infrastructure.
Quantitative Units
USD billions (current prices); thousand units of installed system capacity where applicable
Segmentation Dimensions
By Gas Type; By End-Use Industry; By Distribution Channel; By Region
Regions Covered
North America, Western Europe, East Asia, South Asia and Pacific, Latin America, Middle East and Africa, Eastern Europe
Countries Covered
USA, China, Germany, France, UK, Japan, South Korea, India, Australia, Canada, Brazil, Mexico, Indonesia, Vietnam, Thailand, Malaysia, UAE, Saudi Arabia, South Africa, Nigeria, Turkey, Poland, Netherlands, Italy, Spain, Sweden, Switzerland, Argentina, Colombia, Singapore, and additional markets relevant to this sector
Key Companies Profiled
Air Products and Chemicals, Linde plc, Air Liquide, Atlas Copco, Parker Hannifin, Generon IGS, Peak Scientific, NEL Hydrogen, Plug Power, ITM Power, McPhy Energy, On Site Gas Systems, Domnick Hunter, Pure Gas Products, Sysadvance, Bauer Compressors, Absolute Gas Systems, Novair, Cummins, Praxair Distribution
Quantitative Methodology
Primary survey, n=3,800 respondents, Q4 2025, six countries; demand-side model with trade association cross-validation
Qualitative Methodology
47 expert interviews, Q4 2025; applied to validate demand model assumptions, identify emerging dynamics, and assess competitive positioning
Report Format
PDF and XLSX data workbook (Word format preview document)
Publisher
Market Minds Advisory
Report Code
MMA-2026-CON-801
Published
August 2026
Contact
sales@marketmindsadvisory.com | www.marketmindsadvisory.com

Purchase the full Gas Generating Systems Market Report (2026 to 2036).

The full report expands every section summarized here with complete regional breakdowns, additional segment detail, and extended competitive profiles covering all twenty companies tracked in this study. It includes the full primary survey dataset methodology, detailed feedstock cost modeling, and quarter-by-quarter forecast sensitivity tables not included in this executive summary. Buyers also receive editable data files alongside the formatted report document for internal analysis, board presentation, and strategic planning use. Analyst inquiry access is included for ninety days following purchase, covering both scope and methodology questions in detail.
Complete regional data for all seven regions
Full profiles for all twenty tracked competitors
Editable data files in spreadsheet format
Ninety days of direct analyst inquiry access
Detailed feedstock cost and volatility modeling
Quarter-by-quarter forecast sensitivity scenarios and tables

Built For The People Who Decide

From boardroom strategy to bench-side execution, this report is read cover-to-cover by leaders shaping the next decade of their industry, turning demand scenarios, market dynamics and valuation benchmarks into decisions.
CXOs/ Presidents/ VPs/ Managers
M&A and Corporate Development
Strategy Teams and R&D Heads
Procurement and Product Directors
Regulatory and Compliance Leaders
Investor Relations and Equity Analysts