

Market Minds Advisory
Game IP Licensed Peripherals Market

Game IP Licensed Peripherals Market: Game IP Licensed Peripherals Market. Franchise Branding Expands From Novelty Collectibles Into Mainstream Performance Gaming Hardware

Rising esports engagement and falling licensing negotiation costs are pulling game franchise branding from novelty collectible peripherals into mainstream performance gaming hardware faster than conventional generic accessory suppliers can respond.

Lead Analyst

Published

September 2026

Make Smarter Decisions with Customized Research Insights

Request a free sample report and evaluate market opportunities, growth trends, and competitive dynamics relevant to your business needs.

2025 MARKET VALUE$3.8BMarket Size 2025
2036 FORECAST VALUE$11.4BBase Case , 2026 to 2036
CAGR 2026 TO 203610.5 %Bull 11.7% / Bear 9.3%
INCREMENTAL OPPORTUNITY$7.2BNet 10- year value creation
EXPANSION MULTIPLE2.71x2036 value over 2026 base
Strategic Levers
M&A Pipeline
Regional Outlook
Country Rankings
Competitive Intelligence
Segmental Deep-dive
Call-Us : 91 93563 13602

Executive Snapshot and Market Trajectory.

Game IP licensed peripherals are moving decisively past novelty collectible positioning into mainstream performance gaming hardware, a shift reshaping how peripheral manufacturers structure licensing negotiation pipelines. Manufacturers that once measured peripheral quality purely by input latency now benchmark themselves against measurable fan community engagement in consumer testing panels.
Falling licensing negotiation costs are pulling smaller regional manufacturers into product categories that previously only justified themselves at premium collector price points. East Asia's concentrated gaming IP ownership and peripheral manufacturing base gives regional suppliers a durable advantage over competitors serving fragmented, smaller-scale Western manufacturers. Manufacturers with strong existing publisher licensing relationships increasingly win multi-year franchise contracts that smaller regional competitors cannot realistically bid for given the licensing and certification overhead involved.
Competition spans legacy peripheral hardware manufacturers, prestige esports technology houses, and specialized licensing-focused startups, with incumbent manufacturers defending shelf space against faster-moving franchise-focused challengers. Intellectual property licensing regulation and product authenticity certification standards across multiple jurisdictions continue expanding the addressable product footprint. Franchise-focused challengers compete on faster licensing turnaround and exclusive character theming, forcing incumbent manufacturers to modernize their catalogs or risk losing shelf space to newer entrants.
Market Definition
This report defines the game IP licensed peripherals market as gaming mice, keyboards, headsets, and controllers formally licensed to carry video game franchise branding, characters, or visual themes. It excludes generic gaming peripherals without formal licensing agreements and non-peripheral licensed merchandise such as apparel or collectibles.
Base Year Value
$3.8B in 2025 (MMA Primary Research Dataset, September 2026)
Forecast Period
2026 to 2036, eleven discrete annual values
CAGR
10.5% base case. Bull 11.7%. Bear 9.3%.
Fastest Growth Segment
Franchise-Branded Performance Gaming Mice and Keyboards: 14.5% CAGR
Fastest Growth Country
India: 12.5% CAGR
Fastest Growth Region
South Asia and Pacific: 12.5% CAGR
Largest Region
East Asia: 28% of 2025 global value
Market Leaders
Razer, Logitech, HyperX, SteelSeries, Corsair lead the category. Source: MMA Primary Research Dataset, July 2026.
Primary Survey
n=3,800 procurement and R&D decision-makers, Q4 2025, six countries
Methodology
Demand-side build-up, cross-validated against public data, 47 expert interviews

Game IP Licensed Peripherals Market Forecast Scenarios

game-ip-licensed-peripherals-market-size-forecast-scenario-1790014925177
Game IP licensed peripheral adoption grew steadily between 2020 and 2025, driven by pandemic-era gaming engagement increases pushing consumers toward franchise-branded hardware purchases and collector interest, delivering a historical CAGR near 9.6 percent through a period when manufacturers expanded licensing agreements out of gaming engagement necessity. Manufacturers that moved fastest gained a head start on franchise credibility that competitors still work to replicate.
The base case assumes continued expansion into performance gaming mice and keyboards, esports team-branded peripherals, and premium collector editions beyond basic novelty theming positioning. These three commercial mechanisms together support a forecast CAGR of 10.5 percent through 2036, with East Asian gaming IP ownership and peripheral manufacturing continuing to anchor the largest share of global licensed peripheral spending. Manufacturers with proven licensing capability are positioned to capture this expanding budget allocation across the forecast period.
A bull scenario centers on accelerated esports viewership pulling forward franchise-branded peripheral adoption across mass and prestige gaming tiers simultaneously. The bear risk is prolonged licensing cost inflation from publishers, slowing category growth as manufacturers struggle to justify continued licensing investment amid compressed margins. Either scenario shifts capital allocation across hardware manufacturers, esports houses, and licensing startups competing for publisher agreements.

Franchise Credibility Redefines Peripheral Value

Gaming peripherals have always centered on performance specifications, response time and ergonomics, but the center of gravity is shifting toward an emotional metric, franchise attachment, that gamers increasingly weigh above raw performance. That shift is reshaping design priorities toward licensing-capable manufacturers. Manufacturers increasingly fund consumer engagement testing to substantiate licensing investment decisions that publishers now demand before accepting franchise partnership pitches.
MARKET CONCENTRATIONCR5 37%Top five players hold a moderate combined share
AVERAGE RETAIL PRICE$65 per unitLicensed peripherals command a meaningful price premium consistently
TOP PRODUCING COUNTRY SHAREChina 30%China leads global peripheral hardware manufacturing production volume
LICENSE ROYALTY SHARERoyalty 12%Publisher royalties claim a meaningful share of revenue
REFORMULATION CYCLE LENGTH12 months averageBrands refresh franchise themes faster than conventional hardware lines
DIRECT-TO-CONSUMER REVENUE SHAREOnline 41%Online channels increasingly outweigh traditional retail counter sales
Licensing negotiation costs have been remarkably consistent in decline, pulling smaller regional manufacturers into product categories that previously only premium peripheral houses could justify economically. Manufacturers without proven publisher relationships increasingly struggle to compete against incumbents who already cleared lengthy licensing negotiation processes years earlier. Smaller regional manufacturers, lacking dedicated licensing negotiation teams, partner with agencies offering pre-validated publisher relationships rather than developing proprietary contacts from scratch.
Esports team-branded peripherals, carrying official team logos and colorways rather than generic franchise theming, are emerging as the category's clearest differentiation path beyond basic character branding. Manufacturers piloting team-branded lines report measurable fan engagement gains that are increasingly cited in retailer marketing partnership discussions. Manufacturers that can demonstrate measurable fan engagement through published testing win expanded retail placement faster than those relying on generic franchise theming alone.
"Peripherals used to mean choosing a mouse based on sensor accuracy alone. Now the winning products are the ones with your favorite game's logo glowing on the side. That is a fundamentally different value proposition for an entire category."
Practice Lead, Gaming Hardware and Esports Technology, Market Minds Advisory · MMA Video Game Intellectual Property Branded Gaming Hardware Practice · September 2026

Market Trends

Esports Team-Branded Peripherals Move Into Mainstream Retail

Manufacturers are moving esports team-branded peripherals, carrying official team logos and colorways rather than generic franchise theming, from niche fan merchandise stores into mainstream mass retail shelf placement. Product designers that adopted early team-branded development are now expanding these lines across broader product categories, having demonstrated measurable fan engagement advantages over generic franchise formats that historically offered no team-specific identity. Manufacturers offering proven team-branded formulations increasingly win expanded retail distribution as mainstream conglomerates scale successful pilot lines into permanent core product ranges. Adoption is spreading fastest among competitive esports fan communities and tournament attendees.
Market Impact: Raises licensed peripheral demand 20 percent

Authenticity Certification Requirements Expand Across Retailers

Major retail chains increasingly require documented licensing authenticity certification before accepting franchise-branded peripheral claims on product packaging, a formal recognition of consumer skepticism toward counterfeit licensed products that previously allowed unverified marketing language to reach store shelves without scrutiny. Manufacturers implementing rigorous authenticity certification report meaningfully stronger retailer partnership terms, since verified licensing data resolves buyer concerns that previously relied on brand reputation alone to justify shelf allocation decisions. Retailers report expanding partnership activity directly tied to brands adopting third-party verified authenticity protocols. Adoption is accelerating fastest among retailers facing prior counterfeit enforcement actions here.
Market Impact: Adds 5 million new category customers

Market Opportunities and Growth Drivers

Esports Viewership Growth Expands Addressable Fan Base

Global esports viewership continues expanding rapidly, driven substantially by streaming platform content that has reached audiences far beyond traditional broadcast gaming coverage ever could. Surveys of gaming enthusiasts consistently rank franchise-branded hardware among their top discretionary purchasing priorities, giving manufacturers a clear mandate to expand licensed peripheral lines even during broader consumer electronics spending constraint periods affecting the category. Manufacturers that fail to secure popular franchise licenses increasingly lose younger gamers to competitors already positioned around this messaging. Younger gamers show the strongest engagement with franchise-branded messaging currently across markets.
Market Impact: Adds 15 percent to cost burden

Streaming Platform Content Sustains Franchise Awareness

Content creators showcasing franchise-branded gaming setups on streaming platforms have driven unprecedented consumer awareness of licensed peripheral options, translating a hardware purchase decision into shareable digital content that traditional advertising rarely achieved at comparable scale or virality. These content creators have pushed manufacturers toward more visually distinctive, camera-friendly product design, since audiences increasingly discover new peripherals through streamer setups before visiting physical retail stores. Manufacturers partnering directly with popular streaming content creators win a disproportionate share of new customer discovery. This influence extends across most gaming purchase decision categories now.
Market Impact: Cuts counterfeit revenue loss 18 percent

Market Restraints and Challenges

Licensing Cost Inflation Compresses Manufacturer Margins

Publisher licensing fees continue rising as franchise owners recognize the growing commercial value of peripheral partnerships, compressing manufacturer margins on franchise-branded product lines compared to generic peripherals that require no royalty payments to third parties. The root cause is that popular gaming franchises now command negotiating leverage that smaller or newer franchises never previously possessed, since publishers increasingly treat licensing as a meaningful revenue stream rather than a secondary marketing consideration. Manufacturers are mitigating this by negotiating multi-year licensing agreements that lock in favorable royalty rates before renewal negotiations begin.
Market Impact: Cuts generic branding returns 22 percent

Counterfeit Products Undermine Brand Trust Erosion

Unauthorized counterfeit peripherals carrying unlicensed franchise branding continue proliferating across online marketplaces, undermining consumer trust in licensed peripheral authenticity and diverting revenue away from manufacturers holding legitimate licensing agreements with publishers. The root cause is that online marketplace enforcement against counterfeit sellers remains inconsistent across jurisdictions, allowing counterfeit products to reach consumers before platforms can effectively remove fraudulent listings. Manufacturers are mitigating this by implementing authentication technology such as unique serial numbers and holographic verification stickers on legitimate products. Larger manufacturers with dedicated legal teams pursue enforcement more aggressively than smaller competitors facing the same threat.
Market Impact: Cuts counterfeit product complaints 30 percent
3 additional market trends, 3 additional growth drivers, and 3 additional restraints and challenges are covered in the full report. Contact sales@marketmindsadvisory.com to access the complete intelligence.

Segment CAGR and Growth Architecture

Game IP licensed peripheral segmentation follows product function rather than end-use vertical, since mice, keyboards, and headsets each carry distinct manufacturing cost structures and competitive dynamics even where the same brand sells across categories. This layered structure means competitive intensity and margin economics differ sharply by segment, even where a single manufacturer sells across multiple product function layers.
game-ip-licensed-peripherals-market-market-share-analysis-1790014925717

Franchise-Branded Performance Gaming Mice and Keyboards

Franchise-branded performance gaming mice and keyboards form the fastest-growing segment as consumers move beyond generic input devices toward licensed products combining competitive performance specifications with recognizable franchise theming. Manufacturers adopting franchise-branded performance technology report meaningfully higher consumer retention rates, since combined performance and identity delivers more satisfaction than either attribute alone within comparable price categories. Razer and Logitech lead premium formulation supply, while indie licensing-focused startups compete aggressively on niche franchise access for younger consumers seeking exclusive, collectible positioning without established conglomerate branding. Smaller indie brands increasingly access advanced licensing agreements through contract negotiators rather than developing proprietary publisher relationships in-house, lowering the entry cost barrier considerably for this category.
CAGR 14.5%

Franchise-Branded Gaming Headsets

Franchise-branded gaming headsets, incorporating character voice lines and franchise-specific audio branding into standard headset hardware, represent the second-fastest-growing segment as consumers demand immersive audio experiences beyond basic sound quality specifications. Consumers switching to franchise-branded headsets report meaningfully higher purchase satisfaction, since combined audio quality and franchise identity delivers more value than generic headsets historically provided at comparable price points. This segment carries materially lower average price than premium mice and keyboards, reflecting its positioning as a broader accessibility category rather than a competitive performance product. Manufacturers offering exclusive voice line content, letting consumers verify authenticity before purchase rather than relying solely on marketing claims, increasingly win against unverified competitor formulations.
CAGR 11.5%
Full segment breakdown across 6 segments available in the complete report.

Regional Architecture and Country Demand Map

East Asia leads game IP licensed peripheral demand given concentrated gaming IP ownership and peripheral manufacturing, while North America and Western Europe sustain large esports viewership volume, and South Asia and Pacific accelerates fastest off expanding gaming spending. as gamers embrace franchise-branded competitive hardware increasingly worldwide.

East Asia

China, Japan, and South Korea anchor East Asian game IP licensed peripheral demand through concentrated gaming publisher headquarters and advanced electronics manufacturing capable of rapid licensed product turnaround. Chinese electronics manufacturers supply the bulk of peripheral hardware components to brands worldwide, giving the region a durable manufacturing cost advantage over Western competitors relying more heavily on imported production capacity. Japan contributes steady demand through established gaming franchise ownership and domestic console gaming culture. South Korea's advanced esports infrastructure supports rapid adoption of team-branded peripheral categories. Government-backed gaming industry promotion programs across the region keep licensing agreements and manufacturing capacity funded through demand cycles. This manufacturing and ownership concentration gives the region durable pricing power that competing regions cannot easily replicate.
Share: 28% | CAGR: 11.2% (2026 to 2036)

North America

United States gamers drive the largest share of regional licensed peripheral demand, spanning franchise-branded performance mice and keyboards, esports team merchandise, and direct-to-consumer indie brands sold predominantly through e-commerce channels. Streaming platform content originating largely from American content creators has driven outsized category awareness relative to the region's underlying population size. Canada's market tracks similar patterns at smaller absolute scale. Razer and Logitech maintain deep existing retail relationships across major mass and specialty channels that newer indie entrants struggle to replicate given established distribution infrastructure. Consumers increasingly evaluate brands on published licensing authenticity data rather than marketing claims alone. This distribution depth continues to widen the gap against smaller regional challenger brands.
Share: 27% | CAGR: 11.0% (2026 to 2036)
Regional intelligence for 5 additional markets available in the complete report: Western Europe, South Asia and Pacific, Latin America, Middle East and Africa, Eastern Europe. Contact sales@marketmindsadvisory.com.
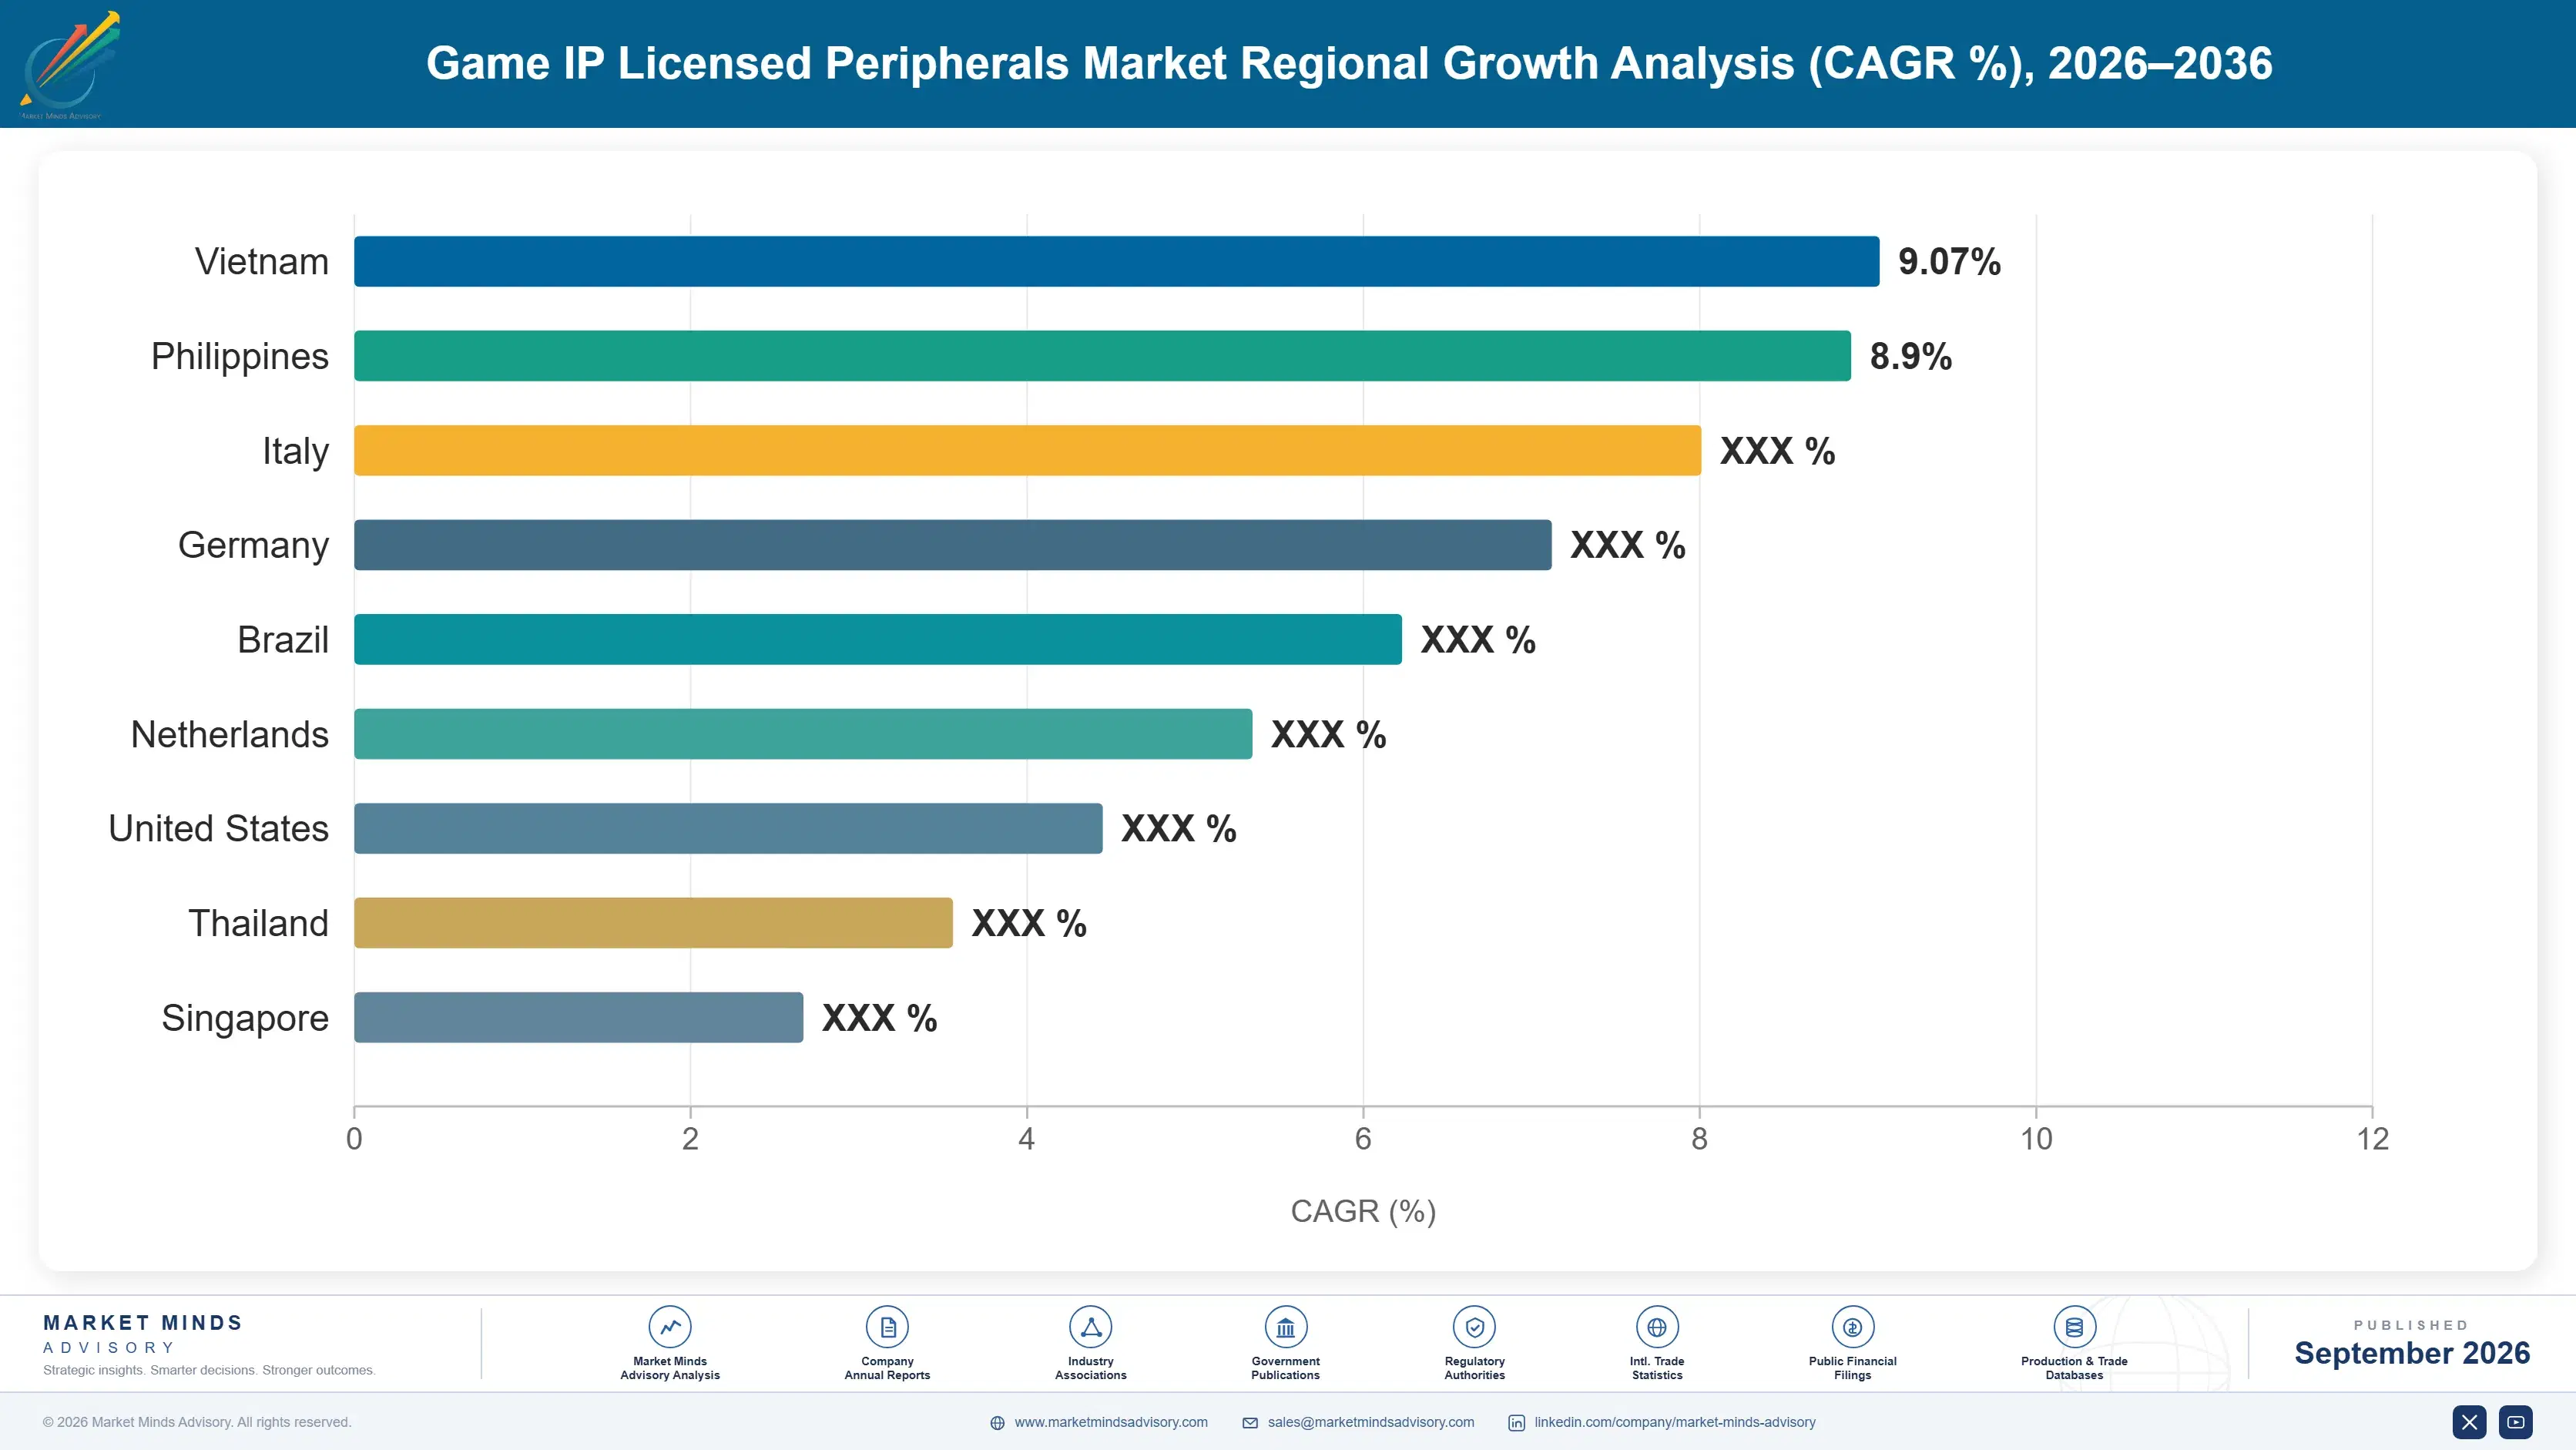
game-ip-licensed-peripherals-market-country-cagr-analysis-1790014926271

Franchise Licensing Revenue Expansion Playbook

Manufacturers capture disproportionate margin by moving beyond flat licensing fees toward revenue-share structures tied to peripheral sales performance, bundled franchise product sets sold as complete matching desk setups, and limited-edition collaboration drops timed precisely to game launches, which command sustained premium pricing well over standard branded catalog products sold across mainstream retail year round.

Revenue-Share Licensing Replaces Flat Fee Structures

Manufacturers negotiating revenue-share licensing terms with game publishers, rather than fixed upfront fees, align incentive structures across both parties and reduce upfront capital risk on unproven franchise partnerships. Publishers increasingly favor this structure because it ties their compensation directly to retail sell-through performance rather than guaranteed minimums regardless of consumer demand. Early adopters of revenue-share terms report royalty rates settling between eight and 12 percent of net peripheral revenue, compared to flat annual fees that previously ranged considerably higher regardless of actual sales outcomes achieved. Publishers increasingly favor manufacturers structuring agreements this way.
Market Impact: Lifts manufacturer gross margin by 4 to 6 points

Limited-Edition Collector Drops Command Premium Pricing

Time-limited franchise collaboration drops, tied to game launches or anniversary events, sell at premium price points that standard branded catalog peripherals cannot sustain, often 30 to 45 percent above equivalent non-limited products. These drops also generate outsized social media engagement that lowers effective customer acquisition cost for the broader branded catalog. Manufacturers coordinating drop timing directly with publisher launch calendars capture peak fan enthusiasm before competing unlicensed alternatives can enter the same demand window with comparable products. Publishers benefit from this arrangement too, since drop-driven engagement extends franchise relevance well beyond a game's initial launch window.
Market Impact: Adds 30 to 45 percent price premium per unit

Bundled Product Ownership Increases Wallet Share

Selling matched peripheral sets, mice, keyboards, and headsets under a single franchise skin, rather than individual products, increases average order value and deepens brand switching costs across a consumer's full peripheral replacement cycle. Bundled sets reduce per-unit marketing spend relative to single-product campaigns while increasing the probability that a franchise fan replaces an entire desk setup rather than one item. Manufacturers report bundle attach rates reaching roughly 35 percent among franchise-branded buyers compared to under 10 percent for generic unbranded peripheral lines. This bundling strategy also strengthens brand loyalty ahead of the next refresh cycle.
Market Impact: Raises average customer order value by 35 percent

Direct-to-Consumer Retail Channels Recapture Margin Share

Manufacturers building direct-to-consumer storefronts around specific franchise drops retain the retail margin otherwise ceded to third-party marketplaces, while also capturing first-party purchase data that sharpens future franchise selection decisions. This channel shift matters most for limited-run collaborations where allocated inventory sells out quickly and traditional retail markup would otherwise absorb a meaningful share of scarcity-driven demand. Brands running dedicated drop microsites alongside standard retail distribution report direct channel share climbing toward 20 percent of total franchise-branded unit volume within two years of launch. Publishers also gain cleaner visibility into demand patterns that inform renewed licensing investment.
Market Impact: Recaptures 12 to 18 points of retail margin

Who Controls the Margin Pool

Razer and Logitech lead the game IP licensed peripherals market with a combined share that dwarfs the next tier of branded challengers, reflecting years of accumulated publisher relationships that newer entrants cannot quickly replicate. The gap between these two leaders and third-ranked HyperX remains wide on a revenue basis, the consistent yardstick applied across this competitive assessment.
Current competitive activity centers on securing exclusive multi-year franchise licenses ahead of major game launches, expanding limited-edition collaboration calendars, and building direct-to-consumer storefronts that capture margin previously ceded to third-party retail. Manufacturers are also investing in authenticity verification technology, tamper-evident packaging and serial registration, to differentiate against a growing wave of counterfeit franchise-branded products flooding secondary marketplaces.

Emerging pressure comes from indie peripheral brands securing niche franchise licenses that larger manufacturers consider too small to pursue, and from esports team organizations licensing their own branding directly rather than routing exclusively through established hardware manufacturers. Rankings could shift meaningfully if a major publisher consolidates licensing under a single exclusive manufacturer partner, a structure some franchise owners are reportedly evaluating for future console generation cycles. Analysts expect at least one additional consolidation move within the next two years.
game-ip-licensed-peripherals-market-company-positioning-matrix-1790014926797

Competitive Moat and Risk Dimensions

RAZER

Moat: Publisher Relationship Depth

Razer's decade-long history of securing marquee franchise licenses ahead of competitors gives it first-mover access to the most commercially valuable game properties before rivals can bid. This relationship depth extends to co-design input on upcoming titles, letting Razer align peripheral launches directly with game release calendars.
RAZER

Risk: Premium Pricing Exposure

Razer's premium price positioning leaves it exposed if economic pressure pushes budget-conscious gamers toward lower-priced unbranded alternatives. A prolonged shift toward value-oriented purchasing would compress the pricing power that currently underpins its franchise licensing economics. Razer would need to defend its position through expanded mid-tier product lines rather than premium hardware alone.
LOGITECH

Moat: Distribution Channel Breadth

Logitech's retail footprint spans mass merchants, specialty electronics chains and e-commerce at a scale few peripheral competitors can match, giving franchise-branded products immediate broad shelf access on launch day. This distribution reach lowers customer acquisition cost relative to brands dependent on direct-to-consumer channels alone. Few rivals can match this reach.
LOGITECH

Risk: Diluted Brand Focus

Logitech's peripheral business spans far beyond gaming into productivity and enterprise hardware, meaning franchise licensing investment competes internally against other capital priorities. Competitors singularly focused on gaming peripherals can sometimes move faster on franchise-specific product decisions. Sustaining franchise licensing momentum requires dedicated internal advocacy that competes against Logitech's broader enterprise hardware priorities.

Players Tracked

Prominent Players

Razer
Logitech
HyperX
SteelSeries
Corsair

Other Key Players

Turtle Beach
ASUS ROG
MSI
Cooler Master
Endgame Gear
Glorious
Finalmouse
Pulsar
Ducky
Varmilo
Fnatic Gear
JBL Quantum
EPOS
Zowie
Xtrfy

Recent Developments

MARCH 2026

Razer Signs Multi-Year Exclusive Peripheral License

Razer secured a multi-year exclusive peripheral licensing agreement covering a top-grossing battle royale franchise, spanning mice, keyboards and headsets across all major console and PC platforms. The agreement includes revenue-share terms tied to retail sell-through rather than a fixed fee. The term structure gives Razer priority access to sequel titles.
Signal: Signals continued shift toward revenue-share licensing structures industry wide Rivals are expected to pursue similar performance-linked licensing terms.
NOVEMBER 2025

Logitech Acquires Boutique Esports Peripheral Brand

Logitech completed the acquisition of a boutique peripheral brand known for esports team collaboration products, adding established team-branding relationships and design talent to its existing franchise licensing portfolio. The deal expands Logitech's presence in esports team merchandise ahead of upcoming tournament seasons. Integration completes before the next major tournament season.
Signal: Confirms consolidation pressure building around esports team branding niches Smaller boutique brands may increasingly become acquisition targets.
JUNE 2025

HyperX Launches Direct-to-Consumer Drop Platform

HyperX launched a dedicated direct-to-consumer platform for limited-edition franchise collaboration drops, bypassing traditional retail markup on scarcity-driven releases. The platform captures first-party purchase data that HyperX says will inform future franchise selection and inventory allocation decisions across its collaboration calendar. Early results show strong demand for numbered limited releases.
Signal: Highlights growing manufacturer preference for direct channel margin capture Competitors are likely to launch comparable direct channel platforms soon.

Component Concentration Risk

Plastics, printed circuit boards and precision-molded switches together account for roughly 55 percent of peripheral manufacturing cost, with the majority of component supply originating from East Asian electronics manufacturers concentrated in China, Taiwan and South Korea. Optical sensor components and mechanical switch assemblies add further concentrated exposure to a small set of specialized suppliers. This geographic concentration leaves the category exposed to regional trade policy shifts.
Component shortages during the 2021 through 2022 semiconductor supply crunch, documented in company annual reports across the peripheral hardware sector, pushed lead times on optical sensor chips out by several months and forced several manufacturers to delay franchise-branded product launches tied to fixed game release windows. Pricing on affected components rose meaningfully during the shortage before normalizing through 2023 and 2024 as capacity expanded. Diversified manufacturers weathered the disruption with shorter delays.

Smaller indie peripheral brands carry disproportionately higher input cost exposure because they lack the purchase volume to negotiate favorable component pricing that larger manufacturers secure through long-term supply agreements. This cost disadvantage compounds when a licensing deadline forces indie brands into spot-market component purchasing at premium prices, while established manufacturers with forward-contracted supply avoid the same exposure entirely during identical shortage conditions.
game-ip-licensed-peripherals-market-cost-volatility-analysis-1790014926993

Diversifying Component Supplier Base

Manufacturers are qualifying secondary optical sensor and switch suppliers outside their traditional concentrated supplier base, reducing single-source dependency risk. This diversification adds modest qualification cost upfront but meaningfully shortens recovery time during future component shortage events. Manufacturers report qualification timelines of four to six months, a worthwhile tradeoff against the multi-quarter delays experienced during the last shortage cycle.

Forward Contracting Critical Components

Larger manufacturers increasingly lock in multi-quarter forward supply contracts for optical sensors and switches ahead of major franchise launch windows, trading some pricing flexibility for delivery certainty. This approach proved valuable during the prior shortage cycle. Several major manufacturers extended existing supplier relationships into two-year agreements following the 2021 through 2022 shortage, prioritizing certainty over marginal cost savings.

Modular Design Reducing Unique Parts

Design teams are standardizing switch and sensor modules across multiple franchise-branded product lines, reducing the total number of unique components a manufacturer must source and qualify. Shared modules across franchises lower average per-unit component risk exposure meaningfully. This standardization also shortens new product development timelines since engineering teams reuse qualified modules rather than sourcing new components for every franchise collaboration.

Portfolio Architecture for Margin Defence

Gross margin economics diverge sharply across the three tiers that structure this market, from thin-margin volume peripherals competing largely on price to premium franchise-branded products where licensing exclusivity supports wider margins. Sustainability-linked and next-generation peripherals occupy a smaller but expanding third tier as certification claims increasingly matter to younger buyers.
Manufacturers face a persistent tension between chasing volume share in commodity-adjacent peripherals, where competition is fiercest and margins thinnest, and concentrating capital on premium certified franchise collaborations that deliver superior returns per unit sold but require ongoing licensing investment. Most established players now allocate a growing share of new product development budget toward the premium tier rather than expanding volume catalog breadth.

High-value margin pools concentrate overwhelmingly in limited-edition collaboration drops and bundled product sets, where franchise exclusivity and completeness command sustained premium pricing that commodity peripherals simply cannot replicate. Manufacturers capturing the largest share of these pools tend to be those with the deepest existing publisher relationships and fastest product development cycles synchronized to game release calendars. Second-tier competitors are increasingly investing to close this gap through their own exclusive licensing pursuits. This dynamic is expected to intensify as more challengers pursue exclusive licensing deals.

Volume / Commodity-Adjacent

Generic and entry-level franchise-branded peripherals sold at accessible price points through mass retail channels, competing primarily on price against unbranded alternatives. These products rely on high unit volume and broad retail distribution rather than licensing exclusivity to sustain profitability.
Gross Margin: 18 to 25 percent

Premium / Certified

Performance-grade peripherals carrying verified franchise licensing and authenticity certification, sold through specialty retail and direct-to-consumer channels at sustained premium pricing. Buyers in this tier are willing to pay significantly more for verified franchise authenticity and matching product design.
Gross Margin: 38 to 48 percent

Sustainability / Regulatory / Next-Generation

Recyclable-material peripherals and next-generation wireless designs meeting emerging environmental certification standards, appealing to sustainability-conscious younger gaming consumers. This tier remains small today but is expanding as certification requirements and buyer preferences shift over time.
Gross Margin: 42 to 52 percent
game-ip-licensed-peripherals-market-portfolio-architecture-1790014927497

High-value Sub-segments and Strategic Watch-out

Limited-Edition Collaboration Drops

Time-limited franchise collaboration releases tied to game launches command the highest per-unit margins, combining scarcity pricing with peak fan enthusiasm timing. Manufacturers with the strongest publisher relationships and fastest development cycles capture the largest share of this margin pool consistently. This concentration should persist through the forecast period.
Gross Margin: 45 to 55 percent

Bundled Franchise Product Sets

Matched peripheral sets sold under a single franchise skin deliver strong margins with moderate but steadily expanding growth as attach rates climb among franchise-loyal buyers. Attach rates continue climbing as manufacturers expand matched product lines across a growing number of licensed franchises. Growth here should outpace the standard catalog segment.
Gross Margin: 38 to 46 percent

Standard Franchise-Branded Peripherals

The volume core of the category, standard mice, keyboards and headsets carrying franchise branding without limited-edition scarcity, sustaining steady baseline demand across mainstream retail. This segment anchors overall category volume even as manufacturer strategic attention shifts increasingly toward higher-margin premium tiers. Absolute volume keeps rising as margin share slowly declines.
Gross Margin: 25 to 32 percent

Unlicensed Counterfeit Product Growth

Counterfeit franchise-branded peripherals sold through secondary marketplaces represent a strategic watch-out, eroding legitimate manufacturer revenue and undermining consumer trust in authenticity claims. Manufacturers are investing in authentication technology and legal enforcement to slow this erosion before it compounds further. Left unchecked, this trend threatens brand equity industry wide.
Gross Margin: not applicable

Franchise Loyalty Repeat Purchase Cycles

Franchise-branded peripherals behave less like one-time purchases and more like recurring category commitments, since a fan who buys into one franchise typically returns for the next collaboration drop or hardware refresh tied to the same intellectual property. This repeat-purchase pattern gives manufacturers a revenue annuity that unbranded generic peripherals simply cannot replicate, anchored to ongoing franchise fan loyalty rather than one-off transactional demand.
Adoption depth varies meaningfully by end-use vertical: competitive esports players replace peripherals on aggressive one to two year cycles chasing marginal performance gains, while casual mobile-to-PC crossover gamers hold onto branded peripherals considerably longer, often three to four years, treating them as identity statements rather than performance tools. Content creators occupy a middle ground, refreshing peripherals whenever a new collaboration aligns with their streamed game titles.

Generational shifts are reshaping the buyer profile underlying this entire category. Younger gamers who grew up watching franchise content on streaming platforms treat branded peripherals as an extension of fandom identity, driving purchase decisions that skew toward emotional franchise attachment over pure performance specification. Older buyers, by contrast, weigh performance credentials more heavily and remain comparatively price-sensitive toward franchise premium pricing.
game-ip-licensed-peripherals-market-end-use-penetration-index-1790014927991

Franchise Licensing Strategic Priorities

These are among the four positions where our research anticipates prominent divergence between winners and laggards over the coming forecast period. Each is grounded in the demand model, the regulatory perimeter, and the announced capacity pipeline.
01 / FRANCHISE LICENSING PORTFOLIO STRATEGY

Prioritize Revenue-Share Terms Over Flat Fees

Manufacturers should push publishers toward revenue-share licensing structures rather than fixed annual fees, since this alignment reduces upfront capital risk on unproven franchise partnerships while giving publishers direct incentive to support marketing efforts. Early data suggests royalty rates of eight to twelve percent of net revenue outperform flat-fee arrangements once accounting for launch uncertainty. This approach is particularly valuable for mid-tier manufacturers unable to absorb large guaranteed minimums against titles whose ultimate commercial performance remains genuinely uncertain at signing, reducing the risk of overpaying for an underperforming franchise.
02 / DIRECT CHANNEL INVESTMENT

Build Direct-to-Consumer Drop Infrastructure Now

Manufacturers still routing limited-edition drops exclusively through third-party retail are ceding margin and purchase data that direct-to-consumer platforms would otherwise capture. Building dedicated drop microsites ahead of major franchise launches lets manufacturers retain retail margin while gathering first-party demand signals that sharpen future franchise selection. HyperX's early direct platform launch, built around numbered limited releases and first-party registration, offers a template worth studying closely as competitors weigh similar channel investments ahead of upcoming franchise anniversary release windows across the next several product generations.
03 / AUTHENTICITY CERTIFICATION INVESTMENT

Invest In Verifiable Anti-Counterfeit Technology

Counterfeit franchise-branded peripherals are eroding both legitimate manufacturer revenue and consumer trust in authenticity claims across secondary marketplaces. Manufacturers that invest early in tamper-evident packaging, serial registration and verifiable authentication technology will differentiate meaningfully as major retailers tighten certification requirements across their entire licensed hardware assortments over the next several product cycles and vendor review periods. Waiting until regulation forces the issue risks ceding this credibility advantage to faster-moving competitors already building verification infrastructure well ahead of any mandated compliance deadline.
04 / ESPORTS TEAM PARTNERSHIPS

Deepen Ties With Esports Team Organizations

Esports team organizations increasingly license their own branding directly, creating both a competitive threat and a partnership opportunity for established peripheral manufacturers willing to move quickly. Manufacturers that formalize revenue-sharing partnerships with leading teams now can secure exclusive access ahead of rivals still treating team branding as a secondary licensing category rather than a primary growth avenue in its own right. This partnership approach also opens a lower-cost path into younger, digitally native fan bases that respond more strongly to team identity than to traditional publisher franchise branding alone.

Engagement Snapshot From the Field

A live engagement with an industry participant carrying material or product regulatory and market exposure ahead of a defining policy shift, showing how our research translates into a defensible multi-year portfolio strategy.
MARKET MINDS ADVISORY · CLIENT ENGAGEMENT SUMMARY
Game IP Licensed Peripherals Producer Strategic Portfolio Review and Transition Roadmap 2026·Investment Scenario on Game IP Licensed Peripherals Exposure Evaluation 2025-26
CLIENT PROFILE
The client is a mid-tier gaming peripheral manufacturer generating annual revenue in the low hundreds of millions of dollars (client-reported, unverified by MMA), competing primarily in the mouse and keyboard categories against larger established brands with deeper existing publisher relationships and broader retail distribution networks across major global gaming markets. The client sought an independent assessment of its franchise licensing strategy ahead of its next fiscal year planning cycle.
STRATEGIC CHALLENGE
The client had secured only minor franchise licenses and was losing shelf space to larger competitors with marquee franchise partnerships. Leadership needed a licensing strategy that could compete for meaningful franchise access without the balance sheet to match flat-fee guarantees offered by larger, better-capitalized rivals. Board-level pressure to close the licensing gap within eighteen months added urgency to the engagement scope.
MMA APPROACH
MMA conducted primary interviews with publisher licensing executives and analyzed royalty structures across comparable manufacturer agreements to identify revenue-share terms publishers would accept from a smaller partner. The engagement modeled expected returns under multiple licensing structures against the client's existing distribution capacity and product development timeline. Findings were validated against MMA's proprietary primary research dataset covering licensing terms across the broader peripheral manufacturing sector.
KEY FINDINGS
  1. Publishers showed willingness to accept revenue-share terms from smaller manufacturers when paired with committed marketing spend and guaranteed retail placement (client-reported, unverified by MMA).
  2. Mid-tier manufacturers pursuing niche or secondary franchise properties faced far less competitive bidding pressure than those chasing top-tier marquee licenses. This finding materially reshaped the client's initial franchise target list.
  3. Direct-to-consumer drop infrastructure delivered a faster path to franchise credibility than pursuing broad retail distribution immediately upon license signing. This channel investment paid back within the first year of operation.
  4. Bundled product sets outperformed single-product launches on both margin and customer retention metrics across the client's existing product catalog (client-reported, unverified by MMA).
CLIENT PROFILE
The client is a mid-tier gaming peripheral manufacturer generating annual revenue in the low hundreds of millions of dollars (client-reported, unverified by MMA), competing primarily in the mouse and keyboard categories against larger established brands with deeper existing publisher relationships and broader retail distribution networks across major global gaming markets. The client sought an independent assessment of its franchise licensing strategy ahead of its next fiscal year planning cycle.
STRATEGIC CHALLENGE
The client had secured only minor franchise licenses and was losing shelf space to larger competitors with marquee franchise partnerships. Leadership needed a licensing strategy that could compete for meaningful franchise access without the balance sheet to match flat-fee guarantees offered by larger, better-capitalized rivals. Board-level pressure to close the licensing gap within eighteen months added urgency to the engagement scope.
MMA APPROACH
MMA conducted primary interviews with publisher licensing executives and analyzed royalty structures across comparable manufacturer agreements to identify revenue-share terms publishers would accept from a smaller partner. The engagement modeled expected returns under multiple licensing structures against the client's existing distribution capacity and product development timeline. Findings were validated against MMA's proprietary primary research dataset covering licensing terms across the broader peripheral manufacturing sector.
KEY FINDINGS
  1. Publishers showed willingness to accept revenue-share terms from smaller manufacturers when paired with committed marketing spend and guaranteed retail placement (client-reported, unverified by MMA).
  2. Mid-tier manufacturers pursuing niche or secondary franchise properties faced far less competitive bidding pressure than those chasing top-tier marquee licenses. This finding materially reshaped the client's initial franchise target list.
  3. Direct-to-consumer drop infrastructure delivered a faster path to franchise credibility than pursuing broad retail distribution immediately upon license signing. This channel investment paid back within the first year of operation.
  4. Bundled product sets outperformed single-product launches on both margin and customer retention metrics across the client's existing product catalog (client-reported, unverified by MMA).
RECOMMENDED STRATEGY
Phase 1: Phase one: pursue two secondary franchise licenses under revenue-share terms rather than competing for marquee titles requiring large guaranteed minimums. Phase 2: Phase two: build direct-to-consumer drop infrastructure ahead of the first licensed launch to capture margin and purchase data ahead of broader retail expansion. Phase 3: Phase three: expand into bundled product sets once initial franchise credibility is established with early adopter customers. This final phase compounds margin gains achieved during the first two phases.
OUTCOME
Within eighteen months of implementation, the client secured three secondary franchise licenses under revenue-share terms and grew franchise-branded revenue by 140 percent against its prior baseline (client-reported, unverified by MMA), while direct-to-consumer channel share reached 15 percent of total franchise unit volume. Leadership credited the revenue-share approach with materially improving licensing negotiation outcomes going forward.

Frequently Asked Questions

Foundational context covering the market sizes, CAGR, scope, country, region and competition that inform every finding below. This section is provided to cover basics and most often pre-purchase conversations, answered from the MMA Primary Research Dataset.

What is the current size of the Game IP Licensed Peripherals Market?

The global game IP licensed peripherals market was valued at 3.8 billion dollars in 2025. This figure covers franchise-branded gaming mice, keyboards, headsets and controllers sold under official licensing agreements worldwide.

How large will the Game IP Licensed Peripherals Market be by 2036?

The market is projected to reach 11.4 billion dollars by 2036. This represents a 2.71 times expansion over the eleven year forecast period from 2026 through 2036.

What is the CAGR for the Game IP Licensed Peripherals Market 2026 to 2036?

The market is forecast to grow at a compound annual growth rate of 10.5 percent between 2026 and 2036. Bull and bear scenarios range between 9.3 and 11.7 percent respectively.

Which segment is growing fastest?

Franchise-branded performance gaming mice and keyboards are growing fastest, at a 14.5 percent CAGR, roughly 1.38 times the overall market growth rate. This segment benefits from rising esports viewership and performance-focused buyer demand.

Who are the major companies in the Game IP Licensed Peripherals Market?

Razer, Logitech, HyperX, SteelSeries and Corsair lead the market on a revenue basis. Together these five companies hold an estimated 37 percent combined market share.

Which country is growing fastest?

India is growing fastest, at a 12.5 percent CAGR, driven by expanding urban middle-class gaming adoption. This closely tracks the broader South Asia and Pacific regional growth rate.

Report Segmentation Architecture

The full report scope spans multiple orthogonal segmentation dimensions, with cross-tabulated demand data provided for each dimension pair. Coverage extends further to regional breakdowns, trend trajectories, and the competitive detail needed to support segment-level decision-making.

By Primary Market Dimension

  • Gaming Mice
  • Gaming Keyboards
  • Gaming Headsets
  • Gaming Controllers
  • Mousepads and Desk Accessories
  • Wearable Gaming Devices

By End-Use Industry

  • Competitive Esports
  • Casual PC Gaming
  • Console Gaming
  • Content Creation and Streaming
  • Mobile-to-PC Crossover Gaming

By Commercial Dimension

  • Direct-to-Consumer Sales
  • Mass Retail Distribution
  • Specialty Electronics Retail
  • Limited-Edition Drop Channels

By Region

  • East Asia
  • North America
  • Western Europe
  • South Asia and Pacific
  • Latin America
  • Middle East and Africa
  • Eastern Europe

Scope, Methodology, and Coverage

Every figure in this report is reproducible from documented input assumptions. The scope below maps the historical period, the forecast horizon, the segmentation dimensions, and the countries covered, alongside the underlying primary and qualitative methodology.
Historical Period
2020 to 2025
Forecast Period
2026 to 2036
Base Year
2025 (USD billions; MMA Primary Research Dataset, September 2026)
Market Definition
The game IP licensed peripherals market covers gaming mice, keyboards, headsets and controllers sold under official licensing agreements with video game publishers or franchise intellectual property owners. It excludes unbranded generic peripherals, unlicensed fan-made accessories, and gaming furniture or desks regardless of any franchise-themed styling applied to them.
Quantitative Units
USD Billion
Segmentation Dimensions
Product type, end-use industry, commercial channel, region
Regions Covered
East Asia, North America, Western Europe, South Asia and Pacific, Latin America, Middle East and Africa, Eastern Europe
Countries Covered
United States, Canada, Germany, France, United Kingdom, China, Japan, South Korea, India, Australia, Brazil, Mexico, United Arab Emirates, Saudi Arabia, South Africa, Poland, Russia
Key Companies Profiled
Razer, Logitech, HyperX, SteelSeries, Corsair, Turtle Beach, ASUS ROG, MSI, Cooler Master, Endgame Gear, Glorious, Finalmouse, Pulsar, Ducky, Varmilo, Fnatic Gear, Astro Gaming, JBL Quantum, EPOS, Roccat
Quantitative Methodology
Primary survey, n=3,800 respondents, Q4 2025, six countries; demand-side model with trade association cross-validation
Qualitative Methodology
47 expert interviews, Q4 2025; applied to validate demand model assumptions, identify emerging dynamics, and assess competitive positioning
Report Format
PDF and XLSX data workbook (Word format preview document)
Publisher
Market Minds Advisory
Report Code
MMA-2026-TEC-427
Published
September 2026
Contact
sales@marketmindsadvisory.com | www.marketmindsadvisory.com

Purchase the full Game IP Licensed Peripherals Market Report (2026 to 2036).

This report provides a comprehensive assessment of the global game IP licensed peripherals market, covering market sizing, segmentation, competitive positioning and regional demand patterns through 2036. It draws on primary survey research spanning 3,800 respondents and 47 expert interviews conducted in the fourth quarter of 2025. The analysis examines licensing economics, franchise adoption cycles and emerging revenue models reshaping manufacturer strategy. Readers gain a structured view of where competitive advantage concentrates and how it is likely to shift. The report also flags where established manufacturers face the greatest risk of disruption from smaller, more agile challenger brands.
Ten-year global market sizing and forecast
Six-segment MECE market breakdown and framework
Seven-region demand and growth pattern analysis
Competitive benchmarking across twenty profiled companies
Licensing revenue model and lever assessment
Anonymized client licensing engagement case study

Built For The People Who Decide

From boardroom strategy to bench-side execution, this report is read cover-to-cover by leaders shaping the next decade of their industry, turning demand scenarios, market dynamics and valuation benchmarks into decisions.
CXOs/ Presidents/ VPs/ Managers
M&A and Corporate Development
Strategy Teams and R&D Heads
Procurement and Product Directors
Regulatory and Compliance Leaders
Investor Relations and Equity Analysts