Market Minds Advisory
Fuser Drive Plate Market

Fuser Drive Plate Market: Fuser Drive Plates: A Shrinking Host Market, a Growing Aftermarket and Tooling Nobody Rational Would Buy Today

Office pages fell roughly 31% after hybrid working arrived, yet plate demand held up because operators keep running old machines instead of replacing them, and worn drive plates fail predictably.

Lead Analyst

Published

September 2026

Make Smarter Decisions with Customized Research Insights

Request a free sample report and evaluate market opportunities, growth trends, and competitive dynamics relevant to your business needs.

2025 MARKET VALUE$0.3BMarket Size 2025
2036 FORECAST VALUE$0.5BBase Case , 2026 to 2036
CAGR 2026 TO 20363.8 %Bull 5.0% / Bear 2.6%
INCREMENTAL OPPORTUNITY$0.1BNet 10- year value creation
EXPANSION MULTIPLE1.45x2036 value over 2026 base
Strategic Levers
M&A Pipeline
Regional Outlook
Country Rankings
Competitive Intelligence
Segmental Deep-dive
Call-Us : 91 93563 13602

Executive Snapshot and Market Trajectory.

Office printing lost roughly 31% of its page volume when hybrid working arrived and never recovered it. Drive plate demand did not follow, because operators responded by running existing machines longer rather than buying new ones, and worn plates fail on a schedule. The component outlived its host.
Production and commercial print plates grow at 5.7%, half again the market rate of 3.8%, because those pages never moved to a screen. Label and transaction printing follows at 5.2% on parcel volume that grew while office print collapsed. East Asia takes 58% of value, which reflects where imaging equipment is designed, built and supplied from rather than where it prints. Plates wear predictably at around 260,000 pages, which makes demand forecastable.
Concentration sits near 47% across the top five on measured component and assembly revenue, split between Japanese precision moulders and Chinese component groups. Aftermarket units are already 43% of volume and rising. Moulding tools amortise over about 9 years, which against a declining base is a barrier no rational new entrant would cross. Nobody new has entered this market for a very long time, and nobody will.
Market Definition
This market covers drive plates and integrated drive plate assemblies within fuser units of electrophotographic printing equipment, spanning office multifunction device plates, desktop laser printer plates, production and commercial print plates, label and transaction print plates, wide format and specialty print plates, and industrial and embedded print module plates. Revenue is measured as plate and assembly value at supplier level across original equipment and aftermarket supply. Complete fuser assemblies, fuser rollers, belts and heating elements, toner and consumables, drive motors sold separately, and inkjet printing equipment are excluded.
Base Year Value
$0.3B in 2025 (MMA Primary Research Dataset, September 2026)
Forecast Period
2026 to 2036, eleven discrete annual values
CAGR
3.8% base case. Bull 5.0%. Bear 2.6%.
Fastest Growth Segment
Production and Commercial Print Plates: 5.7% CAGR
Fastest Growth Country
Vietnam: 6.6% CAGR
Fastest Growth Region
South Asia and Pacific: 6.0% CAGR
Largest Region
East Asia: 58% of 2025 global value
Market Leaders
Enplas, Nidec, Nifco, Ninestar and Sumitomo Bakelite lead on measured plate and assembly revenue. Source: MMA Primary Research Dataset, July 2026.
Primary Survey
n=3,800 procurement and R&D decision-makers, Q4 2025, six countries
Methodology
Demand-side build-up, cross-validated against public data, 47 expert interviews

Fuser Drive Plate Market Forecast Scenarios

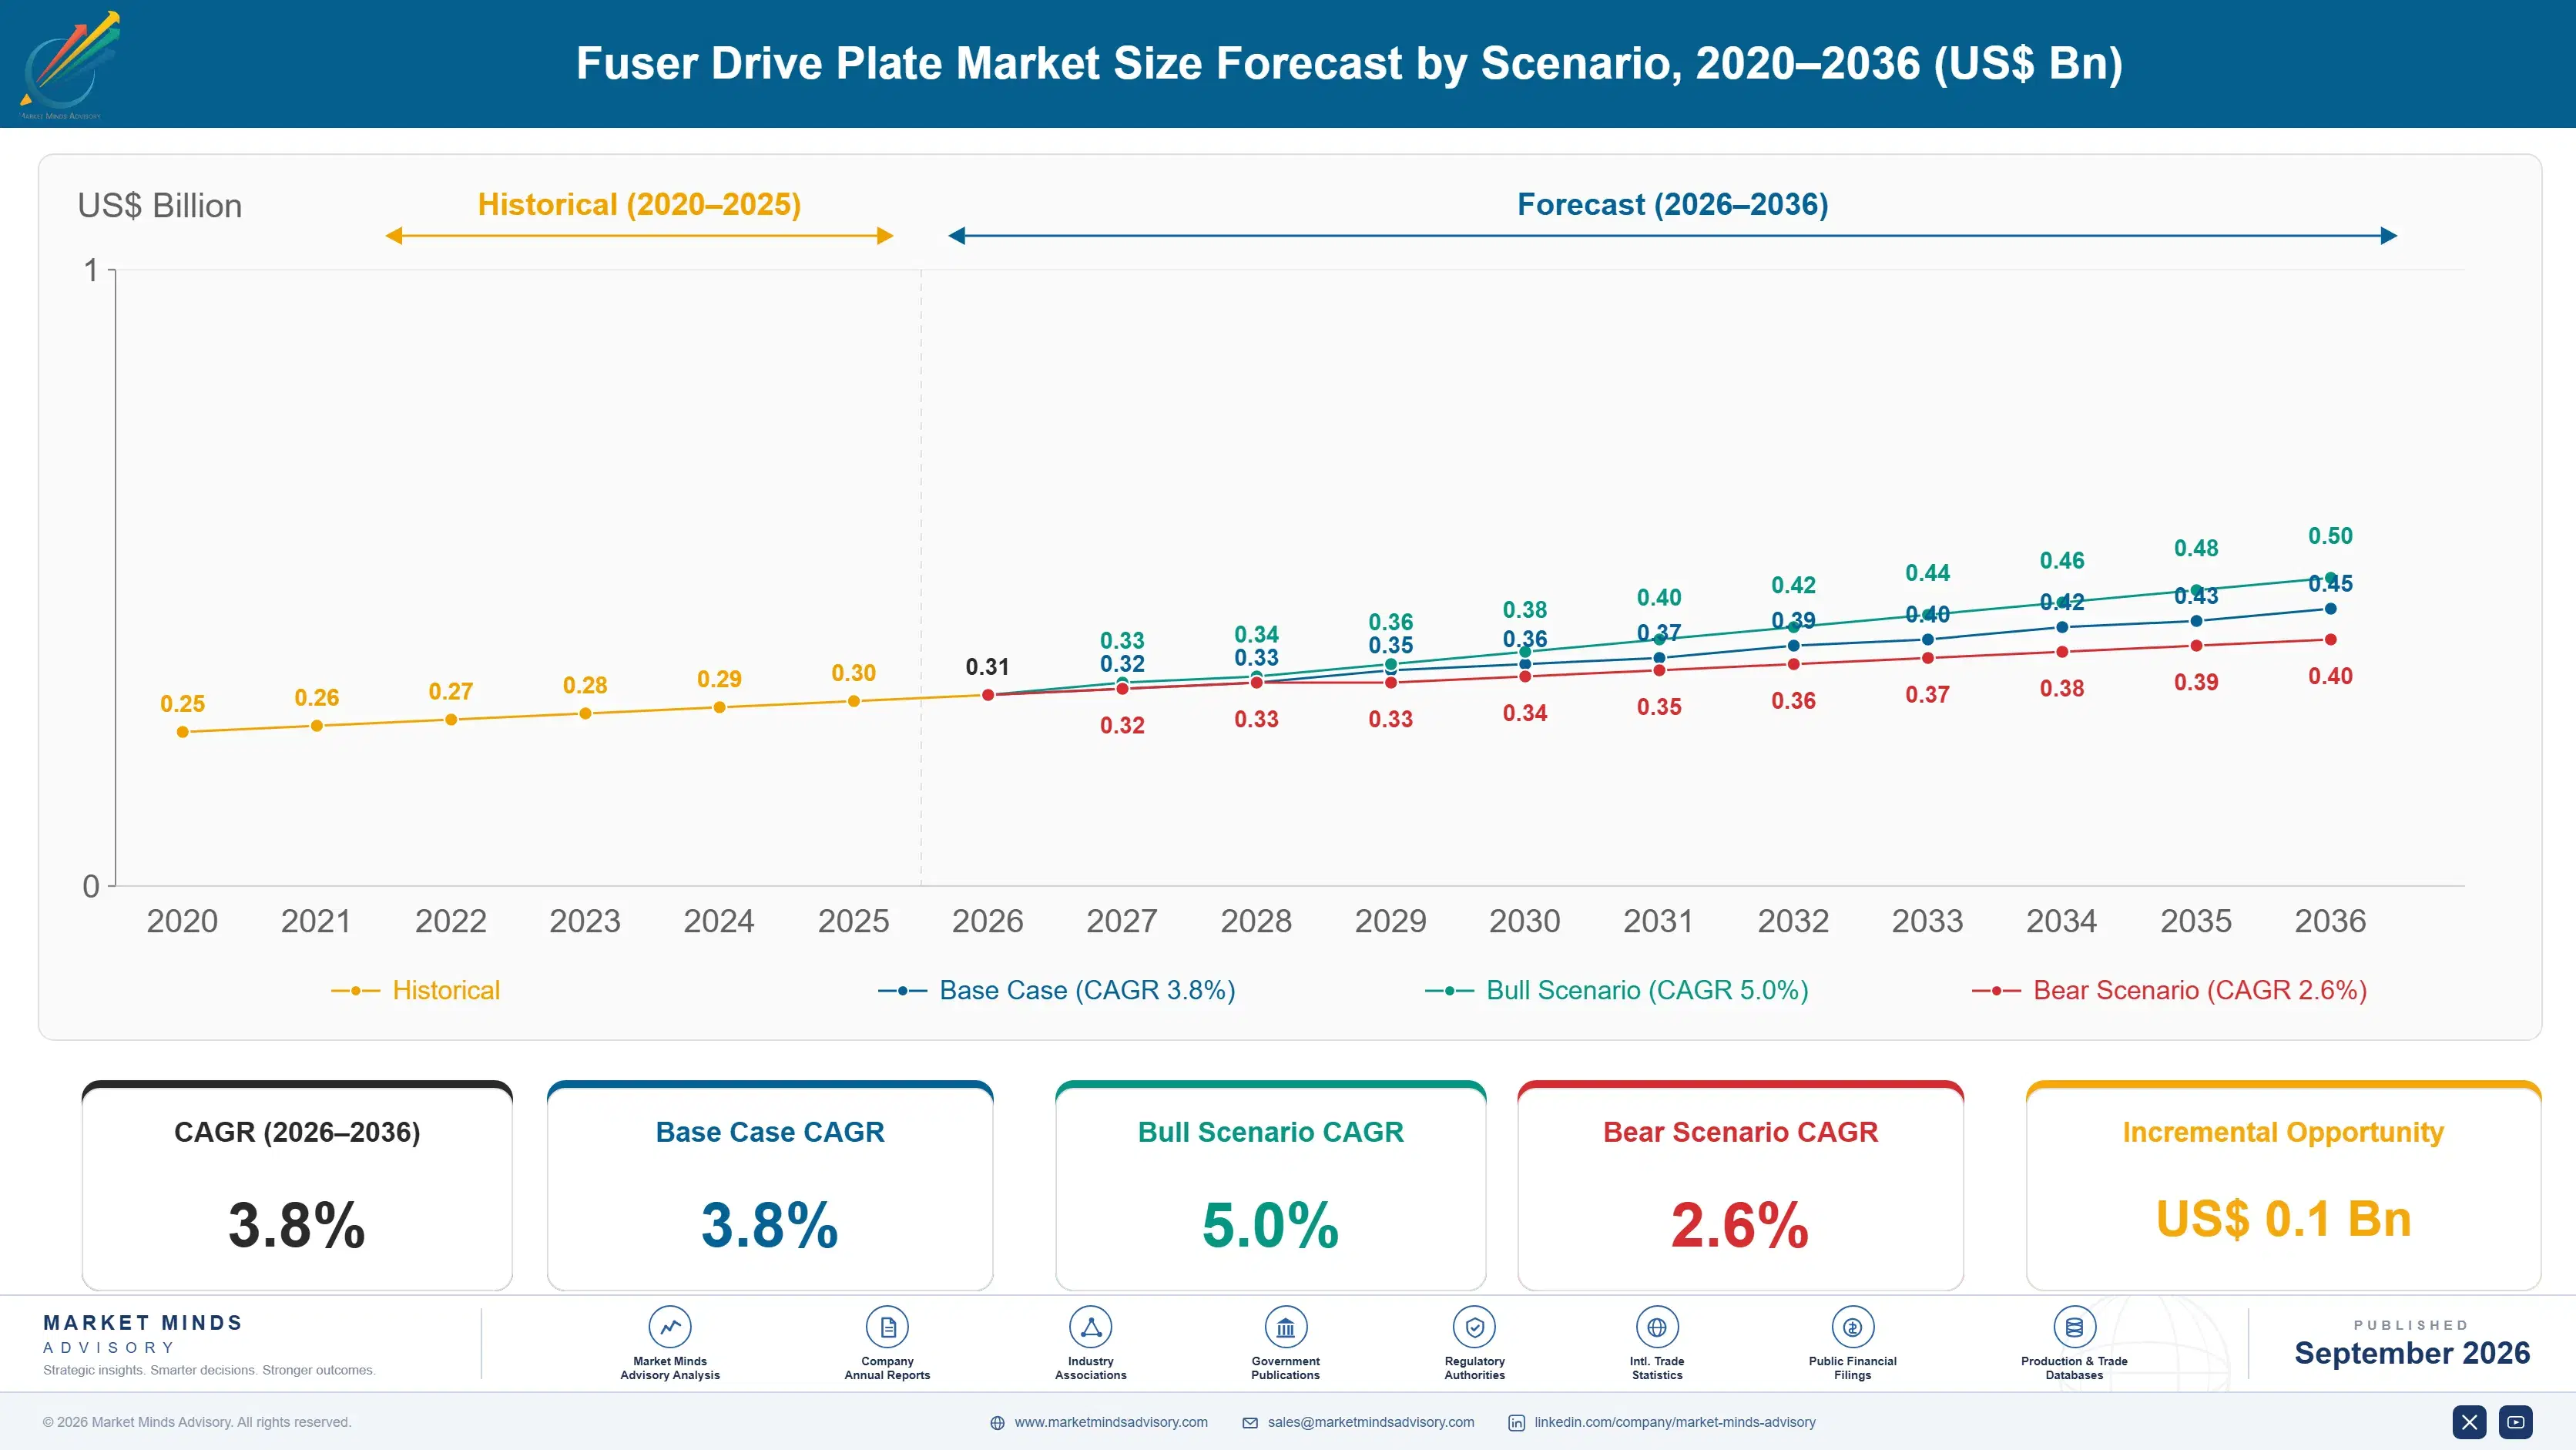
fuser-drive-plate-market-size-forecast-scenario-1788427312854
Growth ran at 3.0% from 2020 to 2025 across a period that should have been far worse. Office page volumes fell roughly 31% and never came back, and new equipment shipments fell with them. What held the component market together was the response: fleets were kept in service well past their intended replacement points, which raised service rates and pulled aftermarket demand up as original equipment demand fell.
The base case at 3.8% rests on three mechanisms. Ageing installed fleets generate replacement demand that rises as machines pass their designed service life, and drive plate wear is predictable rather than random. Production, label and transaction printing continue growing on parcel volume and packaging demand that were never affected by office working patterns. Third, aftermarket units at 43% of volume carry better margins than original equipment supply and that share keeps rising.
The bull case at 5.0% assumes fleet replacement stays deferred, since a deferred fleet consumes more parts than a renewed one. The bear case at 2.6% is that a replacement wave finally arrives and new machines with longer-life drive components reset the wear cycle, which would cut aftermarket volume sharply for several years before it recovers.

The Component Outlived Its Host

A component market usually tracks the equipment it sits inside. This one stopped. Office pages fell roughly 31% and have not returned, which should have taken drive plate demand with it. Instead operators kept machines running past replacement points, service rates rose, and aftermarket supply reached 43% of units. The host market is shrinking and the component market is not.
TOP FIVE CONCENTRATION47%Concentrated among Japanese and Chinese precision component makers
AFTERMARKET VOLUME SHARE43%Units supplied as replacement rather than into new equipment
SERVICE LIFE BEFORE REPLACEMENT260,000 pagesPrint volume before drive wear requires plate replacement
TOOLING AMORTISATION PERIOD9 yearsTime for moulding tool investment to recover its cost
OFFICE PRINT VOLUME DECLINE31%Fall in pages printed since hybrid working began
THERMOPLASTIC SHARE OF UNITS64%Plates moulded rather than stamped from sheet metal
Wear is what makes this work. A drive plate carries gear engagement and bearing seats through thermal cycling, and both degrade predictably at around 260,000 pages rather than at random. That makes a plate closer to a scheduled consumable than a spare part, and an ageing fleet generates more demand per machine each year. Service organisations plan for it, which makes demand forecastable in a way most component markets envy.
The barrier here is tooling and it is severe. Moulding tools for these plates amortise over about 9 years, and 64% of units are now moulded thermoplastic rather than stamped steel. Nobody commits new tooling capital against a host market in permanent decline. Incumbents whose tools are paid for hold a cost position no entrant can reach, which is why concentration near 47% held steady while the equipment industry contracted.
"The interesting question is not why this market survived the collapse in office printing. It is what happens when the deferred replacement wave finally lands, because new machines will reset every wear clock at once, and an industry that has been living comfortably off ageing fleets has not planned for that at all."
Director, Precision Components and Imaging Systems Practice · MMA Technology Practice · September 2026

Market Trends

Deferred Fleet Replacement Keeps Old Machines Consuming

Operators facing a permanent decline in office page volume responded by extending equipment life rather than by replacing fleets on schedule, which is entirely rational when the machines are underused. The consequence for component suppliers is that an ageing installed base generates more service work per machine each year, since drive plates wear at around 260,000 pages regardless of how old the machine is. Aftermarket supply reached 43% of units on that behaviour. It is a favourable position built on a deferral that cannot continue forever. That deferral cannot continue indefinitely and everybody knows it.
Market Impact: Replaces at 260,000 pages
Moulded Thermoplastic Displaces Stamped Steel Assemblies

About 64% of plates are now moulded from engineering thermoplastics rather than stamped from sheet metal, which cuts weight, damps drive noise and integrates features that previously required separate parts. The change also raised the entry barrier considerably, since moulding tools amortise across roughly 9 years against a host market in decline. Material selection matters more than it appears, because thermal cycling adjacent to a fuser punishes anything with inadequate heat resistance. Suppliers with existing tooling hold positions competitors cannot economically contest. Nobody rational tools a new part against a host market in decline.
Market Impact: Grows at 5.2% each year

Market Opportunities and Growth Drivers

Drive Plate Wear Follows a Predictable Schedule

Gear engagement surfaces and bearing seats degrade through continuous thermal cycling at around 260,000 pages, which makes replacement a planned service action rather than an unexpected failure. Service organisations schedule the work into preventive visits and stock accordingly, so demand arrives with unusual regularity for a mechanical component. That predictability lets suppliers forecast production and lets distributors hold sensible inventory. It also means an ageing fleet produces rising demand automatically, without any commercial effort from anybody supplying into it. It is closer to a scheduled consumable than to a spare part, commercially speaking.
Market Impact: Base fell 31% permanently

Parcel and Label Printing Grew While Offices Shrank

Shipping labels, transaction receipts and packaging print expanded with parcel volume across the same period that office page counts fell roughly 31%, and the equipment producing them runs at duty cycles office machines never approach. Higher duty cycles mean faster drive wear and shorter replacement intervals, so these fleets consume plates at several times the office rate per machine. Label and transaction print plates grow at 5.2% accordingly. The application was always there and it simply became a much larger share of the whole. Warehouse dust and temperature variation shorten those intervals still further.
Market Impact: Exposes 43% of volume

Market Restraints and Challenges

The Host Equipment Market Is Permanently Smaller

Office page volume fell roughly 31% and has not recovered, and new equipment shipments fell with it, so the original equipment portion of this market is working against a base that will not return to earlier levels. The root cause is a change in where office work happens rather than any competitive or technical development. Commercially this caps how large this market can become whatever happens to aftermarket share. Suppliers mitigate by shifting toward production, label and industrial print applications, which are smaller and genuinely growing. Nothing about the component itself is the problem.
Market Impact: Aftermarket reached 43% of units

Aftermarket Demand Rests on Deferred Replacement

Aftermarket units at 43% of volume exist largely because operators postponed fleet renewal, and postponement is not permanent behaviour however comfortable it currently is for suppliers. The root cause is that machines eventually fail beyond economic repair, and a replacement wave would reset every wear clock across a fleet simultaneously. Commercially this makes the strongest part of the market the most exposed to a single event. Mitigation runs through original equipment positions on new platforms, which suppliers must win before that wave arrives. It is the most profitable and the most exposed position simultaneously.
Market Impact: Moulded plates reach 64% of units
3 additional market trends, 4 additional growth drivers, and 2 additional restraints and challenges are covered in the full report. Contact sales@marketmindsadvisory.com to access the complete intelligence.

Segment CAGR and Growth Architecture

Segmentation follows the class of printing equipment, because that determines duty cycle and duty cycle determines everything else. A plate in an office machine printing lightly and a plate in a label press running continuously wear at completely different rates, sell at different prices and reach the customer through entirely different channels, with different buyers deciding.
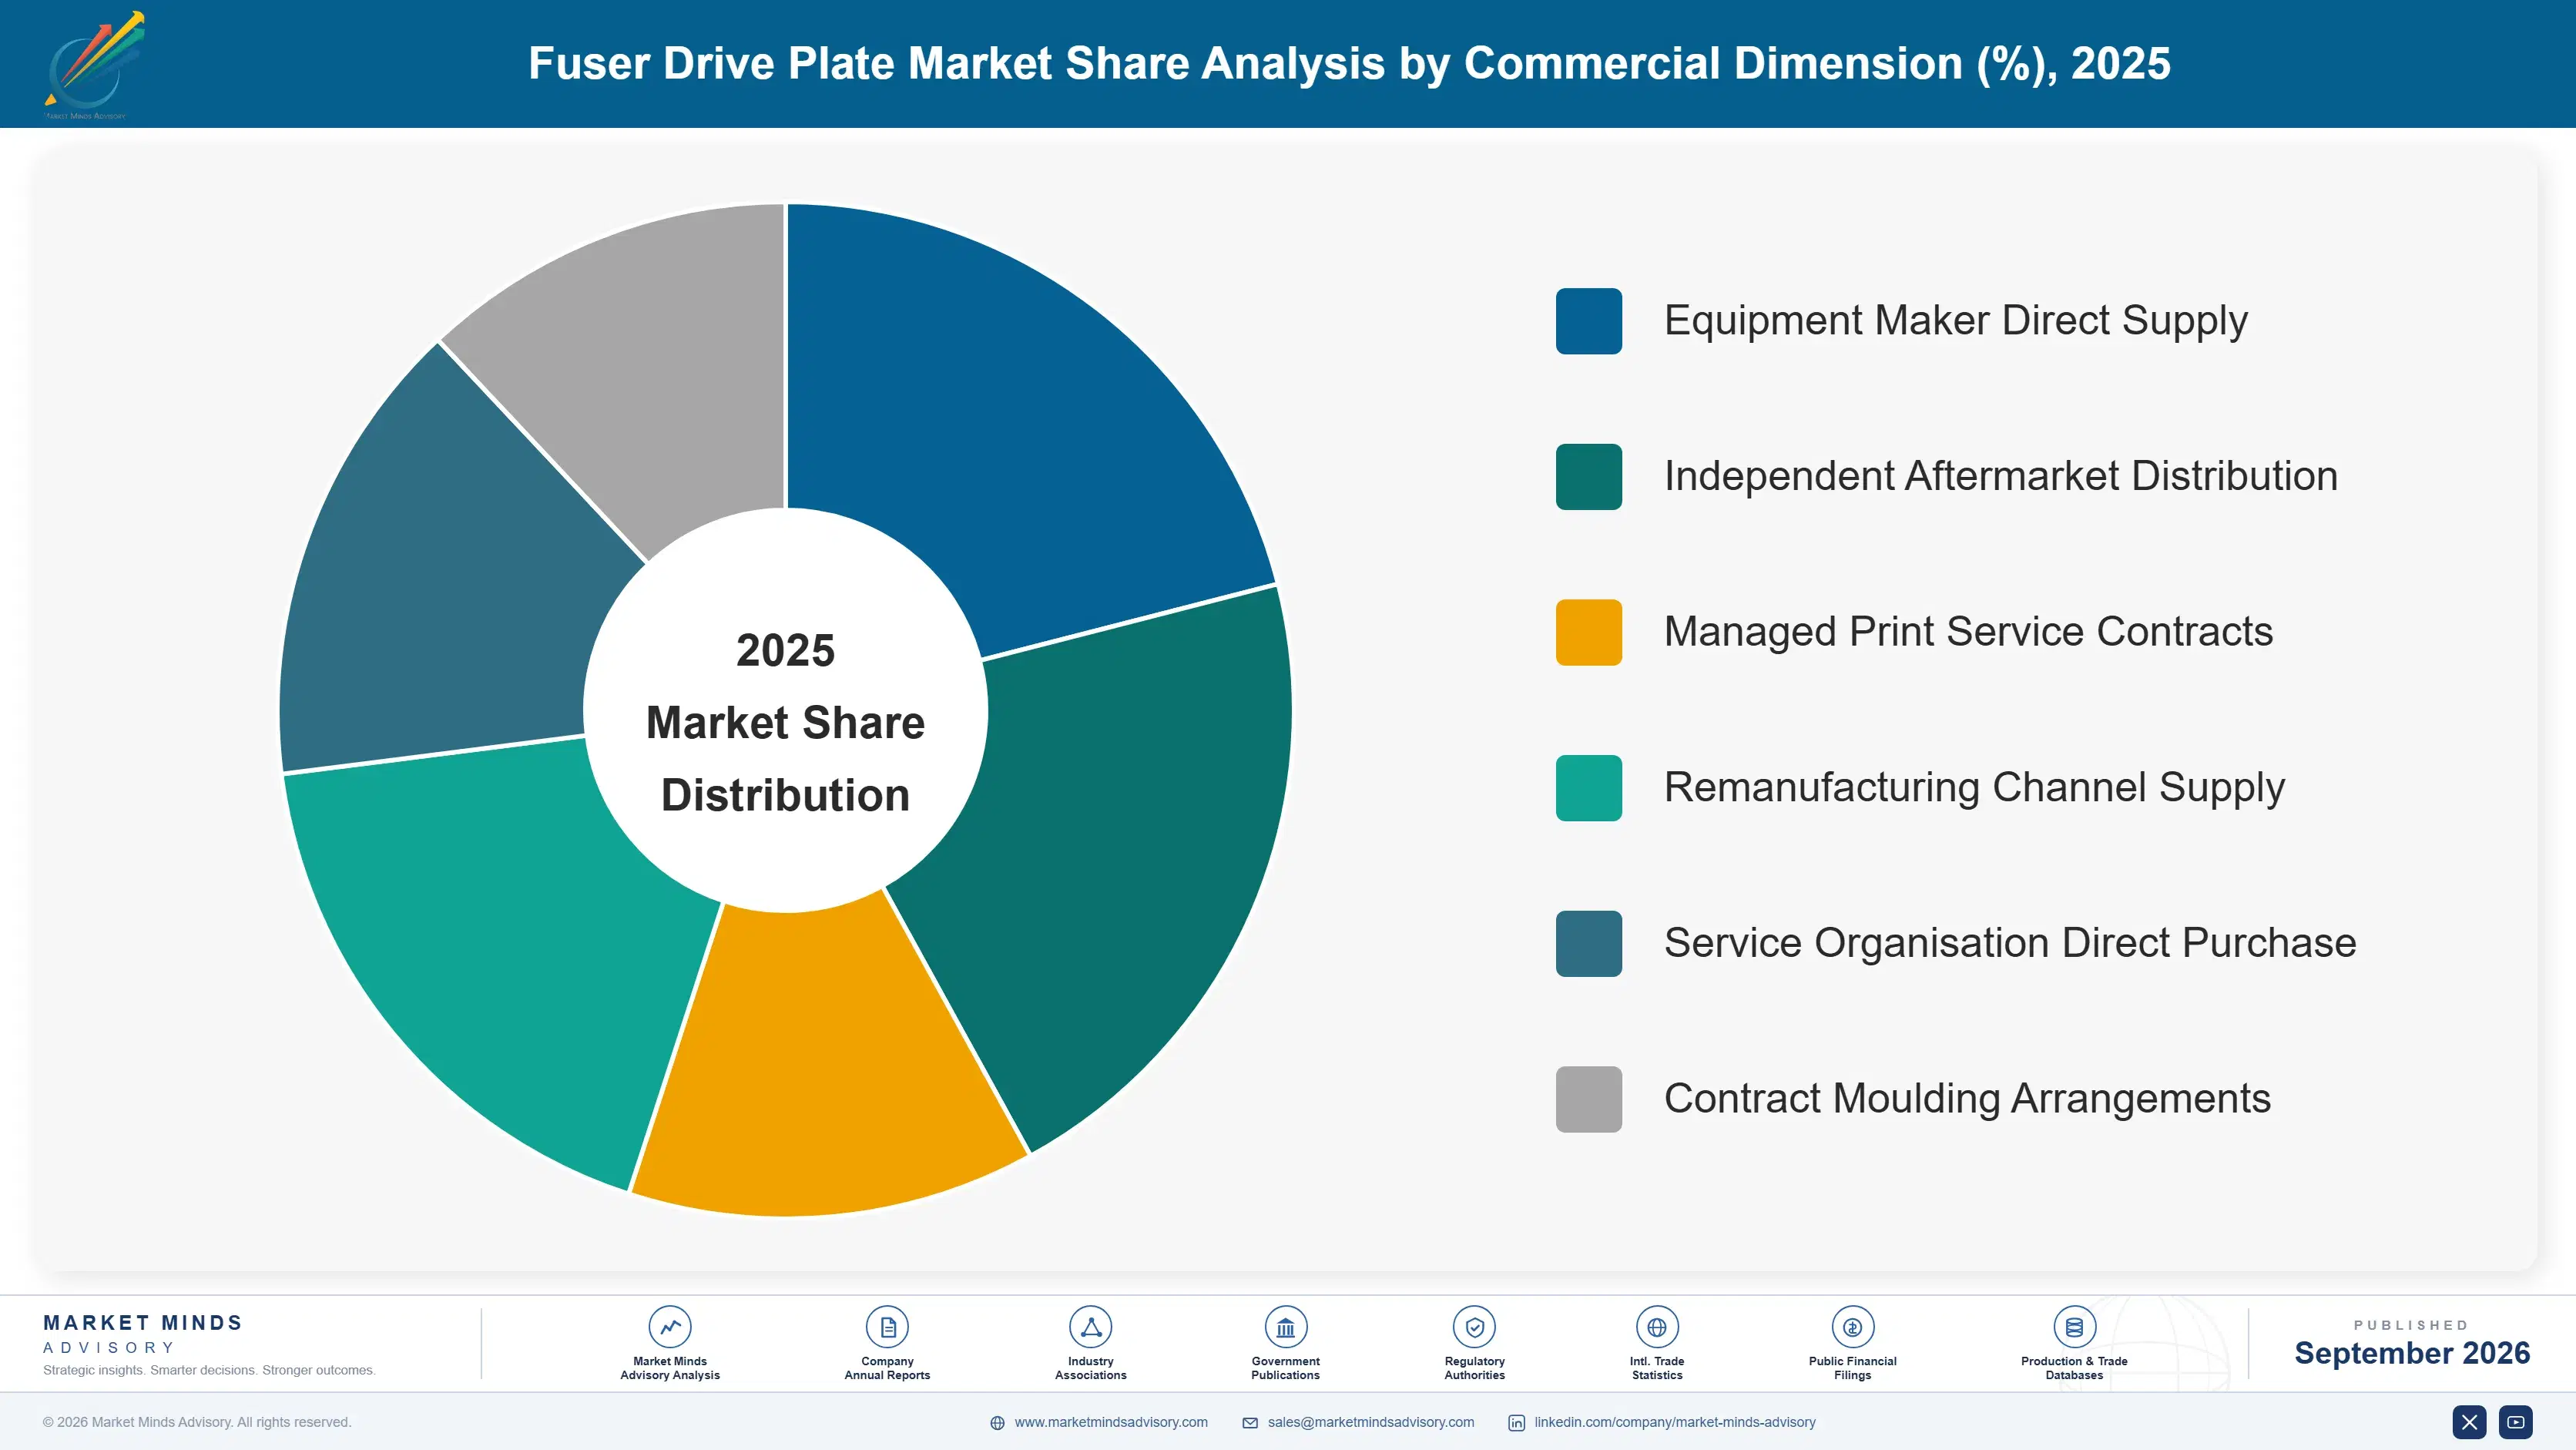
fuser-drive-plate-market-market-share-analysis-1788427313401

Production and Commercial Print Plates

Production print grows at 5.7%, half again the market rate of 3.8%, because the pages involved exist for reasons a screen does not satisfy: direct mail, transactional documents, packaging proofs and short-run publishing. These presses run continuously at loads office equipment never approaches, which shortens drive component intervals well below the 260,000 page office figure. Plates are larger, tighter in tolerance and priced several times higher accordingly. Suppliers here sell fewer units at considerably better value, and the segment rewards manufacturers who never built their business around office volume in the first place. Qualification for these platforms is harder than office work required, which keeps the competitor count low and the pricing sensible.
CAGR 5.7%

Label and Transaction Print Plates

Label and transaction printing grows at 5.2% on parcel volume that expanded through exactly the period office pages fell roughly 31%, which makes it the clearest counterweight in this market. Shipping label printers and receipt equipment run at high duty cycles in warehouses and retail environments, so drive wear arrives faster and replacement intervals are correspondingly shorter. Environmental conditions are harsh, with dust and temperature variation that office machines never encounter. Demand tracks parcel and retail transaction volume rather than any office working pattern, which makes it forecastable against data suppliers can actually obtain. Service organisations in these environments buy on availability above almost everything else, since a stopped label printer halts a despatch operation.
CAGR 5.2%
Full segment breakdown across 6 segments available in the complete report.

Regional Architecture and Country Demand Map

Value follows where imaging equipment is designed and manufactured rather than where printing happens, because plates are specified by equipment makers and supplied into their assembly operations. Aftermarket flows follow installed base instead, which is distributed quite differently. The two geographies barely overlap, which complicates any single channel strategy.

East Asia

East Asia holds 58%, far above the regional band, because electrophotographic printing equipment is overwhelmingly designed and built here and drive plates are consumed where machines are assembled. Japanese manufacturers dominate the equipment industry and their precision moulding and stamping suppliers sit alongside them, with tooling and material relationships built over decades. Chinese component groups supply both original equipment and a substantial aftermarket, competing on price in the replacement channel where equipment maker specification carries less weight. Regional growth at 4.8% runs ahead of the market on production and label equipment manufacture rather than on office machines. Korean and Taiwanese contributions are smaller and concentrated in component supply rather than in equipment assembly.
Share: 58% | CAGR: 4.8% (2026 to 2036)

South Asia and Pacific

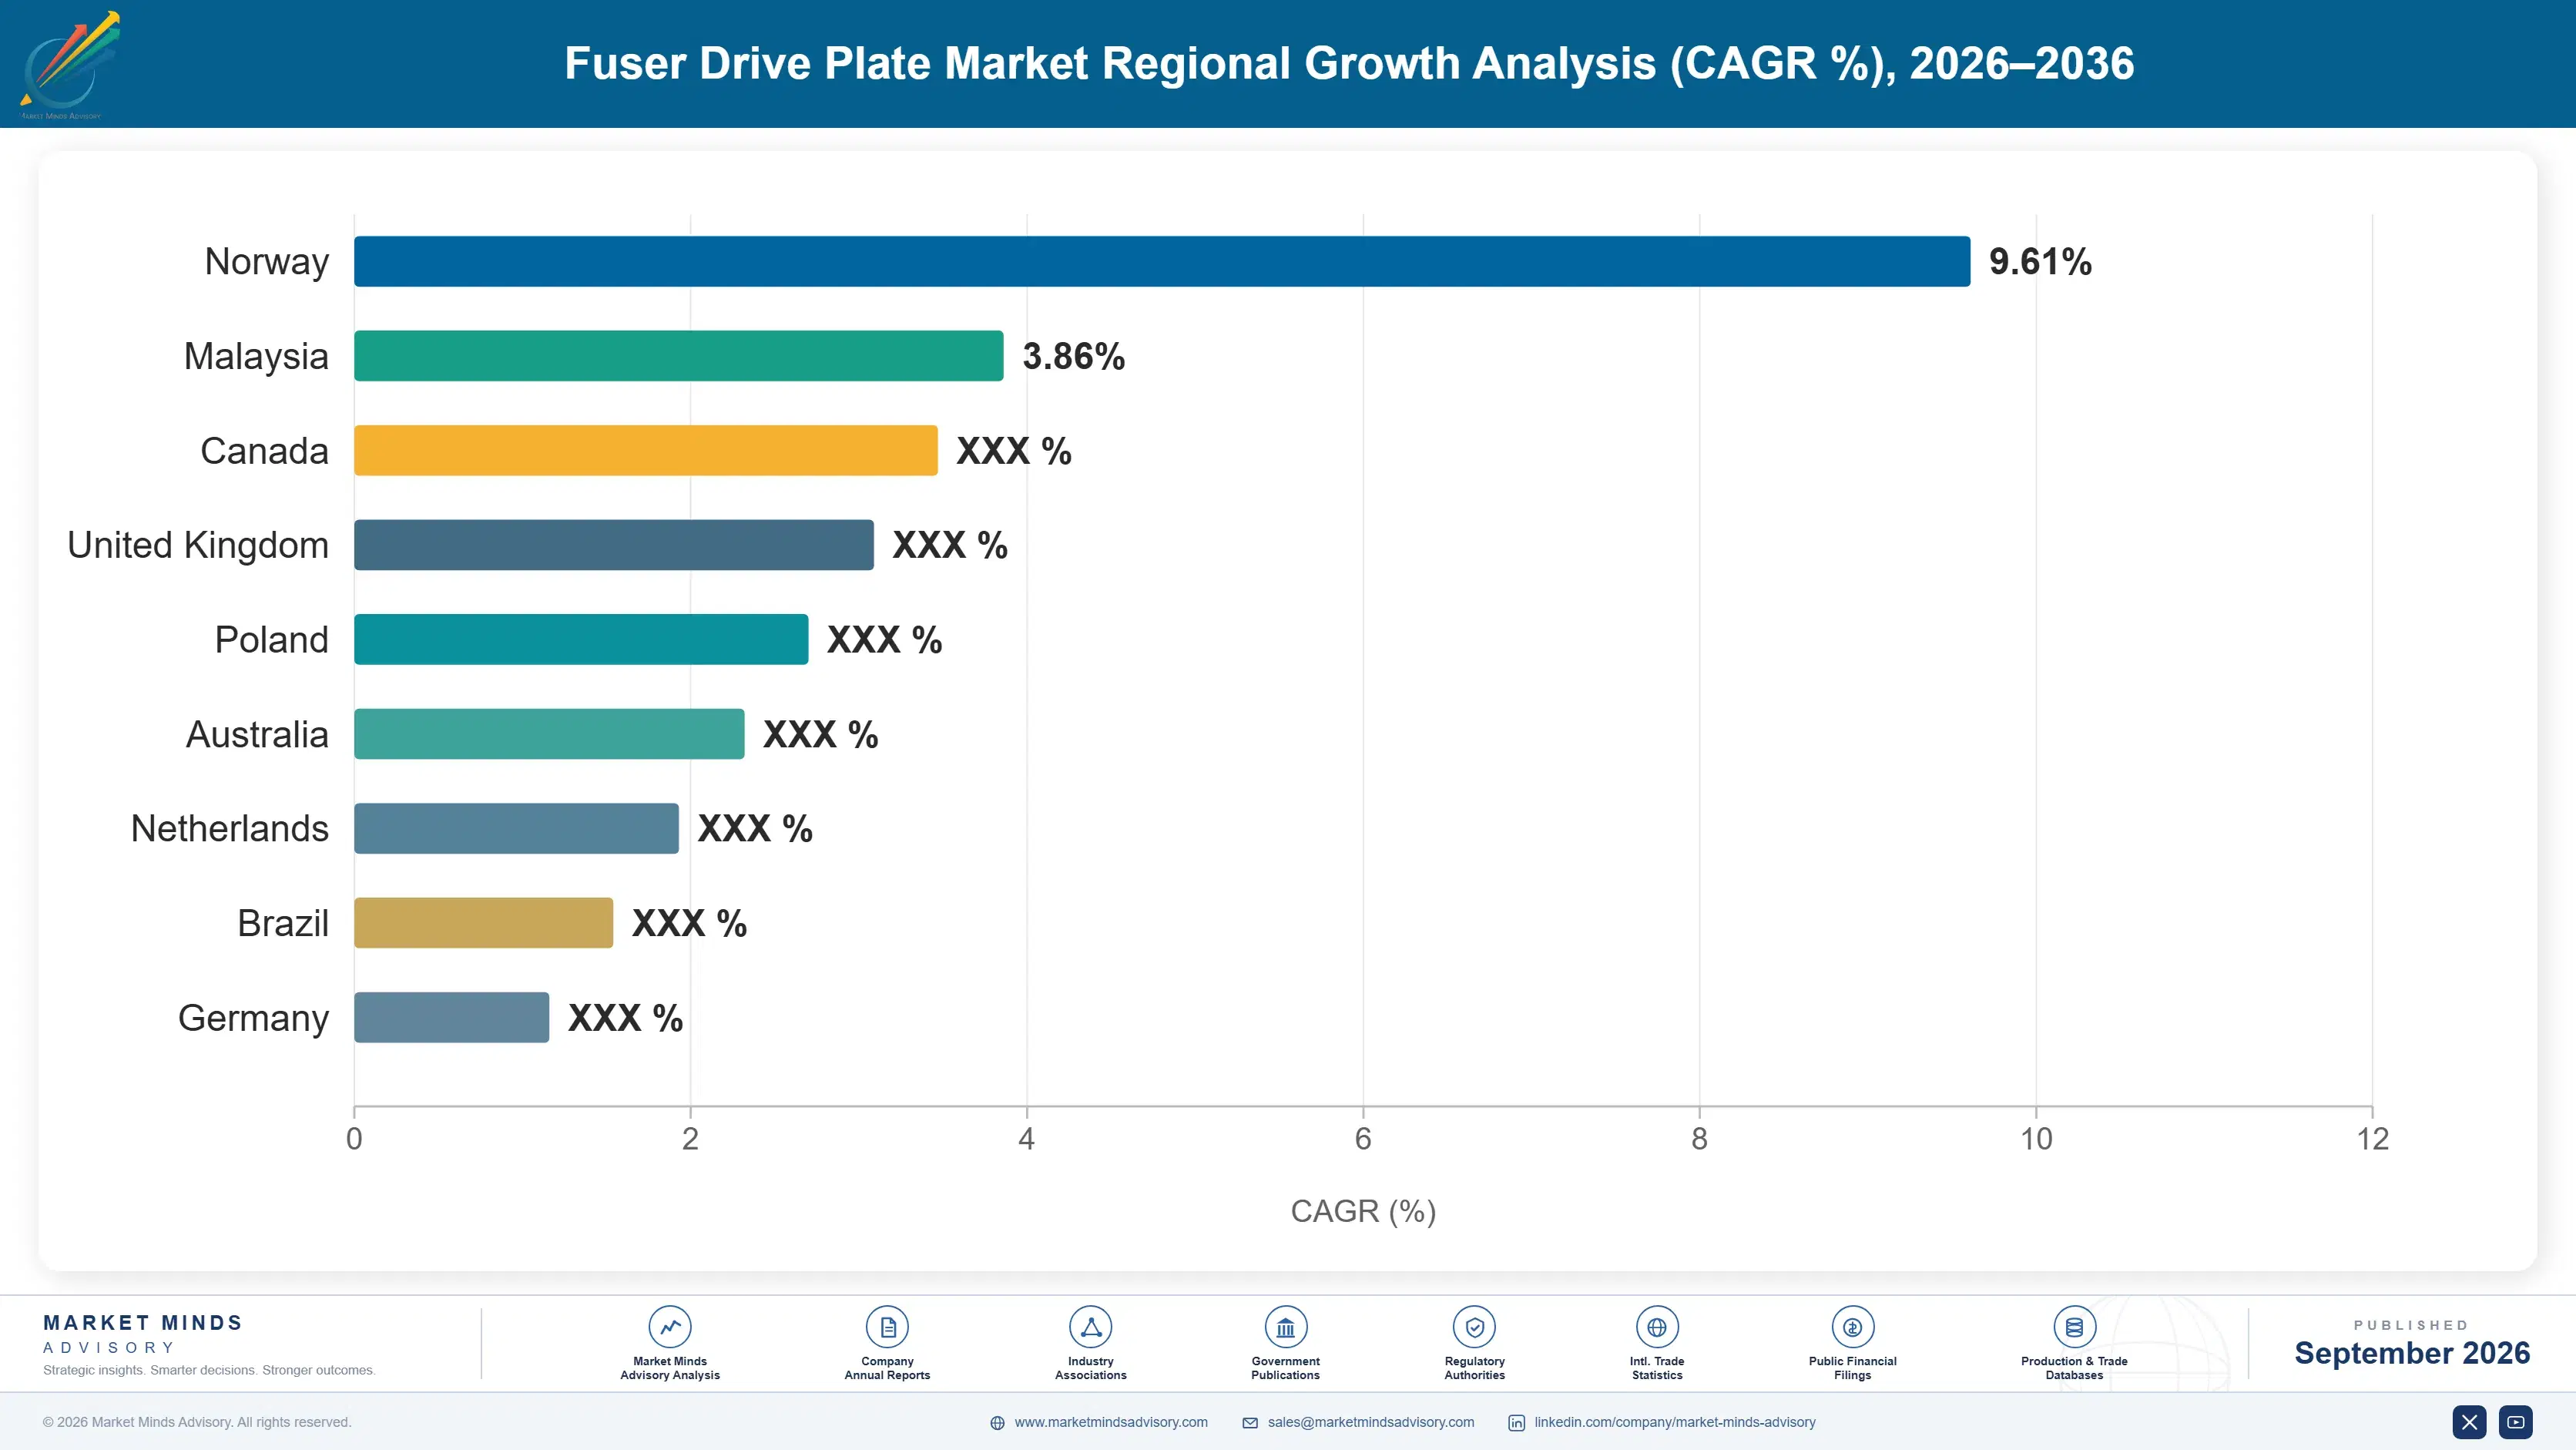
Growth is fastest anywhere at 6.0%, and Vietnam is the fastest-growing country at 6.6% as printer and imaging equipment assembly relocates there from China, which brings plate demand into the country with the assembly lines. Indian demand divides between a growing installed base generating aftermarket replacement and label printing expansion tied to parcel and pharmaceutical packaging volume. Australian demand is small and almost entirely aftermarket. Regional precision moulding capability remains limited, so most plates arrive imported despite assembly capacity expanding quickly across several countries. Duty cycles in Indian logistics and pharmaceutical label printing are high enough that replacement intervals run well below the 260,000 page office figure. Southeast Asian assembly expansion adds original equipment volume steadily.
Share: 12% | CAGR: 6.0% (2026 to 2036)
Regional intelligence for 5 additional markets available in the complete report: North America, Western Europe, Eastern Europe, Latin America, Middle East and Africa. Contact sales@marketmindsadvisory.com.
fuser-drive-plate-market-country-cagr-analysis-1788427313951

Earning From a Declining Host

Everything commercially interesting in this market sits away from the office machines that once defined it. The levers that work move volume toward high duty cycle applications, defend the aftermarket share that carries the margin, and use tooling that is already paid for as the barrier it genuinely is against anyone else. Nobody else can afford it.

Shift Volume Toward High Duty Cycle Applications

Office equipment prints lightly and replaces plates rarely, while production presses and label printers run continuously and consume them at several times the rate per machine. Production plates grow at 5.7% and label plates at 5.2%, against office segments that are barely growing at all. Suppliers reweighting toward these applications earn gross margins around 17 percentage points above office component supply. It requires tolerance and material capability that office volume never demanded, which is precisely why fewer competitors follow. Duty cycle rather than machine count is what a supplier should actually be counting.
Market Impact: Holds roughly 17 points more gross margin overall

Defend the Aftermarket Replacement Channel Deliberately

Aftermarket units are already 43% of volume and carry pricing that original equipment supply cannot approach, since equipment makers negotiate annual reductions while service organisations buy on availability. Suppliers building direct relationships with independent service networks and distributors hold that channel; those relying on equipment maker specification alone lose it to remanufacturers entirely. The channel difference is worth roughly 14 percentage points of gross margin on the same part. Most component suppliers still treat aftermarket as an afterthought rather than as the profitable half. It is the same part travelling through a different door.
Market Impact: Worth roughly 14 points of gross margin overall

Treat Amortised Tooling as the Real Barrier

Moulding tools amortise over roughly 9 years and no rational entrant commits that capital against a host market in permanent decline, which means incumbents with paid-off tools hold a cost position competitors cannot reach at any volume. Extending tool life through maintenance and selective refurbishment preserves that advantage for years beyond the original plan. Suppliers replacing tooling on schedule rather than on condition are discarding their own moat. Tool condition monitoring costs very little against what it protects. Tools that were written off years ago are still producing parts that competitors would need fresh capital to match.
Market Impact: Protects roughly 9 years of amortised tooling cost

Win Positions on New Platforms Before Fleets Turn

Aftermarket strength at 43% of volume rests on deferred replacement, and a replacement wave would reset every wear clock across a fleet at once, removing several years of demand before it rebuilt. The defence is original equipment position on the platforms that will replace those fleets, which must be won during design rather than after launch. Suppliers holding both channels weather the transition; those holding only aftermarket face a gap of roughly 4 years. The design win happens well before anybody sees the wave coming. Very few suppliers are holding both channels properly today.
Market Impact: Faces a demand gap of roughly 4 years

Who Controls the Margin Pool

Concentration sits near 47% across the top five on measured plate and assembly revenue, and it held steady while the equipment industry beneath it contracted. Japanese precision moulders and stamping specialists supply the equipment makers they have served for decades. Chinese component groups compete across both original equipment and a substantial aftermarket. Nobody new has entered, because the tooling economics make entry irrational against a declining host market.
Competition runs on three dimensions. Existing tooling position is first and largely decisive, since amortised tools confer a cost advantage no entrant can match. Second is material and thermal capability, because plates adjacent to a fuser cycle continuously and inadequate heat resistance shows up as warranty rather than as a specification failure. Third is aftermarket channel access, where independent service networks buy on availability rather than on equipment maker specification.

Two pressures will move positions. Volume is shifting toward production, label and industrial applications where tolerances are tighter and office suppliers are not automatically qualified. Meanwhile remanufacturers and independent suppliers keep taking aftermarket share from equipment maker channels, which is where the margin sits, and equipment makers have limited means to prevent it on a part that is not consumable-coded.
fuser-drive-plate-market-company-positioning-matrix-1788427314471

Competitive Moat and Risk Dimensions

ENPLAS

Moat: Precision moulding and tooling

Enplas holds long-established precision moulding capability with tooling and material knowledge built specifically around gear and drive components operating in thermal environments. Its relationships with Japanese imaging equipment makers span decades and renew across successive platform generations. Amortised tooling across a wide part range gives it a cost position that no entrant could justify building against this host market.
ENPLAS

Risk: Office equipment exposure

A meaningful share of volume sits in office multifunction and desktop applications where page volume fell roughly 31% and has not recovered, and where growth is now close to nothing. Production and label applications demand tolerances and materials that office parts never required. Aftermarket channel positions are also weaker than those of suppliers who built independent distribution relationships deliberately.
NINESTAR

Moat: Aftermarket channel reach

Ninestar supplies both original equipment and a substantial aftermarket through independent distribution and service networks, which reaches the 43% of volume that carries the better pricing. Its manufacturing scale across imaging components spreads tooling and overhead across a wide part range. Vertical position across printing consumables and components gives it customer contact that single-component suppliers must manufacture through distribution instead.
NINESTAR

Risk: Specification and quality perception

Aftermarket parts face persistent scepticism from service organisations on thermal durability, which matters because a plate failing early costs a service visit worth many times the part. Production and label applications specify tolerances where that perception is hardest to overcome. Equipment maker qualification on new platforms is also more difficult to secure than for suppliers with long incumbent relationships.

Players Tracked

Prominent Players

Enplas
Nidec
Nifco
Ninestar
Sumitomo Bakelite

Other Key Players

Canon
Ricoh
Konica Minolta
Kyocera Document Solutions
Brother Industries
Sharp
Fuji Business Innovation
Lexmark
HP
Static Control Components
Apex Microelectronics
Aster Graphics
Polyplastics
Daicel
Toray Industries

Recent Developments

MARCH 2025

Service organisations extend fleet life beyond planned replacement points

Managed print providers and corporate fleet operators continued deferring equipment renewal, running machines well past intended replacement schedules because reduced page volumes made new capital difficult to justify. Preventive service intervals were shortened to compensate for accumulating drive component wear. Capital approval for replacement had become harder to obtain.
Signal: Deferred replacement transfers spend from equipment purchase into components, which favours suppliers holding independent aftermarket channels.
AUGUST 2025

Label and transaction print equipment demand outpaces office machine shipments

Equipment makers reported continued growth in label, receipt and logistics printing hardware while office multifunction shipments declined further. The equipment involved runs at duty cycles that consume drive components several times faster than office machines do per unit. Equipment count understates where component demand is actually going.
Signal: Duty cycle rather than machine count now determines where component demand actually concentrates in this market.
NOVEMBER 2025

Independent suppliers take further aftermarket share from equipment maker channels

Independent distributors and remanufacturers increased their share of replacement drive component supply, competing on availability and price where equipment maker channel pricing was difficult for service organisations to justify. Equipment makers had limited contractual means to restrict the substitution. Availability rather than price drove most of the substitution.
Signal: The profitable half of this market is being taken by suppliers the equipment makers cannot easily exclude.

What a Plate Costs to Make

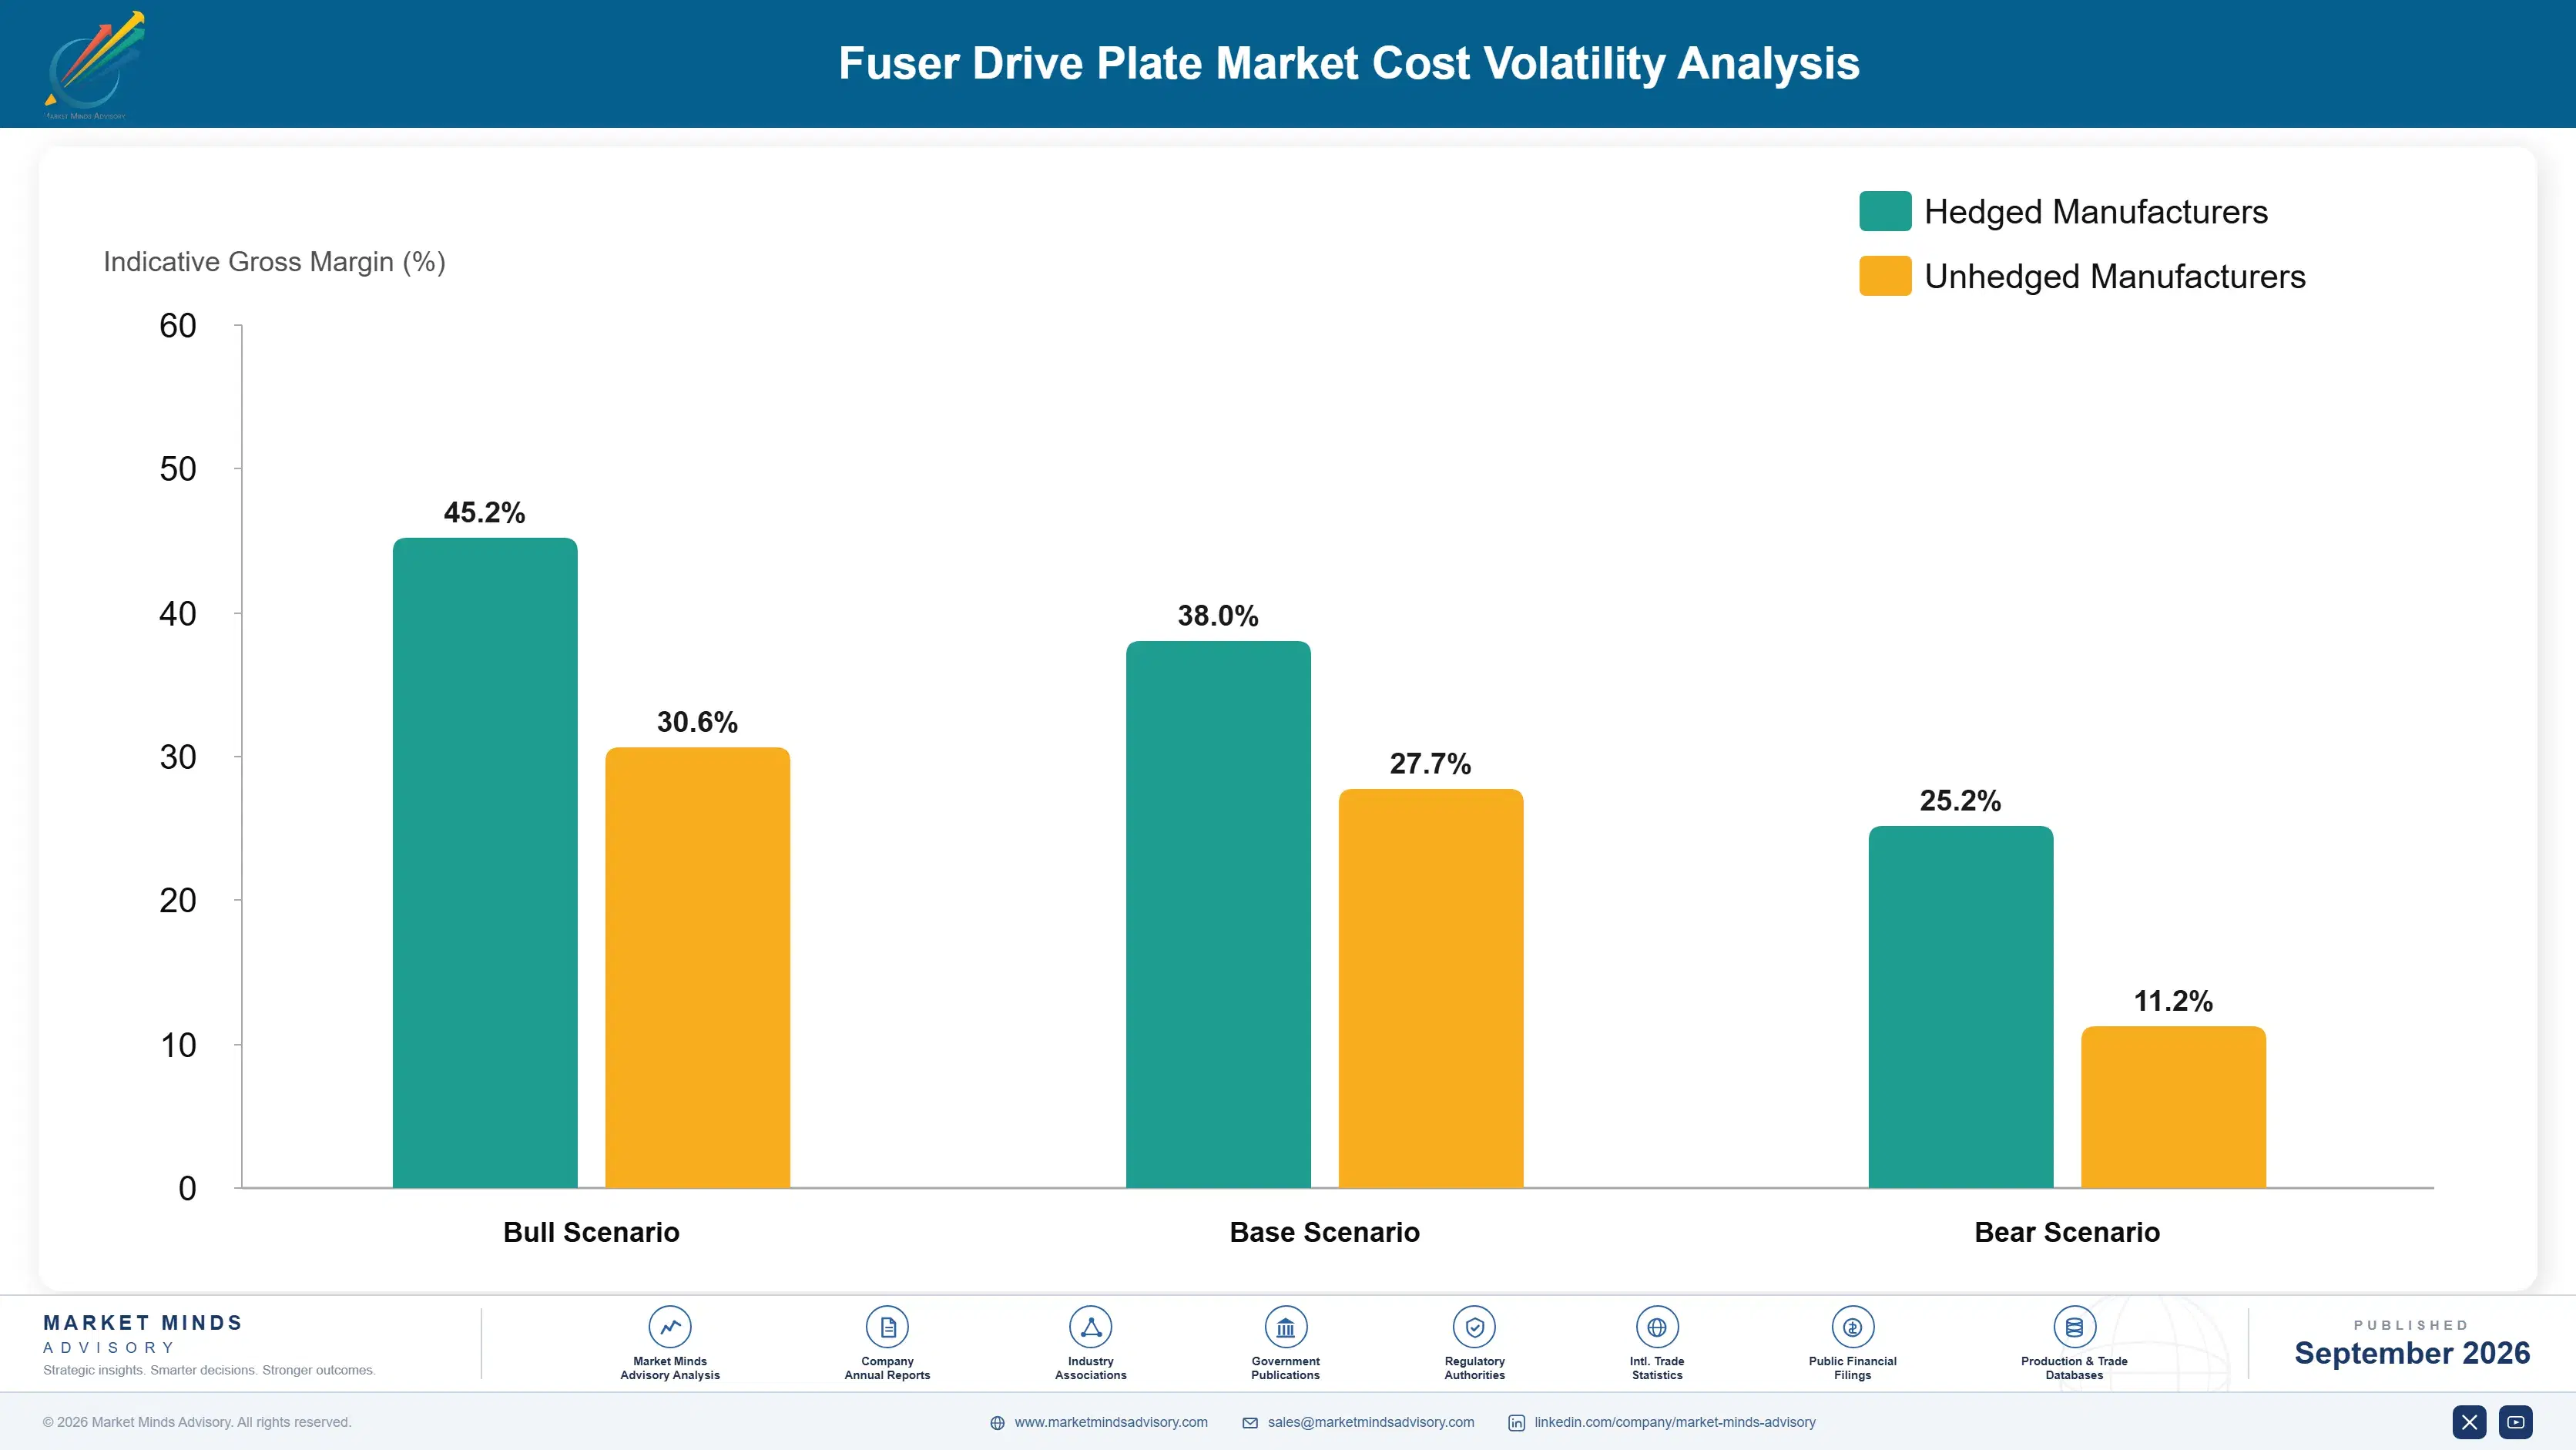
Cost structure is dominated by tooling amortisation and materials rather than by direct labour. Engineering thermoplastic resin accounts for roughly 34% of manufactured cost on moulded parts, tooling amortisation a further substantial block spread over about 9 years, and moulding cycle time, finishing and inspection the remainder. On stamped steel parts the balance shifts toward material and press time, though those are now only about 36% of units.
Engineering resin pricing has been the sharpest input pressure. High temperature grades suited to fuser environments come from a concentrated producer base also serving automotive and electrical applications at far larger volumes, and pricing moved unfavourably through 2024 and 2025. Enplas and Polyplastics both referenced resin and materials cost conditions in recent annual reporting. Component suppliers absorbed most of it, since equipment makers negotiate annual price reductions as a supply condition.

Exposure varies by tooling position rather than by manufacturing scale. Suppliers with fully amortised tools carry only material and conversion cost and can price accordingly. Those who tooled recently carry amortisation against volumes smaller than the business case assumed. Aftermarket-weighted suppliers avoid equipment maker price reduction commitments entirely and hold pricing that original equipment supply cannot approach on the same part.
fuser-drive-plate-market-cost-volatility-analysis-1788427314667

Extend tool life through condition monitoring rather than schedule

Moulding tools amortise across roughly 9 years and are the barrier keeping entrants out, so replacing them on a calendar rather than on condition discards the advantage. Wear monitoring on cavities and gates shows where refurbishment restores capability at a fraction of replacement cost. It requires measurement discipline that high-volume moulders build naturally and lower-volume ones frequently do not.

Qualify alternate high temperature resin grades early

Fuser-adjacent parts need thermal resistance that only a narrow set of engineering grades provide, and those come from producers whose automotive customers order far larger volumes and hold priority. Qualifying alternates during original part approval costs validation effort and removes an exposure that surfaces exactly when supply tightens. It must happen before approval closes, when it looks like avoidable expense.

Price aftermarket supply on availability rather than cost

Service organisations buying replacement plates value having the part today far above saving a small amount on it, because a delayed repair costs a return visit. Pricing against that reality rather than against equipment maker cost logic recovers value the channel supports. Suppliers extending equipment maker pricing logic into the aftermarket are leaving the better half of their margin unclaimed.

Portfolio Architecture for Margin Defence

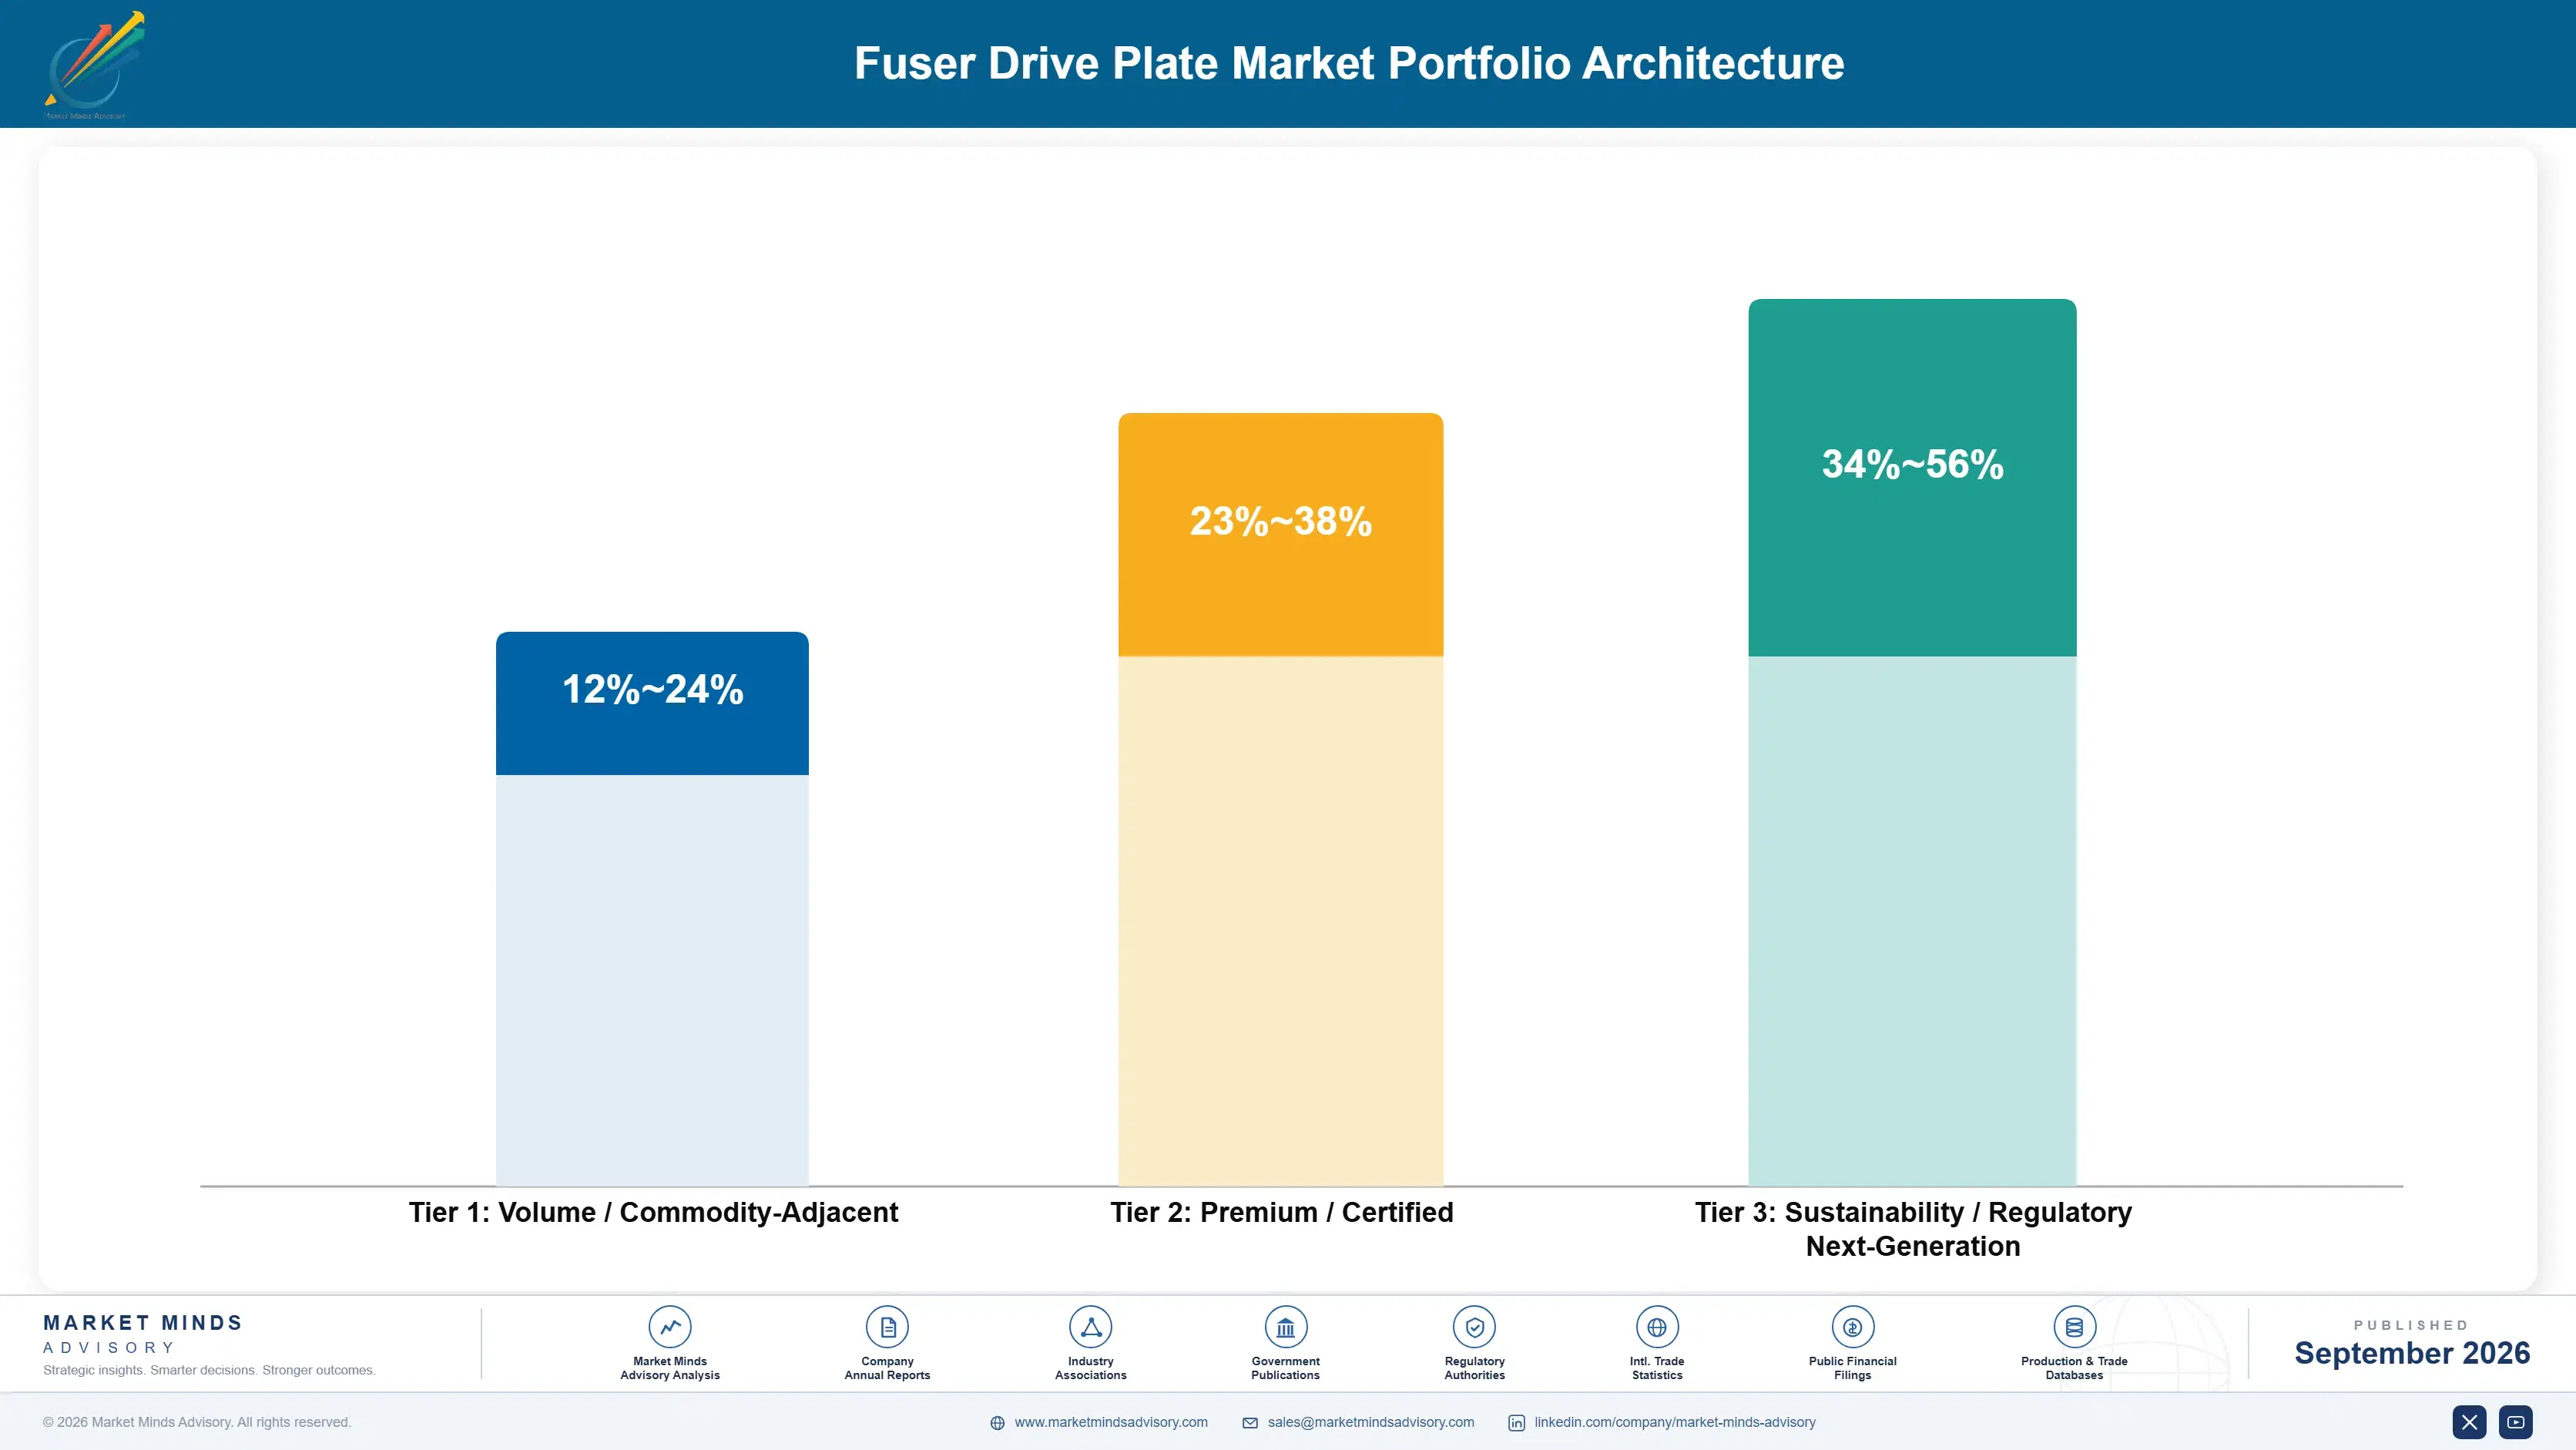
Margin architecture separates on channel and duty cycle rather than on part complexity. Original equipment supply into office machines earns least, since equipment makers negotiate annual reductions and the parts are simple enough that several suppliers could make them. Aftermarket supply on the same part earns considerably more, because service organisations buy on availability. Production and label plates earn most, on tolerances and materials that office volume never required.
The tension runs between volume and channel. Original equipment supply provides the volume that keeps moulding capacity utilised and secures position on future platforms, which matters enormously when a replacement wave eventually arrives. Aftermarket supply provides the margin and depends on a deferral that will not last indefinitely. Suppliers holding only one of the two are exposed in opposite directions, and rather few hold both properly.

High-value revenue concentrates in production and label plates and in aftermarket supply through independent channels. Both are defended by capability rather than by contract: tolerance and material knowledge in one case, distribution relationships in the other. Office original equipment supply funds capacity utilisation and secures platform positions, which is the argument for staying in a segment that earns very little on its own.

Volume / Commodity-Adjacent

Office multifunction and desktop plates supplied into equipment maker assembly under annual price reduction commitments. The range separates suppliers with amortised tooling from those still carrying it. Volume secures platform position more than it earns anything.
Gross Margin: 12-24%

Premium / Certified

Aftermarket replacement supply through independent service networks and distribution, priced on availability rather than against equipment maker cost logic. Margin depends on channel relationships built directly. The same physical part earns considerably more through this route.
Gross Margin: 23-38%

Sustainability / Regulatory / Next-Generation

Production, label and industrial print plates requiring tighter tolerance, higher temperature materials and shorter service intervals. The widest range in the portfolio, reflecting duty cycle and specification variation between applications. Highest margin and fewest qualified suppliers.
Gross Margin: 34-56%
fuser-drive-plate-market-portfolio-architecture-1788427315161

High-value Sub-segments and Strategic Watch-out

Production and Label Plates

High value with the fastest growth at 5.7% and 5.2%, serving equipment that runs continuously and consumes drive components several times faster than office machines. The range reflects tolerance and material specification by application. Office suppliers are not automatically qualified here, which limits how many competitors arrive.
Gross Margin: 36-56%

Independent Aftermarket Supply

High value with steady growth, already 43% of units and priced on availability rather than on equipment maker cost logic. The range reflects channel depth and distribution relationships. It rests on deferred fleet replacement, which makes it simultaneously the most profitable and the most exposed position here.
Gross Margin: 25-39%

Office Original Equipment Supply

The volume core, working against page volumes that fell roughly 31% and never recovered, under annual price reduction commitments. The range separates amortised tooling from recent investment. It secures positions on the platforms that will eventually replace today's deferred fleets, which is its real purpose.
Gross Margin: 11-23%

New Tooling Investment

The strategic watch-out, where moulding tools amortise over roughly 9 years against a host market in permanent decline. The business case rarely survives honest volume assumptions. Suppliers tooling recently are carrying amortisation against volumes well below what the original approval assumed would happen at the time. It rarely does.
Gross Margin: 0-11%

Why This Demand Persists

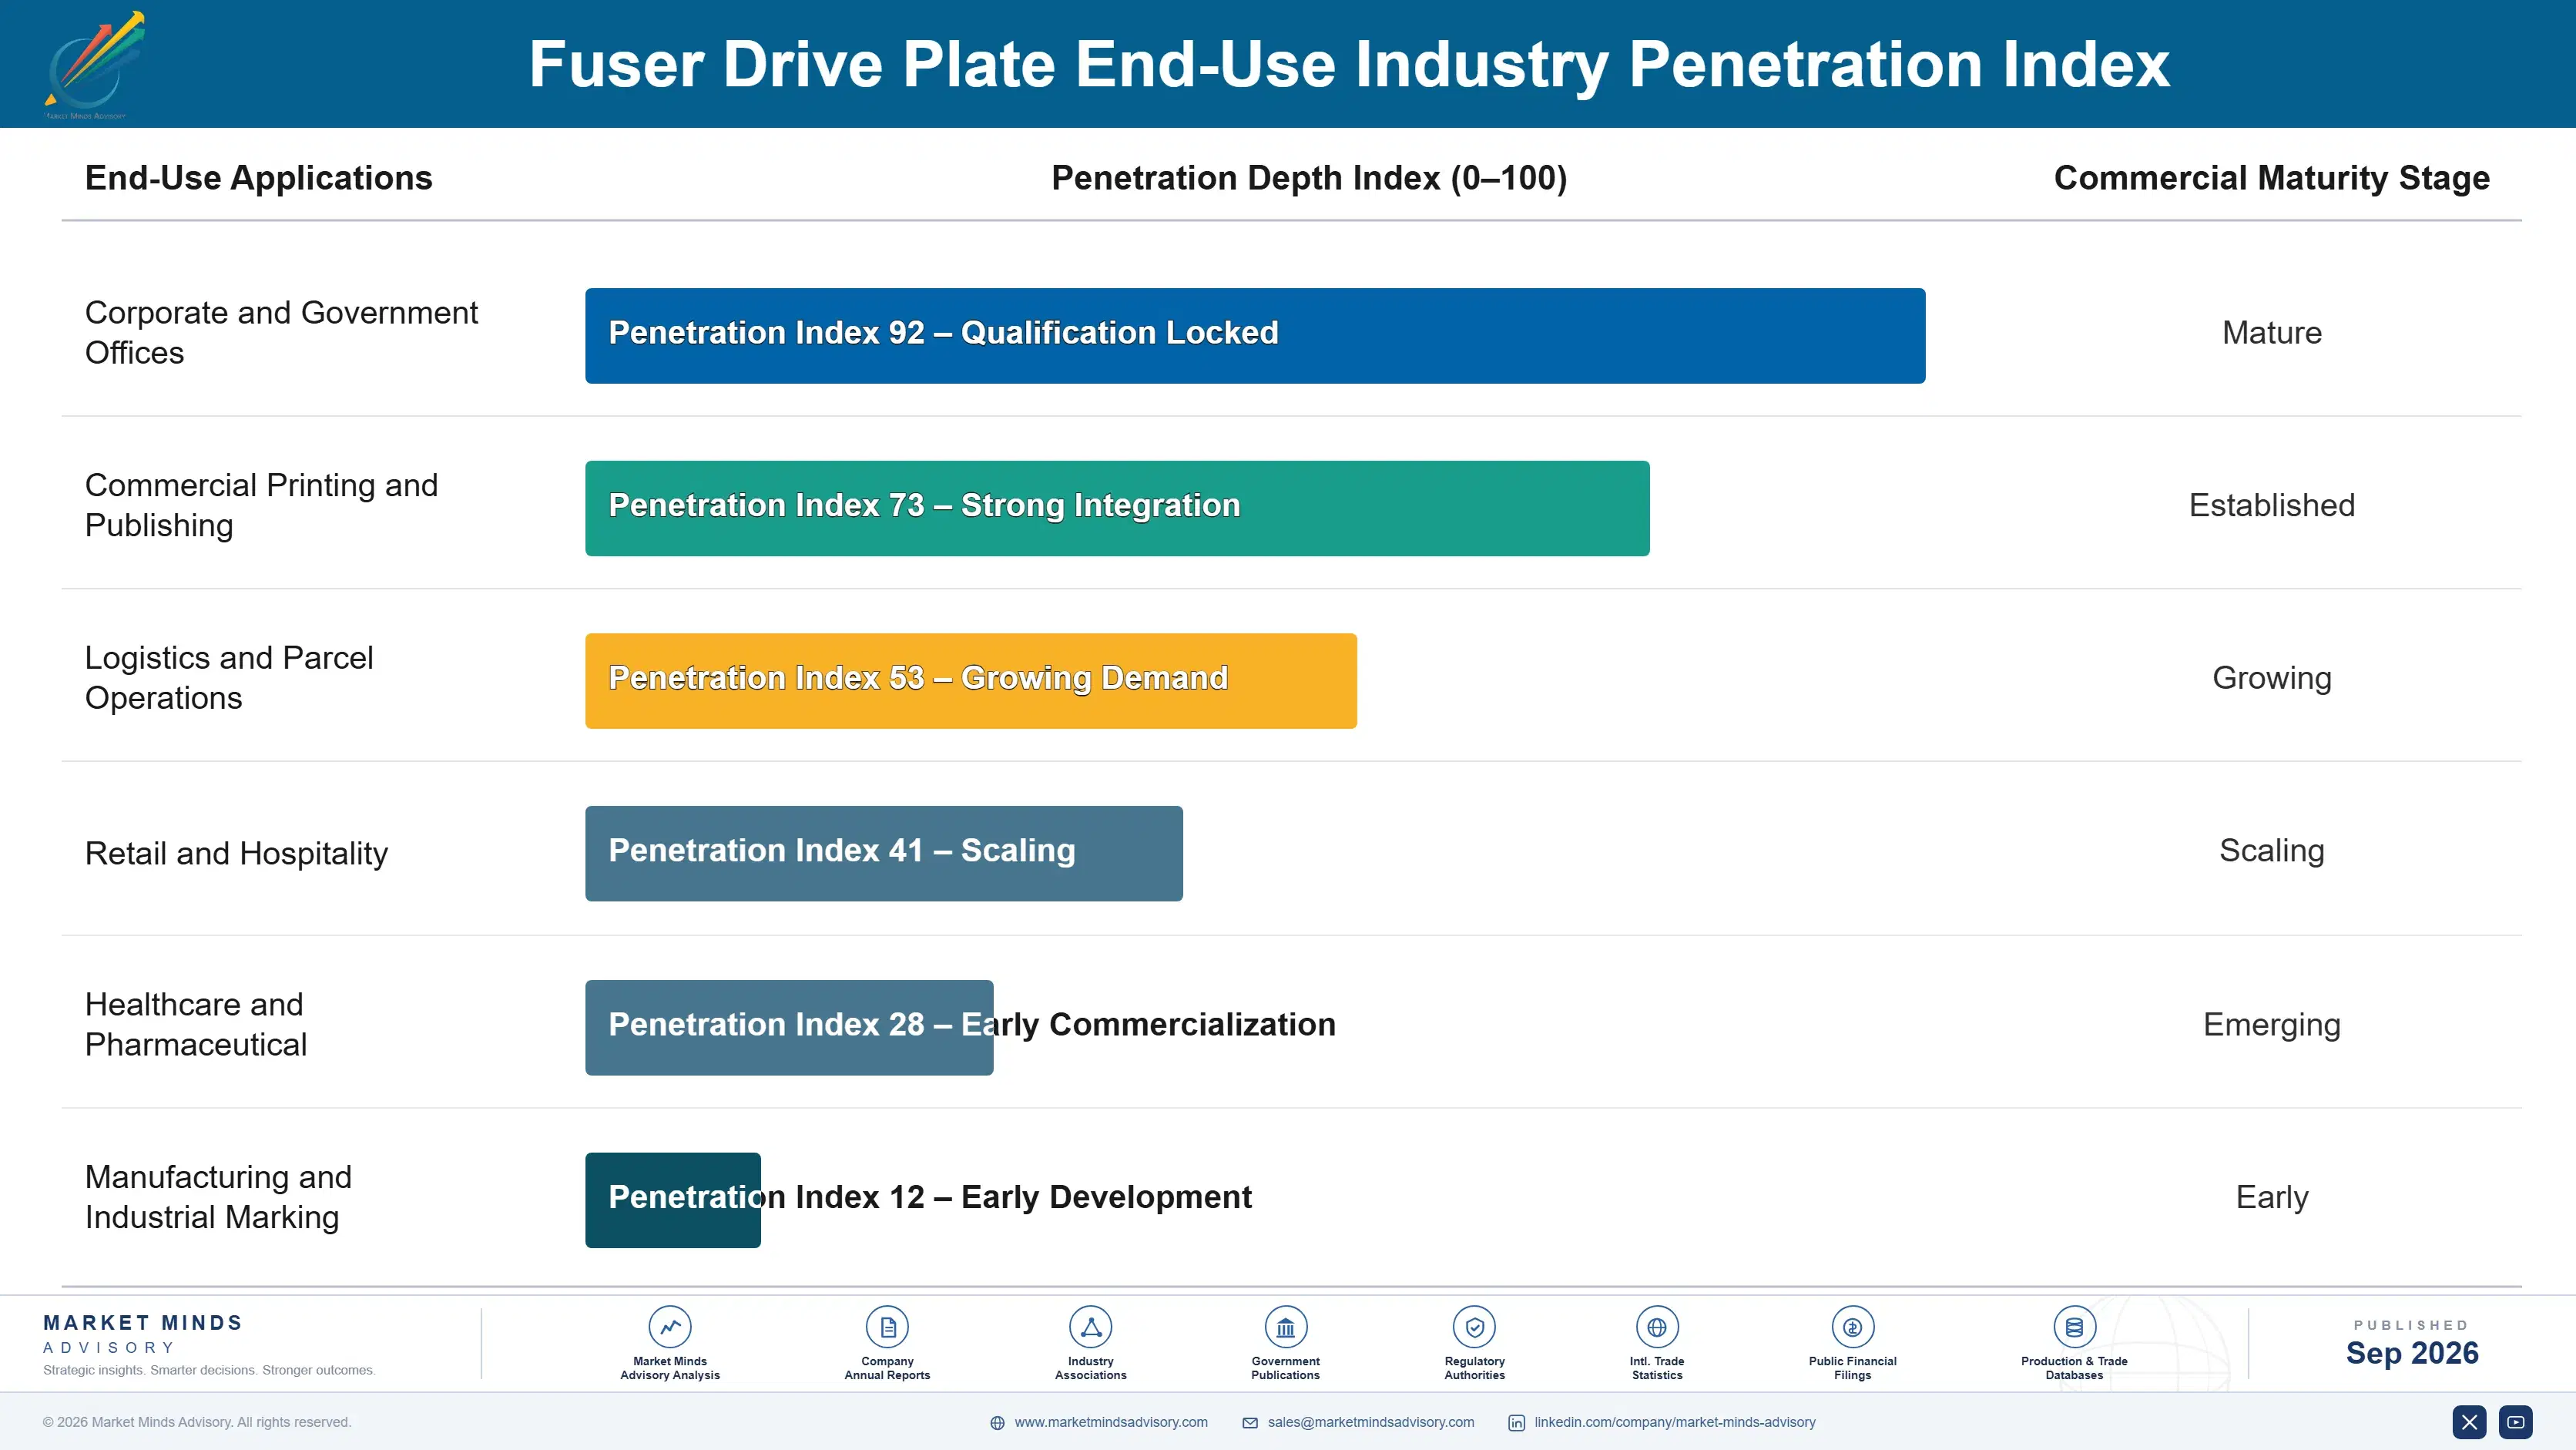
Recurrence comes from wear rather than from purchasing decisions. A plate replaced at around 260,000 pages generates the next order automatically once the machine prints that many again, which makes demand a function of installed base and duty cycle rather than budget. Original equipment supply recurs with platform generations. Aftermarket demand recurs continuously and rises as fleets age, which is why it now represents 43% of units.
Adoption depth varies with how a plate is specified. An original equipment part designed into a platform is fixed for that generation, so a supplier holding the position keeps it until the platform ends. An aftermarket replacement can be substituted at any service visit, which is why independent suppliers have taken share steadily. Production and label applications sit deepest, because tolerance and thermal requirements narrow the qualified supplier list.

The buyer differs completely by channel rather than having changed over time. Original equipment plates are specified by equipment maker design engineers against cost, tolerance and platform life. Aftermarket plates are bought by service organisations and distributors against availability and reliability, with price a distant third. Suppliers organised around one buyer type address half a market, generally the half with less pricing power.
fuser-drive-plate-market-end-use-penetration-index-1788427315650

Where This Component Earns

These are among the four positions where our research anticipates prominent divergence between winners and laggards over the coming forecast period. Each is grounded in the demand model, the regulatory perimeter, and the announced capacity pipeline.
01 / DUTY CYCLE REWEIGHTING

Follow the machines that actually run continuously

Office equipment prints lightly and replaces drive plates rarely, while production presses and label printers run continuously and consume them at several times the rate per machine every year of their life. Production plates grow at 5.7% and label plates at 5.2% against office segments that barely grow at all, and suppliers reweighting toward them earn gross margins around 17 percentage points higher than office supply. The tolerance and material capability required is exactly why fewer competitors bother to follow them there at all.
02 / AFTERMARKET CHANNEL OWNERSHIP

Own the replacement channel or lose the margin

Aftermarket units already represent 43% of volume and carry pricing that original equipment supply cannot approach, since equipment makers negotiate annual reductions while service organisations simply buy on availability instead, whatever it costs. Suppliers building direct relationships with independent service networks hold that channel, and the difference is worth roughly 14 percentage points of gross margin on an identical part leaving the same tool. Most component suppliers still treat the aftermarket as an afterthought rather than as the profitable half of their business today.
03 / TOOLING LIFE EXTENSION

Amortised tools are the moat, so keep them

Moulding tools amortise over roughly 9 years and no rational new entrant commits that capital against a host market in permanent decline, which hands incumbents with paid-off tools a cost position competitors cannot reach at any volume whatsoever, however efficient they are. Extending tool life through condition monitoring and selective refurbishment preserves that advantage for years past the original amortisation plan. Suppliers replacing tooling on a calendar rather than on measured condition are discarding their own barrier to entry deliberately and for nothing.
04 / PLATFORM POSITION TIMING

Win design positions before the replacement wave lands

Aftermarket strength rests entirely on deferred fleet replacement, and a renewal wave would reset every wear clock across an installed base at once, removing several years of demand before it slowly rebuilt itself over several years. The defence is original equipment position on the platforms that will replace those fleets, and that has to be won during design rather than after launch, when nobody is listening. Suppliers holding only aftermarket face a gap of roughly 4 years they cannot fill afterwards by any means.

Engagement Snapshot From the Field

A live engagement with an industry participant carrying material or product regulatory and market exposure ahead of a defining policy shift, showing how our research translates into a defensible multi-year portfolio strategy.
MARKET MINDS ADVISORY · CLIENT ENGAGEMENT SUMMARY
Fuser Drive Plate Producer Strategic Portfolio Review and Transition Roadmap 2026·Investment Scenario on Fuser Drive Plate Exposure Evaluation 2025-26
CLIENT PROFILE
A precision component manufacturer supplying drive plates and related parts to three imaging equipment makers, with annual revenue near USD 84 million (client-reported, unverified by MMA). Roughly 81% of volume went into office multifunction platforms under annual price reduction agreements, and the business had been broadly flat for four years while margins eroded steadily year after year. Nobody looked outward.
STRATEGIC CHALLENGE
Two equipment maker customers had requested further annual reductions while forecasting lower platform volumes, and the client was considering closing one moulding facility (client-reported, unverified by MMA). Nobody had examined where the same parts were being sold after leaving the equipment makers, or what independent service organisations were paying for them.
MMA APPROACH
MMA traced the client's own parts through aftermarket channels rather than analysing its order book, which the client had already examined thoroughly. We interviewed 18 distributors and independent service organisations, obtained replacement pricing on comparable parts, and assessed which of the client's tools were fully amortised and which were not.
KEY FINDINGS
  1. Identical parts were selling through independent aftermarket channels at roughly 2.4 times the price the client received from its equipment maker customers directly.
  2. About 71% of the client's tooling was fully amortised, giving it a cost position that recent entrants and remanufacturers could not match.
  3. Remanufacturers supplying that aftermarket were sourcing plates elsewhere, since the client had never once approached independent distribution in any market at all.
  4. Production and label print plates required tolerances the client's equipment could already achieve, and no qualification barrier had actually been tested by anybody there.
CLIENT PROFILE
A precision component manufacturer supplying drive plates and related parts to three imaging equipment makers, with annual revenue near USD 84 million (client-reported, unverified by MMA). Roughly 81% of volume went into office multifunction platforms under annual price reduction agreements, and the business had been broadly flat for four years while margins eroded steadily year after year. Nobody looked outward.
STRATEGIC CHALLENGE
Two equipment maker customers had requested further annual reductions while forecasting lower platform volumes, and the client was considering closing one moulding facility (client-reported, unverified by MMA). Nobody had examined where the same parts were being sold after leaving the equipment makers, or what independent service organisations were paying for them.
MMA APPROACH
MMA traced the client's own parts through aftermarket channels rather than analysing its order book, which the client had already examined thoroughly. We interviewed 18 distributors and independent service organisations, obtained replacement pricing on comparable parts, and assessed which of the client's tools were fully amortised and which were not.
KEY FINDINGS
  1. Identical parts were selling through independent aftermarket channels at roughly 2.4 times the price the client received from its equipment maker customers directly.
  2. About 71% of the client's tooling was fully amortised, giving it a cost position that recent entrants and remanufacturers could not match.
  3. Remanufacturers supplying that aftermarket were sourcing plates elsewhere, since the client had never once approached independent distribution in any market at all.
  4. Production and label print plates required tolerances the client's equipment could already achieve, and no qualification barrier had actually been tested by anybody there.
RECOMMENDED STRATEGY
Phase 1: Enter independent aftermarket distribution directly with existing parts, since the tooling is amortised and the channel pricing is already established. Phase 2: Keep the moulding facility open and redirect its capacity toward aftermarket and production print volume rather than closing it, which the current volume no longer justifies. Phase 3: Pursue qualification on production and label print platforms, where existing equipment meets the tolerances and margins are considerably better anyway.
OUTCOME
Aftermarket supply reached roughly 19% of volume within a year at pricing well above equipment maker terms, and gross margin improved by about 6 percentage points (client-reported, unverified by MMA). The moulding facility stayed open, and two production print qualifications were completed using equipment the client already owned.

Frequently Asked Questions

Foundational context covering the market sizes, CAGR, scope, country, region and competition that inform every finding below. This section is provided to cover basics and most often pre-purchase conversations, answered from the MMA Primary Research Dataset.

What is the current size of the Fuser Drive Plate Market?

The market was worth USD 0.3 billion in 2025 and reaches USD 0.31 billion in 2026. Aftermarket replacement already accounts for roughly 43% of units supplied.

How large will the Fuser Drive Plate Market be by 2036?

MMA forecasts USD 0.45 billion by 2036, an expansion of 1.45 times over the forecast period. That represents USD 0.14 billion of incremental annual revenue against 2026.

What is the CAGR for the Fuser Drive Plate Market 2026 to 2036?

The base case is 3.8% compound annual growth, with a bull case at 5.0% and a bear case at 2.6%. Whether deferred fleet replacement finally arrives separates the scenarios.

Which segment is growing fastest?

Production and commercial print plates grow at 5.7%, half again the market rate of 3.8%. Those presses run continuously and consume drive components far faster than office machines.

Who are the major companies in the Fuser Drive Plate Market?

Enplas, Nidec, Nifco, Ninestar and Sumitomo Bakelite lead on measured plate and assembly revenue. Together they hold roughly 47%, mostly Japanese and Chinese precision component makers.

Which country is growing fastest?

Vietnam grows fastest at 6.6%, as printer and imaging equipment assembly relocates there from China and brings original equipment plate demand along with the assembly lines.

Report Segmentation Architecture

The full report scope spans multiple orthogonal segmentation dimensions, with cross-tabulated demand data provided for each dimension pair. Coverage extends further to regional breakdowns, trend trajectories, and the competitive detail needed to support segment-level decision-making.

By Primary Market Dimension

  • Office Multifunction Device Plates
  • Desktop Laser Printer Plates
  • Production and Commercial Print Plates
  • Label and Transaction Print Plates
  • Wide Format and Specialty Print Plates
  • Industrial and Embedded Print Module Plates

By End-Use Industry

  • Corporate and Government Offices
  • Commercial Printing and Publishing
  • Logistics and Parcel Operations
  • Retail and Hospitality
  • Healthcare and Pharmaceutical
  • Manufacturing and Industrial Marking

By Commercial Dimension

  • Equipment Maker Direct Supply
  • Independent Aftermarket Distribution
  • Managed Print Service Contracts
  • Remanufacturing Channel Supply
  • Service Organisation Direct Purchase
  • Contract Moulding Arrangements

By Region

  • East Asia
  • South Asia and Pacific
  • North America
  • Western Europe
  • Eastern Europe
  • Latin America
  • Middle East and Africa

Scope, Methodology, and Coverage

Every figure in this report is reproducible from documented input assumptions. The scope below maps the historical period, the forecast horizon, the segmentation dimensions, and the countries covered, alongside the underlying primary and qualitative methodology.
Historical Period
2020 to 2025
Forecast Period
2026 to 2036
Base Year
2025 (USD billions; MMA Primary Research Dataset, September 2026)
Market Definition
This market covers drive plates and integrated drive plate assemblies used within the fuser units of electrophotographic printing equipment, spanning office multifunction device plates, desktop laser printer plates, production and commercial print plates, label and transaction print plates, wide format and specialty print plates, and industrial and embedded print module plates. Revenue is measured as plate and assembly value at supplier level across original equipment and aftermarket supply, including attributable tooling amortisation. Complete fuser assemblies, fuser rollers, belts and heating elements, toner and imaging consumables, drive motors and gearboxes sold separately, and inkjet or thermal printing equipment are excluded from scope.
Quantitative Units
USD billions, plate and assembly revenue at supplier level
Segmentation Dimensions
Printing equipment class, end-use industry, commercial channel, region
Regions Covered
East Asia, South Asia and Pacific, North America, Western Europe, Eastern Europe, Latin America, Middle East and Africa
Countries Covered
Japan, China, South Korea, Taiwan, Vietnam, Thailand, Malaysia, Philippines, India, Australia, United States, Canada, Mexico, Brazil, Argentina, Chile, Germany, Italy, France, United Kingdom, Netherlands, Spain, Poland, Czechia, Hungary, Romania, United Arab Emirates, Saudi Arabia, South Africa
Key Companies Profiled
Enplas, Nidec, Nifco, Ninestar, Sumitomo Bakelite, Canon, Ricoh, Konica Minolta, Kyocera Document Solutions, Brother Industries, Sharp, Fuji Business Innovation, Lexmark, HP, Static Control Components, Apex Microelectronics, Aster Graphics, Polyplastics, Daicel, Toray Industries
Quantitative Methodology
Primary survey, n=3,800 respondents, Q4 2025, six countries; demand-side model with trade association cross-validation
Qualitative Methodology
47 expert interviews, Q4 2025; applied to validate demand model assumptions, identify emerging dynamics, and assess competitive positioning
Report Format
PDF and XLSX data workbook (Word format preview document)
Publisher
Market Minds Advisory
Report Code
MMA-2026-TEC-111
Published
September 2026
Contact
sales@marketmindsadvisory.com | www.marketmindsadvisory.com

Purchase the full Fuser Drive Plate Market Report (2026 to 2036).

The full MMA report examines why a component market grew while the equipment industry beneath it contracted, and what happens when the deferred replacement wave finally arrives. It sizes the market to 2036 across six printing equipment classes, seven regions and 29 countries, with segment growth rates and regional demand mechanisms set out throughout. Competitive analysis covers 20 suppliers assessed on measured plate and assembly revenue, with moat and risk assessment for the two leaders. The report quantifies tooling and materials cost structure, aftermarket channel economics and margin architecture across three portfolio tiers. It closes with four verdicts and an anonymised component manufacturer engagement.
Six equipment classes sized through 2036
Seven regions with demand mechanism analysis
Twenty suppliers on consistent revenue basis
Wear interval and tooling amortisation benchmarks
Margin architecture across three portfolio tiers
Anonymised precision component channel review engagement

Built For The People Who Decide

From boardroom strategy to bench-side execution, this report is read cover-to-cover by leaders shaping the next decade of their industry, turning demand scenarios, market dynamics and valuation benchmarks into decisions.
CXOs/ Presidents/ VPs/ Managers
M&A and Corporate Development
Strategy Teams and R&D Heads
Procurement and Product Directors
Regulatory and Compliance Leaders
Investor Relations and Equity Analysts