Market Minds Advisory
Furniture Rental Services Market

Furniture Rental Services Market: Furniture Rental Services Market. Subscription Models Reshape Flexible Living and Corporate Housing.

Subscription furniture platforms increasingly win urban renters and corporate relocation budgets away from ownership and traditional rental agents, pushing incumbent operators toward digital-platform investment or ceding share to asset-light challengers entering flexible-living markets.

Lead Analyst

Published

September 2026

Make Smarter Decisions with Customized Research Insights

Request a free sample report and evaluate market opportunities, growth trends, and competitive dynamics relevant to your business needs.

2025 MARKET VALUE$9.8BMarket Size 2025
2036 FORECAST VALUE$26.6BBase Case , 2026 to 2036
CAGR 2026 TO 20369.5 %Bull 10.8% / Bear 8.3%
INCREMENTAL OPPORTUNITY$15.9BNet 10- year value creation
EXPANSION MULTIPLE2.48x2036 value over 2026 base
Strategic Levers
M&A Pipeline
Regional Outlook
Country Rankings
Competitive Intelligence
Segmental Deep-dive
Call-Us : 91 93563 13602

Executive Snapshot and Market Trajectory.

Subscription furniture platforms are converting one-time renters into recurring subscribers, as urban tenants increasingly prefer flexible monthly payments over upfront furnishing costs during frequent job-driven relocations across major metropolitan rental markets worldwide, especially among younger, highly mobile professional tenants seeking lower-commitment furnished housing arrangements this calendar year.
Corporate relocation programs, gig-economy mobility, and short-tenure urban leasing are pulling demand toward asset-light furnishing models across most major metropolitan rental markets, with residential subscription renters expanding fastest of any customer segment tracked in this report. East Asian and South Asian metros absorb the largest share of new platform signups as apartment construction outpaces furniture-ownership affordability among young professionals, while corporate relocation budgets concentrate in established North American and Western European technology hub cities.
Competitive intensity is rising as digitally native platforms use inventory-tracking software and flexible logistics networks to undercut legacy rental agents on delivery speed and assembly reliability, while regulators in several markets begin scrutinizing subscription cancellation terms and deposit-return practices closely. This is pushing operators toward considerably more transparent contract structures ahead of anticipated consumer-protection rules covering flexible-tenancy furnishing agreements more broadly across national jurisdictions.
Market Definition
The furniture rental services market covers subscription and fixed-term rental of residential and light-commercial furniture through digital platforms and rental agents, including delivery, assembly, and pickup logistics. It excludes furniture manufacturing, retail furniture sales, and construction-site or event-staging equipment rental.
Base Year Value
$9.8B in 2025 (MMA Primary Research Dataset, September 2026)
Forecast Period
2026 to 2036, eleven discrete annual values
CAGR
9.5% base case. Bull 10.8%. Bear 8.3%.
Fastest Growth Segment
Residential Subscription Furniture Rental: 13.5% CAGR
Fastest Growth Country
India: 12.8% CAGR
Fastest Growth Region
South Asia and Pacific: 11.7% CAGR
Largest Region
North America: 30% of 2025 global value
Market Leaders
CORT Business Services, Feather, Fernish, Oliver Space, Aaron's Inc. Source: MMA Analysis, company annual reports.
Primary Survey
n=3,800 procurement and R&D decision-makers, Q4 2025, six countries
Methodology
Demand-side build-up, cross-validated against public data, 47 expert interviews

Furniture Rental Services Market Forecast Scenarios

furniture-rental-services-market-size-forecast-scenario-1790022913908
Furniture rental demand grew steadily from 2020 through 2025 as remote work normalized frequent relocation and urban renters increasingly sought furnished flexibility over long-term ownership commitments during a period of persistent housing-cost pressure. Platform-based operators expanded fastest of any channel, capturing meaningful share from traditional rental agents reliant on showroom-based sales models throughout the historical period.
The base case assumes continued urbanization, rising apartment construction in East Asia and South Asia, and sustained corporate relocation budgets driving subscriber growth steadily through 2036. Three distinct mechanisms anchor this trajectory: subscription platforms lowering customer-acquisition friction through digital marketing, logistics networks cutting delivery costs enough to serve secondary cities profitably for the first time, and corporate housing programs standardizing furnished-apartment specifications across multinational relocation providers operating in dozens of countries.
A bull scenario assumes rapid expansion of corporate furnished-housing partnerships lifts subscriber volumes meaningfully above trend across every major regional market tracked in this report. A bear scenario assumes tightening consumer-credit conditions and rising last-mile logistics costs push renters back toward secondhand furniture marketplaces, slowing platform subscriber growth meaningfully across the most price-sensitive urban rental segments this decade.

Digital Platforms Redraw Furniture Rental Economics

Furniture rental economics increasingly favor operators who treat inventory as a software-managed asset rather than a warehouse of physical stock, tracking utilization, condition, and turnover in real time across every distribution node. Platforms that convert this data into faster restocking cycles are pulling ahead of legacy agents still relying on manual inventory counts and paper contracts to manage furniture assets across scattered warehouse locations.
MARKET CONCENTRATION18%Top five operators hold modest combined revenue share overall
AVERAGE MONTHLY SUBSCRIPTION$65Typical monthly rate for a furnished one-bedroom package
SUBSCRIBER RENEWAL RATE72%Share of subscribers extending past their initial contract term
WAREHOUSE UTILIZATION68%Average inventory turnover rate across regional distribution centers
CORPORATE CONTRACT SHARE34%Portion of revenue tied to relocation and corporate housing
AVERAGE RENTAL DURATION11 monthsTypical subscriber tenure before furniture return or upgrade
Commercial character is shifting from transactional single-term rentals toward recurring subscription relationships that resemble software-as-a-service billing more than traditional furniture retail. This shift raises customer lifetime value meaningfully but also raises the working-capital burden of maintaining large, geographically distributed furniture inventories across dozens of metro markets at once, a cost structure that regional operators without institutional financing backing find genuinely difficult to sustain over multiple growth cycles.
Over the next decade, expect consolidation among regional operators lacking logistics scale, alongside continued platform investment by well-capitalized entrants targeting corporate relocation contracts and student housing partnerships as durable, higher-margin revenue streams that smooth out the seasonality inherent in purely residential subscriber demand, particularly during peak summer moving months when new-subscriber acquisition costs typically climb across nearly every metro market.
"The winners in furniture rental will look more like logistics companies than furniture companies. Whoever moves a couch fastest, cleanest, and cheapest wins the subscriber, not whoever has the nicest catalog."
Practice Lead, Consumer Services and Flexible Living Practice · MMA Construction and Industrial Equipment Practice · September 2026

Market Trends

Subscription Billing Replaces Fixed-Term Rental Contracts

Operators are migrating away from fixed six- and twelve-month rental agreements toward month-to-month subscription billing modeled on software-as-a-service pricing structures common in technology sectors. This shift lowers the commitment barrier for prospective renters and lets platforms capture incremental upgrade revenue as subscribers swap furniture packages during their tenancy rather than signing entirely new contracts each time. Early adopters report meaningfully higher customer lifetime value than fixed-term competitors, and several venture-backed platforms have raised additional capital specifically to fund the inventory buildout this billing model requires across new metropolitan markets nationwide.
Market Impact: Sustains 41% of annual renewals

Corporate Relocation Programs Standardize Furnished-Apartment Specifications

Multinational relocation providers are increasingly specifying standardized furniture packages for corporate housing contracts, replacing ad hoc local sourcing practices with negotiated master agreements covering dozens of cities simultaneously across several continents worldwide today. This growing standardization favors operators with established multi-city logistics networks capable of fulfilling consistent quality specifications across national borders reliably and predictably, while disadvantaging smaller regional agents who cannot guarantee identical furniture packages beyond their home market. Several large relocation firms have already signed multi-year master agreements with platform operators covering thousands of annual corporate housing placements worldwide.
Market Impact: Drives 37% of new signups

Market Opportunities and Growth Drivers

Rising Urban Rental Tenure Turnover Sustains Demand

Short average tenancy periods in major metropolitan rental markets keep replacing the customer base that furniture rental platforms depend on, since each new lease signing represents a fresh furnishing decision for the incoming tenant. Urban renters relocating every one to three years increasingly find subscription furniture cheaper and less risky than purchasing and later reselling furniture with each move across cities. This turnover dynamic gives rental platforms a continuously renewing addressable market that outright furniture retailers, dependent on far less frequent purchase cycles, do not benefit from in comparable proportion.
Market Impact: Erodes roughly 9% of margin

Growing Preference for Asset-Light Living Among Young Professionals

Younger renters increasingly view furniture ownership as a liability rather than an asset, preferring to redirect capital toward experiences, savings, or debt repayment instead of depreciating household goods that lose meaningful resale value quickly after purchase. Surveys of urban renters under thirty-five consistently show strong preference for subscription and rental models across categories beyond furniture, including vehicles and electronics, reinforcing platform adoption steadily across markets. This generational shift in ownership attitudes is proving durable rather than cyclical, giving operators confidence to invest in long-lived warehouse infrastructure and expanded logistics capacity.
Market Impact: Adds 22% to delivery cost

Market Restraints and Challenges

Damage and Depreciation Costs Compress Operator Margins

Furniture returned in poor condition after subscription cancellation forces operators to absorb refurbishment or write-off costs that erode already-thin unit economics across every product category. The root cause is inconsistent condition-assessment standards applied at pickup, which several operators are addressing through mandatory photo documentation and stricter deposit-forfeiture terms written into subscriber contracts. Even with these mitigation steps, damage rates remain highest among lower-price subscription tiers, where renters have the least financial incentive to protect furniture they do not own outright, squeezing margins hardest in the segment platforms most need to keep profitable.
Market Impact: Lifts subscriber lifetime value 30%

Logistics Costs Limit Profitable Expansion Into Secondary Cities

Delivery, assembly, and pickup logistics remain expensive relative to furniture value in cities lacking dense subscriber clusters, since trucks often travel long distances to serve scattered individual addresses across sprawling metropolitan areas with persistently low population density. The root cause is insufficient subscriber density to support dedicated local warehousing, forcing operators to serve secondary cities from distant regional hubs at meaningfully higher per-delivery cost. Several operators are piloting micro-fulfillment partnerships with existing regional warehousing providers to lower this cost barrier before committing significant capital to dedicated local facilities in these markets.
Market Impact: Adds 28% of new contracts
4 additional market trends, 3 additional growth drivers, and 2 additional restraints and challenges are covered in the full report. Contact sales@marketmindsadvisory.com to access the complete intelligence.

Segment CAGR and Growth Architecture

Segmentation follows customer type, since furnishing needs, contract length, and price sensitivity vary sharply between individual renters, corporations, and institutional buyers rather than by furniture category or material, which stay broadly consistent across every customer group served by rental operators. This customer-type lens also aligns most directly with how operators price, market, and staff their businesses in practice.
furniture-rental-services-market-market-share-analysis-1790022914455

Residential Subscription Furniture Rental

Residential subscription renters, primarily urban professionals aged twenty-five to forty, are driving the fastest growth as monthly-billing platforms displace both furniture ownership and older fixed-term rental agreements across nearly every major metropolitan market. This segment values digital account management, flexible upgrade paths, and rapid delivery over showroom browsing, pushing operators to invest heavily in mobile applications and same-week fulfillment capability across dense urban delivery zones. Growth concentrates in secondary and tertiary cities where new apartment construction outpaces furniture-ownership affordability, and platforms report the highest subscriber-acquisition efficiency in this segment of any customer type tracked, reflecting genuinely lower marketing costs per signup and stronger word-of-mouth referral rates among peer networks across social media channels.
CAGR 13.5%

Corporate and Relocation Furniture Programs

Corporate and relocation furniture programs serve multinational employers furnishing temporary housing for transferred staff, typically under negotiated master agreements spanning multiple cities and countries simultaneously across entire regional operating footprints worldwide and beyond. This segment commands higher average contract values than residential subscriptions and features longer typical tenures, but requires operators to maintain consistent furniture specifications across every market covered under the master agreement terms. Growth here tracks corporate mobility budgets and hiring cycles more closely than consumer sentiment, giving this segment a somewhat different demand rhythm than the residential subscriber base, with renewal timing concentrated around fiscal-year corporate budget cycles rather than around individual employee lease-renewal dates each calendar year.
CAGR 11.0%
Full segment breakdown across 6 segments available in the complete report.

Regional Architecture and Country Demand Map

North America leads on dollar value given premium corporate-relocation contract pricing, while East Asia and South Asia and Pacific post the fastest subscriber growth as rapid apartment construction and shortening urban rental turnover outpace furniture-ownership affordability across the fastest-growing metropolitan rental markets tracked in this report.

North America

North America holds the largest revenue share because corporate relocation budgets here run considerably higher per placement than in any other region, and the region's established subscription platforms, including Feather, Fernish, and CORT, command premium monthly pricing in major coastal metros. Urban renters relocating for technology and finance jobs sustain steady subscriber turnover across cities including New York, San Francisco, and Toronto. Corporate housing providers increasingly bundle furniture subscriptions directly into relocation packages, reinforcing platform reliance among employers managing frequent transfers across multiple business units. This dollar-value leadership reflects pricing power rather than subscriber count, since East Asian and South Asian markets serve considerably more individual renters at lower average price points overall.
Share: 30% | CAGR: 10.0% (2026 to 2036)

Western Europe

Western Europe combines a mature rental culture, particularly in Germany and the Netherlands where furnished short-term leasing is already common, with growing corporate relocation activity centered on Amsterdam, Berlin, and London. Subscription platforms here compete against long-established furniture rental agents that serve expatriate and student populations, somewhat slowing digital-platform share gains relative to North America. Regulatory attention to subscription cancellation terms is more advanced here than elsewhere, pushing operators toward clearer contract disclosure and deposit-return practices earlier than peers in other regions. Growth trails the global average modestly as rental housing supply constraints in several major cities limit the addressable renter base platforms can realistically reach at profitable unit economics today.
Share: 20% | CAGR: 7.8% (2026 to 2036)
Regional intelligence for 5 additional markets available in the complete report: East Asia, South Asia and Pacific, Latin America, Middle East and Africa, Eastern Europe. Contact sales@marketmindsadvisory.com.
furniture-rental-services-market-country-cagr-analysis-1790022914980

Where Rental Platforms Can Expand Margin

Margin expansion in furniture rental depends less on raising subscription prices and more on extracting additional revenue from inventory already deployed, since idle furniture sitting in a subscriber's home earns nothing beyond the base monthly fee, unlike inventory still actively cycling through the warehouse pipeline toward its next paying placement across the operator's network.

Upselling Subscribers Into Premium Furniture Tiers

Operators are introducing tiered subscription pricing that lets renters upgrade from basic functional furniture to designer-branded or higher-quality packages for a modest monthly premium added to their existing bill. This upsell path costs operators little incremental logistics expense since delivery routes remain largely unchanged, while premium-tier subscribers generate meaningfully higher revenue per delivered item. Early data from platforms running tiered pricing shows roughly 33% of subscribers upgrade within their first renewal cycle, making this among the most reliable margin levers available to operators with existing warehouse infrastructure already in place today.
Market Impact: Lifts average revenue per subscriber roughly 20% overall

Selling Used Inventory Through Secondary Marketplaces

Furniture retired from active rotation after multiple subscriber cycles still carries resale value that many operators previously wrote off entirely as a sunk cost. Platforms are now building secondary marketplaces, either owned or through partnerships with resale specialists, to recover value from aging inventory before full depreciation sets in after roughly 36 months. This lever requires minimal additional capital since it monetizes furniture operators already own, though it demands new logistics coordination for pickup, grading, and resale listing. Margin recovery from this channel is currently modest but growing quickly as more operators formalize dedicated resale programs.
Market Impact: Recovers roughly 12 to 18% of written-off value

Expanding Corporate Master Agreements Across More Cities

Corporate relocation contracts generate more predictable, higher-value revenue than individual subscriptions, but most operators currently serve only a handful of cities under any single master agreement, often fewer than 10 in total. Expanding geographic coverage within existing corporate relationships requires less sales effort than winning entirely new accounts, since the commercial relationship and pricing framework already exist between both parties involved. Operators investing in multi-city fulfillment capability specifically to support this expansion report meaningfully higher win rates when relocation providers renew and broaden their master agreements at contract renewal time.
Market Impact: Adds 15% more cities per renewed corporate contract

Offering Furniture Buyout Options at Contract End

Subscribers who have grown attached to specific furniture pieces after 6 or more months of use increasingly represent a buyout opportunity operators previously left on the table by defaulting to pickup and return. Offering a discounted purchase option at contract end converts a logistics cost, the pickup trip, into incremental revenue while also reducing warehouse restocking burden across the network. This lever works best for premium-tier furniture where subscriber attachment runs highest, and several operators report buyout uptake climbing steadily as awareness of the option spreads among long-tenure subscribers approaching contract renewal.
Market Impact: Converts roughly 11% of contract endings into buyouts

Who Controls the Margin Pool

The top five furniture rental operators hold a combined 18% of category revenue, evaluated on a revenue basis, leaving a highly fragmented landscape of regional agents and city-specific platforms across most national markets. CORT and Feather command the clearest leadership positions in corporate relocation and residential subscription channels respectively, while dozens of smaller operators compete on price and local delivery speed in individual metro markets without national scale.
Current competitive activity concentrates on three fronts: building multi-city logistics networks capable of serving corporate master agreements, launching tiered subscription pricing to capture additional upsell revenue from existing renters, and pursuing secondary marketplace partnerships to monetize retired inventory before full depreciation. Operators unable to fund warehouse expansion increasingly become acquisition targets for better-capitalized national platforms seeking faster geographic coverage.

Rankings are most likely to shift among regional mid-tier operators rather than at the very top, as venture-backed platforms in India and China scale subscriber bases faster than established Western operators can match through organic expansion. Operators investing early in logistics automation and corporate-contract sales capacity are positioning to capture share from slower-moving regional agents still reliant on manual scheduling.
furniture-rental-services-market-company-positioning-matrix-1790022915514

Competitive Moat and Risk Dimensions

CORT BUSINESS SERVICES

Moat: Established Corporate Relocation Relationships

Decades of relationships with corporate relocation providers and Fortune 500 human-resources departments give CORT contract renewal rates smaller platforms cannot easily replicate. Its national warehouse network lets it fulfill multi-city master agreements that regional operators cannot service alone, reinforcing its position as the default choice for large-scale corporate relocation programs.
CORT BUSINESS SERVICES

Risk: Slower Digital Platform Adoption

CORT's legacy sales-driven model has been slower to build the mobile-first, self-service subscription experience that younger residential renters increasingly expect from furniture platforms. This leaves it exposed as digitally native competitors capture younger urban subscribers who never call a sales representative before signing up for furniture delivery service.
FEATHER

Moat: Digitally Native Subscriber Experience

Feather built its platform around mobile-first account management, flexible swap options, and rapid delivery scheduling that resonates strongly with younger urban renters. This user-experience advantage, combined with data-driven inventory allocation, supports subscriber-acquisition costs meaningfully lower than legacy rental agents relying on showroom traffic and phone-based sales.
FEATHER

Risk: Limited Corporate Contract Penetration

Feather's brand recognition sits strongly with individual residential subscribers but remains limited among corporate relocation buyers who still default to established providers like CORT for large multi-city contracts. Building the enterprise sales relationships needed to win corporate master agreements takes considerably longer than scaling a purely consumer subscriber base.

Players Tracked

Prominent Players

CORT Business Services
Feather
Fernish
Oliver Space
Aaron's Inc

Other Key Players

Rentomojo
Furlenco
CityFurnish
Fluid Living
Framework Furniture Rental
Grover Group GmbH
InStyle-Modern
American Furniture Rental Inc
Brook Furniture Rental
Churchill Living
Blueground
Rent-A-Center Inc
Casa One
Zeus Living
AFR Furniture Rentals

Recent Developments

FEBRUARY 2026

Feather Raises Growth Capital to Fund Warehouse Expansion

Feather closed a new growth-capital round dedicated to expanding warehouse capacity in secondary US metro markets currently underserved by same-week delivery. The funding also supports development of tiered subscription pricing designed to capture upsell revenue from existing residential subscribers without meaningfully raising acquisition costs across new geographic markets.
Signal: Confirms investor confidence in subscription furniture models despite broader consumer-spending caution across most major metro economies today.
OCTOBER 2025

CORT Signs Multi-City Master Agreement With Global Relocation Provider

CORT entered a multi-year supply agreement with a major global relocation provider, committing dedicated furniture inventory across twelve metro markets for corporate housing placements. The agreement was structured as a supply arrangement rather than an acquisition, expanding CORT's contracted city coverage without new capital investment in owned facilities.
Signal: Confirms corporate master agreements remain the primary growth vector for established legacy rental operators worldwide today.
MAY 2026

Rentomojo Expands Into Southeast Asian Markets From India Base

Rentomojo announced organic expansion into Southeast Asian cities, extending its India-proven subscription model to markets with similarly high urban rental turnover and limited furniture-ownership affordability among young professionals. The expansion leverages existing logistics partnerships rather than building entirely new regional infrastructure from the ground up immediately.
Signal: Signals Asian subscription platforms are exporting their proven operating model well beyond their original home markets.

Managing Furniture Procurement and Logistics Costs

Furniture procurement and warehousing together represent roughly 48% of operating cost of goods sold for subscription rental platforms, with delivery and assembly labor making up most of the remainder. Frame components and upholstery fabric source primarily from Vietnamese and Chinese furniture manufacturers, while warehouse real estate costs concentrate in expensive urban-adjacent logistics parks near dense subscriber populations.
Ocean freight rates for furniture imports spiked through 2025 as container capacity tightened on major trans-Pacific trade lanes, a pattern documented in US Census Bureau trade data on furniture import volumes and pricing trends. Operators without long-term freight contracts saw landed furniture costs rise faster than subscription pricing could reasonably absorb, compressing margins for several consecutive quarters before newly renegotiated sourcing agreements took effect across the supply chain.

Smaller regional operators carry disproportionate exposure because they lack the purchasing volume to negotiate favorable freight and manufacturing contracts that national platforms routinely secure. This gap widens further in markets where warehouse real estate costs are rising fastest, leaving undercapitalized operators in expensive coastal metros at a lasting cost disadvantage on unit economics versus operators who locked in longer facility leases at earlier, lower rates.
furniture-rental-services-market-cost-volatility-analysis-1790022915714

Forward Contracting on Ocean Freight Capacity

Operators increasingly lock in ocean freight capacity through annual contracts with shipping lines, trading pricing flexibility for cost certainty across furniture-import planning cycles that span multiple product categories. This approach shields margin during volatile quarters but requires forecasting commitments that smaller regional operators without predictable order volume often find difficult to negotiate favorably with carriers.

Diversifying Manufacturing Across Multiple Countries

Leading platforms are qualifying secondary furniture manufacturers across Vietnam, Malaysia, and Mexico to reduce dependence on any single sourcing country for core product lines going forward. Diversification adds meaningful supplier management overhead but reduces exposure to single-country tariff or shipping disruptions that previously delayed inventory replenishment for entire product categories across multiple warehouse regions nationwide.

Portfolio Architecture for Margin Defence

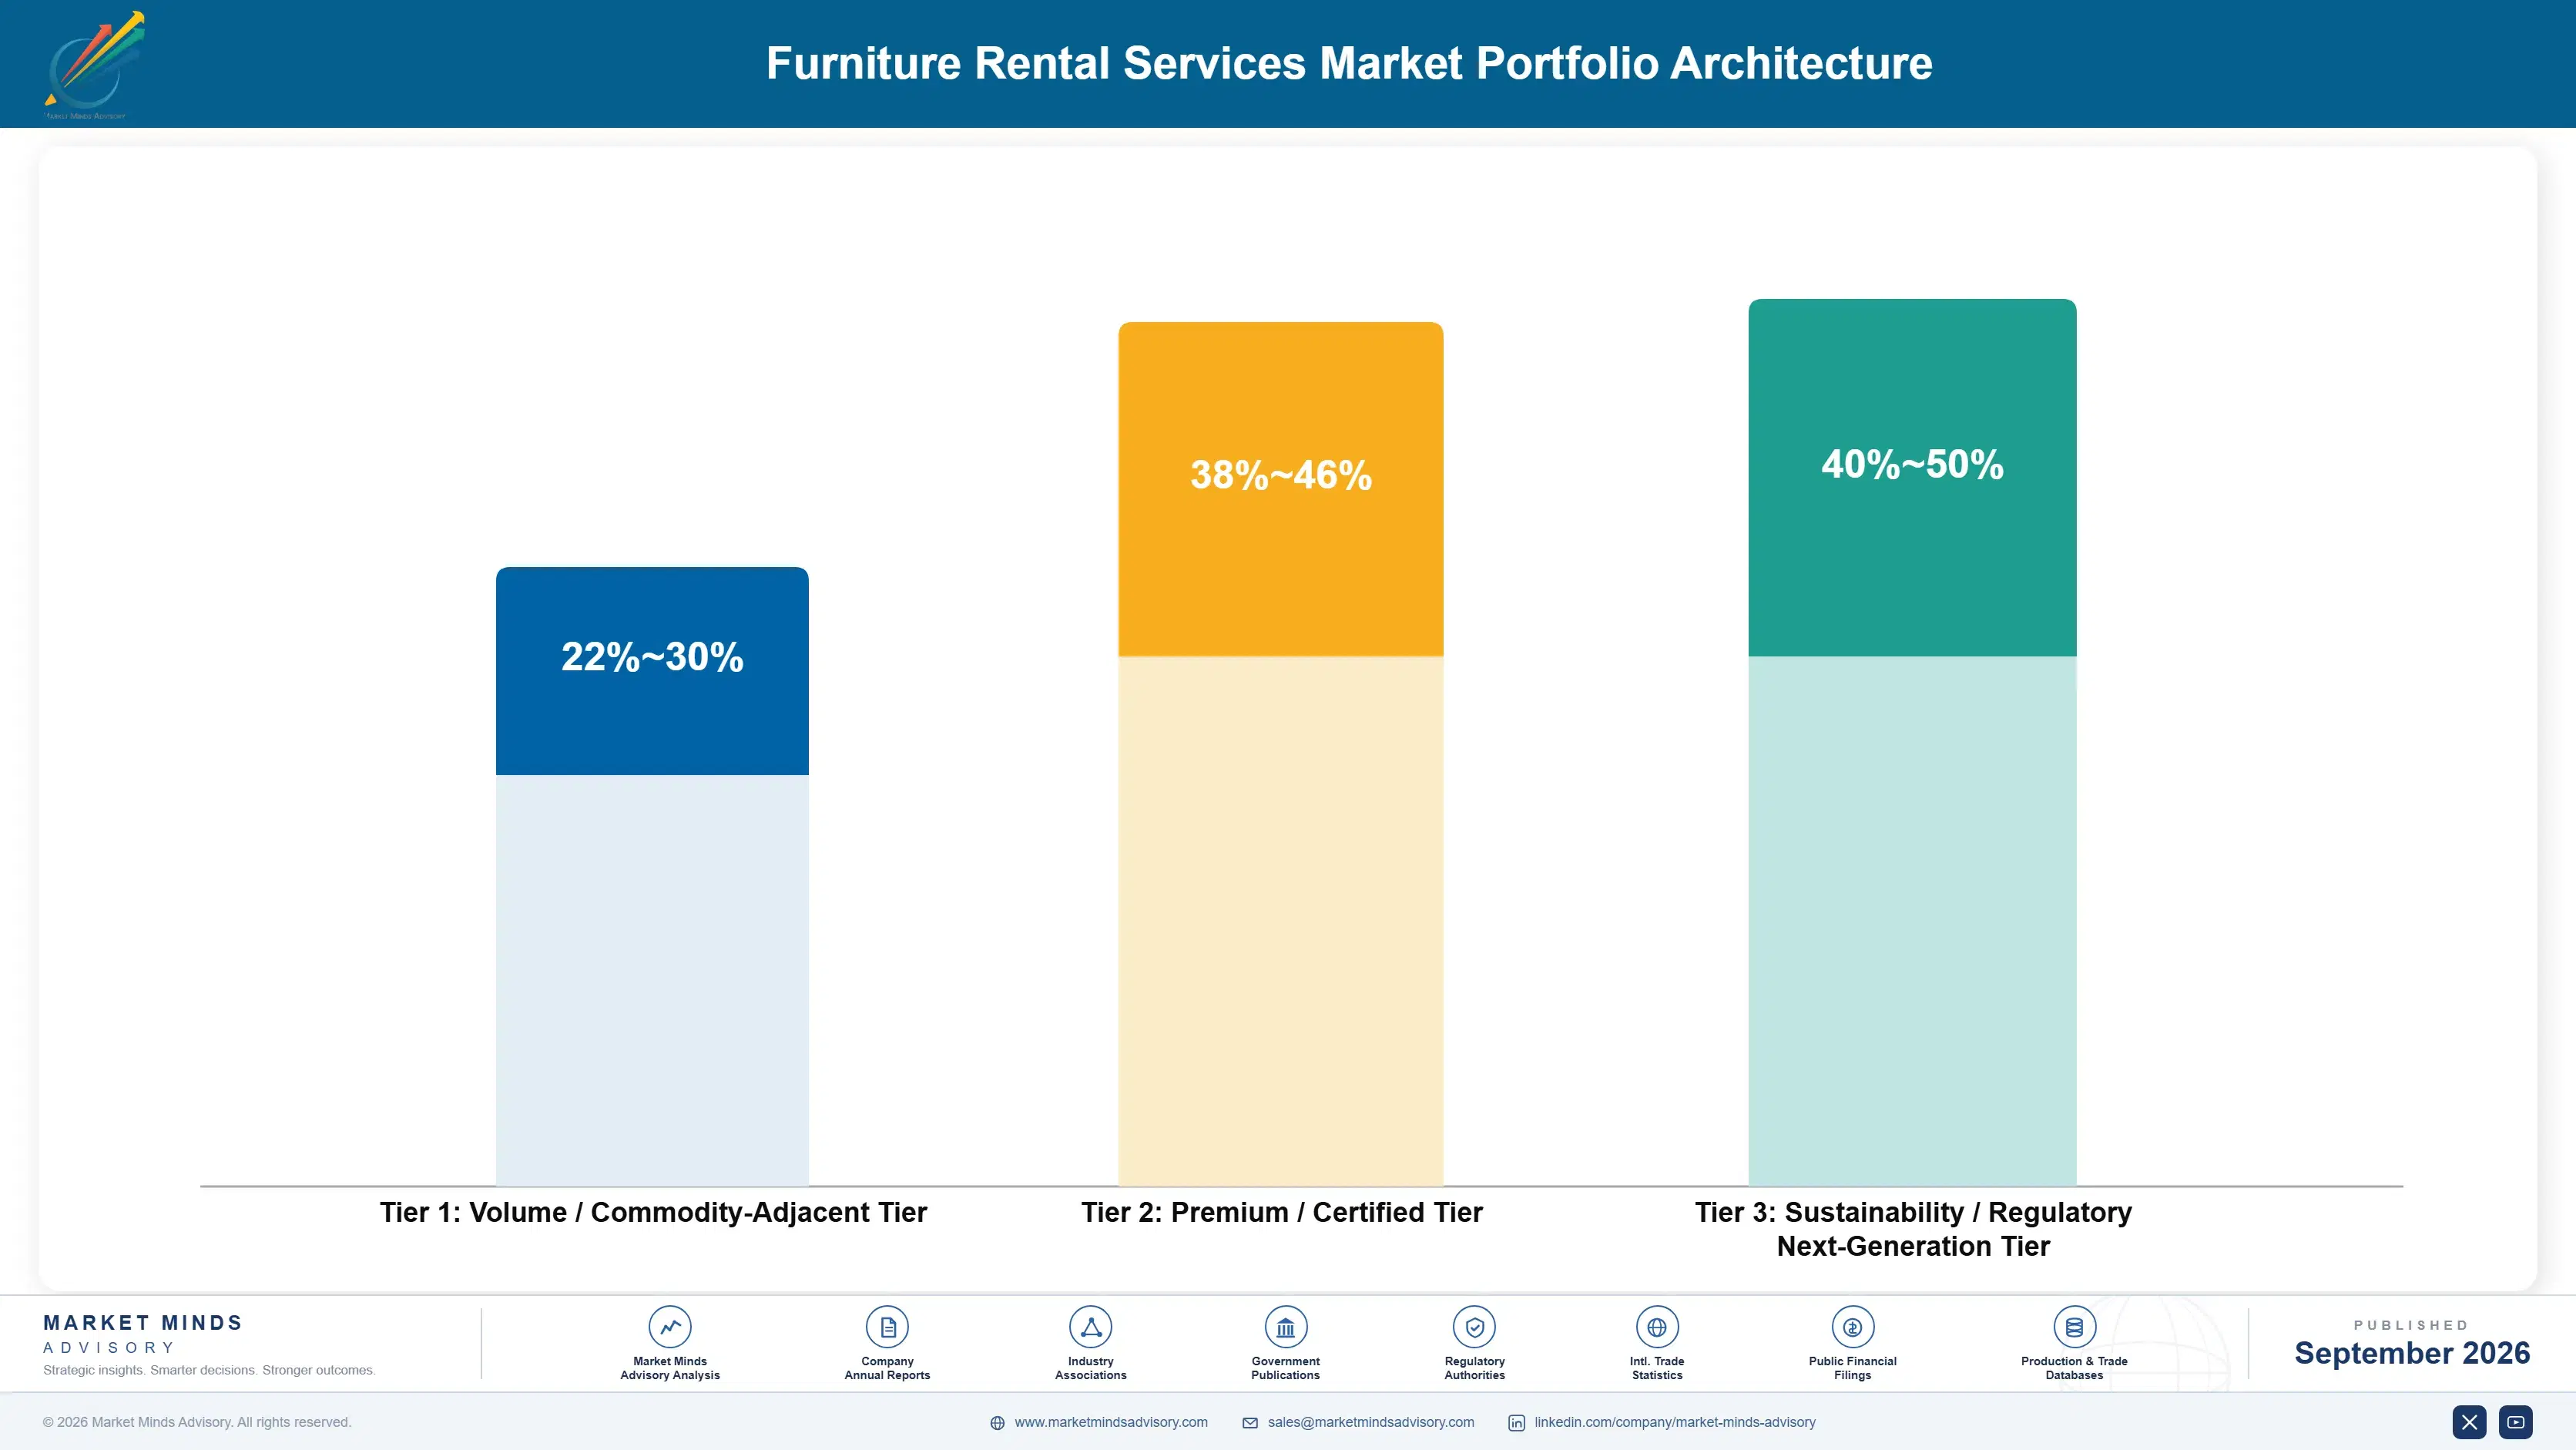
Furniture rental portfolios organize into three tiers separated primarily by furniture quality and subscription price point rather than by customer type or contract length. Volume-tier packages use durable, low-cost frames and fabrics designed for repeated cycling across many subscribers over several years, while premium and sustainability tiers use higher-cost materials that command meaningfully better margins per delivered unit.
Tension between volume and premium tiers centers on warehouse space allocation, since premium furniture occupies the same square footage as volume furniture while generating meaningfully higher revenue per unit delivered to subscribers. Operators increasingly weight new capital toward premium-tier inventory expansion, even as volume tiers still generate the majority of total subscriber count and remain essential to acquisition funnel economics across every metro market served today.

High-value margin pools concentrate in the premium and sustainability tiers, where subscribers pay meaningfully more per month for certified-sustainable materials or designer partnerships with recognizable furniture brands and manufacturers. Volume tier remains the largest revenue contributor by absolute dollars but carries the thinnest margins of the three, making tier mix increasingly central to overall portfolio profitability as competition intensifies across every price segment.

Volume / Commodity-Adjacent Tier

Durable, low-cost furniture packages built from standardized frames and easy-clean fabrics, targeting price-sensitive residential subscribers who prioritize monthly affordability and fast delivery speed over material quality or overall design distinctiveness.
Gross Margin: 22%-30%

Premium / Certified Tier

Higher-quality furniture built with recognizable brand partnerships and better upholstery materials, targeting urban subscribers willing to pay meaningfully more each month for design, comfort, and a more polished aesthetic than volume-tier alternatives.
Gross Margin: 38%-46%

Sustainability / Regulatory / Next-Generation Tier

Certified-sustainable materials, extended-life refurbishment programs, and circular-economy sourcing practices, targeting environmentally motivated subscribers and corporate ESG-linked contracts that increasingly require documented sustainability credentials from every vendor under consideration for large accounts.
Gross Margin: 40%-50%
furniture-rental-services-market-portfolio-architecture-1790022916216

High-value Sub-segments and Strategic Watch-out

Corporate ESG-Linked Furniture Programs

Corporate clients increasingly request certified-sustainable furniture packages tied directly to internal ESG reporting commitments, creating a high-value, high-growth niche within the sustainability tier that commands premium pricing and considerably longer contract terms than standard corporate housing placements typically secure from relocation-focused enterprise buyers each year.
Gross Margin: 44%-52%

Designer-Branded Premium Subscriptions

Partnerships with recognizable furniture design brands let operators charge meaningfully higher monthly fees for aspirational aesthetics, generating high per-unit value with only moderate subscriber growth as this niche remains largely limited to higher-income urban markets with strong existing brand awareness and disposable income to spend.
Gross Margin: 38%-45%

Standard Residential Volume Subscriptions

The largest subscriber base by far, standard volume packages generate steady, predictable revenue at thinner margins, forming the durable foundation of platform economics even as growth increasingly concentrates in the higher-margin tiers sitting above this core volume segment over the coming decade of category maturation.
Gross Margin: 22%-28%

Buy-Now-Pay-Later Furniture Financing

Financing-adjacent offerings that blur the line between rental and ownership are gaining traction among price-sensitive subscribers, a trend worth monitoring closely since it could divert volume-tier subscribers toward hybrid ownership models that meaningfully reduce recurring rental revenue over time across the broader price-sensitive customer base.
Gross Margin: 18%-24%

Recurring Revenue Depth by Vertical

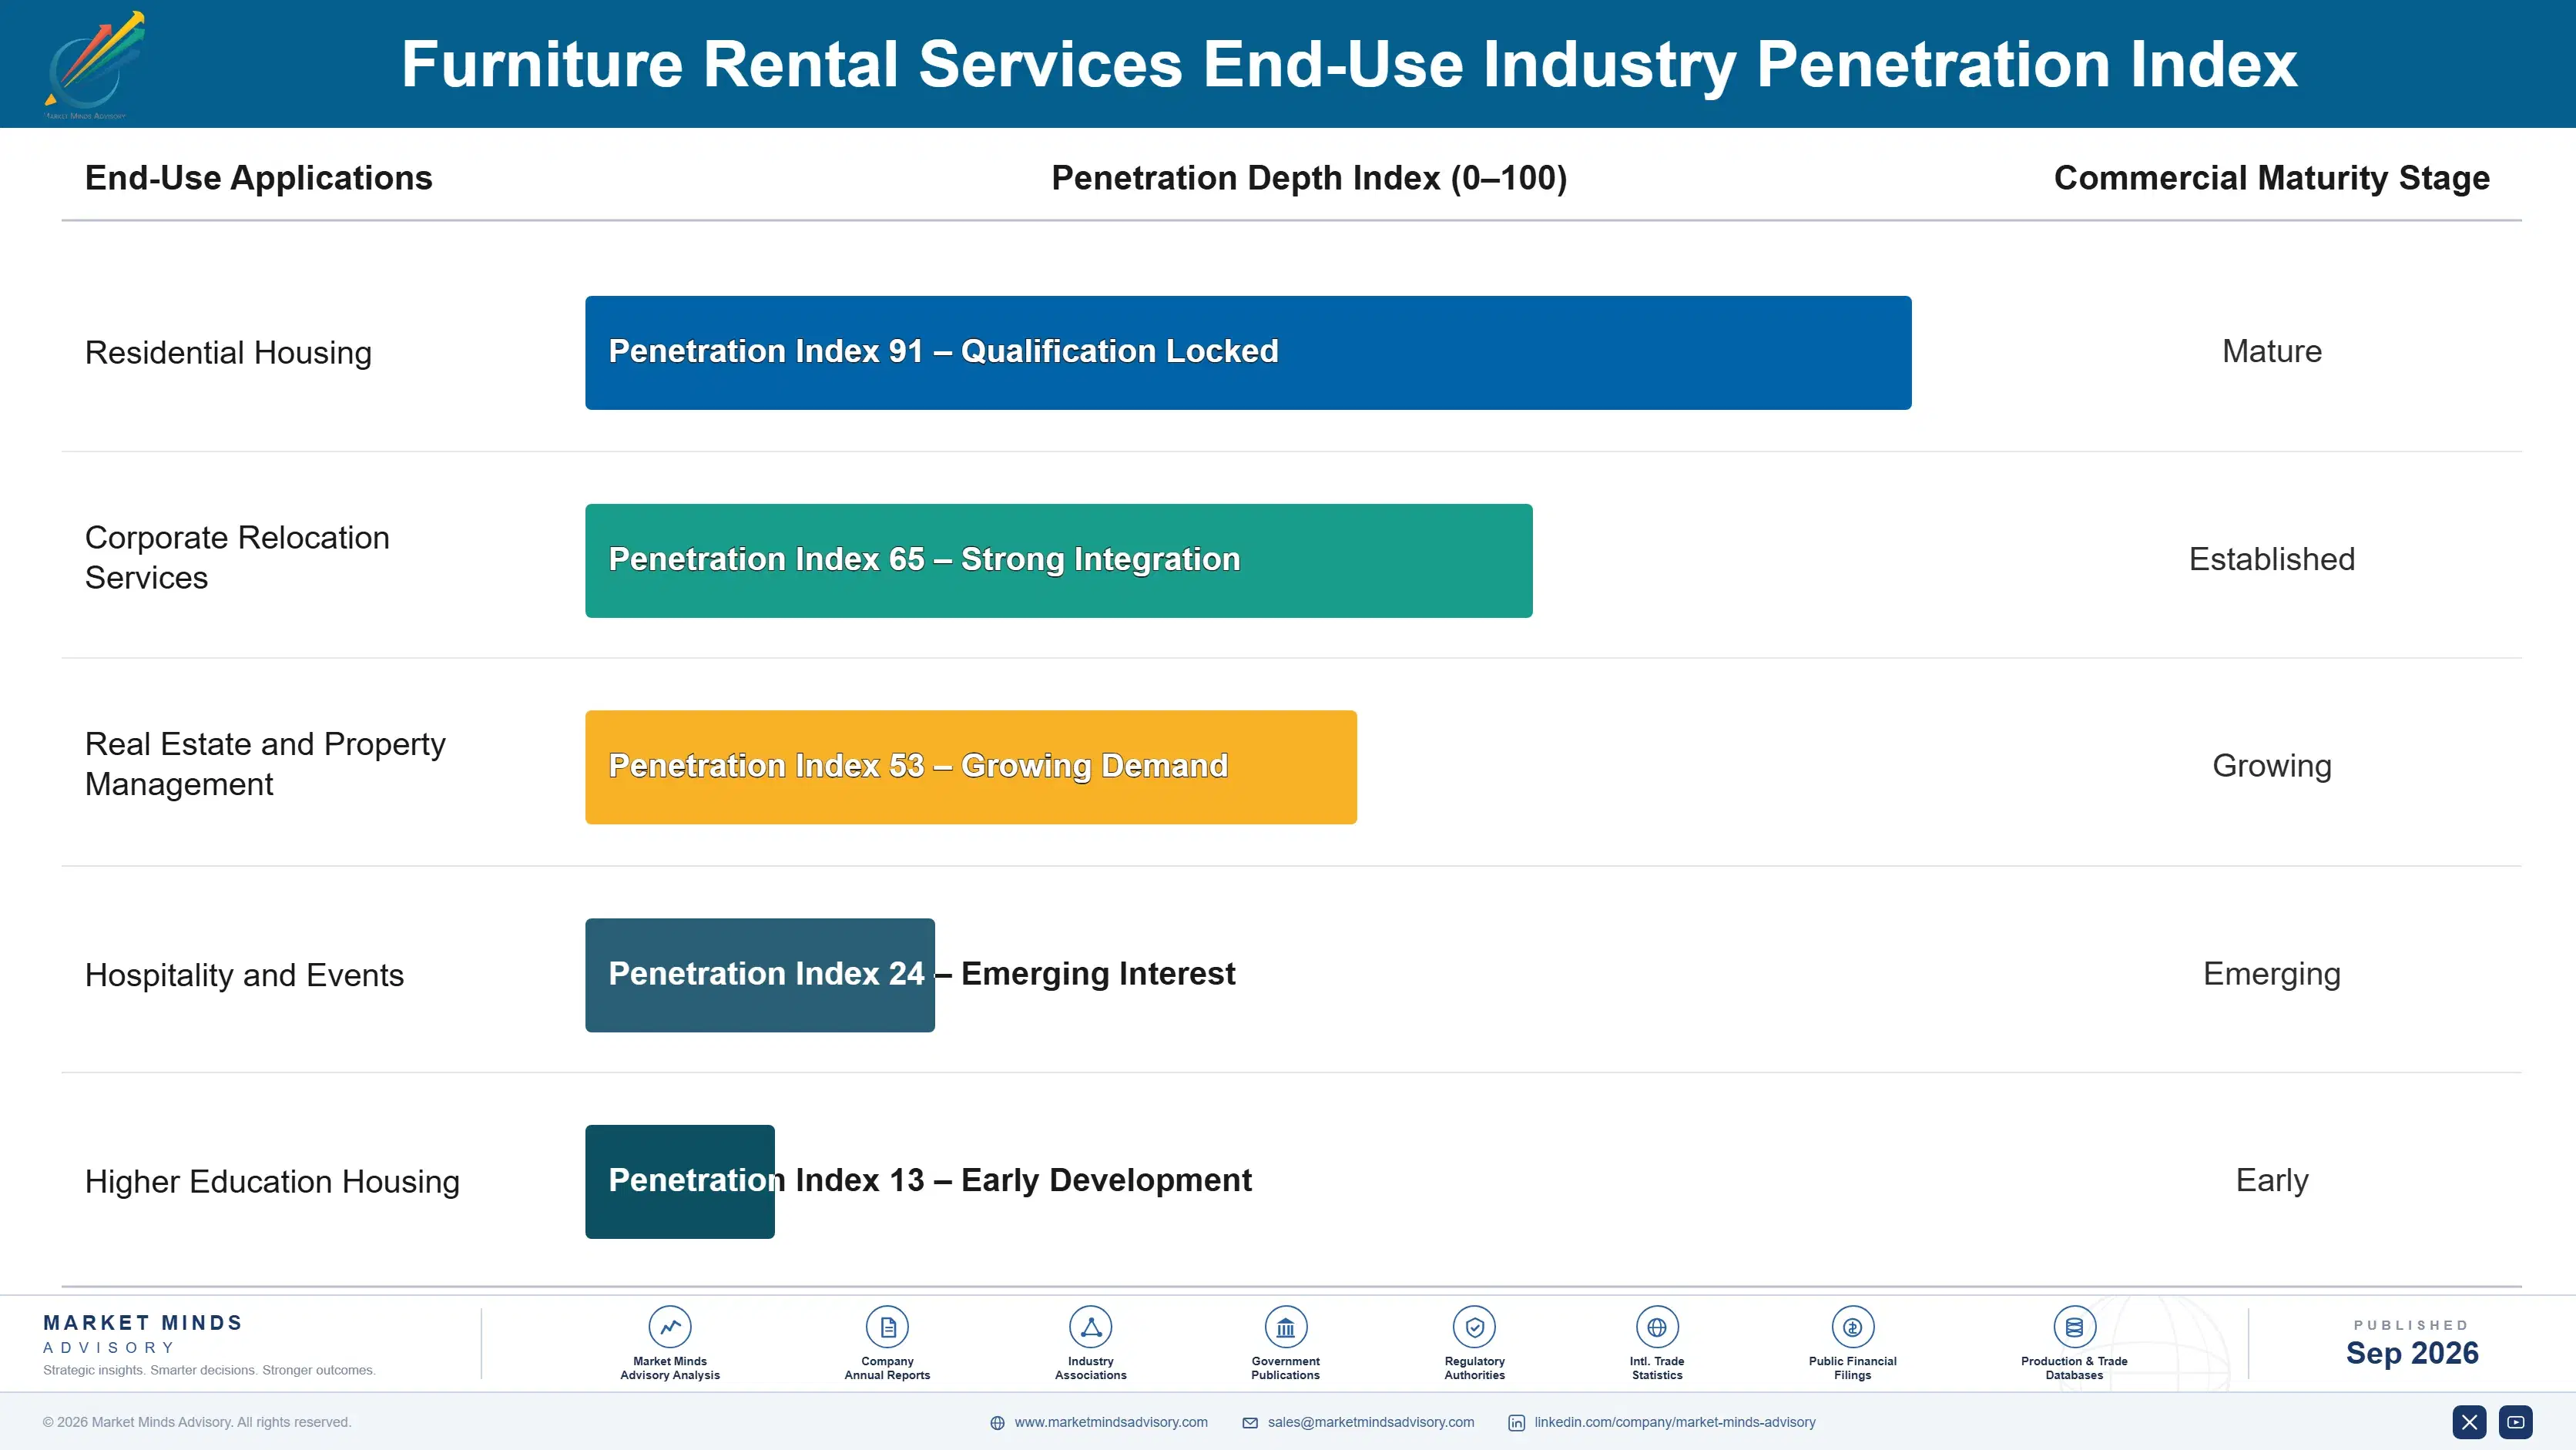
Furniture rental economics resemble annuity businesses more than traditional retail, since each subscriber generates predictable monthly revenue across an extended tenure rather than a single point-of-sale transaction. This recurring structure lets operators forecast cash flow with far greater confidence than furniture retailers dependent on unpredictable, lumpy purchase timing across an unevenly distributed customer base spread across many disconnected regional markets.
Adoption depth varies meaningfully by vertical: corporate relocation programs show the deepest stickiness since switching providers mid-contract disrupts employee housing continuity and invites internal scrutiny, while individual residential subscribers churn more freely when moving to a new city outside an operator's coverage area entirely. Student housing sits between these extremes, with semester-length commitments providing moderate predictability that neither matches corporate stickiness nor residential volatility.

Generational buyer shifts favor subscription models durably rather than temporarily, as younger renters entering the workforce have grown up with subscription billing across media, software, and transportation, making furniture subscriptions feel unremarkable rather than novel or experimental. This normalization suggests durable long-term demand rather than a temporary pandemic-era preference shift that fades as remote-work patterns continue evolving over the next decade.
furniture-rental-services-market-end-use-penetration-index-1790022916767

MMA Furniture Rental Playbook

These are among the four positions where our research anticipates prominent divergence between winners and laggards over the coming forecast period. Each is grounded in the demand model, the regulatory perimeter, and the announced capacity pipeline.
01 / LOGISTICS DENSITY INVESTMENT

Warehouse density beats catalog breadth for winning subscribers

Operators competing primarily on furniture selection are losing to competitors who compete on delivery speed and warehouse proximity to subscriber clusters, a shift that is only accelerating. Same-week delivery capability drives subscriber-acquisition efficiency more reliably than expanding the catalog of available furniture styles ever does. MMA recommends operators prioritize warehouse density in target metros before expanding product breadth, since logistics infrastructure takes considerably longer to build than a wider catalog and creates a genuinely more durable competitive advantage once fully established.
02 / CORPORATE CONTRACT EXPANSION

Master agreements deserve dedicated enterprise sales investment

Corporate relocation contracts generate meaningfully more predictable revenue per placement than individual subscriptions, yet many operators still treat corporate sales as a secondary channel rather than a dedicated function within the organization. MMA recommends operators build a standalone enterprise sales team focused specifically on expanding existing master agreements into additional cities. This expansion path requires considerably less acquisition spend than winning entirely new corporate accounts and converts existing institutional trust into incremental revenue faster than any competing growth channel available today.
03 / TIERED SUBSCRIPTION PRICING

Upgrade paths matter more than headline subscription price

Platforms winning on price alone eventually face margin pressure from competitors willing to undercut further and further with each successive pricing cycle. Platforms offering clear upgrade paths instead capture incremental revenue from subscribers already acquired at reasonable cost, without additional marketing spend. MMA recommends operators invest in tiered subscription design that makes upgrading feel like a natural next step rather than a separate purchase decision, since this approach lifts lifetime value meaningfully without requiring any additional subscriber-acquisition spend at all.
04 / SECONDARY MARKET DEVELOPMENT

Retired inventory represents an underused revenue opportunity

Furniture retired after multiple subscriber cycles still holds meaningful resale value that many operators currently write off entirely rather than monetize through dedicated secondary channels and formal resale partnerships with third-party vendors. MMA recommends operators build or partner into secondary marketplaces specifically designed to capture this value before full depreciation occurs across the fleet. This lever requires minimal incremental capital and directly improves unit economics on furniture operators already own outright, across their existing warehouse footprint and current subscriber base nationwide.

Engagement Snapshot From the Field

A live engagement with an industry participant carrying material or product regulatory and market exposure ahead of a defining policy shift, showing how our research translates into a defensible multi-year portfolio strategy.
MARKET MINDS ADVISORY · CLIENT ENGAGEMENT SUMMARY
Furniture Rental Services Producer Strategic Portfolio Review and Transition Roadmap 2026·Investment Scenario on Furniture Rental Services Exposure Evaluation 2025-26
CLIENT PROFILE
The client is a mid-sized furniture rental operator serving three major North American metros, with annual revenue reported by the client at approximately $42 million (client-reported, unverified by MMA). The company built its business on residential subscription billing but had not yet developed corporate relocation contract capability, leaving a meaningful revenue segment unaddressed despite strong brand recognition among individual urban renters in its home markets.
STRATEGIC CHALLENGE
Management wanted to expand into corporate relocation contracts but lacked confidence in pricing structure, enterprise sales capability, and whether existing warehouse infrastructure could support the consistent multi-city fulfillment that corporate master agreements typically require from platform operators competing seriously for large, multi-year enterprise accounts against considerably better-funded national rivals with established relocation-industry relationships.
MMA APPROACH
MMA conducted primary interviews with corporate relocation buyers and benchmarked competitor master-agreement structures to identify pricing and service-level expectations across the category broadly. The engagement assessed the client's existing warehouse network against corporate-contract fulfillment requirements and modeled expected contract economics under several enterprise sales investment scenarios and staffing configurations before finalizing recommendations.
KEY FINDINGS
  1. Corporate buyers prioritized fulfillment consistency across cities over price, a signal that pricing pressure was not the true adoption barrier limiting growth.
  2. Existing warehouse density in two of the client's three metros already met corporate service-level expectations without requiring any additional capital investment upfront.
  3. Competitor master agreements typically bundled furniture assembly and pickup logistics rather than pricing these services as separate, itemized line items on invoices.
  4. A dedicated enterprise sales hire generated a positive return within two quarters based on comparable-operator benchmark conversion rates observed across the category.
CLIENT PROFILE
The client is a mid-sized furniture rental operator serving three major North American metros, with annual revenue reported by the client at approximately $42 million (client-reported, unverified by MMA). The company built its business on residential subscription billing but had not yet developed corporate relocation contract capability, leaving a meaningful revenue segment unaddressed despite strong brand recognition among individual urban renters in its home markets.
STRATEGIC CHALLENGE
Management wanted to expand into corporate relocation contracts but lacked confidence in pricing structure, enterprise sales capability, and whether existing warehouse infrastructure could support the consistent multi-city fulfillment that corporate master agreements typically require from platform operators competing seriously for large, multi-year enterprise accounts against considerably better-funded national rivals with established relocation-industry relationships.
MMA APPROACH
MMA conducted primary interviews with corporate relocation buyers and benchmarked competitor master-agreement structures to identify pricing and service-level expectations across the category broadly. The engagement assessed the client's existing warehouse network against corporate-contract fulfillment requirements and modeled expected contract economics under several enterprise sales investment scenarios and staffing configurations before finalizing recommendations.
KEY FINDINGS
  1. Corporate buyers prioritized fulfillment consistency across cities over price, a signal that pricing pressure was not the true adoption barrier limiting growth.
  2. Existing warehouse density in two of the client's three metros already met corporate service-level expectations without requiring any additional capital investment upfront.
  3. Competitor master agreements typically bundled furniture assembly and pickup logistics rather than pricing these services as separate, itemized line items on invoices.
  4. A dedicated enterprise sales hire generated a positive return within two quarters based on comparable-operator benchmark conversion rates observed across the category.
RECOMMENDED STRATEGY
Phase 1: Phase 1 (Months 1 to 3): Hire a dedicated enterprise sales lead and formalize standardized corporate pricing tiers across all target metros. Phase 2: Phase 2 (Months 4 to 8): Pilot master agreements with two relocation providers in the client's strongest existing metro market. Phase 3: Phase 3 (Months 9 to 12): Expand the successful pilot structure into the remaining two core metropolitan markets served by the client.
OUTCOME
Within twelve months, the client signed master agreements with three relocation providers, adding an estimated $6.5 million in annualized corporate contract revenue (client-reported, unverified by MMA). Corporate accounts now represent roughly 18% of total revenue, up from effectively zero before the engagement began, diversifying the client's revenue base meaningfully.

Frequently Asked Questions

Foundational context covering the market sizes, CAGR, scope, country, region and competition that inform every finding below. This section is provided to cover basics and most often pre-purchase conversations, answered from the MMA Primary Research Dataset.

What is the current size of the Furniture Rental Services Market?

The furniture rental services market reached $9.8 billion in 2025, covering subscription and fixed-term furniture rental delivered through digital platforms and rental agents worldwide across every metro market.

How large will the Furniture Rental Services Market be by 2036?

MMA projects the market will reach $26.6 billion by 2036, roughly 2.48 times its 2026 value as subscription platforms expand into secondary and tertiary cities.

What is the CAGR for the Furniture Rental Services Market 2026 to 2036?

The market is projected to grow at a 9.5% compound annual growth rate between 2026 and 2036, supported by rising urban renter turnover across major global metros.

Which segment is growing fastest?

Residential subscription furniture rental leads growth at a 13.5% CAGR, roughly 1.42 times the overall market rate, as monthly billing displaces older fixed-term rental agreements.

Who are the major companies in the Furniture Rental Services Market?

Leading operators include CORT Business Services, Feather, Fernish, Oliver Space, and Aaron's Inc, together holding an estimated 18% of total category revenue across all markets today.

Which country is growing fastest?

India leads country-level growth at a 12.8% CAGR, driven by platforms including Furlenco and Rentomojo converting urban renters away from furniture ownership entirely and quickly.

Report Segmentation Architecture

The full report scope spans multiple orthogonal segmentation dimensions, with cross-tabulated demand data provided for each dimension pair. Coverage extends further to regional breakdowns, trend trajectories, and the competitive detail needed to support segment-level decision-making.

By Customer Type

  • Residential Subscription Renters
  • Corporate and Relocation Programs
  • Real Estate Staging Services
  • Event and Hospitality Rental
  • Student and Co-Living Housing
  • Government and Institutional Rental

By End-Use Industry

  • Residential Housing
  • Corporate Relocation Services
  • Real Estate and Property Management
  • Hospitality and Events
  • Higher Education Housing

By Commercial Dimension

  • Subscription Billing Model
  • Fixed-Term Rental Agreements
  • Direct-to-Consumer Platform Sales
  • Business-to-Business Master Agreements

By Region

  • North America
  • Western Europe
  • East Asia
  • South Asia and Pacific
  • Latin America
  • Middle East and Africa
  • Eastern Europe

Scope, Methodology, and Coverage

Every figure in this report is reproducible from documented input assumptions. The scope below maps the historical period, the forecast horizon, the segmentation dimensions, and the countries covered, alongside the underlying primary and qualitative methodology.
Historical Period
2020 to 2025
Forecast Period
2026 to 2036
Base Year
2025 (USD billions; MMA Primary Research Dataset, September 2026)
Market Definition
The furniture rental services market comprises subscription and fixed-term rental of residential and light-commercial furniture delivered through digital platforms and traditional rental agents, including delivery, assembly, and pickup logistics. It excludes furniture manufacturing, retail furniture sales, and construction or event-staging equipment rental.
Quantitative Units
USD billions (current prices); subscriber count where applicable
Segmentation Dimensions
By Customer Type; By End-Use Industry; By Commercial Dimension; By Region
Regions Covered
North America, Western Europe, East Asia, South Asia and Pacific, Latin America, Middle East and Africa, Eastern Europe
Countries Covered
USA, China, Germany, France, UK, Japan, South Korea, India, Australia, Canada, Brazil, Mexico, Indonesia, Vietnam, Thailand, Malaysia, UAE, Saudi Arabia, South Africa, Nigeria, Turkey, Poland, Netherlands, Italy, Spain, Sweden, Switzerland, Argentina, Colombia, Singapore, and additional markets relevant to this sector
Key Companies Profiled
CORT Business Services, Feather, Fernish, Oliver Space, Aaron's Inc, Rentomojo, Furlenco, CityFurnish, Fluid Living, Framework Furniture Rental, Grover Group GmbH, InStyle-Modern, American Furniture Rental Inc, Brook Furniture Rental, Churchill Living, Blueground, Rent-A-Center Inc, Casa One, Zeus Living, AFR Furniture Rentals
Quantitative Methodology
Primary survey, n=3,800 respondents, Q4 2025, six countries; demand-side model with trade association cross-validation
Qualitative Methodology
47 expert interviews, Q4 2025; applied to validate demand model assumptions, identify emerging dynamics, and assess competitive positioning
Report Format
PDF and XLSX data workbook (Word format preview document)
Publisher
Market Minds Advisory
Report Code
MMA-2026-CON-198
Published
September 2026
Contact
sales@marketmindsadvisory.com | www.marketmindsadvisory.com

Purchase the full Furniture Rental Services Market Report (2026 to 2036).

This report delivers a full analysis of the furniture rental services market. It covers demand drivers, competitive positioning, and regional dynamics across all seven MMA-tracked regions worldwide. The report includes detailed segmentation by customer type, twenty profiled companies spanning corporate relocation and residential subscription platforms, and a ten-year forecast through 2036 built on primary survey data collected across six countries and dozens of expert interviews. The deliverable also contains input-cost analysis and portfolio-tier economics. A strategic verdict section is designed specifically for corporate development and market-entry planning teams evaluating this fast-changing category.
Full Ten-Year Market Forecast Through 2036
Twenty Company Competitive Profiles Included Here
Seven-Region Demand and Growth Rate Analysis
Full Customer-Type Segmentation Analytical Framework Overview
Detailed Input Cost and Margin Analysis
Anonymized MMA Client Engagement Case Study

Built For The People Who Decide

From boardroom strategy to bench-side execution, this report is read cover-to-cover by leaders shaping the next decade of their industry, turning demand scenarios, market dynamics and valuation benchmarks into decisions.
CXOs/ Presidents/ VPs/ Managers
M&A and Corporate Development
Strategy Teams and R&D Heads
Procurement and Product Directors
Regulatory and Compliance Leaders
Investor Relations and Equity Analysts