

Market Minds Advisory
Functional Cosmetic Ingredients Market

Functional Cosmetic Ingredients Market: Functional Cosmetic Ingredients Market: Claim Substantiation, Use Level Reality and European Restriction Pressure

Supplier efficacy dossiers are built at concentrations and in vehicles that almost no finished formula reproduces, and roughly a ninth of them carry any data on the product a consumer actually buys.

Lead Analyst

Published

September 2026

Make Smarter Decisions with Customized Research Insights

Request a free sample report and evaluate market opportunities, growth trends, and competitive dynamics relevant to your business needs.

2025 MARKET VALUE$6.4BMarket Size 2025
2036 FORECAST VALUE$13.1BBase Case , 2026 to 2036
CAGR 2026 TO 20366.8 %Bull 8.1% / Bear 5.6%
INCREMENTAL OPPORTUNITY$6.3BNet 10- year value creation
EXPANSION MULTIPLE1.93x2036 value over 2026 base
Strategic Levers
M&A Pipeline
Regional Outlook
Country Rankings
Competitive Intelligence
Segmental Deep-dive
Call-Us : 91 93563 13602

Executive Snapshot and Market Trajectory.

The efficacy data does not travel with the ingredient. A peptide tested at 2% in a simple aqueous vehicle on 22 subjects is sold into a finished cream that uses it at 0.3% alongside forty other materials, and the claim moves across intact while the evidence does not.
Barrier repair and lipid actives grow at 10.2%, half again the market rate of 6.8%, because ceramide and fatty acid complexes address a claim that dermatologists and consumers now use the same words for. Anti-acne and sebum actives follow at 8.3%. UV filters grow slowest at 5.2%, squeezed by European restriction pressure and by a reformulation cycle that has removed several established molecules from the permitted list.
Europe originates the regulatory pressure and pays most for it. Successive Omnibus Acts have restricted retinol concentration, tightened filter permissions and narrowed kojic acid use, and each one forces reformulation across every product sold there. That vocabulary travels westward quickly, and it arrives ahead of the regulation. East Asia holds roughly 34% of demand, above the standard band, because Korean and Japanese formulators set the active agenda that the rest of the industry follows.
Market Definition
This market covers ingredients supplied to cosmetic and personal care manufacturers that carry a claimed biological or performance function on skin or hair, spanning anti-ageing and peptide actives, brightening actives, UV filters, barrier repair lipids, anti-acne actives and soothing actives. Sizing is at ingredient supplier revenue. Sensory modifiers such as heating and cooling agents, humectants, pH buffering agents, depilatory actives, emulsifiers, preservatives, surfactants, colorants and fragrances are excluded.
Base Year Value
$6.4B in 2025 (MMA Primary Research Dataset, September 2026)
Forecast Period
2026 to 2036, eleven discrete annual values
CAGR
6.8% base case. Bull 8.1%. Bear 5.6%.
Fastest Growth Segment
Barrier Repair And Lipid Actives: 10.2% CAGR
Fastest Growth Country
China: 9.6% CAGR
Fastest Growth Region
South Asia and Pacific: 8.7% CAGR
Largest Region
East Asia: 34% of 2025 global value
Market Leaders
BASF, Croda International, Givaudan, DSM-Firmenich, Ashland. Source: MMA Primary Research Dataset, July 2026.
Primary Survey
n=3,800 procurement and R&D decision-makers, Q4 2025, six countries
Methodology
Demand-side build-up, cross-validated against public data, 47 expert interviews

Functional Cosmetic Ingredients Market Forecast Scenarios

functional-cosmetic-ingredients-market-size-forecast-scenario-1790021379435
Growth of 5.8% between 2020 and 2025 came from two sources pulling in different directions. Skincare volume expanded sharply through the pandemic years as consumers shifted spend from colour cosmetics toward treatment products, which favoured actives heavily. Against that, European restriction cycles forced repeated reformulation, removing established molecules that had sold reliably for a decade.
Three mechanisms carry the base case forward. Barrier repair claims continue expanding at 10.2% because the language has entered ordinary consumer vocabulary and dermatologist recommendation reinforces it. Chinese new ingredient filings under the cosmetic supervision regime keep rising, and China grows at 9.6%, the fastest national market covered. Active inclusion rates are drifting upward as brands compete on concentration disclosure, which lifts supplier revenue per finished unit independently of any volume growth.
The bull case is claim substantiation becoming a purchasing requirement. If brands begin demanding finished formula efficacy data rather than accepting vehicle studies, suppliers who already generate it take share quickly and price rises with the evidence. The bear case is European restriction acceleration. A faster cycle would force reformulation before suppliers can develop compliant alternatives, and revenue ends the moment a molecule leaves the list.

Evidence That Stops At The Vehicle

Two gaps sit between what a supplier demonstrates and what a consumer receives, and the industry has learned to work around both. The first is concentration: dossier studies typically run at several times the use level a finished formula can afford or tolerate. The second is vehicle: a simple aqueous or glycol base behaves nothing like an emulsion carrying forty other materials competing for the same skin.
TOP FIVE CONCENTRATION36%Combined revenue share held by the five largest suppliers
ACTIVE COST SHARE14%Actives as a proportion of finished formula ingredient cost
MEDIAN PANEL SIZE22 subjectsSubjects in a typical supplier efficacy claim study
FINISHED FORMULA TESTING11%Dossiers carrying efficacy data on the finished product
TYPICAL USE LEVEL0.8%Median inclusion rate of an active in finished product
DOSSIER DEVELOPMENT COSTUSD 340,000Cost of building a full claim substantiation package
Roughly 11% of supplier dossiers include any efficacy data generated on a finished formula rather than a test vehicle. Median panel size across claim studies sits near 22 subjects, which is adequate for a directional signal and inadequate for anything a regulator would call proof. Brands accept this because the alternative is generating the data themselves at around USD 340,000 per active, and very few do.
Penetration is the third problem and it is discussed least. Most peptides above 500 daltons do not cross an intact stratum corneum in meaningful quantity, and supplier dossiers rarely address delivery at all. The actives that work best are frequently the small, well-characterised molecules that have been available for decades. Suppliers rarely volunteer the delivery question, and brands rarely think to ask it.
"This industry sells evidence generated on something the consumer will never apply, at a concentration the formula cannot carry, to a panel too small to prove anything. The suppliers who start testing the actual product will find they can charge for it."
Director, Specialty Chemicals and Personal Care Practice · MMA Chemicals and Materials Practice · September 2026

Market Trends

Barrier Repair Language Enters Ordinary Consumer Vocabulary

Skin barrier claims moved from dermatology practice into mainstream consumer conversation over roughly five years, and the vocabulary arrived intact rather than diluted. Consumers now ask for ceramides by name, which almost never happens with cosmetic actives. Barrier repair and lipid actives grow at 10.2% against a category rate of 6.8% as a direct result. The commercial advantage sits with suppliers holding characterised ceramide, cholesterol and fatty acid complexes at defined ratios, since the claim depends on the ratio rather than on any single component being present. Single-component ceramide offers are already losing specification positions to complexes.
Market Impact: Filings grew 4 years running

Concentration Disclosure Becomes A Brand Competitive Weapon

Brands increasingly print active percentages on front of pack, a practice that began with vitamin C and niacinamide and has spread across most claim classes. That competition pushes inclusion rates upward, since a brand claiming 10% cannot easily sit beside a competitor claiming 15%. Supplier revenue per finished unit rises without any volume growth at all. The trend also exposes suppliers whose dossier concentrations sit far above what brands actually use, because the comparison is now visible to anyone reading two labels side by side. Suppliers who set dossier concentrations honestly now have an argument they never previously had.
Market Impact: Named on 62% of launches

Market Opportunities and Growth Drivers

Chinese Registration Regime Opens Domestic Innovation Channel

China's cosmetic supervision and administration regulations created a formal pathway for registering new cosmetic ingredients, replacing a system that had effectively frozen novel actives out of the market for years. Filings have risen steadily since, with domestic and international suppliers both using the route. China grows at 9.6%, the fastest national market covered here, and the growth is in registered novel actives rather than in commodity materials. Suppliers who invested early in the filing process hold a lead that competitors need several years to close. Registered materials also command meaningful premiums, since formulators cannot substitute freely.
Market Impact: Only 11% test finished formulas

Dermatologist Recommendation Reshapes Which Actives Sell

Clinical recommendation now reaches consumers directly through professional social media rather than only through the consultation room, and it favours a narrow set of well-characterised molecules: retinoids, niacinamide, azelaic acid, defined ceramide complexes. That reshapes demand away from proprietary botanical actives toward materials with published peer-reviewed literature behind them. Suppliers of characterised, literature-backed molecules gain pricing they had lost to novelty competition. Roughly 62% of new premium skincare launches now name at least one such active on front of pack. Proprietary botanical actives without published literature are losing specification positions, and price concessions have not slowed it.
Market Impact: Transition periods run 24 months

Market Restraints and Challenges

Supplier Dossiers Rarely Test The Finished Formula

Around 11% of claim dossiers include efficacy data generated on a finished formula rather than a test vehicle, and median panel size sits near 22 subjects. The root cause is cost allocation: a full substantiation package runs near USD 340,000 per active, and suppliers cannot recover that across customers who each use the material differently. The commercial impact falls on brands, who inherit claims they cannot defend if challenged. Several suppliers now offer co-funded finished formula studies with lead customers, which splits the cost and gives both parties defensible evidence.
Market Impact: Grows 3.4 points above category

European Restriction Cycles Destroy Established Revenue Lines

Successive Omnibus Acts under the European cosmetic regulation have restricted retinol concentration, narrowed kojic acid permissions and removed several UV filters from the permitted list. The root cause is precautionary risk assessment applied to endocrine and systemic exposure concerns, which is legitimate and unpredictable in its timing. Commercially, a supplier can lose a decade-old revenue line within a single transition period. Participants are responding by building compliant alternative chemistries ahead of opinions rather than after them, and by diversifying revenue away from single-molecule dependence. Diversifying away from single-molecule dependence is the other response, though it takes years.
Market Impact: Use levels rose 2 points
3 additional market trends, 4 additional growth drivers, and 2 additional restraints and challenges are covered in the full report. Contact sales@marketmindsadvisory.com to access the complete intelligence.

Segment CAGR and Growth Architecture

Segmentation follows claimed function, the dimension on which regulatory treatment, substantiation requirement and brand purchasing all divide together. Six functional classes are assessed at supplier revenue. Sensory modifiers, humectants, buffering agents, emulsifiers, preservatives, surfactants, colorants and fragrances sit outside the defined scope of this report entirely. Adjacent functional categories are treated separately in MMA coverage.
functional-cosmetic-ingredients-market-market-share-analysis-1790021379973

Barrier Repair And Lipid Actives

Barrier repair and lipid actives grow at 10.2%, half again the market rate of 6.8%, and the reason is linguistic as much as technical. Consumers now ask for ceramides by name, which happens with almost no other cosmetic active, and dermatologist recommendation reaching them through professional social media reinforces the vocabulary continuously. The commercial advantage sits with suppliers holding characterised ceramide, cholesterol and free fatty acid complexes at defined ratios, because the barrier claim depends on the ratio between them rather than on any single component appearing in a list. Penetration is also less problematic here than for peptides, since these lipids act at the outermost layer where they are already applied.
CAGR 10.2%

Anti-Acne And Sebum Regulating Actives

Anti-acne and sebum regulating actives grow at 8.3%, driven by adult acne demand that the category historically treated as an adolescent concern and priced accordingly. Azelaic acid, salicylic acid derivatives, niacinamide at higher inclusion and newer sebum-modulating peptides all sit here. The regulatory position is genuinely awkward, since the boundary between a cosmetic sebum claim and a drug acne claim differs by jurisdiction and suppliers must document accordingly for each market they serve. Well-characterised molecules with published literature behind them are taking share from proprietary botanical alternatives, because dermatologist recommendation favours what has been studied properly and consumers now follow it. Adult acne demand is also less seasonal and less price-sensitive than the adolescent market this category was built around.
CAGR 8.3%
Full segment breakdown across 6 segments available in the complete report.

Regional Architecture and Country Demand Map

Regional shares measure where actives are purchased by formulators rather than where finished cosmetics are consumed, so contract manufacturing concentration shifts demand toward production regions. East Asia sits above the standard band for reasons the paragraph below sets out. Six regions sit inside their standard bands.

East Asia

The 34% position sits above the standard band because Korean and Japanese formulators set the active agenda that the rest of the industry follows, and because Chinese contract manufacturing concentrates purchasing here regardless of where product is eventually sold. Korean formulation houses commercialise new claim classes years before Western brands adopt them, and barrier repair reached consumers there well ahead of anywhere else. China's registration pathway for novel cosmetic ingredients has drawn filings from domestic and international suppliers alike since it opened. Japanese demand skews toward brightening actives, reflecting a claim priority that has been stable for decades. Growth runs at 7.9%. Korean formulation houses in particular export claim vocabulary alongside product.
Share: 34% | CAGR: 7.9% (2026 to 2036)

North America

At 24% this region sits comfortably inside the standard band and behaves differently from East Asia in one important way: purchasing is concentrated among fewer, larger brand owners with internal regulatory capability. Those buyers interrogate dossiers more closely and are more likely to commission finished formula testing, which advantages suppliers who can support it. Drug and cosmetic boundary questions around acne and sun protection claims are handled through a different regulatory route than in Europe, which shapes which actives are commercially viable. Growth of 6.2% reflects a mature market where premium claim classes rather than volume drive value. Barrier repair and anti-acne classes grow fastest here, both driven by clinical recommendation reaching consumers directly.
Share: 24% | CAGR: 6.2% (2026 to 2036)
Regional intelligence for 5 additional markets available in the complete report: Western Europe, South Asia and Pacific, Latin America, Middle East and Africa, Eastern Europe. Contact sales@marketmindsadvisory.com.
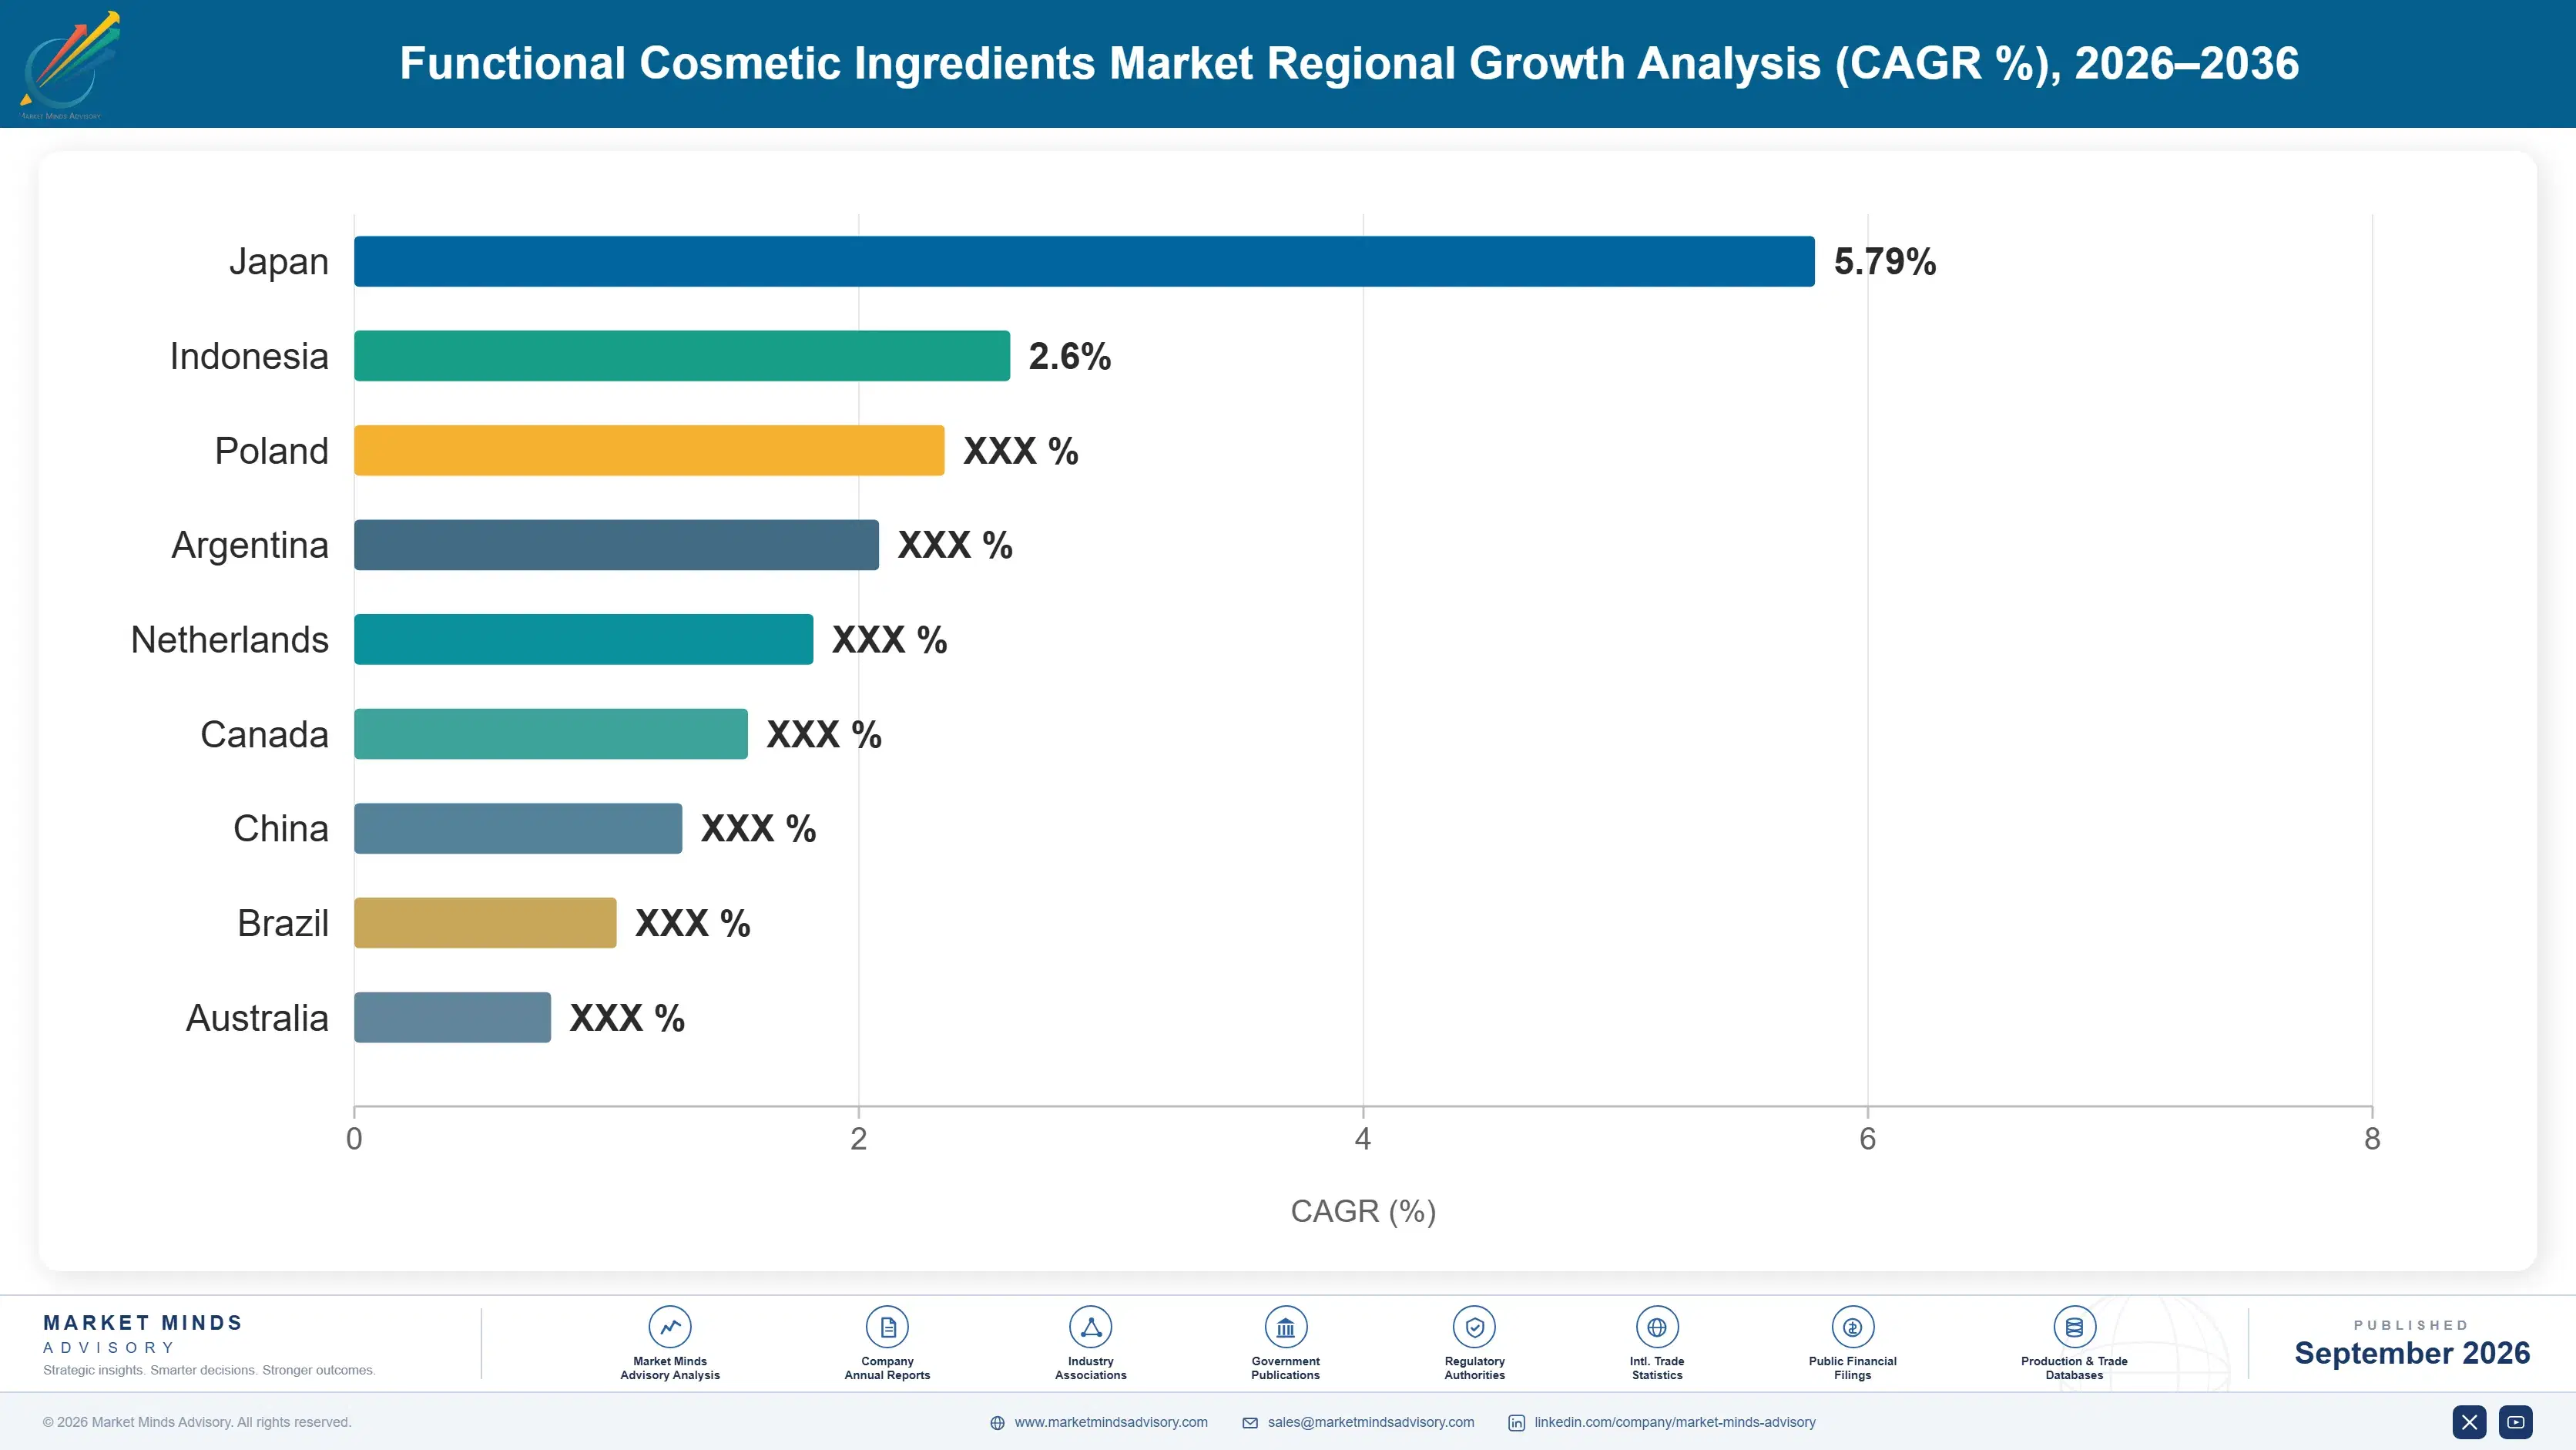
functional-cosmetic-ingredients-market-country-cagr-analysis-1790021380501

Turning Evidence Into Real Price

Each of these four addresses the same underlying weakness: suppliers sell evidence that does not match what their customers actually manufacture, then compete on price because nothing else distinguishes them. All four have been executed by participants in this market already, and none requires new synthesis capability or capital investment in production. Each works on evidence rather than on chemistry.

Generate Efficacy Data On Finished Formula Prototypes

Only about 11% of dossiers carry efficacy data on a finished formula rather than a test vehicle, which leaves brands inheriting claims they cannot defend if challenged. Suppliers who test representative finished prototypes at realistic use levels report price realisation around 1.7 times comparable vehicle-only dossiers. The cost sits near USD 340,000 for a full package, which becomes tolerable when split with a lead customer who gains defensible evidence in return. Very few competitors currently offer this, which makes the position available to whoever commits to it first. The evidence also survives challenge.
Market Impact: Lifts realised price to roughly 1.7 times higher

Build Compliant Alternatives Ahead Of Committee Opinions

European restriction cycles remove established molecules with roughly 24 month transition periods, and suppliers who begin developing alternatives only after an opinion publishes lose most of that window. Monitoring committee agendas and preparing compliant chemistry in advance converts a revenue loss into a switching opportunity, since customers reformulating will choose whoever has a validated replacement ready. Participants working this way report retaining around 78% of affected revenue against roughly 30% for those reacting late. The monitoring cost is trivial against what a single restricted molecule represents. Committee agendas are published and freely available to anyone who reads them.
Market Impact: Retains roughly 78% of revenue from restricted molecules

Support Concentration Claims With Delivery Evidence

Brands now print active percentages on front of pack, which pushes inclusion rates upward and exposes the delivery question directly. Most peptides above 500 daltons do not cross an intact stratum corneum in useful quantity, and dossiers rarely address it. Suppliers providing penetration data alongside efficacy data command roughly 1.5 times the price of equivalent actives without it, because the brand can then defend the concentration it advertises. The testing is well established and considerably cheaper than efficacy work, and almost nobody supplies it as standard. The brand printing a number on front of pack needs to defend it.
Market Impact: Commands roughly 1.5 times the pricing of comparable actives

File Early Under The Chinese Registration Pathway

China's novel cosmetic ingredient registration route opened a market that had been effectively closed to new actives for years, and China now grows at 9.6%. Filing takes time and documentation rather than money, and suppliers who began early hold registered positions that competitors need several years to match. Registered actives command premiums of 20 to 30% over unregistered equivalents in that market because formulators cannot substitute freely. The obstacle is administrative patience rather than technical capability, which is why so few Western suppliers have committed. Filing takes documentation and time rather than capital investment.
Market Impact: Commands a price premium of 20 to 30%

Who Controls the Margin Pool

Concentration is moderate at 36% held by the top five, measured consistently on cosmetic active ingredient revenue rather than on tonnage. The leader to challenger gap is wide in regulatory affairs capability, where maintaining dossiers across European, Chinese, American and Japanese requirements demands sustained investment, and narrow in synthesis itself, where contract manufacturers can produce most molecules competently.
Competition runs on three dimensions currently. Claim substantiation depth decides which suppliers premium brands will work with, and it separates the field more than any technical attribute. Regulatory coverage decides which markets a customer can sell into without reformulating. Price decides the commodity actives that have been off patent for decades, and that segment is genuinely difficult for anyone carrying a research organisation to defend.

Pressure is building around finished formula evidence, and that is where rankings will move. Brands with internal regulatory capability are beginning to ask for it, and the suppliers who can produce it are winning specification positions ahead of competitors with longer catalogues. Participants dependent on a small number of established molecules also face European restriction exposure that could remove a revenue line inside a single transition period.
functional-cosmetic-ingredients-market-company-positioning-matrix-1790021381024

Competitive Moat and Risk Dimensions

BASF

Moat: Regulatory Affairs At Scale

Maintaining active dossiers across European, Chinese, American and Japanese requirements simultaneously demands a regulatory organisation that smaller suppliers cannot fund, and BASF operates one at a scale few competitors approach. That capability lets customers formulate once and sell globally, which is worth considerably more to a large brand owner than any individual ingredient performance advantage.
BASF

Risk: Breadth Dilutes Claim Depth

A very broad catalogue makes it difficult to fund finished formula substantiation across the range, and specialist competitors with narrow portfolios can invest deeply behind a handful of molecules. As brands begin demanding evidence generated on real products rather than vehicles, catalogue breadth becomes less persuasive than depth on the specific actives a formulator wants.
CRODA INTERNATIONAL

Moat: Active Science And Formulation Support

Sederma and the wider active portfolio carry genuine peptide and biotechnology capability alongside formulation laboratories that work directly with customer development teams. That combination places Croda inside the formulation process rather than beside it, which produces specification positions that survive procurement pressure far better than supply relationships built on price.
CRODA INTERNATIONAL

Risk: European Restriction Concentration

Revenue concentration in European-developed actives sold heavily into European markets leaves the business exposed to the Omnibus restriction cycle in a way more geographically balanced competitors are not. Each restriction forces customer reformulation and opens the specification to challengers who have compliant alternatives already validated and ready to supply.

Players Tracked

Prominent Players

BASF
Croda International
Givaudan
DSM-Firmenich
Ashland

Other Key Players

Clariant
Evonik Industries
Lubrizol
Symrise
Seppic
Solabia Group
Mibelle Biochemistry
Silab
Provital
Greentech
CoDIF
Kobo Products
Nikkol Group
Bloomage Biotechnology
Lipoid Kosmetik

Recent Developments

APRIL 2025

Croda expands Sederma peptide production capacity in France

The company added synthesis and purification capacity at its French active ingredient site serving peptide and biotechnology actives. This was organic capital investment funded internally, with no joint venture, acquisition or external capacity partner involved in the project. Existing production at the site continued unaffected throughout the work.
Signal: Peptide demand is expected to grow despite persistent unresolved questions about skin penetration. Capacity went in ahead of resolved science.
NOVEMBER 2024

BASF introduces characterised ceramide barrier repair active range

The company launched a range of ceramide, cholesterol and fatty acid complexes supplied at defined ratios rather than as individual components. This was an internal product development introduction involving no partnership or licensing arrangement. The range is sold as a system rather than as separate materials.
Signal: Suppliers are selling the ratio between barrier lipids rather than the individual materials themselves. The ratio is now the product.
JUNE 2025

DSM-Firmenich reformulates filter portfolio ahead of European restrictions

The company revised several photoprotection formulations in anticipation of forthcoming European permitted list changes rather than waiting for transition periods to begin. No external party was involved at any stage. Customers were offered validated replacements before any transition period opened, and existing filter supply continued in parallel.
Signal: Preparing compliant chemistry before an opinion publishes is becoming a competitive practice rather than caution. Anticipation now beats reaction commercially.

What Actives Actually Cost To Make

Cost structure varies more here than across almost any specialty chemical category. Protected amino acids and coupling reagents dominate peptide actives at roughly 46% of production cost, sourced from a small group of Chinese, Japanese and European suppliers. Fermentation-derived actives are energy and feedstock led, with utilities running near 28%. Botanical extract actives carry raw material exposure that moves with agricultural cycles entirely unrelated to chemical markets.
European energy in 2022 demonstrated how sharply fermentation and distillation economics can move. Industrial gas and electricity prices across the continent rose several times over within a single year, and IEA reporting for that period documents the scale of the move across European industrial consumers generally. BASF annual reports for 2022 identify European energy cost as requiring production adjustments at Ludwigshafen, affecting several fermentation-derived product lines.

Exposure varies by chemistry and by production location, and it decides who can hold contract pricing. Peptide suppliers carry reagent exposure concentrated in a narrow supplier base with limited substitution. Fermentation producers in Europe carry energy exposure that competitors producing in China or North America largely avoid. Botanical extract suppliers face harvest variability that no contract fully removes, since a poor season affects every buyer at once.
functional-cosmetic-ingredients-market-cost-volatility-analysis-1790021381221

Dual-source protected amino acids across supplier regions

Peptide production depends on a narrow reagent supplier base concentrated in a few countries, and substitution requires requalification that takes months. Qualifying a second regional source ahead of disruption costs a development cycle and removes a single point of failure. Most suppliers begin the process only after an allocation problem has already interrupted production.

Site fermentation capacity outside high-cost energy regions

Fermentation-derived actives carry utility exposure near 28% of production cost, which makes production location a strategic rather than logistical decision. European sites carried a substantial disadvantage through the 2022 energy period that competitors elsewhere simply did not face. New capacity decisions now weigh energy cost more heavily than proximity to formulation customers. Proximity to customers matters less than it did.

Contract botanical raw material across multiple harvest geographies

Botanical actives depend on agricultural supply that varies by season and region, and a poor harvest affects every buyer of that material at once. Contracting across two or more growing geographies with offset seasons removes most of that correlation. The premium is modest and the alternative is explaining a supply failure to a customer mid-launch.

Portfolio Architecture for Margin Defence

Margin architecture divides by evidence and by patent position rather than by chemistry complexity, which is not what a production cost model would suggest. Off-patent commodity actives, including established acids and long-available vitamin derivatives, run at gross margins in the low to mid twenties. Anyone can make them competently, brands buy on price, and no amount of formulation support changes that arithmetic. Regulatory overhead still has to be carried on them.
Proprietary actives carrying claim substantiation and patent protection hold gross margins in the high forties to high fifties. The spread within that band reflects evidence depth almost entirely: an active with finished formula efficacy data and penetration evidence prices well above one supported only by a vehicle study on 22 subjects. Production cost explains very little of the difference between the two.

The highest-value pools sit where evidence meets regulatory position. Actives registered under the Chinese pathway command 20 to 30% premiums because formulators cannot substitute freely, and compliant replacements for restricted European molecules earn similarly while customers reformulate under time pressure. Commodity actives keep the plant running. They do not fund the research organisation that produces everything else.

Volume / Commodity-Adjacent

Off-patent acids, vitamin derivatives and established actives available from many producers. Brands buy these on price against published specification, and formulation support does not change the purchasing conversation at any volume.
Gross Margin: 22 to 30%

Premium / Certified

Proprietary actives with patent protection and claim substantiation packages. The ten-point range reflects evidence depth rather than chemistry, since finished formula data and penetration evidence price far above vehicle-only studies.
Gross Margin: 48 to 58%

Sustainability / Regulatory / Next-Generation

Actives registered under the Chinese novel ingredient pathway and validated compliant replacements for restricted European molecules. Formulators cannot substitute freely in either case, which is what holds pricing at this level.
Gross Margin: 62 to 70%
functional-cosmetic-ingredients-market-portfolio-architecture-1790021381728

High-value Sub-segments and Strategic Watch-out

Characterised Barrier Lipid Complexes

High value and high growth at 10.2%. Consumers ask for ceramides by name, which happens with almost no other active class, and the claim depends on the ratio between components rather than on any single one being present. Single-component offers are losing positions to characterised complexes.
Gross Margin: 52 to 58%

Chinese Registered Novel Actives

High value and moderate growth. Registration commands premiums of 20 to 30% because formulators cannot substitute freely, and the barrier is administrative patience rather than technical capability. Very few Western suppliers have committed to the pathway. The filing route has been open for several years now.
Gross Margin: 64 to 70%

Off-Patent Commodity Actives

Volume core, competing entirely on price against many competent producers. It funds plant utilisation and regulatory overhead without contributing meaningfully to the research organisation that generates the rest of the portfolio. Formulation support does not change the purchasing conversation at any volume here, and price concessions simply move margin.
Gross Margin: 22 to 28%

Vehicle-Only Substantiated Peptides

Strategic watch-out. The twelve-point range reflects how sharply pricing splits as brands begin demanding finished formula evidence. Penetration questions above 500 daltons remain largely unaddressed in supplier dossiers across the whole class. The split between suppliers generating finished formula data and those not is already visible.
Gross Margin: 40 to 52%

How Specification Positions Persist

Revenue in this market is specification-anchored rather than order-anchored, which makes it stickier than the transaction volumes suggest. Once an active is written into a finished formula, changing it means reformulation, stability testing, safety assessment and often new claim substantiation, all of which cost more than any price concession a competitor could offer. Specification positions therefore persist for years and end for regulatory reasons far more often than commercial ones.
Stickiness varies sharply by customer type. Large brand owners with internal regulatory capability hold specifications longest, because their reformulation cost is highest and their approval processes slowest. Contract manufacturers serving private label switch far more readily, since their customers specify performance rather than materials. Indie brands are the least sticky of all, reformulating frequently as they chase claim trends and change contract manufacturers.

Buyer profiles have shifted in one direction since 2020. Formulation and regulatory teams at brand owners have gained influence over material selection at the expense of marketing, largely because restriction cycles made regulatory risk a board-level concern. That group evaluates dossiers rather than presentations, asks about panel size and vehicle, and increasingly wants finished formula data before committing a specification.
functional-cosmetic-ingredients-market-end-use-penetration-index-1790021382222

Where Suppliers Can Earn More

These are among the four positions where our research anticipates prominent divergence between winners and laggards over the coming forecast period. Each is grounded in the demand model, the regulatory perimeter, and the announced capacity pipeline.
01 / FINISHED FORMULA SUBSTANTIATION

Test the product a consumer will actually apply

Roughly 11% of supplier dossiers include efficacy data generated on a finished formula rather than a test vehicle, and median panel size sits near 22 subjects across the category. Brands inherit claims they cannot defend, and few will spend the USD 340,000 a package costs. Suppliers testing representative prototypes at realistic use levels report price realisation around 1.7 times comparable vehicle-only dossiers, and almost no competitor currently offers it, and the cost becomes tolerable once it is split with a lead customer who gains the same evidence.
02 / REGULATORY ANTICIPATION CAPABILITY

Prepare compliant chemistry before the opinion publishes

European restriction cycles remove established molecules with roughly 24 month transition periods, and suppliers who begin developing alternatives after publication lose most of that window to their competitors. Monitoring committee agendas converts a revenue loss into a switching opportunity, since reformulating customers choose whoever has a validated replacement ready to ship. Participants working this way retain around 78% of affected revenue against roughly 30% for those who react only once an opinion appears, and the committee agendas that make this possible are published and freely available to anyone.
03 / DELIVERY EVIDENCE PROVISION

Answer the penetration question nobody currently addresses

Most peptides above 500 daltons do not cross an intact stratum corneum in useful quantity, and supplier dossiers rarely address delivery at all despite brands now printing concentrations on front of pack. Penetration testing is well established and considerably cheaper than efficacy work. Suppliers providing it alongside efficacy data command roughly 1.5 times the price of equivalent actives without it, because the brand can then defend the number it advertises to consumers, and no competitor benchmarked in this market currently supplies penetration evidence as standard.
04 / CHINESE REGISTRATION FILING

File early into the market growing fastest

China's novel cosmetic ingredient pathway reopened a market that had been effectively closed to new actives, and China now grows at 9.6%, faster than any other national market covered here. Registered actives command premiums of 20 to 30% because formulators cannot substitute freely once a product is built around them. The barrier is administrative patience rather than technical capability, which explains why remarkably few Western suppliers have committed to the process, and the filing route has now been open long enough that late entrants face a real disadvantage.

Engagement Snapshot From the Field

A live engagement with an industry participant carrying material or product regulatory and market exposure ahead of a defining policy shift, showing how our research translates into a defensible multi-year portfolio strategy.
MARKET MINDS ADVISORY · CLIENT ENGAGEMENT SUMMARY
Functional Cosmetic Ingredients Producer Strategic Portfolio Review and Transition Roadmap 2026·Investment Scenario on Functional Cosmetic Ingredients Exposure Evaluation 2025-26
CLIENT PROFILE
A European specialty supplier of peptide and biotechnology-derived cosmetic actives with revenue near USD 210 million (client-reported, unverified by MMA), selling into premium skincare brands across Europe, North America and Japan. The portfolio ran to 34 actives, with roughly 60% of revenue concentrated in six of them. No Chinese registrations had been filed, and no finished formula testing existed anywhere in the dossier library.
STRATEGIC CHALLENGE
Two of the six core revenue actives faced European restriction review, and the commercial team had no view on timing or on what would replace them. Price pressure was increasing from Asian competitors offering similar molecules considerably cheaper. Management believed the answer was cost reduction, and had commissioned a manufacturing efficiency programme accordingly.
MMA APPROACH
MMA audited all 34 dossiers against panel size, vehicle, concentration and finished formula testing, and benchmarked them against eight competitors. Committee agendas and published opinions were mapped to build a restriction timeline for the portfolio. Twenty-three formulation and regulatory managers at customer brands were interviewed about what evidence actually influences a specification decision.
KEY FINDINGS
  1. None of the 34 dossiers contained finished formula efficacy data, and median panel size across the library was 19 subjects, below the category norm of around 22.
  2. Customer regulatory managers ranked finished formula evidence as the single most influential factor in specification decisions, well ahead of price or supplier relationship.
  3. Restriction review timelines indicated roughly 26 months before the two exposed actives would face permitted list changes, with no replacement chemistry in development.
  4. No competitor benchmarked offered penetration data alongside efficacy claims, leaving the position entirely unoccupied across the peptide category in every market examined.
CLIENT PROFILE
A European specialty supplier of peptide and biotechnology-derived cosmetic actives with revenue near USD 210 million (client-reported, unverified by MMA), selling into premium skincare brands across Europe, North America and Japan. The portfolio ran to 34 actives, with roughly 60% of revenue concentrated in six of them. No Chinese registrations had been filed, and no finished formula testing existed anywhere in the dossier library.
STRATEGIC CHALLENGE
Two of the six core revenue actives faced European restriction review, and the commercial team had no view on timing or on what would replace them. Price pressure was increasing from Asian competitors offering similar molecules considerably cheaper. Management believed the answer was cost reduction, and had commissioned a manufacturing efficiency programme accordingly.
MMA APPROACH
MMA audited all 34 dossiers against panel size, vehicle, concentration and finished formula testing, and benchmarked them against eight competitors. Committee agendas and published opinions were mapped to build a restriction timeline for the portfolio. Twenty-three formulation and regulatory managers at customer brands were interviewed about what evidence actually influences a specification decision.
KEY FINDINGS
  1. None of the 34 dossiers contained finished formula efficacy data, and median panel size across the library was 19 subjects, below the category norm of around 22.
  2. Customer regulatory managers ranked finished formula evidence as the single most influential factor in specification decisions, well ahead of price or supplier relationship.
  3. Restriction review timelines indicated roughly 26 months before the two exposed actives would face permitted list changes, with no replacement chemistry in development.
  4. No competitor benchmarked offered penetration data alongside efficacy claims, leaving the position entirely unoccupied across the peptide category in every market examined.
RECOMMENDED STRATEGY
Phase 1: Phase one: co-fund finished formula efficacy studies with three lead customers on the highest revenue actives, splitting cost and sharing defensible evidence. Phase 2: Phase two: begin compliant replacement chemistry for both exposed actives immediately, targeting validation before the transition period opens. Both molecules face review within two years. Phase 3: Phase three: file the six core revenue actives under the Chinese novel ingredient pathway and add penetration data across the peptide range.
OUTCOME
Realised pricing on the three actives carrying finished formula data rose by roughly 22% within two quarters (client-reported, unverified by MMA), with two specification wins taken directly from a lower-priced competitor. The manufacturing efficiency programme was scaled back once the evidence gap was identified as the real commercial problem.

Frequently Asked Questions

Foundational context covering the market sizes, CAGR, scope, country, region and competition that inform every finding below. This section is provided to cover basics and most often pre-purchase conversations, answered from the MMA Primary Research Dataset.

What is the current size of the Functional Cosmetic Ingredients Market?

The market was valued at USD 6.4 billion in 2025, rising to USD 6.8 billion in 2026. Sizing is at ingredient supplier revenue across six functional claim classes.

How large will the Functional Cosmetic Ingredients Market be by 2036?

MMA forecasts USD 13.1 billion by 2036, an increase of USD 6.3 billion over the 2026 base. That represents expansion of 1.93 times across the forecast period.

What is the CAGR for the Functional Cosmetic Ingredients Market 2026 to 2036?

The base case CAGR is 6.8%, with a bull case of 8.1% and a bear case of 5.6%. Historical growth between 2020 and 2025 ran at 5.8%.

Which segment is growing fastest?

Barrier repair and lipid actives grow at 10.2%, half again the market rate, because consumers now ask for ceramides by name. Anti-acne and sebum regulating actives follow at 8.3%.

Who are the major companies in the Functional Cosmetic Ingredients Market?

BASF, Croda International, Givaudan, DSM-Firmenich and Ashland lead on active ingredient revenue, holding a combined 36%. Specialist suppliers including Silab and Mibelle Biochemistry compete on evidence depth rather than catalogue breadth.

Which country is growing fastest?

China grows fastest at 9.6%, driven by a registration pathway for novel cosmetic ingredients that reopened a market previously closed to new actives. Registered materials command meaningful price premiums there.

Report Segmentation Architecture

The full report scope spans multiple orthogonal segmentation dimensions, with cross-tabulated demand data provided for each dimension pair. Coverage extends further to regional breakdowns, trend trajectories, and the competitive detail needed to support segment-level decision-making.

By Functional Class

  • Anti-Ageing and Peptide Actives
  • Brightening and Pigmentation Actives
  • UV Filters and Photoprotection Actives
  • Barrier Repair and Lipid Actives
  • Anti-Acne and Sebum Regulating Actives
  • Soothing and Anti-Irritation Actives

By End-Use Industry

  • Premium Facial Skincare
  • Mass Facial Skincare
  • Sun Care
  • Hair and Scalp Treatment
  • Body Care
  • Professional and Clinic Channels

By Customer Type

  • Global Brand Owners
  • Regional Brand Owners
  • Contract Manufacturers
  • Private Label Producers
  • Indie and Direct-to-Consumer Brands
  • Ingredient Distributors

By Region

  • East Asia
  • North America
  • Western Europe
  • South Asia and Pacific
  • Latin America
  • Middle East and Africa
  • Eastern Europe

Scope, Methodology, and Coverage

Every figure in this report is reproducible from documented input assumptions. The scope below maps the historical period, the forecast horizon, the segmentation dimensions, and the countries covered, alongside the underlying primary and qualitative methodology.
Historical Period
2020 to 2025
Forecast Period
2026 to 2036
Base Year
2025 (USD billions; MMA Primary Research Dataset, September 2026)
Market Definition
This market covers ingredients supplied to cosmetic and personal care manufacturers that carry a claimed biological or performance function on skin or hair, spanning anti-ageing and peptide actives, brightening and pigmentation actives, UV filters and photoprotection actives, barrier repair lipids, anti-acne and sebum regulating actives, and soothing actives. Sizing is at ingredient supplier revenue. Sensory modifiers including heating and cooling agents, humectants, pH buffering agents, depilatory actives, emulsifiers, preservatives, surfactants, colorants and fragrances are excluded throughout.
Quantitative Units
USD billions at supplier revenue; inclusion rates as percentage of finished formula; panel sizes as subject counts.
Segmentation Dimensions
Functional claim class, end-use industry, customer type, and geographic region.
Regions Covered
East Asia, North America, Western Europe, South Asia and Pacific, Latin America, Middle East and Africa, Eastern Europe
Countries Covered
China, United States, France, South Korea, Japan, India
Key Companies Profiled
BASF, Croda International, Givaudan, DSM-Firmenich, Ashland, Clariant, Evonik Industries, Lubrizol, Symrise, Seppic, Solabia Group, Mibelle Biochemistry, Silab, Provital, Greentech, CoDIF, Kobo Products, Nikkol Group, Bloomage Biotechnology, Lipoid Kosmetik
Quantitative Methodology
Primary survey, n=3,800 respondents, Q4 2025, six countries; demand-side model with trade association cross-validation
Qualitative Methodology
47 expert interviews, Q4 2025; applied to validate demand model assumptions, identify emerging dynamics, and assess competitive positioning
Report Format
PDF and XLSX data workbook (Word format preview document)
Publisher
Market Minds Advisory
Report Code
MMA-2026-CHM-766
Published
September 2026
Contact
sales@marketmindsadvisory.com | www.marketmindsadvisory.com

Purchase the full Functional Cosmetic Ingredients Market Report (2026 to 2036).

The full report sizes the functional cosmetic ingredients market across six functional claim classes, six end-use industries and six customer types for all seven global regions. It includes a claim substantiation audit covering supplier dossiers benchmarked on panel size, vehicle, concentration and finished formula testing. European restriction timelines are mapped against affected molecules and their transition periods. Chinese novel ingredient registration positions are tracked supplier by supplier. Production cost is decomposed separately for peptide, fermentation and botanical chemistries, and competitive assessment covers 20 suppliers on a consistent active revenue basis.
Claim substantiation audited across supplier dossier libraries
European restriction timelines mapped to affected molecules
Chinese registration positions tracked supplier by supplier
Production cost decomposed by chemistry route
Six functional classes sized through 2036
Twenty suppliers assessed on active ingredient revenue

Built For The People Who Decide

From boardroom strategy to bench-side execution, this report is read cover-to-cover by leaders shaping the next decade of their industry, turning demand scenarios, market dynamics and valuation benchmarks into decisions.
CXOs/ Presidents/ VPs/ Managers
M&A and Corporate Development
Strategy Teams and R&D Heads
Procurement and Product Directors
Regulatory and Compliance Leaders
Investor Relations and Equity Analysts