Market Minds Advisory
Fuel Management Software Market

Fuel Management Software Market: Fuel Management Software Market. Sustainability Reporting Mandates Reshape Fleet Fuel Analytics Investment

Corporate sustainability disclosure mandates are pushing fleet operators toward automated emissions reporting software faster than fuel cost pressure ever did, forcing telematics vendors to bundle carbon accounting directly into fuel monitoring platforms.

Lead Analyst

Published

September 2026

Make Smarter Decisions with Customized Research Insights

Request a free sample report and evaluate market opportunities, growth trends, and competitive dynamics relevant to your business needs.

2025 MARKET VALUE$2.1BMarket Size 2025
2036 FORECAST VALUE$6.2BBase Case , 2026 to 2036
CAGR 2026 TO 203610.4 %Bull 11.6% / Bear 9.2%
INCREMENTAL OPPORTUNITY$3.9BNet 10- year value creation
EXPANSION MULTIPLE2.69x2036 value over 2026 base
Strategic Levers
M&A Pipeline
Regional Outlook
Country Rankings
Competitive Intelligence
Segmental Deep-dive
Call-Us : 91 93563 13602

Executive Snapshot and Market Trajectory.

Sustainability reporting mandates are reshaping fuel management software investment faster than any prior fleet technology cycle, as corporate carbon disclosure requirements push emissions tracking directly into fuel monitoring platforms previously focused only on cost control and consumption efficiency across most fleet segments and industries.
Fleet operators face simultaneous pressure from mandatory emissions disclosure requirements, expanding mixed fleet complexity as electric vehicles enter previously combustion-only fleets, and rising competition from cloud-native analytics platforms that reduce reliance on standalone fuel card systems. India's expanding commercial vehicle fleet and government fuel efficiency mandates are pulling software adoption into domestic fleet operators faster than incumbents anticipated, while North American telematics vendors continue funding the highest-value emissions reporting development contracts across most fleet segments.
Competitive intensity concentrates among five vendors controlling roughly forty-four percent of global revenue, though specialized emissions reporting vendors are winning fleet contracts faster than fuel card incumbents expected just two years ago and continue gaining ground steadily across most fleet segments. Regulatory pressure around carbon disclosure accuracy adds validation cost that smaller vendors increasingly struggle to absorb without dedicated environmental compliance engineering teams and legal counsel.
Market Definition
The Fuel Management Software Market covers platforms that monitor, track, and optimize fuel consumption, transactions, and emissions across commercial fleets, industrial facilities, and marine and aviation operations. It excludes standalone hardware sensors and general fleet telematics platforms lacking dedicated fuel-specific monitoring and reporting capability.
Base Year Value
$2.1B in 2025 (MMA Primary Research Dataset, September 2026)
Forecast Period
2026 to 2036, eleven discrete annual values
CAGR
10.4% base case. Bull 11.6%. Bear 9.2%.
Fastest Growth Segment
Emissions and Sustainability Reporting Software: 14.5% CAGR
Fastest Growth Country
India: 13.2% CAGR
Fastest Growth Region
South Asia and Pacific: 12.4% CAGR
Largest Region
North America: 31% of 2025 global value
Market Leaders
Trimble, Verizon Connect, Samsara, WEX, and Vontier lead the field. Source: MMA Analysis, July 2026.
Primary Survey
n=3,800 procurement and R&D decision-makers, Q4 2025, six countries
Methodology
Demand-side build-up, cross-validated against public data, 47 expert interviews

Fuel Management Software Market Forecast Scenarios

fuel-management-software-market-size-forecast-scenario-1789980766897
The 2020 to 2025 period saw fuel management software demand track fleet digitalization trends closely, growing at a 9.4 percent compound annual rate as fuel price volatility pushed operators toward better consumption visibility and cost control. Corporate sustainability commitments announced during this period began pulling emissions reporting requirements into fleet software procurement decisions across multiple industries.
Base case forecasts assume continued mandatory emissions disclosure adoption expanding software requirements beyond pure cost control, rising mixed fleet complexity as electric vehicles enter combustion fleets, and growing cloud-native analytics adoption reducing standalone fuel card system reliance. These three mechanisms combine to sustain a 10.4 percent compound annual growth rate through 2036, with India and North America contributing the largest incremental volume gains as domestic fleet digitalization expands and sustainability reporting mandates tighten across most major markets.
A bull scenario reaching 11.6 percent growth depends on faster-than-expected mandatory emissions disclosure adoption across mid-market fleet operators not yet required to report formally under current regulatory thresholds. A bear scenario falling to 9.2 percent would likely follow delayed regulatory enforcement timelines reducing near-term urgency for fleet operators to invest in dedicated reporting software and analytics platforms.

Mixed Fleets Complicate Fuel Consumption Tracking

Fleet operators increasingly demand unified visibility across mixed electric and combustion vehicle fleets, pushing vendors to build consumption tracking that spans both fuel and energy types within a single reporting dashboard and interface across most fleet management systems and platforms.
MARKET CONCENTRATIONCR5 44%Top five vendors hold under half of global software revenue
AVERAGE CONTRACT VALUE$42KTypical mid-fleet annual subscription value varies by fleet size
TOP PRODUCING COUNTRYUnited States 26%Leading fleet software vendor headquarters concentration drives platform development
FUEL SAVINGS RATE12%Average measured fuel cost reduction after software deployment
EMISSIONS REPORTING ADOPTION38%Share of fleet operators required to submit formal carbon disclosure
DEVELOPMENT COST SHARE47%Software engineering and compliance development dominate ongoing vendor cost base
Mandatory carbon disclosure requirements increasingly extend beyond large corporations to mid-market fleet operators, forcing software vendors to build automated emissions calculation directly into fuel monitoring platforms rather than requiring separate manual reporting processes and spreadsheets today. This shift pressures fuel card and telematics vendors to add compliance-grade reporting capability rapidly or risk losing fleet contracts to specialized emissions software providers, favoring vendors with strong regulatory documentation expertise over vendors competing purely on transaction processing volume and throughput.
Cloud-native analytics platforms increasingly displace legacy on-premises fuel management software, since cloud deployment lets fleet operators access consumption data across geographically distributed vehicles without maintaining dedicated local server infrastructure and IT staff and dedicated support teams. Vendors increasingly offer real-time consumption dashboards accessible from mobile devices, letting fleet managers respond to fuel anomalies and theft indicators immediately rather than discovering discrepancies during periodic manual reconciliation reviews and audits.
"Fuel management software used to be about saving money on diesel, now it is about proving compliance to regulators and investors. Vendors that treat those as separate problems will lose contracts."
Senior Analyst, Fleet Technology and Sustainability Reporting Practice · MMA Technology Practice · September 2026

Market Trends

Mandatory Carbon Disclosure Expands Software Requirements

Corporate carbon disclosure mandates increasingly require fleet operators to report Scope 1 emissions with detailed vehicle-level accuracy, pushing software vendors to build automated emissions calculation directly into fuel monitoring platforms rather than relying on manual spreadsheet-based reporting processes that regulators increasingly reject as insufficiently auditable. This shift requires vendors to invest heavily in emissions calculation methodology and audit certification rather than relying solely on cost-tracking features that satisfied customers in prior software generations focused purely on fuel expense management. Vendors that delay building audit-ready reporting capability risk losing fleet contracts to specialized emissions software providers already certified for regulatory compliance.
Market Impact: India adds 2 million vehicles
Mixed Fleet Complexity Requires Unified Analytics

Fleet operators increasingly integrate electric vehicles into previously combustion-only fleets, requiring fuel management software to unify consumption tracking across fundamentally different energy types within a single reporting dashboard rather than maintaining separate fuel and electricity tracking systems entirely. This transition mirrors broader fleet electrification trends already reshaping vehicle procurement decisions across most commercial fleet categories globally. Vendors that fail to offer credible mixed-fleet analytics increasingly lose design wins to newer entrants built natively for multi-energy-type tracking from inception, particularly among fleets pursuing electrification pilot programs during ongoing sustainability transition initiatives.
Market Impact: Cuts fuel theft losses 25 percent

Market Opportunities and Growth Drivers

India Expands Commercial Vehicle Fleet Investment

India's expanding logistics and e-commerce sector continues driving rapid commercial vehicle fleet growth, and government fuel efficiency mandates targeting commercial transport increasingly require fleet operators to demonstrate consumption tracking and reporting compliance across their vehicle fleets. This regulatory requirement pulls software investment directly into domestic Indian fleet operators, favoring vendors with established local support and language localization over global vendors serving India remotely through regional distribution partners lacking dedicated technical presence. Fleet operators modernizing legacy paper-based fuel tracking increasingly bundle software upgrades into broader digital transformation initiatives, accelerating adoption timelines considerably.
Market Impact: Extends deployment timelines by 6 months

Fuel Theft and Fraud Losses Drive Adoption

Fleet operators continue losing substantial revenue annually to fuel theft, unauthorized card usage, and fraudulent transactions that manual reconciliation processes catch only after the fact, well after financial losses have already occurred across affected vehicles and routes. This persistent fraud exposure pushes fleet operators toward real-time consumption monitoring software that flags anomalous fuel purchases immediately rather than discovering discrepancies during periodic manual audits conducted weeks or months after transactions occur. Vendors offering the most sophisticated fraud detection algorithms increasingly win fleet contracts over competitors providing only basic transaction logging capability.
Market Impact: Risks 15 percent reporting dispute rate

Market Restraints and Challenges

Integration Complexity Slows Legacy Fleet Deployment

Fleet operators running extensive legacy telematics and fuel card infrastructure face substantial integration complexity when deploying new fuel management software that must aggregate data across fundamentally incompatible legacy systems accumulated over many years. The root cause traces to inconsistent data formats and proprietary application programming interfaces across legacy telematics vendors that predate current industry data-sharing standards, requiring custom integration work that automated tools cannot fully replace. Vendors are increasingly offering middleware integration services and professional consulting engagements to help fleet operators bridge legacy and modern systems during multi-year technology migration periods.
Market Impact: Expands reporting scope 40 percent

Emissions Calculation Accuracy Disputes Undermine Trust

Fleet operators and regulators increasingly dispute emissions calculation methodology accuracy across different software vendors, since inconsistent calculation approaches produce meaningfully different reported figures for functionally similar fleet operations and vehicle types across comparable industries. The root cause lies in the absence of a single universally accepted emissions calculation standard across jurisdictions, leaving vendors to implement varying methodologies that regulators and auditors sometimes challenge during compliance review. Vendors are increasingly pursuing third-party certification and standardized methodology adoption to reduce dispute risk and strengthen customer confidence in reported emissions figures across audits.
Market Impact: Adds 30 percent mixed fleet coverage
3 additional market trends, 4 additional growth drivers, and 2 additional restraints and challenges are covered in the full report. Contact sales@marketmindsadvisory.com to access the complete intelligence.

Segment CAGR and Growth Architecture

The Fuel Management Software Market segments by product type across six categories spanning fleet fuel monitoring and telematics, fuel card and transaction management, fuel inventory and tank management, route and consumption optimization, emissions and sustainability reporting, and cloud-based fuel analytics platforms. Emissions reporting and cloud analytics lead growth, reflecting regulatory mandates across most fleet operations.
fuel-management-software-market-market-share-analysis-1789980767432

Emissions and Sustainability Reporting Software

Emissions and sustainability reporting software automatically calculates and documents fleet carbon output using vehicle-level consumption data, addressing mandatory disclosure requirements that increasingly extend beyond large corporations to mid-market fleet operators facing tightening regulatory deadlines across most jurisdictions, countries, fleet size categories, and industry verticals. Demand for this category grows fastest among all six segments, propelled by corporate sustainability commitments and government carbon disclosure mandates that require audit-ready reporting rather than informal internal tracking previously sufficient for most fleet operations. Vendors offering mature emissions reporting capture disproportionate new design wins versus competitors still relying primarily on basic fuel cost tracking across most fleet customer segments, regulatory jurisdictions, and geographic markets worldwide.
CAGR 14.5%

Cloud-Based Fuel Analytics Platforms

Cloud-based fuel analytics platforms deliver consumption tracking and reporting through subscription arrangements accessible from mobile devices, letting fleet operators monitor geographically distributed vehicles without maintaining dedicated local server infrastructure and IT support staff, teams, specialized departments, contractors, or external technology vendors entirely and consistently. Growth in this category tracks rising enterprise recognition that real-time fuel anomaly detection prevents theft and fraud losses that periodic manual reconciliation processes catch only after financial damage occurs across affected vehicles and fleets. Vendors increasingly bundle emissions reporting capability directly into cloud analytics platforms, letting customers satisfy sustainability disclosure requirements without deploying separate standalone reporting tools across their fleet operations, vehicle categories, and regulatory jurisdictions worldwide.
CAGR 12.5%
Full segment breakdown across 6 segments available in the complete report.

Regional Architecture and Country Demand Map

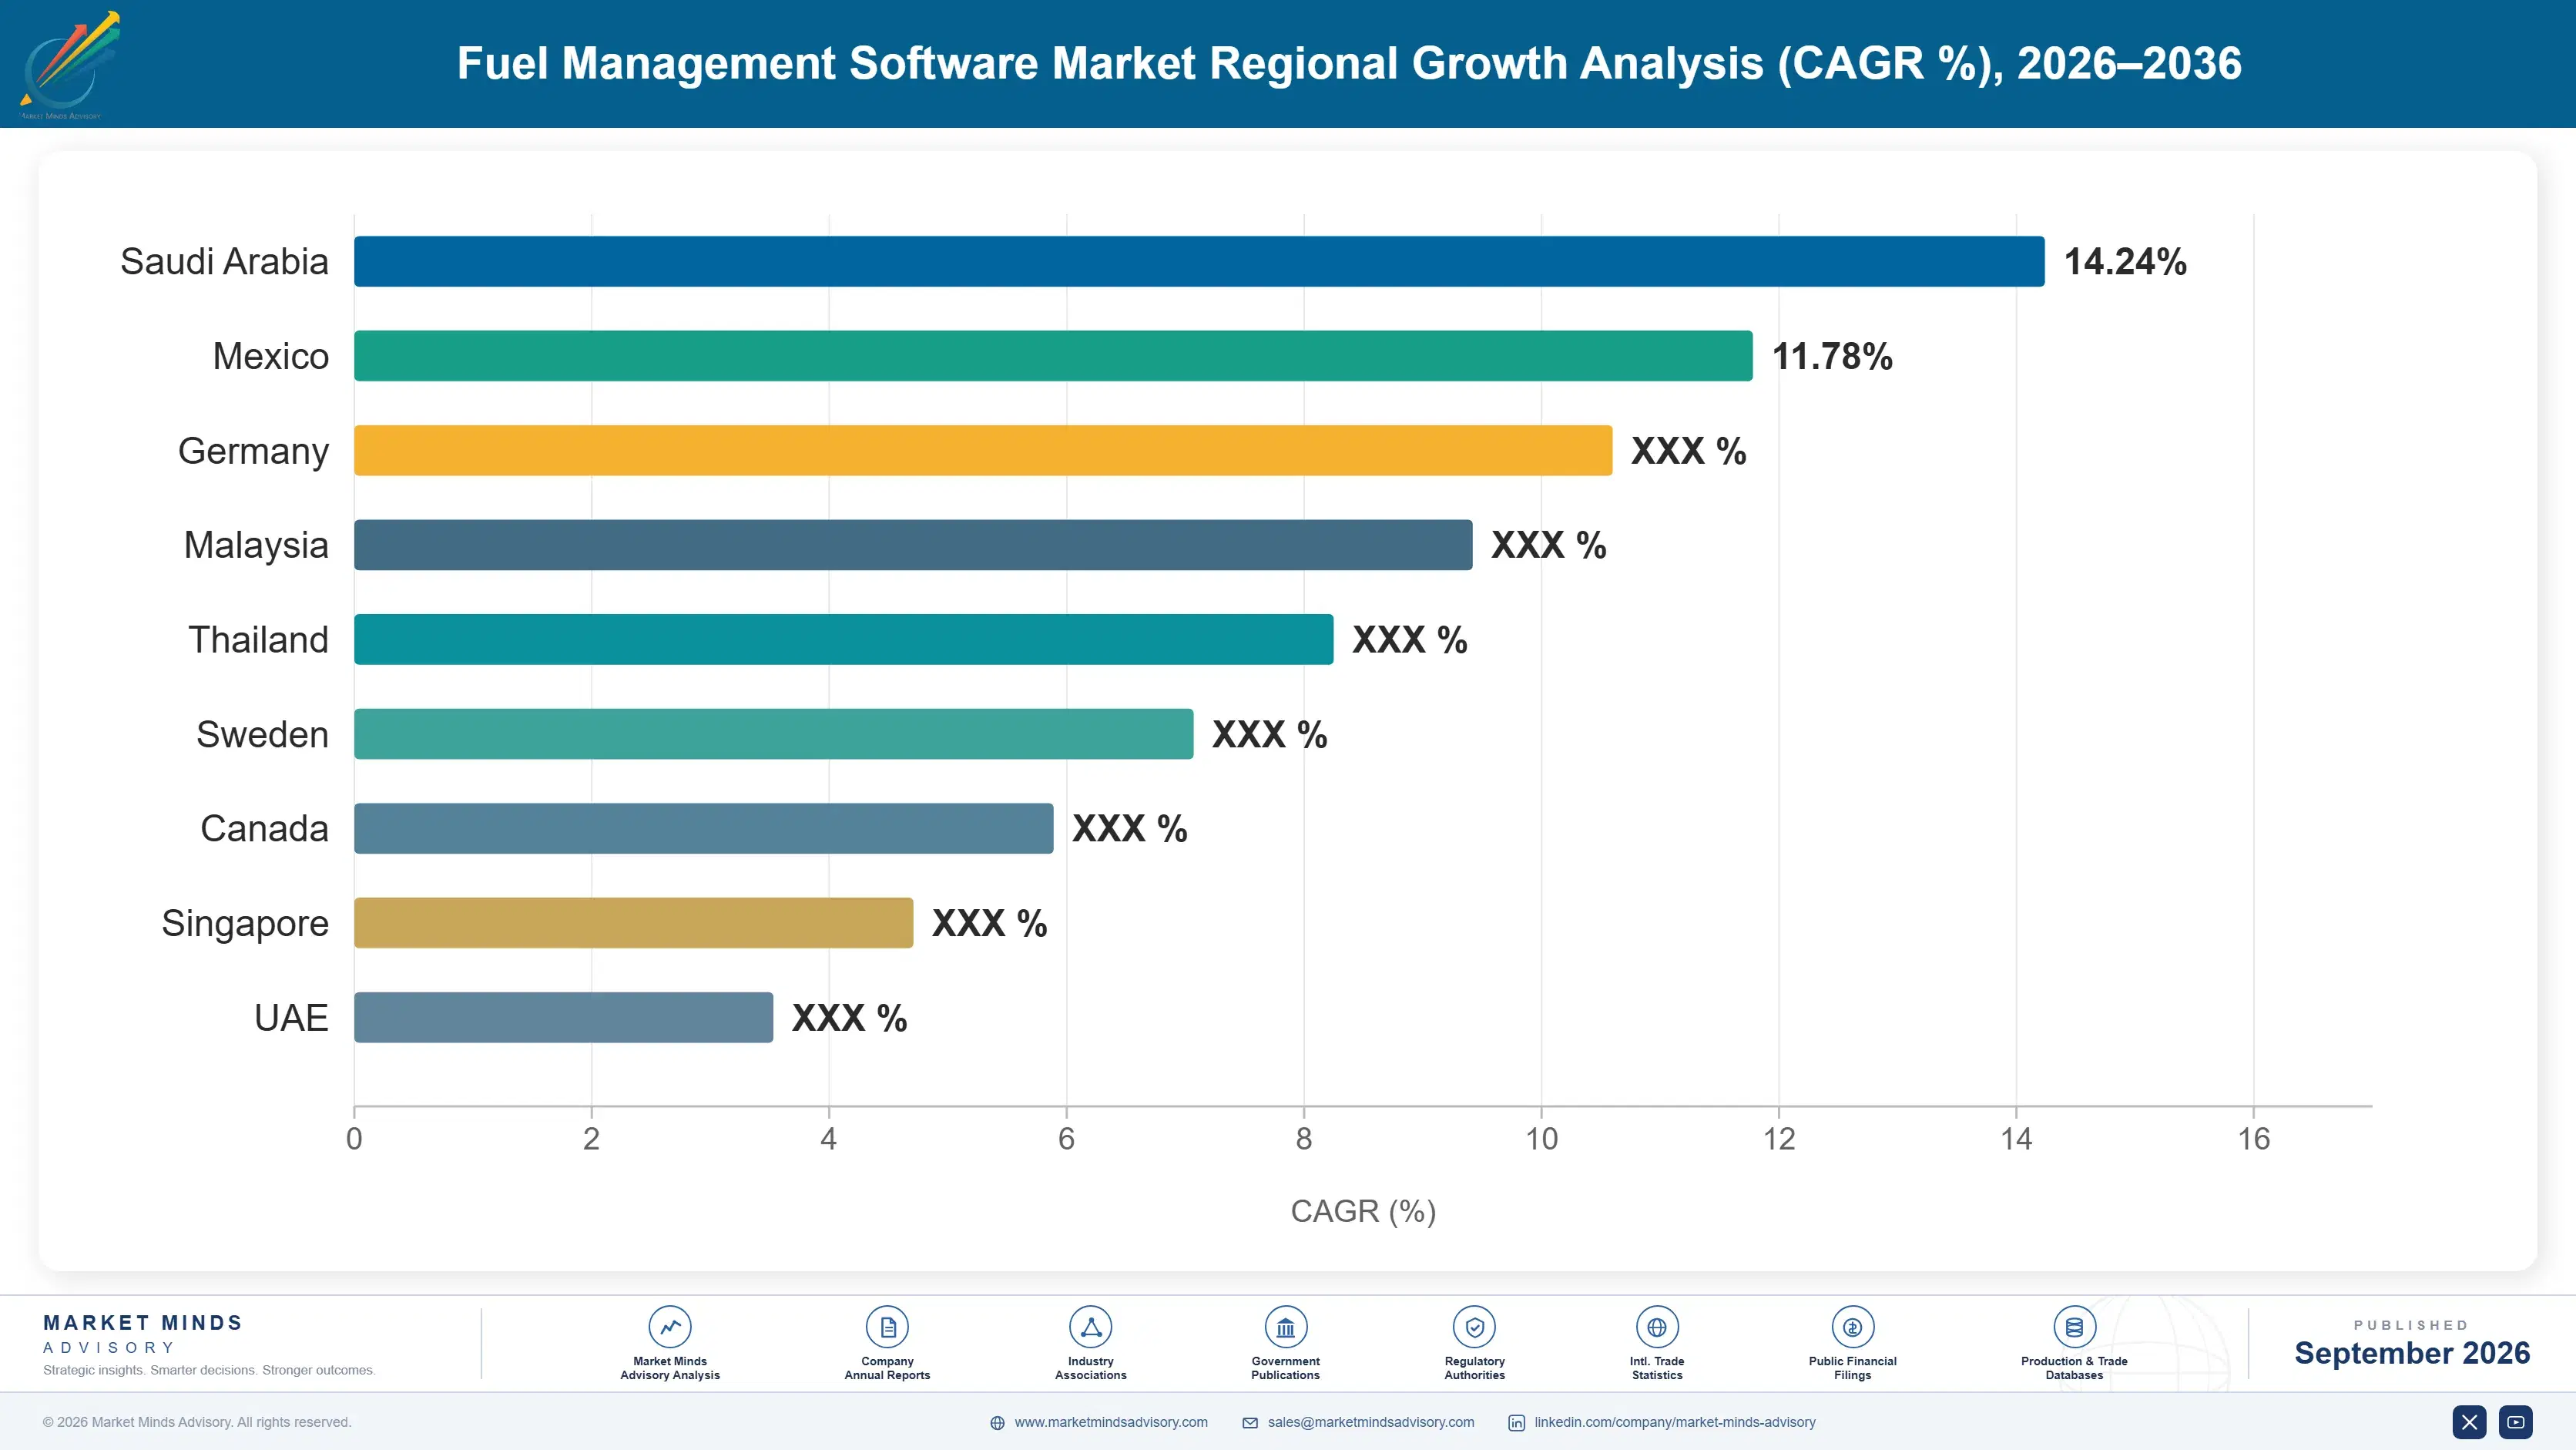
Regional fuel management software demand concentrates where commercial fleet size, vendor headquarters, and emissions disclosure mandates intersect most heavily, with North America leading on installed base scale, while South Asia and Pacific grows fastest, driven by commercial vehicle fleet expansion and government fuel efficiency programs.

North America

United States vendor headquarters concentration drives the region's leading share, since Trimble, Verizon Connect, Samsara, WEX, and Vontier all base core engineering, content development, and sales operations domestically and consistently across most product lines, categories, and geographic markets nationwide and abroad. The country's massive commercial trucking fleet, one of the largest globally, drives substantial software licensing demand across logistics, construction, and municipal fleet operators nationwide and across most states. Canadian fleet operators contribute meaningful additional demand through parallel fuel management modernization programs and initiatives. Corporate sustainability disclosure requirements under emerging federal climate reporting rules continue expanding software adoption beyond traditional fuel cost tracking use cases across most industries and fleet categories.
Share: 31% | CAGR: 11.2% (2026 to 2036)

East Asia

China's expanding logistics and e-commerce delivery sector drives substantial regional demand, as domestic fleet operators deploy fuel management software to control rising operational costs across expanding delivery vehicle fleets nationwide and across provinces, major cities, regional hubs, industrial zones, coastal areas, and inland markets. Japan and South Korea contribute additional demand through advanced manufacturing and logistics sector adoption requiring precise fuel consumption tracking for cost control and efficiency purposes. Regional software vendors increasingly compete on price against Western incumbents, particularly in markets less sensitive to emissions reporting certification standards required across North America and Western Europe specifically. Domestic fleet electrification programs increasingly drive mixed-fleet analytics adoption across most major cities.
Share: 23% | CAGR: 11.4% (2026 to 2036)
Regional intelligence for 5 additional markets available in the complete report: Western Europe, South Asia and Pacific, Latin America, Middle East and Africa, Eastern Europe. Contact sales@marketmindsadvisory.com.
fuel-management-software-market-country-cagr-analysis-1789980767946

Capturing Value From Emissions Compliance Demand

Fuel management software vendors can expand margin capture beyond raw fuel tracking by pursuing four distinct commercial paths tied to emissions reporting depth, mixed-fleet analytics, fraud detection capability, and regional compliance support infrastructure built across multiple fleet operator customer relationships spanning several years, renewal cycles, expanding service categories, evolving compliance requirements, and geographic markets worldwide.

Premium Pricing for Audit-Ready Reporting Modules

Vendors offering mature, audit-ready emissions reporting capability can charge premium pricing, typically 25 to 35 percent above basic fuel-tracking platform pricing, since fleet operators facing mandatory disclosure requirements will pay for proven reporting accuracy that generic spreadsheet tools cannot provide reliably or consistently across most jurisdictions. This premium persists until enough competitors achieve comparable reporting maturity, typically a two-to-three-year window across most fleet customer segments and regulatory jurisdictions. Vendors that invest early in emissions calculation methodology capture outsized margin during this window before broader industry adoption compresses pricing back toward standard levels.
Market Impact: Adds a 25 to 35 percent price premium

Mixed Fleet Analytics Bundling Revenue Model

Vendors offering unified analytics spanning electric and combustion fuel types capture more predictable, higher-lifetime-value revenue streams that typically lift total contract value by 30 to 40 percent compared to selling separate fuel-only tracking modules without electrification support included at purchase time or afterward across most contract types. This bundling strategy also deepens customer dependency on continuous vendor platform updates as fleets electrify further over time, reducing churn risk versus customers free to switch vendors at each fleet technology refresh cycle without meaningful data migration cost or operational disruption and delay.
Market Impact: Lifts contract value by 30 to 40 percent

Fraud Detection Premium Service Offering Program

Vendors offering sophisticated real-time fraud and theft detection algorithms can charge fleet operators a meaningful premium, since fleets avoid substantial ongoing fuel theft losses, often 8 to 12 percent of total fuel spend, that periodic manual reconciliation processes catch only well after financial damage has already occurred across affected vehicles, routes, and delivery schedules. This service captures value from fraud exposure that basic transaction logging tools cannot address, while strengthening vendor lock-in as fleet operators become dependent on vendor-specific anomaly detection algorithms across multiple vehicle categories and renewal cycles over time.
Market Impact: Cuts fuel theft losses by 25 percent overall

Regional Compliance Localization Service Offering Program

Vendors offering jurisdiction-specific compliance documentation and localized reporting templates can charge fleet operators a meaningful premium, since fleets avoid 4 to 6 months of independent regulatory mapping work by adopting vendor-provided compliant templates directly instead of building custom reporting internally from scratch across every jurisdiction, market, regulatory framework, disclosure standard, and audit requirement. This service captures value from regulatory complexity that would otherwise burden internal sustainability and legal teams considerably, while strengthening vendor lock-in as fleet operators become dependent on vendor compliance maintenance across multiple jurisdictions and evolving disclosure requirements over time.
Market Impact: Cuts compliance mapping time by 60 percent overall

Who Controls the Margin Pool

Market concentration sits at 44 percent among the top five vendors measured by software and subscription revenue, and Trimble holds a meaningful lead over its closest challenger, Verizon Connect, in enterprise fleet deployment volume specifically. The gap between the leader and the next challenger has narrowed somewhat as Verizon Connect expands its own emissions reporting portfolio aggressively. Below the top five, dozens of specialized emissions and analytics vendors compete on differentiation rather than direct fuel card substitution.
Current competitive activity centers on emissions reporting depth, mixed-fleet analytics capability, and fraud detection sophistication that increasingly determine fleet operator vendor selection more than raw fuel card transaction volume alone. Samsara and WEX have both announced expanded emissions calculation capability this year to compete against specialized sustainability reporting vendors, while Vontier continues deepening its fuel dispensing hardware integration offerings aimed at large fleet customers.

Emerging pressure comes from specialized emissions reporting vendors winning fleet contracts faster than fuel card incumbents expected, threatening to compress pricing across standard fuel tracking categories first. Rankings could shift meaningfully if a specialized vendor secures broad adoption across multiple hyperscale logistics customers simultaneously, validating a compliance-first model that reduces fleet dependency on any single fuel card provider's platform.
fuel-management-software-market-company-positioning-matrix-1789980768473

Competitive Moat and Risk Dimensions

TRIMBLE INC

Moat: Deep fleet hardware integration

Trimble maintains longstanding hardware integration relationships spanning telematics sensors, fuel level monitors, and vehicle diagnostics across major fleet manufacturer partnerships, letting it bundle fuel management software into broader fleet technology contracts that pure-software vendors cannot match. This bundled positioning gives Trimble disproportionate access to fleet technology budget decisions beyond pure software evaluation.
TRIMBLE INC

Risk: Slower cloud-native transition pace

Trimble's large installed base of hardware-centric fleet relationships creates organizational inertia that slows its transition toward cloud-native subscription models compared to newer, software-first competitors. Fleet operators increasingly prioritizing flexible cloud deployment could shift meaningful contract share toward faster-moving challengers if Trimble's transition pace does not accelerate.
VERIZON CONNECT INC

Moat: Telecom network integration advantage

Verizon Connect benefits from its parent company's extensive cellular network infrastructure, letting it offer reliable real-time fleet data connectivity in remote areas where competitors relying on third-party network carriers face coverage gaps. This connectivity advantage matters particularly for logistics fleets operating across rural and cross-border transportation routes.
VERIZON CONNECT INC

Risk: Limited emissions reporting specialization depth

Verizon Connect's emissions reporting capability trails specialized sustainability software vendors in some customer evaluations, requiring greater reliance on third-party reporting partnerships to match competitive functionality. This capability gap could limit Verizon Connect's ability to capture premium compliance-driven revenue that increasingly differentiates leading vendors from generic fleet tracking competitors.

Players Tracked

Prominent Players

Trimble Inc
Verizon Connect Inc
Samsara Inc
WEX Inc
Vontier Corporation

Other Key Players

Geotab Inc
Fleetio Inc
Omnitracs LLC
Rand McNally
Descartes Systems Group Inc
ORBCOMM Inc
Platform Science Inc
Motive Technologies Inc
Titan Cloud Software LLC
DTN LLC
P97 Networks Inc
OPW Fuel Management Systems
Franklin Fueling Systems Inc
Husky Corporation
GPS Insight LLC

Recent Developments

JANUARY 2026

Trimble announced expanded emissions calculation capabilities integrated directly into its existing fleet management platform, targeting improved carbon disclosure reporting for logistics and construction fleet customers across most regions. The update includes new integration options for third-party sustainability reporting system connectivity and formal audit documentation support.
Signal: Confirms emissions reporting capability as the primary competitive differentiator among leading platform vendors today and going forward.
OCTOBER 2025

Samsara completed a multi-year supply agreement with a major United States logistics company to deploy comprehensive fuel monitoring and mixed-fleet analytics across its expanding electric and combustion vehicle fleet nationwide. The agreement includes ongoing software updates and compliance reporting services covering multiple regional distribution centers.
Signal: Reflects continued specialized vendor expansion into large logistics enterprise fleet electrification contracts and long-term strategic partnerships.
MAY 2025

WEX launched an expanded version of its fuel card platform supporting automated emissions documentation generation for carbon disclosure requirements across multiple regulatory jurisdictions simultaneously and continuously. The launch targets fleet operators seeking reduced compliance mapping burden ahead of upcoming regulatory deadlines across several major markets.
Signal: Signals accelerating vendor investment in compliance automation targeting previously underserved regulated fleet segments and industries broadly.

Software Engineering and Data Cost Exposure

Software engineering talent and cloud data infrastructure together represent roughly 47 percent of vendor cost of goods sold, sourced primarily from specialized fleet software engineers based across North America and Eastern Europe, alongside telematics hardware components purchased from third-party sensor manufacturers worldwide. Emissions calculation methodology development adds further meaningful cost exposure for compliance-focused product lines.
Software engineering talent compensation spiked sharply during 2021 and 2022 as broader technology sector demand for specialized engineers competed for a constrained global talent pool simultaneously, according to industry compensation surveys published during that period. Several vendors reported compressed gross margins during that period as talent acquisition costs outpaced their ability to pass higher engineering costs through to fleet customers under existing multi-year fixed-price subscription agreements negotiated earlier.

Smaller vendors without dedicated emissions methodology teams face proportionally higher per-customer development costs than vertically integrated majors like Trimble and Verizon Connect, which amortize software development investment across a much larger fleet customer base and product portfolio. Vendors headquartered in regions with weaker currencies also face amplified dollar-denominated talent costs, widening the competitive cost gap against vendors with diversified global engineering footprints.
fuel-management-software-market-cost-volatility-analysis-1789980768669

Build Shared Emissions Calculation Frameworks

Vendors increasingly build shared, reusable emissions calculation frameworks and reporting templates that serve multiple regulatory jurisdictions simultaneously, reducing per-jurisdiction development cost by amortizing methodology investment across a broader compliance portfolio and customer base. This design shift lowers marginal cost for each additional reporting requirement while accelerating time to market for new customer requests and updates.

Negotiate Multi-Year Cloud Infrastructure Contracts

Locking multi-year cloud infrastructure contracts at fixed or partially hedged pricing protects vendors against spot market volatility that has repeatedly compressed margins during recent data processing demand spikes and surges. This pricing certainty lets finance teams plan software development budgets several years ahead with materially reduced exposure to sudden infrastructure cost swings and volatility.

Diversify Software Engineering Talent Sourcing

Sourcing fleet software engineering talent from multiple regional talent pools rather than a single concentrated location reduces exposure to localized wage inflation or talent shortages tied to competing technology sector demand across major hiring markets. This diversification strategy adds modest coordination complexity but meaningfully reduces single-region dependency risk across the vendor's broader engineering talent base and pipeline.

Portfolio Architecture for Margin Defence

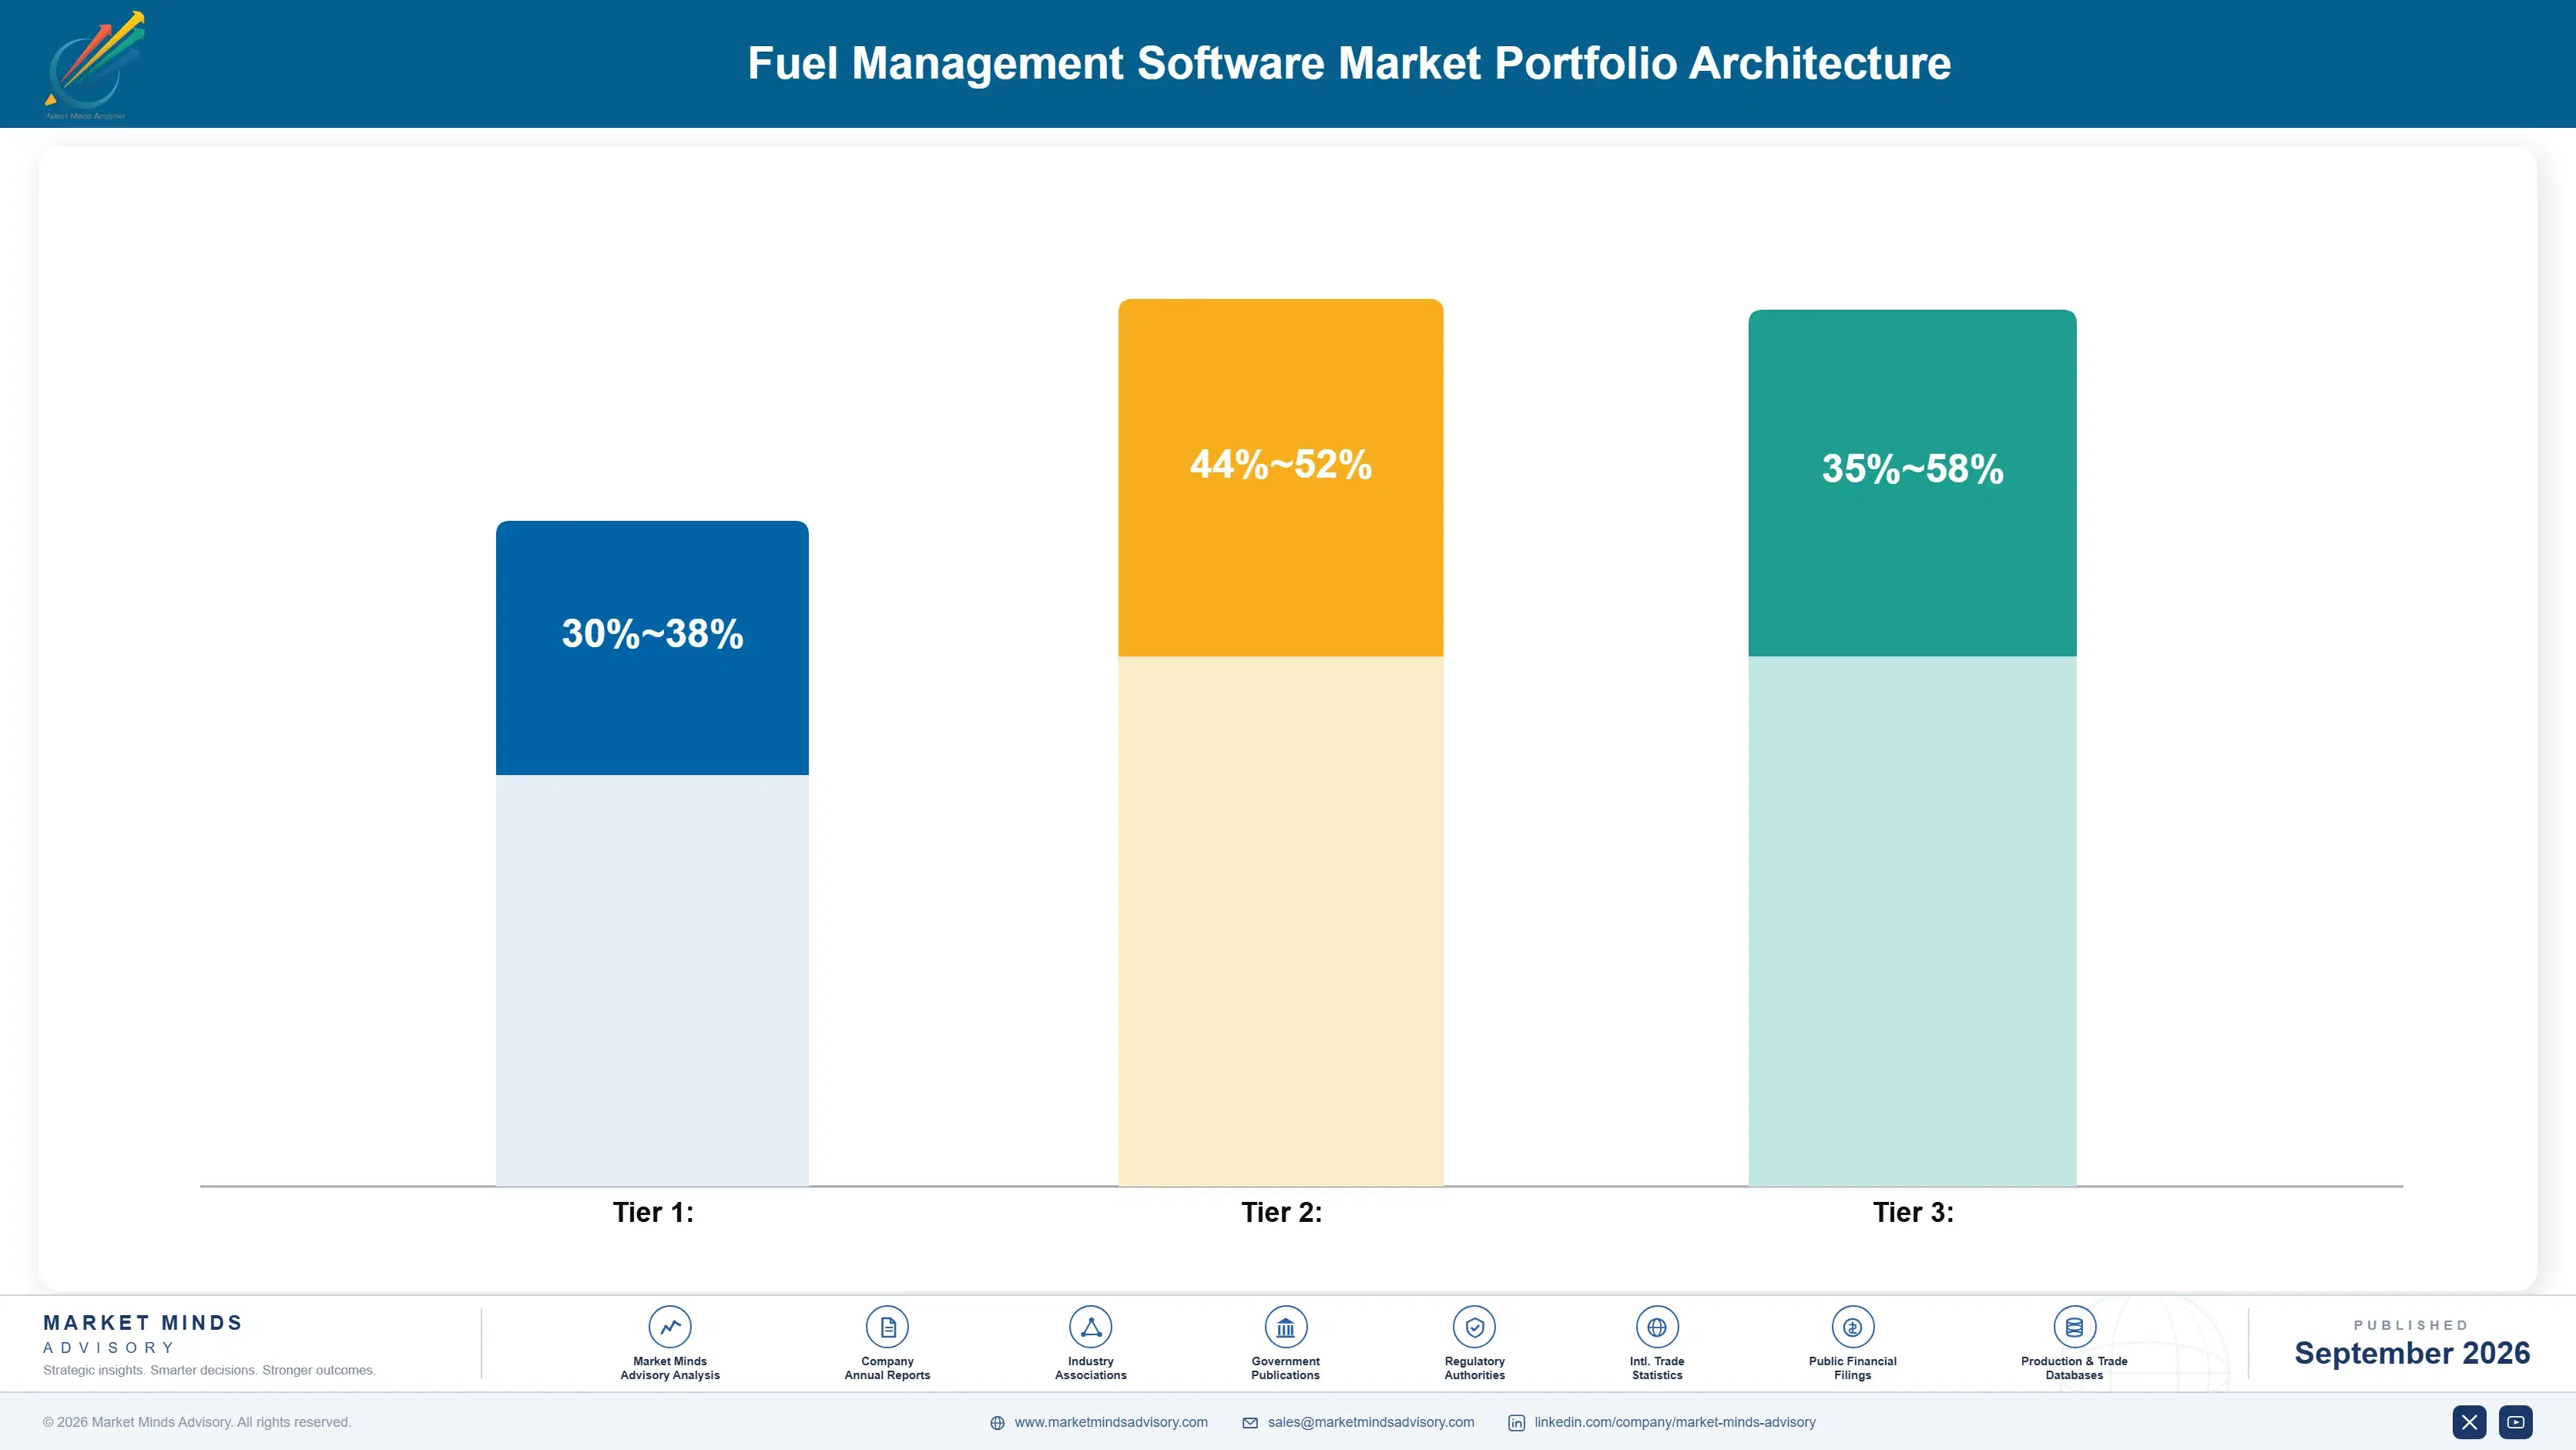
Vendor economics split into three tiers by reporting sophistication and analytics differentiation across most product categories offered today. Volume-tier standard fuel card and monitoring solutions carry gross margins around 30 to 38 percent, while premium emissions-bundled configurations reach 44 to 52 percent margins consistently. AI-enhanced fraud detection and mixed-fleet analytics command the widest margin range given the technical barriers protecting early movers from immediate competitive pressure.
Tension between volume and premium tiers centers on engineering resource allocation: vendors must decide how much emissions compliance investment to commit toward regulated large fleet customers versus maintaining broad standard fuel tracking configurations serving budget-constrained smaller operators. Most large vendors now prioritize compliance and analytics investment, accepting narrower standard tracking margins to secure future design-in position across upcoming regulatory disclosure cycles.

High-value margin pools concentrate overwhelmingly in emissions reporting software and mixed-fleet analytics platforms, where regulatory and technical barriers protect early movers from immediate price competition across most fleet customer segments and jurisdictions. Standard fuel tracking increasingly commoditizes as more vendors, including regional developers, achieve comparable baseline functionality, compressing margins toward the lower end of the volume tier band across most established global markets and fleet types.

Standard fuel card and monitoring solutions serving budget-constrained smaller fleet operators, priced primarily on transaction volume and baseline tracking capacity rather than compliance sophistication, analytics depth, or reporting methodology maturity.
Gross Margin: 30-38%

Emissions-bundled configurations meeting regulatory disclosure requirements, commanding pricing power from certification barriers and reporting depth competitors cannot easily replicate quickly across comparable customer segments, regulatory jurisdictions, and fleet categories worldwide.
Gross Margin: 44-52%

AI-enhanced fraud detection and mixed-fleet analytics addressing electrification and theft prevention challenges, where technical barriers and model training maturity drive the widest margin variance across vendors, deployments, and customer segments today.
Gross Margin: 35-58%
fuel-management-software-market-portfolio-architecture-1789980769175

High-value Sub-segments and Strategic Watch-out

Emissions and Sustainability Reporting Software

Growing fastest among all six segments as mandatory carbon disclosure requirements expand, commanding premium pricing and durable regulatory barriers that protect early movers from immediate competitive pressure across most fleet segments, jurisdictions, industry verticals, organizational sizes, geographic markets, pricing structures, and support tiers today and tomorrow.

Cloud-Based Fuel Analytics Platforms

Subscription migration demand drives strong secondary growth here, though moderate near-term margin pressure reflects intensifying competition among vendors racing to standardize mobile-accessible dashboards across next-generation fleet deployment architectures, customer categories, geographic markets, pricing tiers, support structures, renewal terms, contract lengths, and evolving licensing models worldwide.

Fleet Fuel Monitoring and Telematics Software

The largest volume segment by installed base, providing steady baseline revenue at comparatively thin margins as commoditization intensifies with growing regional vendor competition entering global supply chains and fleet procurement decisions consistently and predictably over multiple budget years, renewal cycles, planning periods, and contract terms.

Standard Fuel Card Transaction Processing

A strategic watch-out segment facing sustained pricing pressure as transaction processing commoditizes faster than analytics software, risking margin erosion for vendors slow to redirect focus toward higher-value reporting and analytics categories instead of legacy fuel card tracking systems entirely and permanently across most markets and customer segments.

Compliance Reporting Anchors Fleet Renewal Revenue

Vendor relationships operate on annuity-like economics once a fleet operator integrates fuel management software into daily operations, since replacing embedded consumption tracking requires re-training drivers and dispatchers across the entire vehicle fleet simultaneously. A typical fleet contract generates subscription and data analytics revenue across a three-to-five-year fleet technology lifecycle, with emissions reporting module upgrades extending the relationship well beyond initial platform procurement.
Adoption stickiness varies meaningfully by end-use vertical: large logistics and trucking fleets show the deepest stickiness given regulatory compliance documentation tied to specific certified reporting software and audit standards. Smaller regional fleets show comparatively higher churn as generic fuel tracking commoditizes faster across competing vendor platforms. Government and municipal fleets show extremely high stickiness tied to procurement certification and multi-year contract cycles that discourage frequent vendor switching.

Buyer profiles are shifting generationally as procurement authority moves from operations managers toward dedicated sustainability officers who prioritize emissions reporting accuracy over pure fuel cost savings alone across most fleet categories. Younger sustainability leaders increasingly favor vendors offering transparent, audit-ready reporting dashboards over vendors competing purely on fuel card transaction processing volume and legacy installed base relationships built over years.
fuel-management-software-market-end-use-penetration-index-1789980769659

Fuel Software Vendor Investment Priorities

These are among the four positions where our research anticipates prominent divergence between winners and laggards over the coming forecast period. Each is grounded in the demand model, the regulatory perimeter, and the announced capacity pipeline.
01 / EMISSIONS REPORTING INVESTMENT

Accelerate audit-ready emissions reporting before disclosure mandates tighten further

Mandatory carbon disclosure requirements increasingly extend beyond large corporations to mid-market fleet operators, and vendors offering audit-ready reporting capability capture disproportionate design wins among customers required to demonstrate compliance with concrete documentation rather than informal tracking across most jurisdictions today. Vendors that delay this investment risk losing fleet contracts entirely to competitors offering more credible reporting methodology within the next several renewal cycles and budget periods. Building this capability now protects future contract renewals before regulatory deadlines tighten further across most jurisdictions and markets.
02 / MIXED FLEET ANALYTICS STRATEGY

Build unified analytics ahead of accelerating fleet electrification timelines

Fleet operators are integrating electric vehicles into previously combustion-only fleets faster than most vendors currently anticipate in their internal product roadmaps, requiring unified consumption tracking spanning fundamentally different energy types across most fleet categories and vehicle segments. Vendors maintaining fuel-only tracking platforms risk losing fleet design wins to competitors offering credible mixed-fleet analytics that spans both energy categories within a single reporting dashboard. Building this capability now protects future fleet relationships before electrification becomes the default expectation industry-wide across most fleet categories and geographic markets.
03 / FRAUD DETECTION CAPABILITY INVESTMENT

Build sophisticated fraud detection to capture theft-driven fleet demand

Fleet operators continue losing substantial revenue annually to fuel theft and unauthorized transactions that manual reconciliation processes catch only well after financial losses have already occurred across affected vehicles and delivery routes. Vendors offering sophisticated real-time fraud detection algorithms increasingly win fleet contracts over competitors providing only basic transaction logging capability lacking anomaly detection sophistication and precision. Building this capability now captures fraud-conscious fleet customers before competitors establish comparable detection offerings across the same customer base, markets, and regulatory jurisdictions.
04 / REGIONAL COMPLIANCE LOCALIZATION STRATEGY

Build jurisdiction-specific compliance templates across major regulated markets

Carbon disclosure and reporting requirements vary meaningfully by jurisdiction, and certification complexity is rising across the European Union, the United States, and India simultaneously as regulators tighten requirements further each year and budget cycle. Vendors without localized compliance templates increasingly lose fleet contracts to competitors offering pre-built, jurisdiction-specific solutions that reduce customer compliance burden directly and meaningfully across most regulated markets. Building this capability now protects market access before competitors establish dominant regulatory relationships across the largest regulated fleet markets worldwide.

Engagement Snapshot From the Field

A live engagement with an industry participant carrying material or product regulatory and market exposure ahead of a defining policy shift, showing how our research translates into a defensible multi-year portfolio strategy.
MARKET MINDS ADVISORY · CLIENT ENGAGEMENT SUMMARY
Fuel Management Software Producer Strategic Portfolio Review and Transition Roadmap 2026·Investment Scenario on Fuel Management Software Exposure Evaluation 2025-26
CLIENT PROFILE
The client is a mid-sized regional trucking company operating across several midwestern United States markets, generating annual revenue of approximately 180 million dollars (client-reported, unverified by MMA). The company relied on legacy fuel card reconciliation processes managed manually by a small finance team, facing rising compliance pressure as several major customers began requiring emissions disclosure documentation.
STRATEGIC CHALLENGE
Management needed to decide whether to upgrade its existing fuel card platform with an add-on emissions reporting module, replace the entire fuel management system with an integrated platform offering native compliance reporting, or continue manual reconciliation while fully outsourcing emissions calculation to a third-party consulting and legal advisory firm permanently.
MMA APPROACH
MMA conducted primary interviews with the client's finance and operations leadership alongside benchmarking analysis of total cost of ownership and reporting accuracy among comparable regional trucking companies pursuing platform replacement versus add-on module approaches across North America over a six-week engagement period covering multiple vendor options, configurations, and pricing models.
KEY FINDINGS
  1. Manual emissions calculation using outsourced consulting services cost substantially more annually than integrated software licensing across comparable fleet sizes and reporting scopes studied.
  2. An integrated platform replacement cut total emissions reporting preparation time by roughly 55 percent compared to manual reconciliation processes previously used by the finance team.
  3. The add-on module approach offered lower upfront cost but required ongoing manual data reconciliation between systems that introduced meaningful accuracy risk during audits.
  4. Customer feedback indicated strong preference for vendors demonstrating integrated, audit-ready reporting capability over vendors relying on manual spreadsheet-based compliance documentation processes and workflows.
CLIENT PROFILE
The client is a mid-sized regional trucking company operating across several midwestern United States markets, generating annual revenue of approximately 180 million dollars (client-reported, unverified by MMA). The company relied on legacy fuel card reconciliation processes managed manually by a small finance team, facing rising compliance pressure as several major customers began requiring emissions disclosure documentation.
STRATEGIC CHALLENGE
Management needed to decide whether to upgrade its existing fuel card platform with an add-on emissions reporting module, replace the entire fuel management system with an integrated platform offering native compliance reporting, or continue manual reconciliation while fully outsourcing emissions calculation to a third-party consulting and legal advisory firm permanently.
MMA APPROACH
MMA conducted primary interviews with the client's finance and operations leadership alongside benchmarking analysis of total cost of ownership and reporting accuracy among comparable regional trucking companies pursuing platform replacement versus add-on module approaches across North America over a six-week engagement period covering multiple vendor options, configurations, and pricing models.
KEY FINDINGS
  1. Manual emissions calculation using outsourced consulting services cost substantially more annually than integrated software licensing across comparable fleet sizes and reporting scopes studied.
  2. An integrated platform replacement cut total emissions reporting preparation time by roughly 55 percent compared to manual reconciliation processes previously used by the finance team.
  3. The add-on module approach offered lower upfront cost but required ongoing manual data reconciliation between systems that introduced meaningful accuracy risk during audits.
  4. Customer feedback indicated strong preference for vendors demonstrating integrated, audit-ready reporting capability over vendors relying on manual spreadsheet-based compliance documentation processes and workflows.
RECOMMENDED STRATEGY
Phase 1: Phase one: replace the legacy fuel card platform with an integrated emissions-capable system within two quarters to address customer requirements. Phase 2: Phase two: train finance and operations staff on the new integrated reporting workflow to eliminate manual reconciliation dependency entirely and permanently. Phase 3: Phase three: expand emissions reporting capability to cover additional customer-specific disclosure formats as requirements evolve over time and budget cycles.
OUTCOME
Within nine months, the client reported emissions reporting preparation time reductions of roughly 55 percent and secured renewed contracts with major customers requiring compliance documentation and audit trails (client-reported, unverified by MMA). The integrated platform now anchors the client's ongoing compliance strategy and customer relationships.

Frequently Asked Questions

Foundational context covering the market sizes, CAGR, scope, country, region and competition that inform every finding below. This section is provided to cover basics and most often pre-purchase conversations, answered from the MMA Primary Research Dataset.

What is the current size of the Fuel Management Software Market?

The Fuel Management Software Market reached 2.1 billion dollars in 2025, the base year for this report's forecast. Growth continues at a 10.4 percent compound annual rate through 2036, driven by mandatory emissions disclosure and mixed fleet analytics adoption.

How large will the Fuel Management Software Market be by 2036?

The market is projected to reach 6.24 billion dollars by 2036, representing a 2.69 times expansion from its 2026 value. Emissions reporting and cloud analytics platforms drive most of this incremental growth across nearly every covered region.

What is the CAGR for the Fuel Management Software Market 2026 to 2036?

The base case compound annual growth rate is 10.4 percent across the ten-year forecast window. Bull case scenarios reach 11.6 percent on faster disclosure adoption, while bear case scenarios fall to 9.2 percent on delayed regulatory enforcement.

Which segment is growing fastest?

Emissions and Sustainability Reporting Software grows fastest at a 14.5 percent compound annual rate, roughly 1.39 times the overall market average. Cloud-Based Fuel Analytics Platforms follow as the second-fastest visible segment at 12.5 percent.

Who are the major companies in the Fuel Management Software Market?

Trimble, Verizon Connect, Samsara, WEX, and Vontier lead the field, together representing roughly 44 percent combined concentration. Geotab and Fleetio also maintain meaningful competitive positions across several major regional markets.

Which country is growing fastest?

India leads country-level growth at a 13.2 percent compound annual rate, outpacing the broader South Asia and Pacific region overall. Expanding commercial vehicle fleets and government fuel efficiency mandates drive this acceleration across most major Indian operators.

Report Segmentation Architecture

The full report scope spans multiple orthogonal segmentation dimensions, with cross-tabulated demand data provided for each dimension pair. Coverage extends further to regional breakdowns, trend trajectories, and the competitive detail needed to support segment-level decision-making.

By Primary Market Dimension

  • Fleet Fuel Monitoring and Telematics Software
  • Fuel Card and Transaction Management Software
  • Fuel Inventory and Tank Management Software
  • Route and Consumption Optimization Software
  • Emissions and Sustainability Reporting Software
  • Cloud-Based Fuel Analytics Platforms

By End-Use Industry

  • Logistics and Trucking
  • Construction and Industrial
  • Government and Municipal Fleets
  • Aviation and Marine

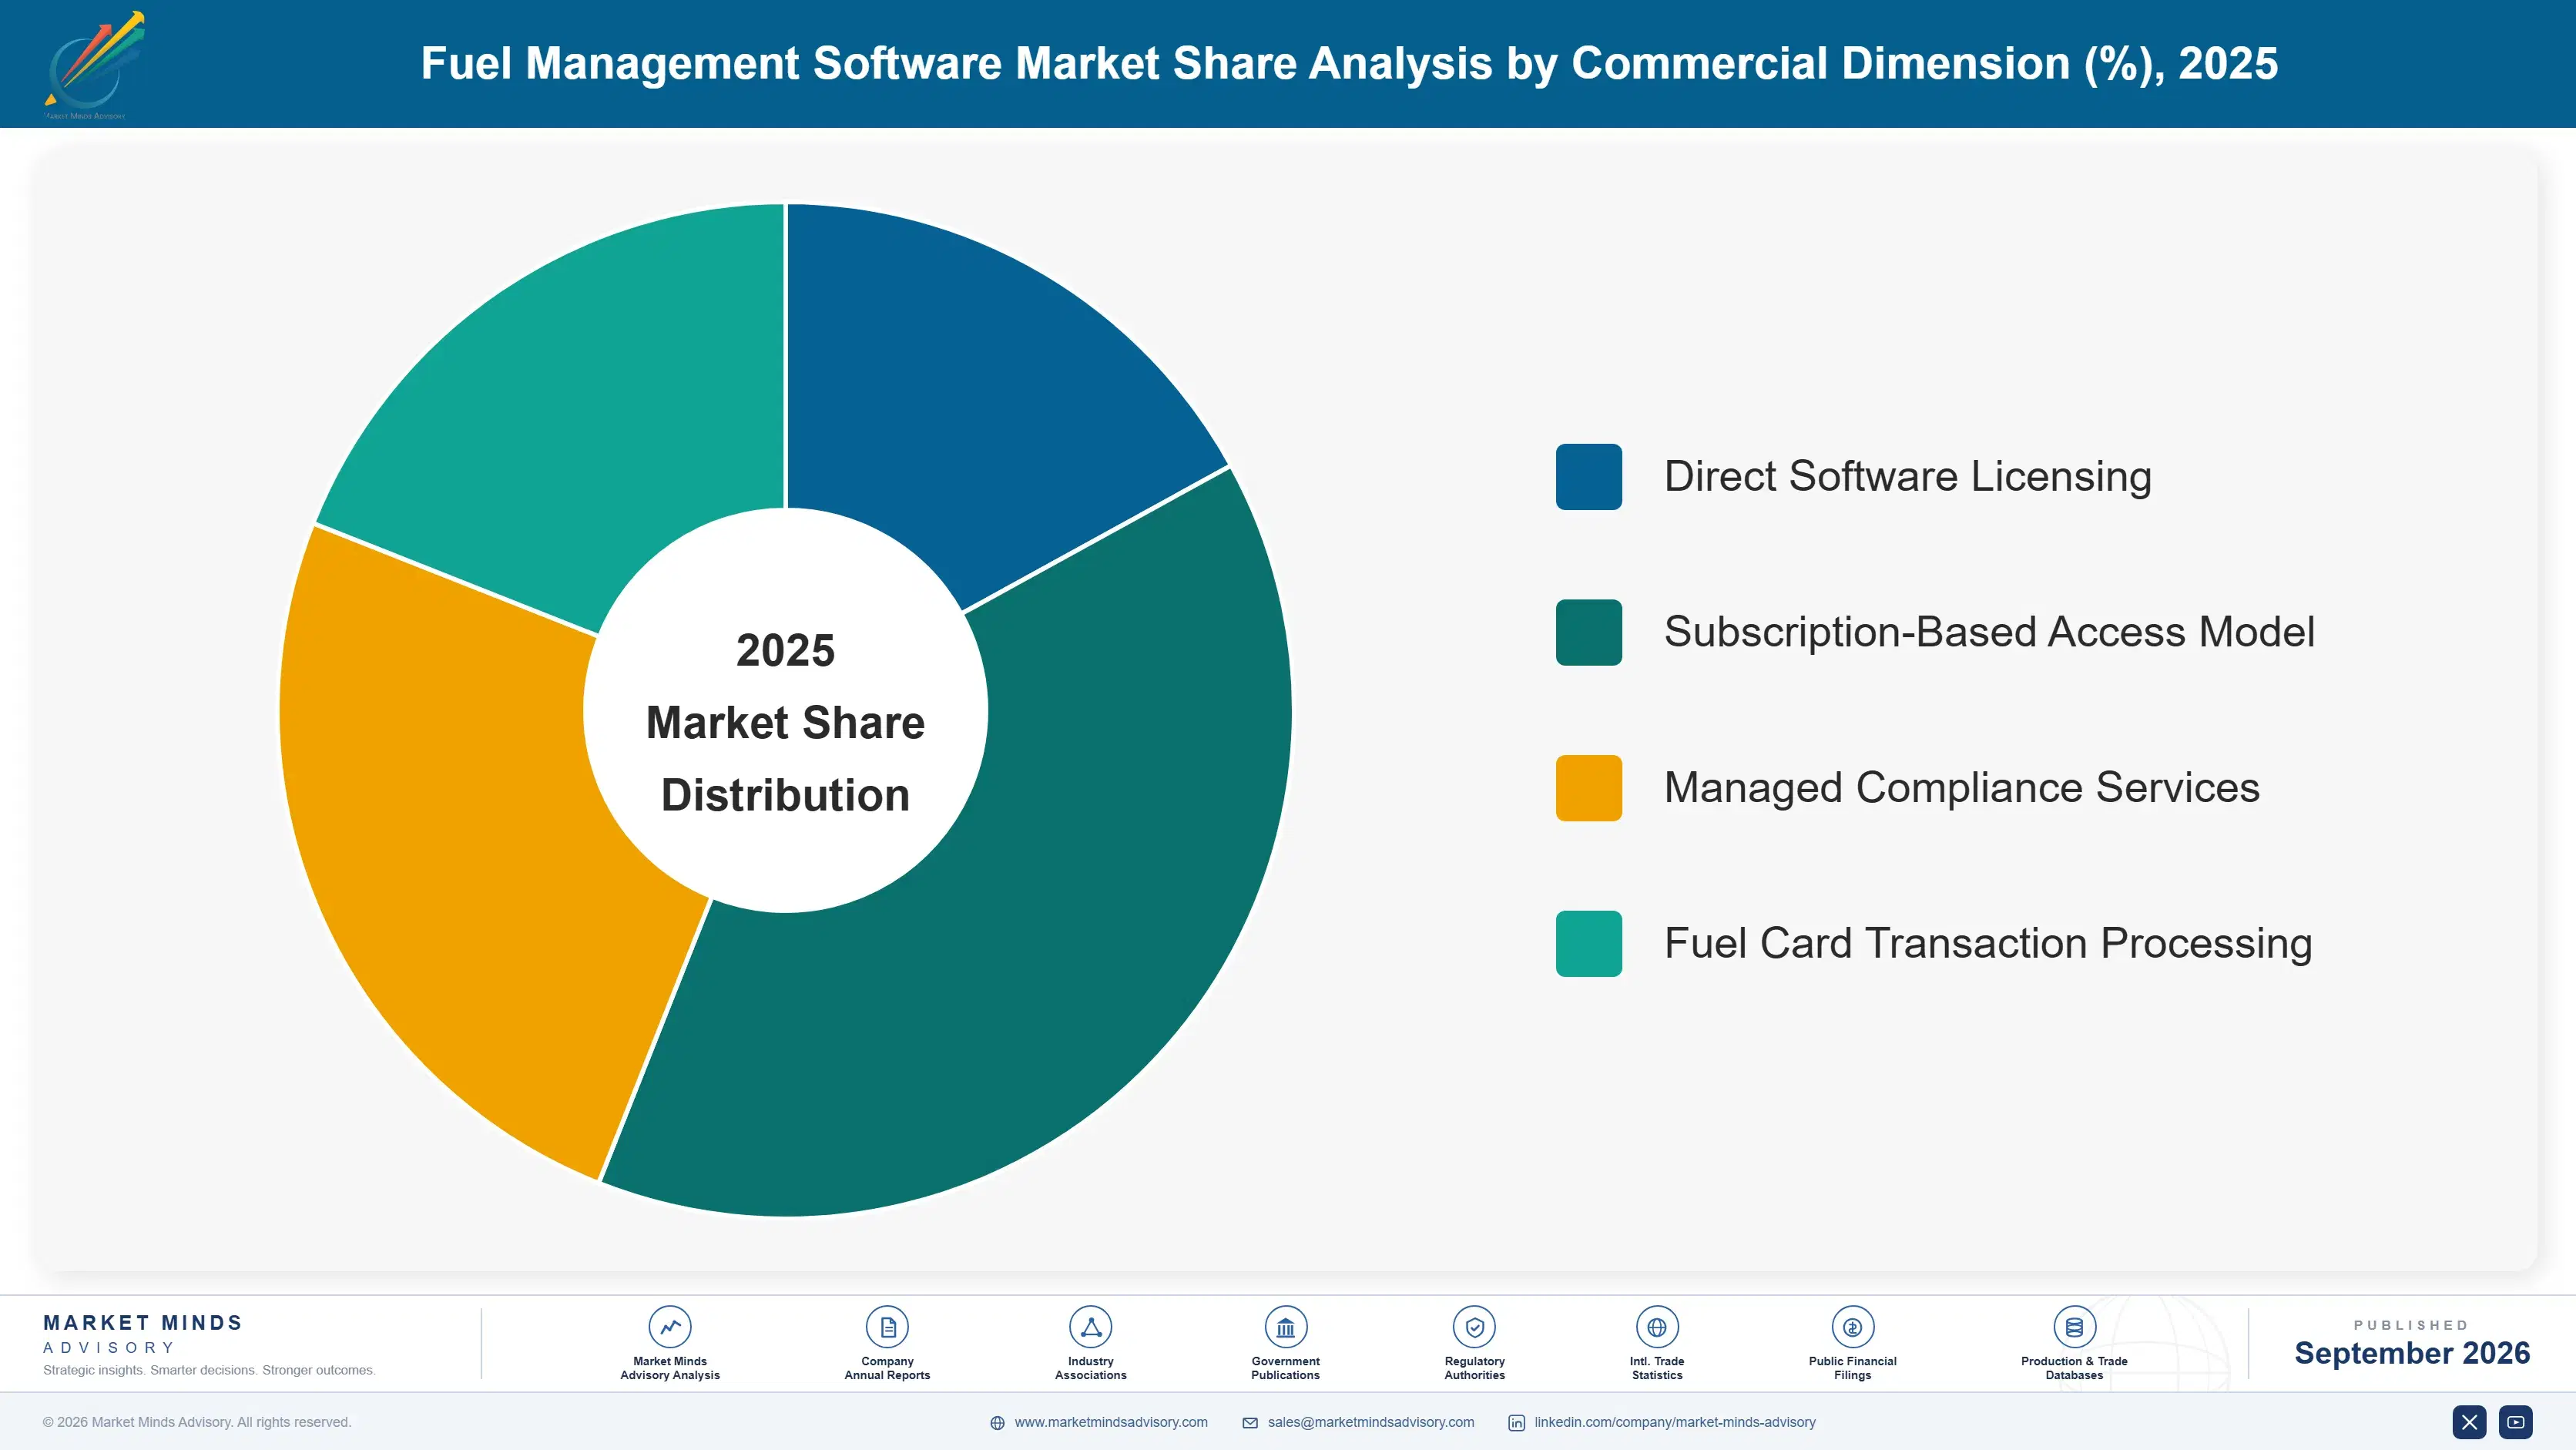
By Commercial Dimension

  • Direct Software Licensing
  • Subscription-Based Access Model
  • Managed Compliance Services
  • Fuel Card Transaction Processing

By Region

  • North America
  • East Asia
  • Western Europe
  • South Asia and Pacific
  • Latin America
  • Middle East and Africa
  • Eastern Europe

Scope, Methodology, and Coverage

Every figure in this report is reproducible from documented input assumptions. The scope below maps the historical period, the forecast horizon, the segmentation dimensions, and the countries covered, alongside the underlying primary and qualitative methodology.
Historical Period
2020 to 2025
Forecast Period
2026 to 2036
Base Year
2025 (USD billions; MMA Primary Research Dataset, September 2026)
Market Definition
The Fuel Management Software Market covers platforms that monitor, track, and optimize fuel consumption, transactions, and emissions across commercial fleets, industrial facilities, and marine and aviation operations. It excludes standalone hardware sensors and general fleet telematics platforms lacking dedicated fuel-specific monitoring and reporting capability.
Quantitative Units
USD Billion
Segmentation Dimensions
Product Type, End-Use Industry, Commercial Dimension, Region
Regions Covered
North America, East Asia, Western Europe, South Asia and Pacific, Latin America, Middle East and Africa, Eastern Europe
Countries Covered
United States, China, India, Germany, United Kingdom, Brazil, Japan, and 30 additional countries
Key Companies Profiled
Trimble Inc, Verizon Connect Inc, Samsara Inc, WEX Inc, Vontier Corporation, Geotab Inc, Fleetio Inc, Omnitracs LLC, Rand McNally, Descartes Systems Group Inc, ORBCOMM Inc, Platform Science Inc, Motive Technologies Inc, Titan Cloud Software LLC, DTN LLC, P97 Networks Inc, OPW Fuel Management Systems, Franklin Fueling Systems Inc, Husky Corporation, GPS Insight LLC
Quantitative Methodology
Primary survey, n=3,800 respondents, Q4 2025, six countries; demand-side model with trade association cross-validation
Qualitative Methodology
47 expert interviews, Q4 2025; applied to validate demand model assumptions, identify emerging dynamics, and assess competitive positioning
Report Format
PDF and XLSX data workbook (Word format preview document)
Publisher
Market Minds Advisory
Report Code
MMA-2026-TEC-156
Published
September 2026
Contact
sales@marketmindsadvisory.com | www.marketmindsadvisory.com

Purchase the full Fuel Management Software Market Report (2026 to 2036).

This report examines the global Fuel Management Software Market across product type, end-use industry, and commercial dimension through 2036. It quantifies mandatory emissions disclosure adoption, mixed-fleet analytics migration, and fraud detection capability as primary mechanisms shaping vendor strategy and margin capture. Coverage spans competitive positioning among five leading vendors and fifteen additional challengers across seven world regions, with detailed input cost and portfolio analysis included. The analysis draws on primary survey data spanning 3,800 respondents and 47 expert interviews conducted across six countries in the fourth quarter of 2025.
Full regional breakdown across all seven markets
Ten-year forecast scenarios with bull and bear cases
Detailed competitive profiles of twenty major vendors
Segment-level growth rates and margin economics analysis
Input cost exposure and mitigation strategy analysis
Anonymized client case study with strategic recommendations

Built For The People Who Decide

From boardroom strategy to bench-side execution, this report is read cover-to-cover by leaders shaping the next decade of their industry, turning demand scenarios, market dynamics and valuation benchmarks into decisions.
CXOs/ Presidents/ VPs/ Managers
M&A and Corporate Development
Strategy Teams and R&D Heads
Procurement and Product Directors
Regulatory and Compliance Leaders
Investor Relations and Equity Analysts