Market Minds Advisory
Frequency Converter Market

Frequency Converter Market: Harmonics Are Somebody Else's Problem Until They Are Not

Every converter injects harmonic current straight back into the supply, and buyers keep discovering that when a transformer overheats or a utility refuses connection rather than during any specification review.

Lead Analyst

David Horsley

Published

September 2026

Make Smarter Decisions with Customized Research Insights

Request a free sample report and evaluate market opportunities, growth trends, and competitive dynamics relevant to your business needs.

2025 MARKET VALUE$24.5BMarket Size 2025
2036 FORECAST VALUE$52.1BBase Case , 2026 to 2036
CAGR 2026 TO 20367.1 %Bull 8.3% / Bear 5.9%
INCREMENTAL OPPORTUNITY$25.9BNet 10- year value creation
EXPANSION MULTIPLE1.99x2036 value over 2026 base
Strategic Levers
M&A Pipeline
Regional Outlook
Country Rankings
Competitive Intelligence
Segmental Deep-dive
Call-Us : 91 93563 13602

Executive Snapshot and Market Trajectory

A frequency converter saves energy at the motor and puts harmonic current back into the supply. Around 38% of industrial harmonic problems trace to converter installations that met their own specification perfectly, and the cost lands on transformers, cables, and connection agreements rather than on the drive.
Growth runs at 7.1% and the harmonic answer leads it. Active front end and regenerative converters grow at 10.7%, exactly 1.50 times the market rate, because they solve the distortion problem and return braking energy at the same time. East Asia holds the largest share at 31%, on Chinese manufacturing scale and industrial motor population combined. Medium voltage drives follow at 8.6% on pumps, compressors, and mill applications.
Concentration is high at 56% across the top five measured on converter units shipped weighted by power rating. Power semiconductors and control firmware sit behind that, and the gap between a general purpose drive and one that holds torque at zero speed is far wider than any datasheet comparison suggests. Chinese manufacturers supply general purpose drives at costs Western producers cannot match. Motor makers are also integrating drives and selling a single assembly.
Market Definition
This market covers electronic frequency converters that vary the speed of alternating current motors and convert between supply frequencies, spanning general purpose variable frequency drives, active front end and regenerative converters, medium voltage drives, static frequency converters for aviation, marine and rail supply, and integrated motor drive units. Soft starters without speed control, direct current motor controllers, uninterruptible power supplies, solar and battery inverters, and the motors themselves fall outside scope.
Base Year Value
$24.5B in 2025 (MMA Primary Research Dataset, August 2026)
Forecast Period
2026 to 2036, eleven discrete annual values
CAGR
7.1% base case. Bull 8.3%. Bear 5.9%.
Fastest Growth Segment
Active Front End and Regenerative Converters: 10.7% CAGR
Fastest Growth Country
India: 9.2% CAGR
Fastest Growth Region
South Asia and Pacific: 9.1% CAGR
Largest Region
East Asia: 31% of 2025 global value
Market Leaders
ABB, Siemens, Danfoss, Schneider Electric, Mitsubishi Electric. Source: MMA Analysis based on company annual reports.
Primary Survey
n=3,800 procurement and R&D decision-makers, Q4 2025, six countries
Methodology
Demand-side build-up, cross-validated against public data, 47 expert interviews

Frequency Converter Market Forecast Scenarios

frequency-converter-market-size-forecast-scenario-1787301886805
The 2020 to 2025 period grew at 5.9% and semiconductor allocation shaped it far more than demand did. Drive availability constrained industrial projects through 2021 and 2022, with lead times stretching past a year on several ranges and manufacturers redesigning around whatever devices they could obtain. Motor efficiency regulation continued pulling drive attachment upward throughout, largely independently of the supply situation.
Three mechanisms carry the 7.1% base case. Motor efficiency regulation is the largest, since standards now reach system efficiency rather than motor efficiency alone and a drive is the only practical route to compliance. Harmonic limits at connection are the second, which pushes buyers toward active front end designs. And data centre and process industry automation is the third, growing considerably faster than general industry. None of the three depends on industrial capital spending accelerating.
The 8.3% bull case rests on harmonic compliance being enforced at connection rather than negotiated afterward, which would move a substantial share of general purpose volume into active front end designs immediately. The 5.9% bear case is industrial capital expenditure weakness combined with continued Chinese price competition in general purpose drives, where differentiation is thin and buyers compare on power rating and price.

The Distortion the Datasheet Omits

A frequency converter is sold on the energy it saves at the motor, and that saving is real. What the datasheet rarely leads with is that a standard six pulse front end draws current in pulses rather than smoothly, producing current distortion around 40% that flows back into the supply. Roughly 38% of industrial harmonic problems trace to installations where every drive met its own specification exactly.
HARMONIC PROBLEM ATTRIBUTION38%Of industrial distortion issues traced to compliant converter installations
STANDARD DRIVE DISTORTION40%Current distortion from a general purpose six pulse front end
ACTIVE FRONT END PREMIUM1.9 timesPaid against an equivalent general purpose drive at rating
SEMICONDUCTOR SHARE OF COGS37%Concentrating cost exposure in a supply base outside manufacturer control
TOP FIVE CONCENTRATION56%High, on power semiconductor access and control firmware depth
REGENERATIVE ENERGY RECOVERY22%Of consumption recovered on applications with frequent braking cycles
The consequences land somewhere other than the drive. Transformers run hot and derate, neutral conductors carry currents nobody sized them for, capacitor banks fail, and utilities refuse connection or impose limits on new load. Each of those costs sits in a different budget from the one that approved the drive, which is why the problem recurs at sites that solved it once already.
The engineering answer is well established. Active front end designs use controlled switching on the supply side to draw near-sinusoidal current, cutting distortion to a few percent, and the same topology returns braking energy to the supply rather than burning it in a resistor. They cost around 1.9 times a general purpose drive at the same rating, and they lose every comparison that stops at the drive itself.
"A plant added fourteen drives, hit their energy target, and cooked a transformer eight months later. Nobody had modelled the harmonics because nobody owned that question. The drives were all perfectly compliant."
Principal, Power Electronics and Industrial Drives Practice · MMA Technology and

Market Trends

Harmonic Limits Move From Guidance Into Connection Terms

Utilities and site operators are writing distortion limits into connection agreements rather than treating standards as advisory, which changes a drive selection from a preference into a requirement. Active front end designs cut current distortion from around 40% to a few percent and grow at 10.7% against 7.1% for the market. Enforcement is uneven and tightening, and buyers who negotiated their way past limits once are finding that harder on each subsequent load addition. Active designs also return braking energy rather than burning it, which pays separately. Suppliers offering system assessment rather than a drive quotation are winning these decisions.
Market Impact: Recovers 22% of consumption

Efficiency Standards Now Reach The Whole Drive System

Motor efficiency regulation has extended from the motor alone to the drive and motor as a system, which makes converter attachment a compliance route rather than an optional energy improvement. That shift pulls drive volume into applications that previously ran fixed speed and never considered one. It also raises the specification floor, since a drive contributing to a system efficiency class must document its own losses rather than simply claiming savings elsewhere. Attachment rates in pumping, fan, and compressor applications are climbing steadily as a result. Drives contributing to a system efficiency class must document their own losses.
Market Impact: Active designs cost 1.9 times

Market Opportunities and Growth Drivers

Regenerative Applications Return Energy Rather Than Burning It

Cranes, hoists, centrifuges, and test rigs all brake frequently, and a standard drive dissipates that energy in a braking resistor as heat that then needs removing from the building. Regenerative topologies return around 22% of consumption to the supply on applications with frequent braking cycles, and they remove the resistor and its cooling load at the same time. The payback argument is unusually clean because both savings are measurable directly. These applications justify the 1.9 times premium without any harmonic argument being needed. Removing the resistor also frees space and cooling capacity in a switchroom.
Market Impact: Distortion reaches 40% of current

Process Industry Automation Demands Precise Speed Control

Pumping, mixing, extrusion, and web handling all require speed accuracy that fixed speed motors and mechanical control cannot deliver, and process quality rather than energy saving justifies the drive in those applications. That buyer specifies control performance, torque behaviour at low speed, and communication capability rather than comparing power ratings and prices. Data centre cooling and pumping applications have added similar demand at considerable scale over recent years. Torque holding at zero speed and low speed accuracy decide these selections rather than price. Control firmware depth is what actually separates suppliers in that contest.
Market Impact: Semiconductors are 37% of COGS

Market Restraints and Challenges

Harmonic Cost Lands In Somebody Else's Budget

A standard drive produces around 40% current distortion and the resulting transformer derating, cable heating, and connection restrictions all appear in budgets separate from the one that approved the purchase. The root cause is organisational rather than technical, and roughly 38% of industrial harmonic problems arise from fully compliant installations. Commercial impact is active front end designs losing every comparison that stops at the drive. Mitigation runs through system-level modelling at specification and harmonic assessment written into procurement. Sites that solved the problem once frequently repeat it on the next load addition.
Market Impact: Active front end growing at 10.7%

Semiconductor Exposure Sits Outside Manufacturer Control

Power semiconductors carry roughly 37% of cost of goods sold, and a converter is largely silicon, capacitors, and control firmware assembled into an enclosure. The root cause is that switching devices are produced by a small number of specialists who allocate rather than simply sell during shortage. Commercial impact was demonstrated through 2021 and 2022 when lead times exceeded a year. Mitigation runs through multi-device designs, second-source qualification during development, and buffer inventory on constrained families. Allocation during a shortage follows strategic relationships and design-in position rather than order size alone.
Market Impact: Distortion falls from 40%
3 additional market trends, 4 additional growth drivers, and 2 additional restraints and challenges are covered in the full report. Contact sales@marketmindsadvisory.com to access the complete intelligence.

Segment CAGR and Growth Architecture

Segmentation follows converter topology and supply role, because those determine harmonic behaviour, energy recovery capability, voltage class, and which regulatory or process requirement each unit actually answers. Motor power rating and end-use industry both cut across every topology rather than separating them, which makes either a weaker primary dimension here. Topology decides harmonic behaviour and energy recovery together.
frequency-converter-market-market-share-analysis-1787301887338

Active Front End And Regenerative Converters

The fastest topology at 10.7%, exactly 1.50 times the market rate, and the only one solving two problems with the same hardware. Controlled supply-side switching cuts current distortion from around 40% to a few percent while returning braking energy to the supply rather than burning it in a resistor. They cost roughly 1.9 times what a general purpose drive costs at equal rating, which loses every comparison stopping at the drive itself and wins comfortably once transformer derating and connection limits enter the calculation. Utilities writing distortion limits into connection agreements are converting a preference into a requirement. Enforcement remains uneven and it is tightening steadily across most developed networks now.
CAGR 10.7%

Medium Voltage Drives

Second fastest at 8.6%, serving large pumps, compressors, fans, and mill drives above roughly one thousand volts where low voltage equipment cannot reach the power required. Multilevel topologies inherently produce lower distortion than six pulse low voltage designs, so the harmonic argument arrives differently here. Engineering content is high, installations are project-specific, and lead times are long, which makes these accounts considerably stickier than general purpose supply. Very few manufacturers hold genuine capability across the whole voltage and power range. Desalination, mining, and metals applications generate most of the demand across every region. High ambient conditions require derating that generic selection frequently misses entirely. Project lead times run long throughout.
CAGR 8.6%
Full segment breakdown across 5 segments available in the complete report.

Regional Architecture and Country Demand Map

East Asia leads at 31% on Chinese manufacturing scale combined with the largest industrial motor population anywhere. Western Europe follows on efficiency regulation depth, ahead of North America. South Asia and Pacific grows fastest on Indian industrial investment. Harmonic enforcement practice varies enormously between regions.

East Asia

Thirty-one percent, the largest share, and it combines the world's largest industrial motor population with manufacturing capacity that supplies every other region. The 31% sits marginally outside the framework band, justified by that combination of installed base and export production arriving together. Chinese manufacturers dominate general purpose drive volume at prices Western producers cannot approach, while Japanese suppliers hold high-specification control and medium voltage positions. Harmonic enforcement remains uneven. Growth at 8.1% runs above the market rate on industrial automation investment. General purpose drive pricing set here effectively defines the terms in every other region too. Active front end adoption remains fairly limited for as long as harmonic enforcement stays uneven.
Share: 31% | CAGR: 8.1% (2026 to 2036)

Western Europe

Efficiency regulation depth rather than industrial volume carries this 23%. European standards extended from motor efficiency to whole drive system efficiency earlier than elsewhere, which pulled drive attachment into applications that had run fixed speed for decades. Harmonic limits are also enforced more consistently here, so active front end adoption runs ahead of every other region. Energy cost reinforces both arguments. Growth at 5.5% is the slowest of any region, reflecting high existing penetration rather than any weakness in specification quality. Suppliers offering system harmonic assessment at quotation win here far more consistently than elsewhere. Regenerative applications in cranes and test rigs are also well established across the region. Site standardisation decisions favour broad ranges.
Share: 23% | CAGR: 5.5% (2026 to 2036)
Regional intelligence for 5 additional markets available in the complete report: North America, South Asia and Pacific, Latin America, Middle East and Africa, Eastern Europe. Contact sales@marketmindsadvisory.com.
frequency-converter-market-country-cagr-analysis-1787301887851

Selling the System Not the Drive

Standard drives produce around 40% current distortion, roughly 38% of harmonic problems come from compliant installations, active designs cost 1.9 times, and semiconductors carry 37% of cost. Value comes from system-level selling, from regenerative applications, and from securing silicon supply. The consequence lands in a budget the drive buyer never sees. Assessment changes that comparison.

Model The Whole Installation Before Quoting A Drive

A standard six pulse drive produces around 40% current distortion, and the transformer derating, cable heating, and connection restrictions that follow all land in budgets separate from the one buying the drive. Roughly 38% of industrial harmonic problems arise from installations where every unit met its own specification. Supplying a system harmonic assessment at quotation moves the comparison from drive price to installed consequence, which is the only ground where active front end designs win. Utilities now writing distortion limits into connection agreements are effectively making that argument on the supplier's behalf.
Market Impact: Distortion reaches 40% of the curre

Target Applications That Brake Very Frequently

Cranes, hoists, centrifuges, and test rigs dissipate braking energy in resistors as heat that the building then has to remove, and regenerative topologies recover around 22% of consumption on those duty cycles while eliminating the resistor entirely. Both savings are directly measurable rather than modelled, which makes the payback argument unusually clean in a market where energy claims are routinely disbelieved. These applications also justify the 1.9 times premium without any harmonic argument at all. Removing the braking resistor also frees switchroom space and cooling capacity at the same time.
Market Impact: Regeneration recovers 22% of the to

Second-Source Power Semiconductors During Product Design

Power semiconductors carry roughly 37% of cost of goods sold and are produced by a small number of specialists who allocate rather than sell during shortage, as lead times exceeding a year through 2021 and 2022 demonstrated across the whole sector. Qualifying alternate switching devices during development costs engineering time and almost no money at all. Doing the same work during an allocation period costs a redesign, an expedite premium, and frequently a lost delivery slot. Purchasing volume helps considerably less than expected, since allocation follows design-in position and established relationships.
Market Impact: Semiconductors carry 37% of the cos

Compete On Control Rather Than On Power Rating

General purpose drives are compared on power rating and price against Chinese manufacturers whose costs Western producers cannot approach, and that contest has no winner worth having. Torque holding at zero speed, low speed accuracy, and communication capability separate suppliers in process applications where product quality rather than energy saving justifies the drive. Concentration sits at 56% precisely because control firmware depth is genuinely difficult, and it is where defensible margin remains. Process buyers specify torque behaviour and communication capability rather than comparing power ratings. That conversation happens with an entirely different function inside the customer.
Market Impact: Top five concentration currently si

Who Controls the Margin Pool

Concentration is high at 56% across the top five measured on converter units shipped weighted by power rating, and two barriers hold it there. Power semiconductor access matters during allocation and matters little otherwise, while control firmware depth matters permanently: the gap between a general purpose drive and one holding torque at zero speed is far wider than any datasheet comparison reveals. The leader to challenger gap is wide in process applications and narrow in general purpose volu
Competitive activity runs on three fronts. Control performance in demanding applications is the first, since process buyers specify torque behaviour rather than comparing prices. Harmonic and system engineering capability is the second, which decides whether a supplier can sell active front end designs or merely offer them. And medium voltage project capability is the third, where very few manufacturers hold genuine range.

Pressure arrives from two directions. Chinese manufacturers supply general purpose drives at costs Western producers cannot match. And motor manufacturers are integrating drives into motor assemblies and selling a single unit. Both pressures land in general purpose volume where differentiation is genuinely thin.

Rankings shift on process and medium voltage awards rather than volume.
frequency-converter-market-company-positioning-matrix-1787301888372

Competitive Moat and Risk Dimensions

ABB

Moat: Range depth and control firmware

Holding genuine capability from fractional kilowatt general purpose drives through to medium voltage project equipment lets one supplier answer an entire site rather than a single application. Control firmware developed over decades handles torque behaviour and low speed accuracy that assemblers using reference designs simply cannot approach at any price.
ABB

Risk: General purpose volume erodes steadily

Chinese manufacturers supply general purpose drives at costs Western production cannot match, and that tier carries substantial unit volume even though it carries little margin. Range breadth defends process and medium voltage work and contributes nothing in the price-led segments. Volume share erodes while the technical position holds at the demanding end.
DANFOSS

Moat: Application engineering and pump expertise

Deep application knowledge in pumping, water, and HVAC gives a supplier the system arguments that sell drives on installed outcome rather than on unit price, which is exactly where harmonic and energy modelling matter. Water utilities and building operators buy on delivered performance and rarely have the engineering capacity to model it themselves. That knowledge transfers slowly to competitors.
DANFOSS

Risk: Range narrower than standardisation

Customers standardising drives across a whole plant favour suppliers with capability from fractional kilowatt through to medium voltage, and a narrower range loses those decisions regardless of application strength. Application depth wins individual specifications and not site-wide standards. That trade becomes sharper as customers consolidate their supplier lists.

Players Tracked

Prominent Players

ABB
Siemens
Danfoss
Schneider Electric
Mitsubishi Electric

Other Key Players

Yaskawa Electric
Rockwell Automation
Fuji Electric
Toshiba
Hitachi
WEG
Nidec Industrial Solutions
Delta Electronics
Inovance Technology
Shenzhen Veichi
Invt Electric
Lenze
SEW-Eurodrive
Bonfiglioli
TMEIC

Recent Developments

FEBRUARY 2025

Utility writes harmonic distortion limits into connection agreement

A network operator added measured harmonic distortion limits to connection agreements for new industrial load, replacing advisory guidance that customers had previously negotiated around during commissioning. The change was a connection policy revision rather than any enforcement action, dispute, or arrangement with equipment suppliers. Measurement obligations accompanied the change.
Signal: Advisory standards only become real purcha
MAY 2025

Plant retrofits active front end after transformer derating

An industrial operator replaced general purpose drives with active front end units after transformer overheating forced a derating that constrained plant output, having originally selected on drive price alone. The retrofit was maintenance capital expenditure rather than any warranty claim, dispute, or supplier arrangement change.
Signal: Harmonic cost gets discovered through a de
SEPTEMBER 2025

Manufacturer completes second-source qualification across switching devices

A drive manufacturer completed alternate device qualification across the power semiconductor families most constrained during earlier allocation, embedding second sources into active designs rather than relying on inventory. The work was internal engineering investment rather than any acquisition, joint venture, or supply agreement with a semiconductor producer.
Signal: Alternate devices qualified during design

Silicon, Capacitors and Enclosures

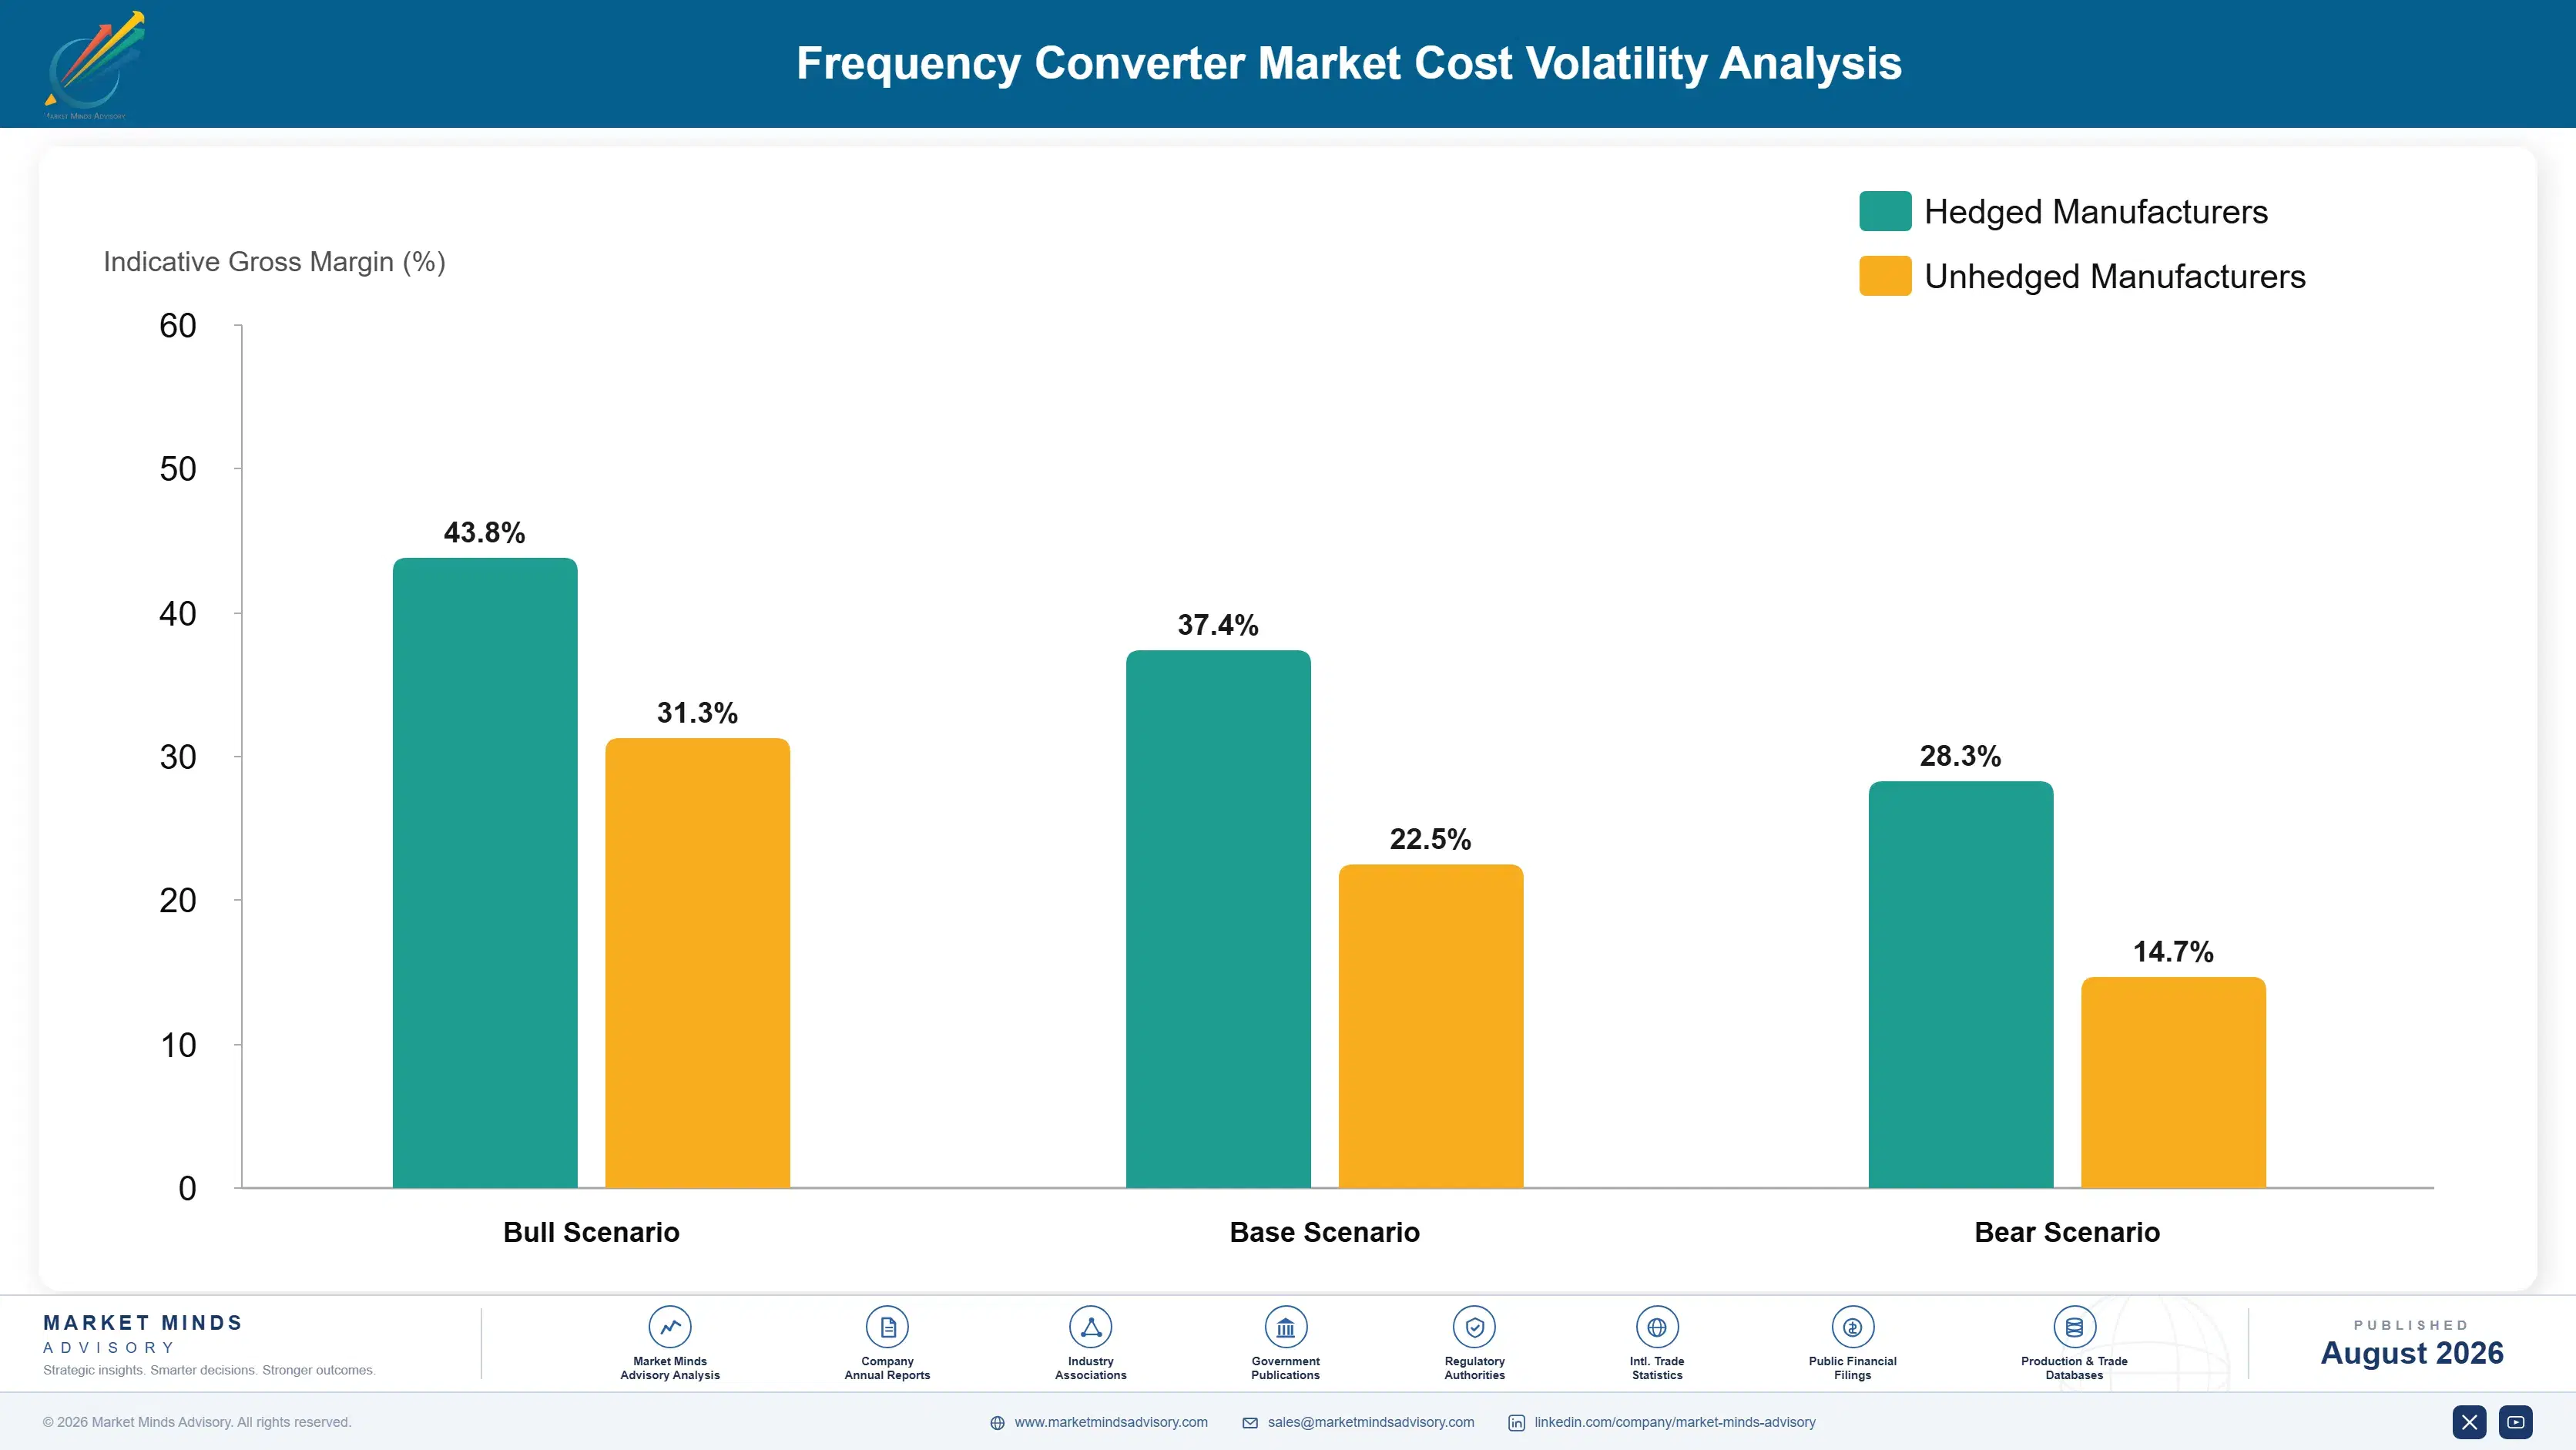
Power semiconductors carry roughly 37% of cost of goods sold, spanning insulated gate bipolar transistors, diodes, and increasingly silicon carbide devices, produced by a small number of specialists worldwide. Capacitors and passive components add about 16%, enclosures and thermal management near 14%, control boards and firmware development around 12%, and assembly, testing, and certification the balance across a typical unit.
Semiconductor allocation through 2021 and 2022 constrained drive production severely, with several manufacturers disclosing lead times exceeding a year, expedite premiums, and design changes around available devices in annual filings covering those years. Capacitor supply tightened simultaneously. Availability has since normalised while pricing has not fully retreated, and specialist assembly labour cost rose alongside and has stayed elevated. Design changes made under allocation have persisted. Requalification was rarely reversed afterward.

The competitive disadvantage mechanism runs through device flexibility rather than through purchasing scale. A drive designed around a single switching device family carries complete exposure to that supplier's allocation decisions, while one with qualified alternates shifts production within weeks. Purchasing volume helps considerably less than manufacturers expect, since allocation during shortage follows strategic relationships and design-in position rather than order size alone.
frequency-converter-market-cost-volatility-analysis-1787301888568

Qualify alternate switching devices during product development

Power semiconductors carry roughly 37% of cost of goods sold, and designing around a single device family transfers full allocation exposure to a supplier the manufacturer does not control at all. Qualifying alternate devices during development costs engineering time and very little money. Doing exactly that work during a shortage instead costs a full redesign.

Design thermal management for the ambient conditions served

Enclosures and thermal management carry about 14% of cost of goods sold, and drives selected generically for high ambient markets require derating that specifiers routinely miss entirely. The resulting failures get attributed to product quality rather than to application. Designing ranges specifically for hot climate operation costs engineering effort and removes a recurring and reputationally expensive failure mode.

Invest in control firmware rather than in enclosure cost

Control boards and firmware carry around 12% of cost of goods sold and account for almost all the difference between a general purpose drive and one that holds torque at zero speed reliably. Enclosure and assembly cost reduction competes against Chinese manufacturing that cannot be beaten on that ground. Firmware depth is where defensible margin actually sits in this market.

Portfolio Architecture for Margin Defence

Three tiers describe this business and the spread follows engineering content rather than power rating. General purpose drives sit at the bottom, compared on rating and price against Chinese manufacturers whose costs Western producers cannot approach. Process and application-specific drives occupy the middle, where control performance genuinely separates suppliers. Active front end and medium voltage equipment sits at the top, on harmonic and project engineering content.
The tension is that general purpose volume builds the installed base and the site standardisation position, while the demanding tiers carry the margin and require engineering the volume business does not develop. A manufacturer competing on enclosure cost cannot fund firmware development, and one weighted toward project equipment loses site-wide standardisation decisions to broader ranges. Almost every durable position runs both deliberately.

High-value pools concentrate where the drive determines process outcome or connection viability. Precise speed control in process applications and harmonic compliance at constrained connections are the clearest cases, since neither is a price comparison at all. Medium voltage project work pools value similarly, since very few manufacturers hold genuine range capability there. All three sit outside the price comparison entirely.

Volume / Commodity-Adjacent Tier

General purpose variable frequency drives compared on power rating and price against Chinese manufacturers whose costs Western producers cannot approach. Volume builds site standardisation position and contributes very little margin on its own.
Gross Margin: 22-29%

Premium / Certified Tier

Process and application-specific drives where torque holding at zero speed, low speed accuracy, and communication capability genuinely separate suppliers. Process quality rather than energy saving justifies the purchase, which changes the buyer entirely.
Gross Margin: 33-42%

Sustainability / Regulatory / Next-Generation Tier

Active front end, regenerative, and medium voltage equipment carrying harmonic and project engineering content. Best margin by a clear distance, priced against transformer derating and connection limits rather than against any comparable drive.
Gross Margin: 44-54%
frequency-converter-market-portfolio-architecture-1787301889066

Projects, Standards and Retrofits

Revenue arrives through three quite different routes. Original equipment supply into machine builders is volume business at thin margin and long relationships. Plant projects buy in quantity against a design and rarely revisit the choice afterward. Retrofit and replacement is steady, less price sensitive, and frequently triggered by a failure or a harmonic problem rather than by any planned upgrade cycle at all.
Stickiness runs through site standardisation and control integration. A plant that has standardised on one supplier holds spares, trains technicians, and integrates the communication protocol into its control system, and none of that gets repeated for a price difference on the next order. Machine builders stick similarly through firmware integration. General purpose replacement purchases stick hardly at all and are bought on rating and availability.

Buyer profiles shifted as harmonic limits entered connection agreements and efficiency standards reached system level. The earlier buyer was an electrical engineer comparing power ratings and prices. The current conversation increasingly involves a site energy manager and occasionally a utility connection engineer asking about distortion before anything else. Those buyers ask about distortion and system efficiency before comparing any power ratings.
frequency-converter-market-end-use-penetration-index-1787301889555

What We Would Tell a Board

These are among the four positions where our research anticipates prominent divergence between winners and laggards over the coming forecast period. Each is grounded in the demand model, the regulatory perimeter, and the announced capacity pipeline.
01 / SYSTEM LEVEL SELLING

Quote the installation, because the drive price loses

A standard six pulse drive produces around 40% current distortion, and the transformer derating, cable heating, and connection restrictions that follow all land in budgets entirely separate from the one that approved the drive purchase. Roughly 38% of industrial harmonic problems arise from installations where every single unit met its own specification perfectly. Supplying a system harmonic assessment at quotation stage moves the comparison from drive price to installed consequence, which is the only ground where better topologies actually win.
02 / REGENERATIVE APPLICATION TARGETING

Sell where the braking energy is currently wasted

Cranes, hoists, centrifuges, and test rigs all dissipate their braking energy in resistors as heat that the building then has to remove again at further cost. Regenerative topologies recover around 22% of total consumption on those duty cycles, while eliminating the resistor and its cooling load entirely at the same time. Both of those savings are directly measurable rather than merely modelled, which makes the payback argument unusually clean in a market where energy claims are routinely and reasonably disbelieved.
03 / SILICON SUPPLY RESILIENCE

Qualify alternates before the next allocation arrives

Power semiconductors carry roughly 37% of cost of goods sold and come from a small number of specialists who allocate rather than simply sell during any shortage, as lead times exceeding a year through 2021 and 2022 demonstrated across this whole sector. Qualifying alternate switching devices during development costs engineering time and almost no money at all. Doing exactly that same work during an allocation period instead costs a full redesign, an expedite premium, and frequently lost customer delivery slots.
04 / CONTROL FIRMWARE INVESTMENT

Firmware is where the defensible margin actually sits

General purpose drives are compared on power rating and price against Chinese manufacturers whose costs Western producers cannot approach, and that contest has no winner worth having at all. Torque holding at zero speed, low speed accuracy, and communication capability separate suppliers in process applications where product quality rather than energy saving justifies buying the drive. Concentration sits at 56% precisely because control firmware depth is genuinely difficult to develop, and it is where the remaining defensible margin actually sits.

Engagement Snapshot From the Field

A live engagement with an industry participant carrying material or product regulatory and market exposure ahead of a defining policy shift, showing how our research translates into a defensible multi-year portfolio strategy.
MARKET MINDS ADVISORY · CLIENT ENGAGEMENT SUMMARY
Frequency Converter Producer Strategic Portfolio Review and Transition Roadmap 2026·Investment Scenario on Frequency Converter Exposure Evaluation 2025-26
CLIENT PROFILE
An industrial drives manufacturer with approximately 410 million dollars in annual revenue (client-reported, unverified by MMA), selling general purpose and process variable frequency drives across two regions with an active front end range launched three years earlier. Active front end volumes had grown slowly against internal projections, general purpose margin was declining steadily, and management had proposed a general purpose cost reduction programme.
STRATEGIC CHALLENGE
The board questioned whether cost reduction in general purpose drives was winnable against Chinese manufacturing, and wanted an independent view on why the active front end range was underperforming before committing engineering resource to the wrong half of the portfolio entirely. Quotation practice had never been reviewed at all. Win rates varied without explanation.
MMA APPROACH
We reviewed active front end quotations against outcomes, examining whether any system-level harmonic assessment had accompanied them. General purpose cost position was benchmarked against Asian competitors on identical ratings. Won accounts were analysed for what had prompted the specification, and retrofit orders were traced to whatever event had triggered them.
KEY FINDINGS
  1. No active front end quotation reviewed had included a system harmonic assessment, and every comparison had accordingly stopped at the drive unit price itself.
  2. General purpose cost position sat well behind Asian competitors on identical ratings, and no plausible programme closed a gap of that magnitude.
  3. Active front end wins had come almost entirely from sites that had already suffered a transformer derating or a refused connection previously.
  4. Retrofit orders were triggered by harmonic failures rather than by planned upgrades, and carried margins well above new project supply. Nobody had traced the trigger.
CLIENT PROFILE
An industrial drives manufacturer with approximately 410 million dollars in annual revenue (client-reported, unverified by MMA), selling general purpose and process variable frequency drives across two regions with an active front end range launched three years earlier. Active front end volumes had grown slowly against internal projections, general purpose margin was declining steadily, and management had proposed a general purpose cost reduction programme.
STRATEGIC CHALLENGE
The board questioned whether cost reduction in general purpose drives was winnable against Chinese manufacturing, and wanted an independent view on why the active front end range was underperforming before committing engineering resource to the wrong half of the portfolio entirely. Quotation practice had never been reviewed at all. Win rates varied without explanation.
MMA APPROACH
We reviewed active front end quotations against outcomes, examining whether any system-level harmonic assessment had accompanied them. General purpose cost position was benchmarked against Asian competitors on identical ratings. Won accounts were analysed for what had prompted the specification, and retrofit orders were traced to whatever event had triggered them.
KEY FINDINGS
  1. No active front end quotation reviewed had included a system harmonic assessment, and every comparison had accordingly stopped at the drive unit price itself.
  2. General purpose cost position sat well behind Asian competitors on identical ratings, and no plausible programme closed a gap of that magnitude.
  3. Active front end wins had come almost entirely from sites that had already suffered a transformer derating or a refused connection previously.
  4. Retrofit orders were triggered by harmonic failures rather than by planned upgrades, and carried margins well above new project supply. Nobody had traced the trigger.
RECOMMENDED STRATEGY
Phase 1: Phase 1 (months one to nine): cancel the general purpose cost programme, build harmonic assessment capability into the quotation process. Phase 2: Phase 2 (months nine to twenty-one): target sites with constrained connections and known distortion issues rather than broad market coverage. Phase 3: Phase 3 (months twenty-one to thirty-six): redirect engineering resource toward control firmware and process application capability. across both product ranges.
OUTCOME
The general purpose cost programme was cancelled. Harmonic assessment accompanied every active front end quotation within two quarters and win rates improved materially, while engineering resource moved to firmware development that general purpose cost work would have consumed (client-reported, unverified by MMA). General purpose margin was accepted as structurally limited.

Frequently Asked Questions

Foundational context covering the market sizes, CAGR, scope, country, region and competition that inform every finding below. This section is provided to cover basics and most often pre-purchase conversations, answered from the MMA Primary Research Dataset.

What is the current size of the Frequency Converter Market?

The market is valued at USD 24.5 billion in 2025, rising to USD 26.24 billion in 2026. Scope covers electronic frequency converters for motor speed control and frequency conversion, not soft starters, inverters, or the motors themselves.

How large will the Frequency Converter Market be by 2036?

MMA forecasts USD 52.11 billion by 2036, an increase of USD 25.87 billion over the 2026 base. That represents an expansion multiple of 1.99 times across the forecast period.

What is the CAGR for the Frequency Converter Market 2026 to 2036?

The base case CAGR is 7.1%, with a bull case of 8.3% and a bear case of 5.9%. The historical rate from 2020 to 2025 was 5.9%, constrained more by semiconductor allocation than by demand.

Which segment is growing fastest?

Active front end and regenerative converters at 10.7%, exactly 1.50 times the market rate. They cut current distortion from around 40% while returning braking energy to the supply rather than wasting it.

Who are the major companies in the Frequency Converter Market?

ABB, Siemens, Danfoss, Schneider Electric, and Mitsubishi Electric lead on units shipped weighted by power rating. The top five hold 56%, on power semiconductor access and control firmware depth.

Which country is growing fastest?

India at 9.2%, where industrial capacity investment across chemicals, cement, textiles, and water infrastructure is proceeding simultaneously while motor efficiency standards pull drive attachment upward.

Report Segmentation Architecture

The full report scope spans multiple orthogonal segmentation dimensions, with cross-tabulated demand data provided for each dimension pair. Coverage extends further to regional breakdowns, trend trajectories, and the competitive detail needed to support segment-level decision-making.

By Converter Topology And Supply Role

  • General Purpose Variable Frequency Drives
  • Active Front End And Regenerative Converters
  • Medium Voltage Drives
  • Static Frequency Converters For Supply Conversion
  • Integrated Motor Drive Units

By End-Use Industry

  • Water, Wastewater And Municipal Utilities
  • Chemicals, Oil, Gas And Process Industry
  • Data Centres And Building Services
  • Metals, Mining And Cement
  • Machine Building And Material Handling

By Commercial Model

  • Original Equipment Supply To Machine Builders
  • Plant Project And Systems Integration Supply
  • Distributor And Panel Builder Channels
  • Retrofit And Replacement Direct Supply
  • Service, Commissioning And Harmonic Assessment

By Region

  • East Asia
  • Western Europe
  • North America
  • South Asia and Pacific
  • Latin America
  • Middle East and Africa
  • Eastern Europe

Scope, Methodology, and Coverage

Every figure in this report is reproducible from documented input assumptions. The scope below maps the historical period, the forecast horizon, the segmentation dimensions, and the countries covered, alongside the underlying primary and qualitative methodology.
Historical Period
2020 to 2025
Forecast Period
2026 to 2036
Base Year
2025 (USD billions; MMA Primary Research Dataset, August 2026)
Market Definition
This market comprises electronic frequency converters used to vary the speed of alternating current motors and to convert between supply frequencies, measured at manufacturer revenue across original equipment, project, distribution, and retrofit channels. Coverage spans general purpose variable frequency drives, active front end and regenerative converters, medium voltage drives above one thousand volts, static frequency converters for aviation, marine and rail supply conversion, and integrated motor drive units combining electronics with the motor. Soft starters without continuous speed control, direct current motor controllers, uninterruptible power supplies, solar and battery storage inverters, servo drives sold with motion controllers, and the electric motors themselves fall outside scope.
Quantitative Units
USD billions (current prices); converter units shipped weighted by power rating; installed kilowatts under drive control; harmonic distortion by topology
Segmentation Dimensions
By Converter Topology And Supply Role; By End-Use Industry; By Commercial Model; By Region
Regions Covered
East Asia, Western Europe, North America, South Asia and Pacific, Latin America, Middle East and Africa, Eastern Europe
Countries Covered
China, Japan, South Korea, Taiwan, Germany, Denmark, Finland, France, Italy, Switzerland, United Kingdom, United States, Canada, Mexico, India, Thailand, Australia, Brazil, Chile, Peru, Saudi Arabia, United Arab Emirates, South Africa, Poland, Czechia, and additional markets relevant to this sector
Key Companies Profiled
ABB, Siemens, Danfoss, Schneider Electric, Mitsubishi Electric, Yaskawa Electric, Rockwell Automation, Fuji Electric, Toshiba, Hitachi, WEG, Nidec Industrial Solutions, Delta Electronics, Inovance Technology, Shenzhen Veichi, Invt Electric, Lenze, SEW-Eurodrive, Bonfiglioli, TMEIC
Quantitative Methodology
Primary survey, n=3,800 respondents, Q4 2025, six countries; demand-side model with trade association cross-validation
Qualitative Methodology
47 expert interviews, Q4 2025; applied to validate demand model assumptions, identify emerging dynamics, and assess competitive positioning
Report Format
PDF and XLSX data workbook (Word format preview document)
Publisher
Market Minds Advisory
Report Code
MMA-2026-TEC-686
Published
August 2026
Contact
sales@marketmindsadvisory.com | www.marketmindsadvisory.com

Purchase the full Frequency Converter Market Report (2026 to 2036).

The full report sizes frequency converters across five topologies, five end-use industries, five commercial models, and seven regions, with harmonic performance analysed separately from energy saving claims throughout. Installed consequence including transformer derating and connection limits is modelled against drive price, since that comparison rather than any product attribute decides active front end adoption. Harmonic enforcement practice is mapped by utility and region. Competitive profiling covers twenty companies on units shipped weighted by power rating, semiconductor sourcing exposure is assessed across active design populations, and regenerative recovery is quantified by application duty cycle.
Harmonic performance analysed separately from energy saving claims
Installed consequence modelled against drive purchase price comparison
Harmonic enforcement practice mapped by utility and region
Semiconductor sourcing exposure assessed across active design populations
Regenerative recovery quantified by application duty cycle pattern
Control firmware capability separated from enclosure and assembly cost

Built For The People Who Decide

From boardroom strategy to bench-side execution, this report is read cover-to-cover by leaders shaping the next decade of their industry, turning demand scenarios, market dynamics and valuation benchmarks into decisions.
CXOs/ Presidents/ VPs/ Managers
M&A and Corporate Development
Strategy Teams and R&D Heads
Procurement and Product Directors
Regulatory and Compliance Leaders
Investor Relations and Equity Analysts