

Market Minds Advisory
Freight Transport Management Market

Freight Transport Management Market: Freight Transport Management Market. Global Forecast and Competitive Analysis 2026 to 2036

AI-driven freight matching is letting shippers and carriers find capacity in minutes rather than the phone calls and spot-market negotiation that historically defined truckload booking, pulling budget away from manual brokerage toward algorithmic.

Lead Analyst

Published

September 2026

Make Smarter Decisions with Customized Research Insights

Request a free sample report and evaluate market opportunities, growth trends, and competitive dynamics relevant to your business needs.

2025 MARKET VALUE$10.5BMarket Size 2025
2036 FORECAST VALUE$31.5BBase Case , 2026 to 2036
CAGR 2026 TO 203610.5 %Bull 11.8% / Bear 9.2%
INCREMENTAL OPPORTUNITY$19.9BNet 10- year value creation
EXPANSION MULTIPLE2.71x2036 value over 2026 base
Strategic Levers
M&A Pipeline
Regional Outlook
Country Rankings
Competitive Intelligence
Segmental Deep-dive
Call-Us : 91 93563 13602

Executive Snapshot and Market Trajectory.

AI-driven freight matching is letting shippers and carriers find capacity in minutes rather than the phone calls and spot-market negotiation that historically defined truckload booking reflecting sustained shipper investment across logistics optimization programs as adoption continues expanding across freight brokerage and carrier networks supporting consistent shipment volume growth across enterprise.
Adoption concentrates among large shippers, freight brokers, and third-party logistics providers coordinating truckload and less-than-truckload shipments across expanding distribution networks. North America accounts for the largest share of platform spending given its concentration of leading freight technology vendors and the scale of its domestic trucking market reflecting sustained shipper investment across logistics optimization programs as adoption continues expanding across freight brokerage and carrier networks supporting consistent shipment volume growth across enterprise.
Competition remains fragmented between established enterprise transportation management platforms like Oracle and Blue Yonder and specialized visibility and matching entrants like project44 and FourKites expanding into broader planning functionality. Evolving carrier capacity constraints and real-time visibility expectations continue reshaping which vendors can compete credibly for large shipper enterprise contracts reflecting sustained shipper investment across logistics optimization programs as adoption continues expanding across freight brokerage.
Market Definition
This report defines the Freight Transport Management market as software platforms that plan, execute, track, and optimize the movement of freight across truckload, less-than-truckload, rail, ocean, and air transportation modes, including rate procurement, carrier selection, real-time visibility, and last-mile delivery coordination. It excludes warehouse management systems without transportation-specific functionality, general enterprise resource planning software without dedicated freight management modules, and physical freight brokerage services sold without accompanying software platform capability.
Base Year Value
$10.5B in 2025 (MMA Primary Research Dataset, September 2026)
Forecast Period
2026 to 2036, eleven discrete annual values
CAGR
10.5% base case. Bull 11.8%. Bear 9.2%.
Fastest Growth Segment
AI-Driven Predictive Freight Matching Platforms: 20.0% CAGR
Fastest Growth Country
India: 13.5% CAGR
Fastest Growth Region
South Asia and Pacific: 12.5% CAGR
Largest Region
North America: 32% of 2025 global value
Market Leaders
Oracle Corporation, SAP SE, Blue Yonder Group Inc, Manhattan Associates Inc, Descartes Systems Group Inc. Source: MMA Analysis, company disclosures, July 2026.
Primary Survey
n=3,800 procurement and R&D decision-makers, Q4 2025, six countries
Methodology
Demand-side build-up, cross-validated against public data, 47 expert interviews

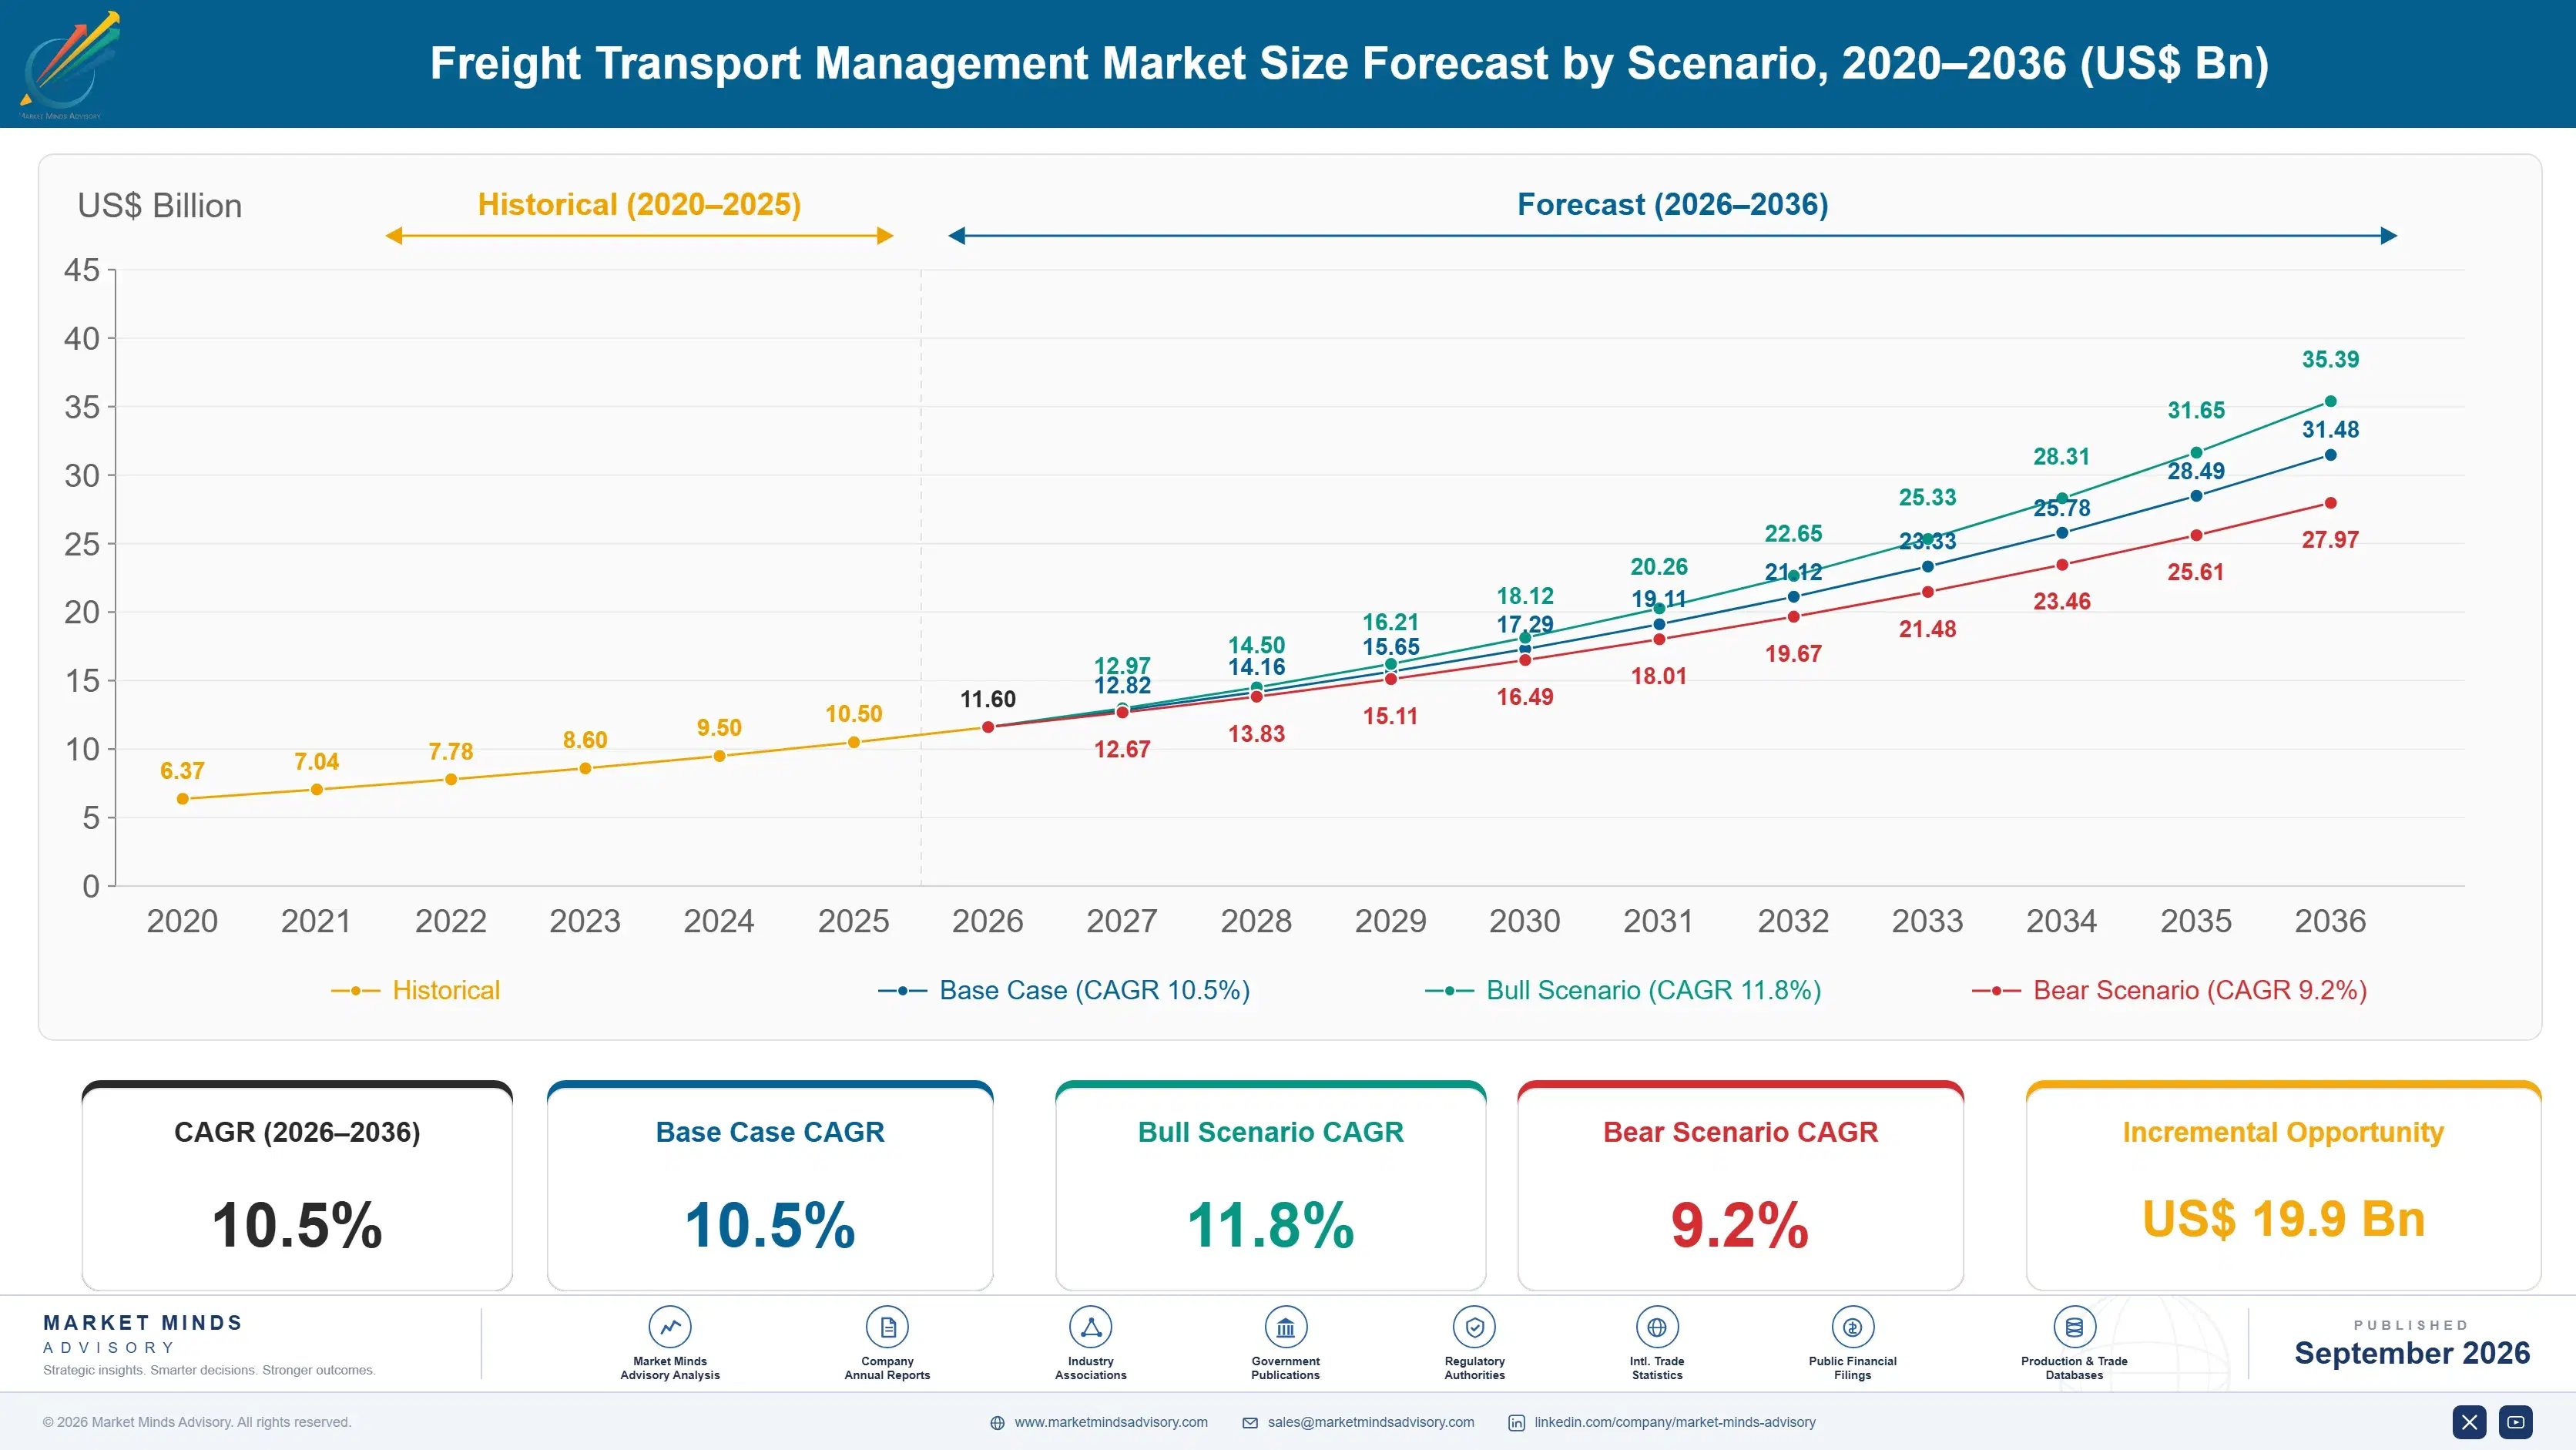
Freight Transport Management Market Forecast Scenarios

freight-transport-management-market-size-forecast-scenario-1789989334149
Between 2020 and 2025 the market grew steadily as supply chain disruption exposed the limitations of manual freight coordination processes, with growth remaining strong as shippers continued investing in visibility and planning software well after the most acute disruption pressures eased reflecting sustained shipper investment across logistics optimization programs as adoption continues expanding across freight brokerage and carrier networks supporting consistent.
The base case assumes continued AI-driven freight matching adoption, expanding real-time visibility platform integration, and steady last-mile delivery software investment tied to e-commerce fulfillment growth. These three mechanisms together sustain steady growth through the decade even as established enterprise resource planning vendors bundle basic transportation management capability into broader supply chain suites at lower incremental cost reflecting sustained shipper investment across logistics optimization programs as adoption continues expanding across freight brokerage and carrier networks supporting consistent shipment.
The bull case assumes faster-than-expected AI-driven freight matching adoption across shippers seeking to reduce dependency on manual brokerage relationships. The bear case assumes a broader freight capacity oversupply cycle reduces urgency for advanced optimization software among shippers facing abundant and inexpensive carrier capacity reflecting sustained shipper investment across logistics optimization programs as adoption continues expanding across freight brokerage and carrier.

Algorithmic Matching Displaces Manual Freight Brokerage

Freight transport management has moved from a back-office logistics administration tool to strategic supply chain infrastructure as AI-driven matching meaningfully reduces the manual coordination effort shippers and brokers previously required reflecting sustained shipper investment across logistics optimization programs as adoption continues expanding across freight brokerage and carrier networks supporting consistent shipment volume growth across enterprise supply chains reinforcing demand visibility for vendors planning capacity ahead.
MARKET CONCENTRATIONCR5 38%Reflects considerable fragmentation among established and emerging vendors reflecting.
AVERAGE CONTRACT VALUE$275,000Shows considerable variation by shipper scale and platform functionality.
TOP ADOPTING COUNTRY SHAREUSA 27%Reflects concentrated large shipper and freight broker adoption domestically.
CLOUD DEPLOYMENT SHARE74%Indicates strong preference for cloud over on-premises deployment models.
TRADE INTENSITY31%Shows moderate cross-border vendor licensing relative to domestic deployment.
ENGINEERING COST SHARE49%Reflects skilled software engineering talent dominating total delivery expense.
Large shippers and third-party logistics providers remain the primary growth engine, coordinating shipment volumes that manual phone-based brokerage could never scale to match efficiently. Carrier capacity volatility remains a meaningful consideration for shippers evaluating platform investment during periods of fluctuating freight market conditions reflecting sustained shipper investment across logistics optimization programs as adoption continues expanding across freight brokerage and carrier networks supporting consistent shipment volume.
Vendors increasingly compete on real-time visibility accuracy and predictive matching capability rather than basic rate lookup functionality alone, since shippers now expect platforms that anticipate capacity constraints rather than simply displaying available rates reflecting sustained shipper investment across logistics optimization programs as adoption continues expanding across freight brokerage and carrier networks supporting consistent shipment volume growth across enterprise supply chains.
"Freight brokerage used to be a relationship business built on phone calls and favors. The platforms winning share now are the ones that turned matching into a data problem, and that shift is uncomfortable for anyone whose value proposition was personal carrier relationships alone."
Director, Logistics and Freight Technology Practice · MMA Technology: Logistics and Freight Management Software Practice · September 2026

Market Trends

AI Matching Replaces Manual Load Board Searching

Freight brokers and shippers are replacing manual load board searching with AI-driven matching platforms that automatically pair available carrier capacity with shipment requirements based on historical performance and predicted availability. project44 and FourKites have both expanded predictive matching capability considerably as shippers seek to reduce the hours previously spent manually searching load boards and calling carriers directly. This shift is pulling budget toward higher specification platforms that cost more per shipment managed but deliver considerably faster capacity sourcing than manual brokerage processes ever achieved reflecting sustained shipper investment across logistics optimization programs as adoption continues expanding.
Market Impact: Adds 30 million daily delivery stops.

Real-Time Visibility Becomes a Baseline Shipper Expectation

Real-time shipment visibility has moved from a premium feature to a baseline expectation among enterprise shippers, who increasingly refuse to work with carriers or brokers unable to provide continuous tracking data throughout transit. FourKites and project44 have both expanded visibility platform integration considerably as large retailers and manufacturers require tracking compliance across their entire carrier network. This shift is pulling forward visibility platform adoption budget that otherwise might have remained an optional add-on rather than a mandatory carrier onboarding requirement reflecting sustained shipper investment across logistics optimization programs as adoption continues expanding across freight brokerage and.
Market Impact: Reduces spot market exposure 25 percent.

Market Opportunities and Growth Drivers

E-Commerce Fulfillment Growth Expands Last-Mile Complexity

E-commerce fulfillment continues expanding considerably across major consumer markets, directly increasing last-mile delivery coordination complexity that manual dispatch processes struggle to manage efficiently at scale. Large e-commerce fulfillment operators have brought considerably more daily delivery volume online over the past several years across major metropolitan markets. Same-day and next-day delivery commitments continue expanding across retail categories, requiring increasingly sophisticated last-mile routing optimization. These fulfillment commitments create predictable multi-year demand visibility that last-mile software vendors increasingly build long-term platform contracts around reflecting sustained shipper investment across logistics optimization programs as adoption continues expanding across freight brokerage and.
Market Impact: Cuts standalone platform demand 12 percent.

Carrier Capacity Volatility Drives Optimization Investment

Ongoing carrier capacity volatility across the trucking industry continues pressuring shippers to invest in optimization software that can adapt sourcing strategy quickly as available capacity and pricing fluctuate considerably between market cycles. Blue Yonder and Oracle have both expanded dynamic optimization capability considerably as shippers seek to reduce exposure to spot market price volatility through smarter capacity planning. This volatility pressure creates durable multi-year demand visibility for optimization vendors independent of any single freight market cycle alone reflecting sustained shipper investment across logistics optimization programs as adoption continues expanding across freight brokerage and carrier networks supporting.
Market Impact: Extends carrier integration timelines 6 weeks.

Market Restraints and Challenges

ERP Vendor Bundling Erodes Standalone Platform Demand

Established enterprise resource planning vendors increasingly bundle basic transportation management capability directly into their broader supply chain suite offerings at minimal incremental cost, threatening demand for standalone specialized freight vendors serving less complex logistics needs. The root cause is that basic rate lookup and carrier selection functionality has become technically straightforward enough that ERP vendors can offer adequate capability without requiring shippers to purchase separate specialized software. This compresses the addressable market for standalone vendors serving simpler shipping needs specifically. Several specialized vendors are responding by pushing further into AI-driven matching and predictive visibility capability that.
Market Impact: Cuts capacity sourcing time 55 percent.

Fragmented Carrier Technology Adoption Complicates Integration

Shippers integrating with a diverse carrier network face considerable technology fragmentation, since individual carriers vary widely in their own technology sophistication and data-sharing capability. The root cause traces to the trucking industry's fragmented structure, comprising many small carriers alongside a smaller number of large fleets, each adopting technology at considerably different paces. This raises integration engineering cost for shippers seeking comprehensive visibility across their entire carrier base. Vendors including project44 are addressing this through standardized carrier connectivity programs that reduce redundant integration work across similar carrier technology profiles reflecting sustained shipper investment across logistics optimization programs.
Market Impact: Lifts visibility mandate compliance 40 percent.
3 additional market trends, 4 additional growth drivers, and 3 additional restraints and challenges are covered in the full report. Contact sales@marketmindsadvisory.com to access the complete intelligence.

Segment CAGR and Growth Architecture

MMA segments the Freight Transport Management market by function, since this dimension best explains where margin and growth concentrate as platforms shift from static rate lookup toward AI-driven predictive matching and last-mile optimization capability reflecting sustained shipper investment across logistics optimization programs as adoption continues expanding across freight brokerage and carrier networks supporting consistent shipment volume growth.
freight-transport-management-market-market-share-analysis-1789989334717

AI-Driven Predictive Freight Matching Platforms

This segment covers platforms using machine learning to predict carrier capacity availability and automatically match shipments with optimal carriers rather than relying on manual load board searching and phone-based negotiation. project44 and FourKites have both expanded predictive matching capability considerably, proving that models trained on sufficient historical shipment data can meaningfully outperform manual brokerage on both speed and cost efficiency. Growth here runs at roughly 1.90 times the overall market rate because shippers increasingly treat predictive matching as essential infrastructure rather than an experimental capability reserved for the largest logistics operations alone reflecting sustained shipper investment across logistics optimization programs as adoption continues expanding across freight brokerage and carrier networks supporting consistent shipment volume growth.
CAGR 20.0%

Last-Mile Delivery Management Software

This segment covers platforms that optimize final delivery routing and dispatch for e-commerce fulfillment operations, addressing the growing complexity of same-day and next-day delivery commitments retailers increasingly compete on. Descartes and Manhattan Associates have both expanded last-mile routing capability considerably as e-commerce fulfillment volume continues climbing across major consumer markets. Growth trails predictive freight matching only because last-mile optimization remains a more specialized capability requiring deeper local delivery network integration than broader freight matching alone provides. Providers report meaningfully reduced delivery cost per stop for customers adopting comprehensive last-mile optimization compared with manual dispatch alone reflecting sustained shipper investment across logistics optimization programs as adoption continues expanding across freight brokerage and carrier networks supporting consistent.
CAGR 15.0%
Full segment breakdown across 6 segments available in the complete report.

Regional Architecture and Country Demand Map

Demand concentrates where large shipper density and freight technology vendor headquarters intersect most directly. North America holds the largest share given its concentration of leading platforms and domestic trucking market scale reflecting sustained shipper investment across logistics optimization programs as adoption continues expanding across freight brokerage and.

North America

The United States anchors this region through its concentration of leading freight technology vendors including Oracle, Blue Yonder, and project44 headquartered domestically, alongside the world's largest domestic trucking market coordinating vast freight volumes daily. Large e-commerce fulfillment operators and retail shippers across major metropolitan markets drive substantial platform spending tied to visibility and matching capability. Canada contributes meaningful additional demand tied to its own cross-border freight coordination with the United States. Continued AI-driven matching adoption keeps expanding the addressable enterprise opportunity steadily each year reflecting sustained shipper investment across logistics optimization programs as adoption continues expanding across freight brokerage and carrier networks supporting consistent shipment volume growth across enterprise supply chains reinforcing demand visibility for.
Share: 32% | CAGR: 10.5% (2026 to 2036)

Western Europe

Germany and the Netherlands anchor regional demand through their concentration of logistics and freight forwarding operations serving cross-border European Union trade. France and the United Kingdom contribute additional demand tied to their own domestic freight coordination and e-commerce fulfillment sectors. European shippers increasingly integrate freight management with broader supply chain visibility platforms rather than deploying standalone transportation tools in isolation. Growth trails East Asia and South Asia somewhat because many European enterprises adopted foundational transportation management tooling earlier under initial digitization programs reflecting sustained shipper investment across logistics optimization programs as adoption continues expanding across freight brokerage and carrier networks supporting consistent shipment volume growth across enterprise supply chains reinforcing demand visibility for vendors planning.
Share: 22% | CAGR: 9.0% (2026 to 2036)
Regional intelligence for 5 additional markets available in the complete report: East Asia, South Asia and Pacific, Latin America, Middle East and Africa, Eastern Europe. Contact sales@marketmindsadvisory.com.
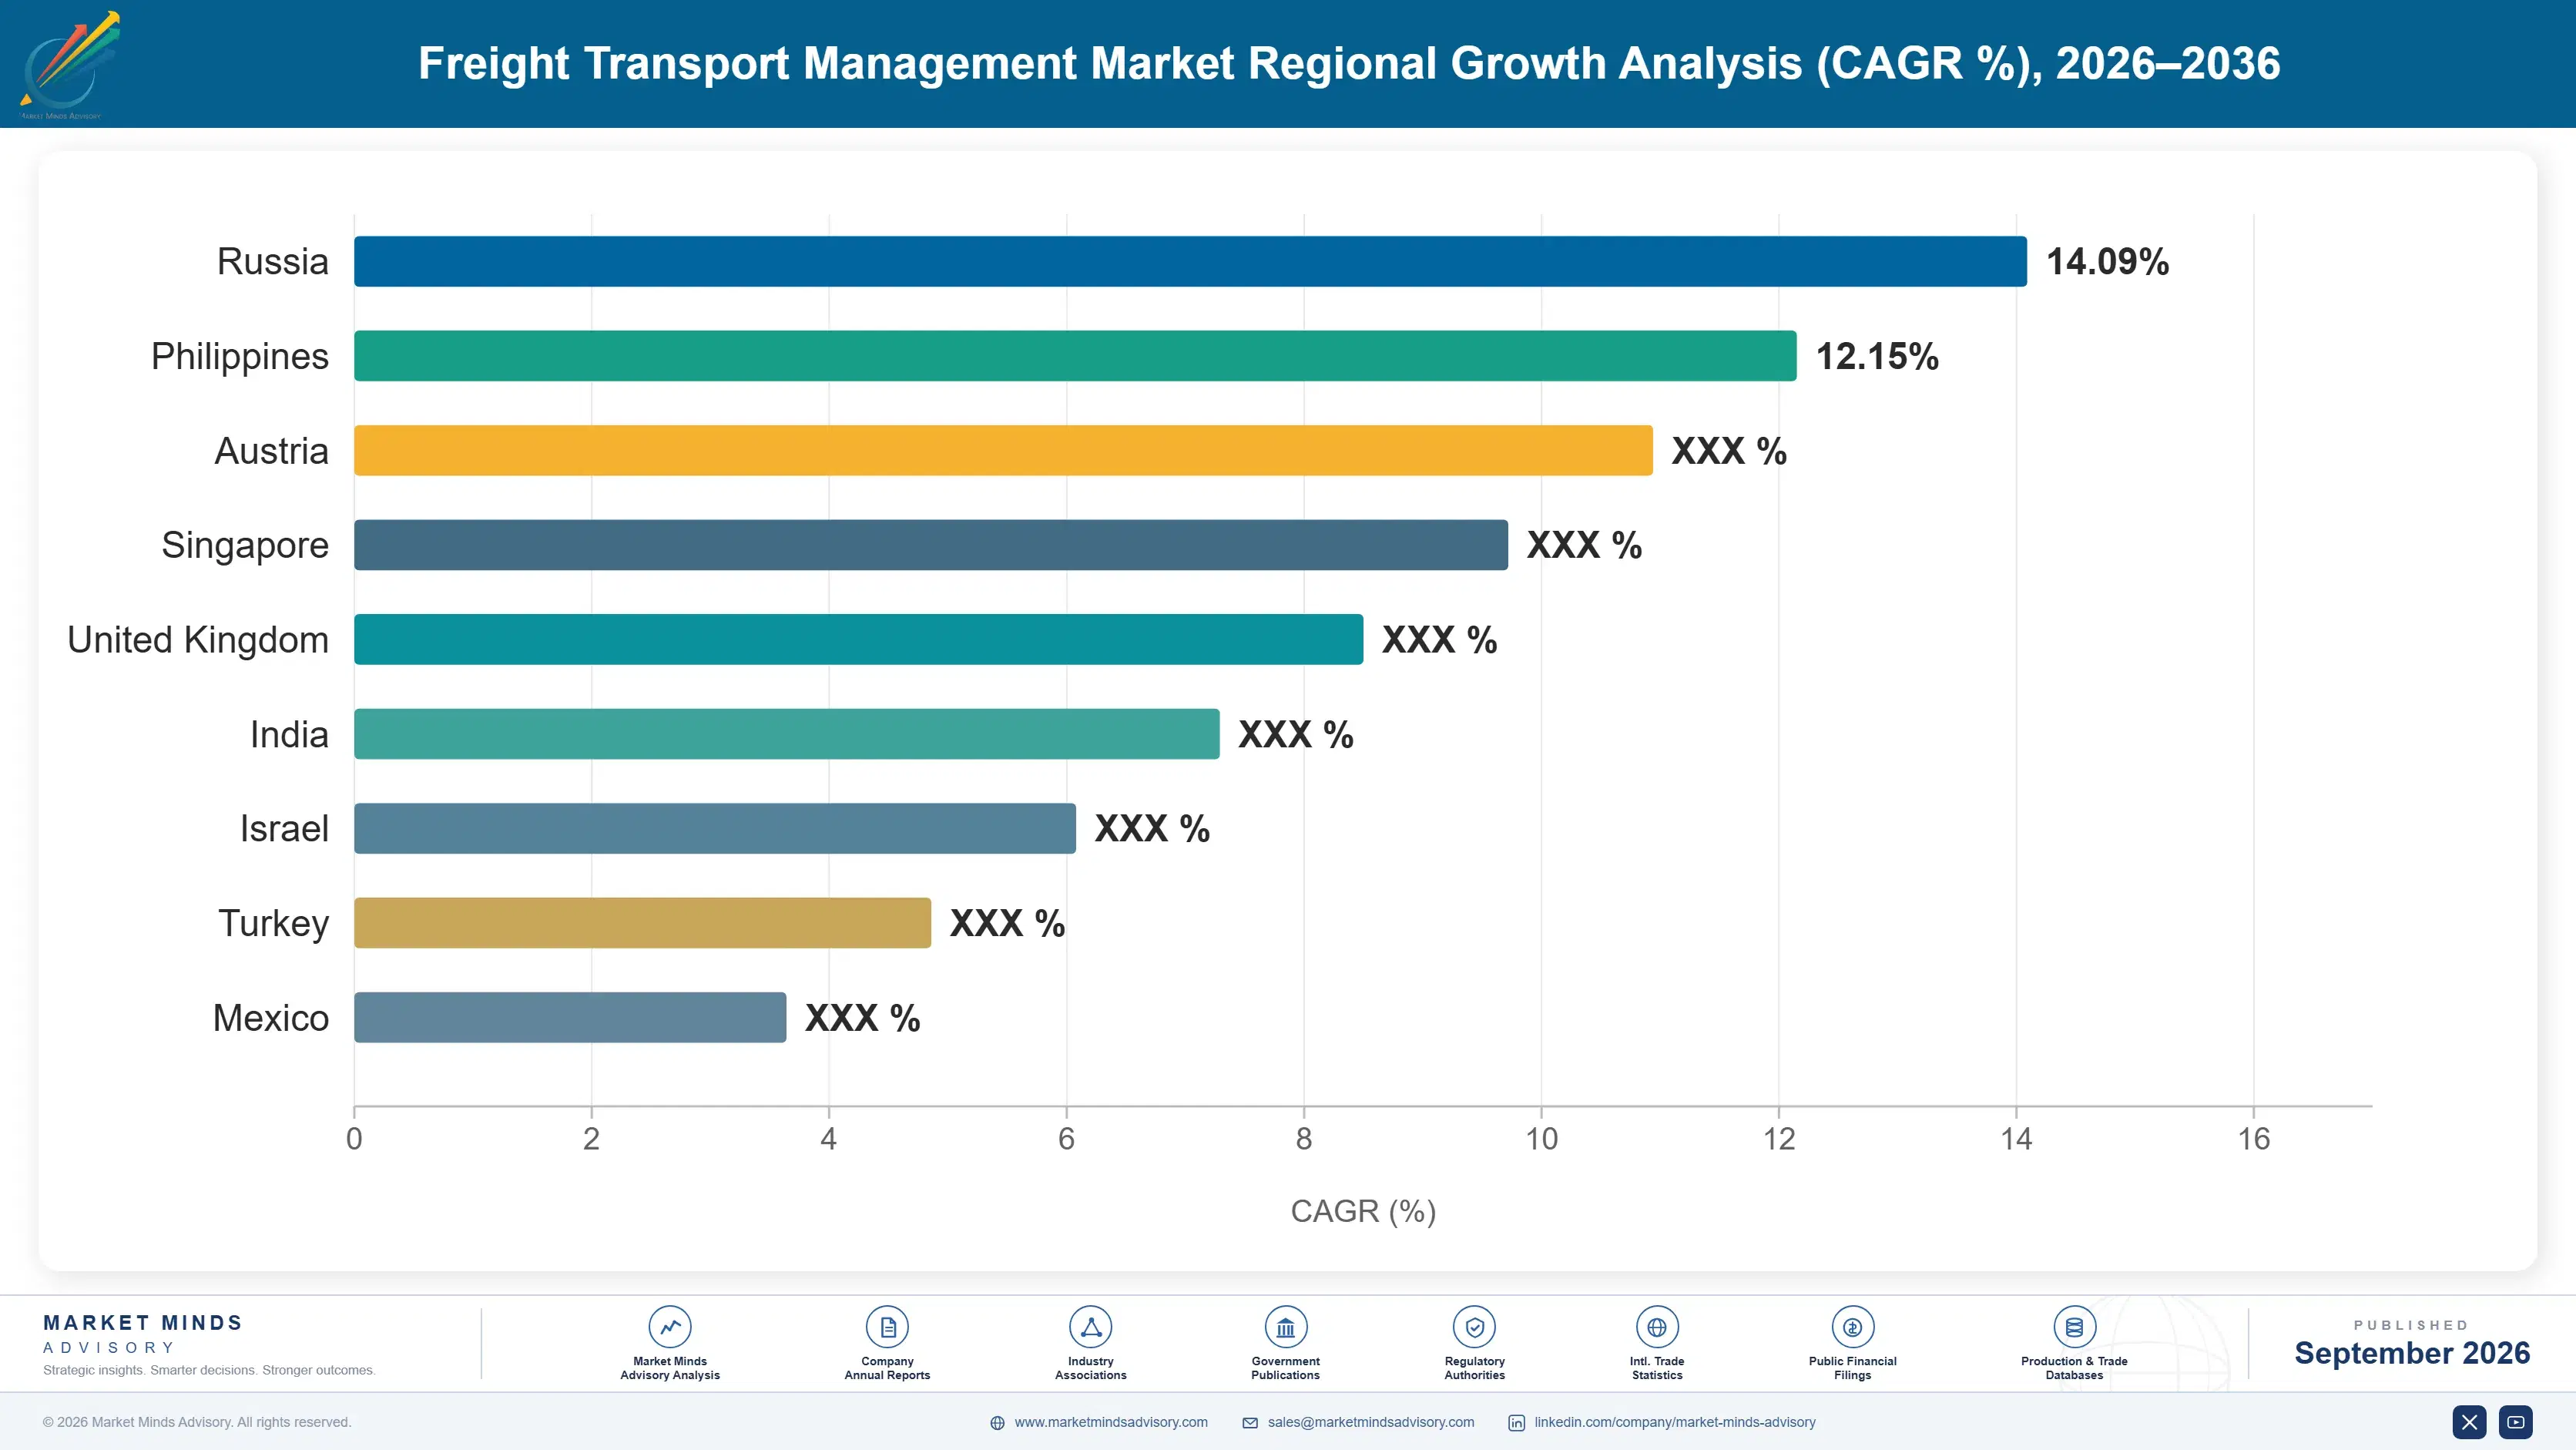
freight-transport-management-market-country-cagr-analysis-1789989335267

Converting Visibility Contracts Into Optimization Revenue

Vendors expand revenue less through new shipper wins and more through deepening optimization capability within existing accounts, since predictive matching creates durable multi-year platform attachment once shippers trust automated capacity sourcing reflecting sustained shipper investment across logistics optimization programs as adoption continues expanding across freight brokerage and carrier networks supporting consistent shipment volume growth across enterprise supply.

Bundling Predictive Matching Into Visibility Contracts

Vendors increasingly attach predictive freight matching capability to existing visibility platform contracts rather than selling it as a standalone product, capturing incremental revenue from shippers that already trust the underlying platform with their shipment tracking data. project44 and FourKites both report that shippers upgrading to matching modules increase total contract value by roughly 27 percent on average, since the upgrade requires no new vendor validation cycle and no data migration risk. This bundling motion converts existing visibility relationships into higher margin annuity revenue considerably faster than winning entirely new shipper accounts reflecting sustained shipper investment across.
Market Impact: Lifts average contract value by 27 percent reflecting.

Expanding Into Adjacent Freight Payment and Audit Services

Freight management vendors are pushing further into adjacent freight payment and invoice audit services, using the same shipment and rate data already flowing through their platform to automate carrier payment reconciliation. This expansion strategy lets vendors compete for a considerably larger portion of a shipper's total logistics operations budget instead of remaining confined to planning and visibility software alone. Oracle and Descartes have both expanded payment and audit offerings this way, and MMA estimates customers adopting payment services generate roughly 33 percent higher lifetime contract value reflecting sustained shipper investment across logistics optimization programs as adoption.
Market Impact: Payment accounts show 33 percent higher value reflecting.

Who Controls the Margin Pool

The freight transport management market remains considerably fragmented, with the top five vendors together holding an estimated 38 percent of the market measured on annual recurring revenue, leaving substantial share distributed across specialized and regional providers reflecting sustained shipper investment across logistics optimization programs as adoption continues expanding across freight brokerage and carrier networks supporting consistent shipment volume growth across enterprise supply.
Oracle and Blue Yonder lead among vendors serving the largest enterprise shippers with comprehensive planning and execution needs, while SAP and Manhattan Associates compete more broadly across integrated supply chain suite portfolios. Descartes holds a distinct position built around cross-border customs and global trade compliance specifically. Competitive activity currently centers on expanding AI-driven matching capability and real-time visibility breadth rather than aggressive new account price.

Emerging pressure comes from specialized visibility platforms including project44 and FourKites, which offer faster implementation timelines for real-time tracking specifically than legacy enterprise planning platforms typically provide. Rankings could shift meaningfully over the next several years if these smaller vendors successfully move upmarket into larger comprehensive planning contracts currently held by established platforms reflecting sustained shipper investment across logistics optimization programs as adoption.
freight-transport-management-market-company-positioning-matrix-1789989335801

Competitive Moat and Risk Dimensions

ORACLE CORPORATION

Moat: Deep Enterprise Supply Chain Integration

Oracle's transportation management platform integrates deeply with its broader enterprise resource planning and supply chain portfolio, creating switching costs since large shippers value having freight planning, financials, and inventory management within a single connected vendor relationship reflecting sustained shipper investment across logistics optimization programs as adoption continues expanding across freight brokerage and.
ORACLE CORPORATION

Risk: Slower Innovation Pace

Oracle's broader enterprise software portfolio focus can slow product innovation pace compared with specialized competitors like project44, leaving it more exposed as shippers increasingly prioritize predictive matching capability that legacy platform architecture was not originally designed to support efficiently reflecting sustained shipper investment across logistics optimization programs as adoption continues expanding across.
PROJECT44 INC

Moat: Broadest Carrier Connectivity Network

project44 has built connectivity with a considerably broader carrier network than most competitors, giving shippers visibility coverage across a wider range of carriers without requiring separate integration work for each new carrier relationship added reflecting sustained shipper investment across logistics optimization programs as adoption continues expanding across freight brokerage and carrier networks.
PROJECT44 INC

Risk: Narrower Planning Capability

project44's visibility-first origin leaves it with less comprehensive planning and optimization functionality than established enterprise platforms like Oracle, potentially limiting its competitiveness for shippers seeking a single comprehensive platform rather than specialized point solutions reflecting sustained shipper investment across logistics optimization programs as adoption continues expanding across freight brokerage and carrier networks.

Players Tracked

Prominent Players

Oracle Corporation
SAP SE
Blue Yonder Group Inc
Manhattan Associates Inc
Descartes Systems Group Inc

Other Key Players

Trimble Inc
MercuryGate International Inc
project44 Inc
FourKites Inc
Uber Freight LLC
C.H. Robinson Worldwide Inc
E2open Parent Holdings Inc
Alvys Inc
Samsara Inc
Motive Technologies Inc
Loadsmart Inc
Turvo Inc
Körber AG
Fortna Inc
Kinaxis Inc

Recent Developments

APRIL 2026

project44 Inc: Product Launch

project44 launched an expanded predictive matching module integrated with its visibility platform, adding carrier capacity forecasting capability that recommends optimal booking timing based on predicted market conditions across major freight lanes reflecting sustained shipper investment across logistics optimization programs as adoption continues expanding across freight brokerage and.
Signal: Signals accelerating vendor investment in predictive capacity forecasting as a core differentiator reflecting sustained shipper investment across logistics.
OCTOBER 2025

Blue Yonder Group Inc: Acquisition

Blue Yonder acquired a smaller specialized last-mile routing optimization firm to strengthen its fulfillment suite, adding targeted capability that improves delivery efficiency for e-commerce retail customers managing growing delivery volumes reflecting sustained shipper investment across logistics optimization programs as adoption continues expanding across freight brokerage and carrier.
Signal: Signals consolidation pressure on smaller specialized last-mile routing vendors serving retail customers reflecting sustained shipper investment across logistics.

Software Engineering Talent Cost Exposure

Skilled software engineering and machine learning talent represents the largest cost input for freight management vendors, with engineering compensation alone commonly running 45 to 55 percent of cost of goods sold. Specialized logistics optimization and predictive matching engineering talent is sourced primarily from a limited pool concentrated in major technology hubs, creating dependency on expensive specialized hiring reflecting sustained shipper investment across.
Logistics software engineering compensation rose noticeably through 2025 as broader technology sector demand for machine learning talent strained hiring across freight technology and supply chain vendors specifically, based on named company annual reports discussing rising research and development compensation expense. Vendors building predictive matching capability absorbed higher engineering costs during this period, compressing margin for providers unable to pass increases through under fixed multi-year shipper contracts signed before the compensation increase took.

Smaller vendors face a meaningfully worse cost position than the largest platforms, since they lack the compensation budget to compete for scarce logistics optimization talent against well-funded technology companies. This leaves smaller specialized vendors more exposed to talent cost volatility than Oracle or Blue Yonder, which can offer considerably broader career paths and compensation packages unavailable to smaller competitors reflecting sustained shipper.
freight-transport-management-market-cost-volatility-analysis-1789989335996

Distributed Engineering Talent Sourcing

Larger vendors increasingly hire logistics optimization engineering talent across multiple geographic markets rather than concentrating hiring in the most expensive technology hubs, reducing average compensation cost while still accessing sufficiently qualified specialized talent pools globally reflecting sustained shipper investment across logistics optimization programs as adoption continues expanding across freight brokerage and carrier networks supporting consistent shipment volume.

Reusable Carrier Integration Adapter Libraries

Vendors are investing in reusable prebuilt carrier integration adapter libraries covering the most common carrier technology platforms, reducing the engineering hours required per new customer deployment without sacrificing integration quality meaningfully reflecting sustained shipper investment across logistics optimization programs as adoption continues expanding across freight brokerage and carrier networks supporting consistent shipment volume growth across enterprise supply.

Portfolio Architecture for Margin Defence

Freight management vendors organize their portfolios across three distinct tiers separated primarily by predictive sophistication and carrier network breadth rather than simple feature count. Volume tier offerings serve basic rate lookup and booking needs with thinner margins, while premium tiers targeting AI-driven matching command considerably higher margin given the algorithm investment competitors must match reflecting sustained shipper investment across logistics optimization programs as adoption continues.
The tension between volume and premium positioning shows clearly in how vendors price predictive matching add-ons: basic booking customers pay comparatively little for standard rate lookup, while shippers seeking comprehensive capacity optimization pay substantially more for the same underlying technology wrapped in predictive forecasting and carrier network breadth. High-value margin pools concentrate specifically around AI-driven matching and last-mile optimization reflecting sustained shipper investment across logistics.

Sustainability and next-generation tier offerings, including AI-driven matching and freight payment audit automation, currently represent a smaller revenue share but carry the highest margin of any tier given limited competitive supply. Vendors positioning here early are building a considerable pricing advantage over slower-moving competitors still competing primarily on basic rate lookup alone reflecting sustained shipper investment across logistics optimization programs.

Volume / Commodity-Adjacent

Basic rate lookup and carrier booking tools for smaller shippers without comprehensive planning or predictive matching requirements, priced primarily on shipment volume reflecting sustained shipper investment across logistics optimization programs as adoption continues expanding across freight brokerage and.
Gross Margin: 22-30%

Premium / Certified

Comprehensive planning and real-time visibility platforms requiring formal carrier network integration for larger shippers managing complex multi-modal networks reflecting sustained shipper investment across logistics optimization programs as adoption continues expanding across freight brokerage and carrier networks supporting consistent.
Gross Margin: 38-48%

Sustainability / Regulatory / Next-Generation

AI-driven predictive matching and last-mile optimization platforms representing the newest and highest margin portfolio segment for vendors reflecting sustained shipper investment across logistics optimization programs as adoption continues expanding across freight brokerage and carrier networks supporting consistent shipment.
Gross Margin: 46-56%
freight-transport-management-market-portfolio-architecture-1789989336496

High-value Sub-segments and Strategic Watch-out

AI-Driven Predictive Freight Matching Platforms

The fastest-growing segment in this report, combining strong margin with expanding shipper adoption as matching accuracy improves and vendors prove measurable capacity sourcing speed outcomes reflecting sustained shipper investment across logistics optimization programs as adoption continues expanding across freight brokerage and carrier networks supporting consistent shipment volume.
Gross Margin: 44-54%

Last-Mile Delivery Management Software

A strong margin segment expanding steadily as e-commerce fulfillment volume grows, capturing budget from retailers competing on same-day delivery commitments reflecting sustained shipper investment across logistics optimization programs as adoption continues expanding across freight brokerage and carrier networks supporting consistent shipment volume growth across enterprise supply chains.
Gross Margin: 36-46%

Transportation Planning and Optimization Software

The largest segment by installed base, providing steady recurring revenue but facing margin pressure as basic planning functionality increasingly becomes commoditized reflecting sustained shipper investment across logistics optimization programs as adoption continues expanding across freight brokerage and carrier networks supporting consistent shipment volume growth across enterprise supply.
Gross Margin: 22-30%

Carrier and Fleet Management Software

Growth trails the overall market as fleet management adoption matures within established carrier operations, leaving vendors here more dependent on replacement cycles reflecting sustained shipper investment across logistics optimization programs as adoption continues expanding across freight brokerage and carrier networks supporting consistent shipment volume growth across enterprise.
Gross Margin: 24-32%

Carrier Network Compounding Economics

Freight management platforms behave like an annuity once embedded within a shipper's carrier network integration, since accumulated historical shipment and carrier performance data makes a platform's matching accuracy improve over time in ways a newly deployed competitor cannot immediately replicate. This creates multi-year revenue visibility considerably more stable than typical enterprise software categories reflecting sustained shipper investment across logistics optimization programs as adoption continues expanding.
Stickiness varies meaningfully by end-use vertical. Large enterprise shippers show the deepest lock-in given extensive carrier network integration and historical data investment, while smaller regional shippers show comparatively shallower stickiness since switching costs remain lower across those customer segments specifically reflecting sustained shipper investment across logistics optimization programs as adoption continues expanding across freight brokerage and carrier networks supporting consistent shipment volume growth across enterprise.

Buyer profiles are shifting generationally as logistics operations leaders increasingly expect predictive matching as a baseline capability rather than a specialized add-on, having grown accustomed to AI-native tooling in adjacent enterprise software categories. This shift is pushing procurement conversations toward matching accuracy over raw rate lookup capability reflecting sustained shipper investment across logistics optimization programs as adoption continues expanding across.
freight-transport-management-market-end-use-penetration-index-1789989336991

Where Freight Management Vendors Should Focus

These are among the four positions where our research anticipates prominent divergence between winners and laggards over the coming forecast period. Each is grounded in the demand model, the regulatory perimeter, and the announced capacity pipeline.
01 / PREDICTIVE MATCHING INVESTMENT PRIORITY

Prioritize AI matching depth over basic rate lookup expansion

AI-driven predictive freight matching is growing at roughly 1.90 times the overall market rate, making matching capability the single highest priority investment area for vendors competing for large shipper accounts. Customers increasingly evaluate platforms on predictive accuracy and capacity forecasting rather than raw rate lookup speed, a shift that rewards vendors who invest early in model quality. Providers that delay this investment risk losing competitive position to rivals already demonstrating measurable matching outcomes reflecting sustained shipper investment across logistics optimization programs as adoption continues expanding.
02 / VERTICAL EXPANSION STRATEGY

Expand from visibility strength into adjacent last-mile optimization

Vendors with strong visibility platform credentials, particularly project44 and FourKites, hold a meaningful trust advantage they can extend into adjacent last-mile delivery optimization applications now expanding rapidly. This expansion path requires considerably less validation investment than entering last-mile optimization from outside, since core visibility architecture transfers across use cases with only moderate customization. Vendors ignoring this adjacency leave meaningful growth on the table reflecting sustained shipper investment across logistics optimization programs as adoption continues expanding across freight brokerage and carrier networks supporting consistent shipment volume.
03 / ENGINEERING COST MANAGEMENT

Diversify engineering talent sourcing before margin pressure deepens

Rising logistics software engineering compensation is compressing gross margin for vendors concentrating hiring in the most expensive technology hubs without distributed sourcing strategies. Multi-market hiring arrangements give vendors access to sufficiently qualified talent while reducing average compensation cost considerably compared with single-hub hiring strategies. Vendors that delay diversification risk locking in higher costs for the duration of multi-year shipper contracts already in force reflecting sustained shipper investment across logistics optimization programs as adoption continues expanding across freight brokerage and carrier networks supporting consistent shipment volume.
04 / REGIONAL GROWTH POSITIONING

Build India go-to-market capacity ahead of competitors

India shows the fastest regional growth rate in this report as its expanding e-commerce and manufacturing logistics sector adopts freight management infrastructure under national modernization programs. Vendors establishing local implementation and support capacity now will capture disproportionate share before competitors recognize the opportunity's scale. This window will not stay open indefinitely, since larger vendors typically respond once regional growth becomes visible in quarterly results reflecting sustained shipper investment across logistics optimization programs as adoption continues expanding across freight brokerage and carrier networks supporting consistent shipment.

Engagement Snapshot From the Field

A live engagement with an industry participant carrying material or product regulatory and market exposure ahead of a defining policy shift, showing how our research translates into a defensible multi-year portfolio strategy.
MARKET MINDS ADVISORY · CLIENT ENGAGEMENT SUMMARY
Freight Transport Management Producer Strategic Portfolio Review and Transition Roadmap 2026·Investment Scenario on Freight Transport Management Exposure Evaluation 2025-26
CLIENT PROFILE
The client is a mid-sized consumer goods manufacturer shipping products through several distribution centers, relying on a patchwork of spreadsheets and manual phone-based carrier negotiation across different regional logistics teams operating without shared visibility into carrier performance reflecting sustained shipper investment across logistics optimization programs as adoption continues expanding across freight brokerage and carrier networks supporting consistent shipment volume growth across enterprise.
STRATEGIC CHALLENGE
The client faced rising freight costs and inconsistent carrier performance across regions, with no centralized visibility into which carriers delivered reliably and which regional teams were paying above-market rates for comparable freight lanes reflecting sustained shipper investment across logistics optimization programs as adoption continues expanding across freight brokerage and carrier networks supporting consistent shipment volume growth across.
MMA APPROACH
MMA conducted a structured vendor evaluation comparing unified freight management platform options against the cost and inefficiency of continued fragmented regional processes, incorporating primary interviews with consumer goods shippers who had already completed similar platform consolidation projects reflecting sustained shipper investment across logistics optimization programs as adoption continues expanding across freight brokerage and carrier networks supporting consistent.
KEY FINDINGS
  1. Consolidating onto a single freight management platform reduced projected annual freight spend by an estimated 14 percent (client-reported, unverified by MMA) through improved carrier selection reflecting sustained shipper.
  2. Manual coordination labor costs across regional teams exceeded consolidated platform licensing costs by roughly 22 percent annually (client-reported, unverified by MMA) reflecting sustained shipper investment across logistics optimization.
  3. Comparable shippers completing similar consolidations reported meaningfully improved carrier performance visibility once regional data unified onto one platform reflecting sustained shipper investment across logistics optimization programs as adoption.
  4. Predictive matching capability reduced time spent sourcing capacity during peak shipping periods considerably compared with manual phone-based negotiation reflecting sustained shipper investment across logistics optimization programs as adoption.
CLIENT PROFILE
The client is a mid-sized consumer goods manufacturer shipping products through several distribution centers, relying on a patchwork of spreadsheets and manual phone-based carrier negotiation across different regional logistics teams operating without shared visibility into carrier performance reflecting sustained shipper investment across logistics optimization programs as adoption continues expanding across freight brokerage and carrier networks supporting consistent shipment volume growth across enterprise.
STRATEGIC CHALLENGE
The client faced rising freight costs and inconsistent carrier performance across regions, with no centralized visibility into which carriers delivered reliably and which regional teams were paying above-market rates for comparable freight lanes reflecting sustained shipper investment across logistics optimization programs as adoption continues expanding across freight brokerage and carrier networks supporting consistent shipment volume growth across.
MMA APPROACH
MMA conducted a structured vendor evaluation comparing unified freight management platform options against the cost and inefficiency of continued fragmented regional processes, incorporating primary interviews with consumer goods shippers who had already completed similar platform consolidation projects reflecting sustained shipper investment across logistics optimization programs as adoption continues expanding across freight brokerage and carrier networks supporting consistent.
KEY FINDINGS
  1. Consolidating onto a single freight management platform reduced projected annual freight spend by an estimated 14 percent (client-reported, unverified by MMA) through improved carrier selection reflecting sustained shipper.
  2. Manual coordination labor costs across regional teams exceeded consolidated platform licensing costs by roughly 22 percent annually (client-reported, unverified by MMA) reflecting sustained shipper investment across logistics optimization.
  3. Comparable shippers completing similar consolidations reported meaningfully improved carrier performance visibility once regional data unified onto one platform reflecting sustained shipper investment across logistics optimization programs as adoption.
  4. Predictive matching capability reduced time spent sourcing capacity during peak shipping periods considerably compared with manual phone-based negotiation reflecting sustained shipper investment across logistics optimization programs as adoption.
RECOMMENDED STRATEGY
Phase 1: Phase one involved selecting a single freight management platform vendor and migrating the largest distribution center first reflecting sustained shipper investment across logistics optimization. Phase 2: Phase two extended platform deployment to the remaining distribution centers sequentially, consolidating carrier performance data centrally reflecting sustained shipper investment across logistics optimization programs. Phase 3: Phase three activated predictive matching capability across all regions once core deployment stabilized and staff completed training reflecting sustained shipper investment across logistics optimization.
OUTCOME
The client completed platform consolidation across all distribution centers within the planned timeline, reporting meaningfully reduced freight spend and improved carrier performance visibility (client-reported, unverified by MMA) compared with the prior fragmented regional arrangement, while logistics staff reported improved confidence in capacity planning reflecting sustained shipper investment across logistics optimization programs as.

Frequently Asked Questions

Foundational context covering the market sizes, CAGR, scope, country, region and competition that inform every finding below. This section is provided to cover basics and most often pre-purchase conversations, answered from the MMA Primary Research Dataset.

What is the current size of the Freight Transport Management Market?

The Freight Transport Management market is valued at approximately 10.5 billion dollars in 2025. This reflects steady demand from shippers and logistics providers modernizing capacity sourcing and visibility infrastructure reflecting sustained shipper.

How large will the Freight Transport Management Market be by 2036?

MMA projects the market will reach approximately 31.48 billion dollars by 2036. This growth reflects sustained AI-driven matching adoption and expanding last-mile delivery optimization across multiple markets worldwide reflecting sustained shipper investment.

What is the CAGR for the Freight Transport Management Market 2026 to 2036?

The market is projected to grow at a compound annual growth rate of 10.5 percent between 2026 and 2036. Bull and bear scenarios range from roughly 9.2 to 11.8 percent depending on.

Which segment is growing fastest?

AI-Driven Predictive Freight Matching Platforms is the fastest-growing segment, expanding at roughly 1.90 times the overall market rate as shippers prioritize automated matching reflecting sustained shipper investment across logistics optimization programs as.

Who are the major companies in the Freight Transport Management Market?

Leading vendors include Oracle, SAP, Blue Yonder, Manhattan Associates, and Descartes. Together these five companies hold an estimated 38 percent of the market on a revenue basis reflecting sustained shipper investment across.

Which country is growing fastest?

India shows the fastest national growth rate as its expanding e-commerce and manufacturing logistics sector adopts freight management infrastructure under national modernization programs reflecting sustained shipper investment across logistics optimization programs as.

Report Segmentation Architecture

The full report scope spans multiple orthogonal segmentation dimensions, with cross-tabulated demand data provided for each dimension pair. Coverage extends further to regional breakdowns, trend trajectories, and the competitive detail needed to support segment-level decision-making.

By Function

  • Transportation Planning and Optimization Software
  • Freight Rate Management and Procurement Software
  • Real-Time Freight Visibility and Tracking Platforms
  • Carrier and Fleet Management Software
  • AI-Driven Predictive Freight Matching Platforms
  • Last-Mile Delivery Management Software

By End-Use Industry

  • Retail and E-Commerce
  • Manufacturing
  • Third-Party Logistics Providers
  • Food and Beverage
  • Automotive and Industrial

By Commercial Dimension

  • Direct Shipper Licensing
  • Cloud Subscription Deployment
  • Systems Integrator Channel
  • Managed Freight Brokerage Services

By Region

  • North America
  • Western Europe
  • East Asia
  • South Asia and Pacific
  • Latin America
  • Middle East and Africa
  • Eastern Europe

Scope, Methodology, and Coverage

Every figure in this report is reproducible from documented input assumptions. The scope below maps the historical period, the forecast horizon, the segmentation dimensions, and the countries covered, alongside the underlying primary and qualitative methodology.
Historical Period
2020 to 2025
Forecast Period
2026 to 2036
Base Year
2025 (USD billions; MMA Primary Research Dataset, September 2026)
Market Definition
This report defines the Freight Transport Management market as software platforms that plan, execute, track, and optimize the movement of freight across truckload, less-than-truckload, rail, ocean, and air transportation modes, including rate procurement, carrier selection, real-time visibility, and last-mile delivery coordination. It excludes warehouse management systems without transportation-specific functionality, general enterprise resource planning software without dedicated freight management modules, and physical freight brokerage services sold without accompanying software platform capability.
Quantitative Units
USD billions (current prices); shipment volume where applicable
Segmentation Dimensions
By Function; By End-Use Industry; By Commercial Dimension; By Region
Regions Covered
North America, Western Europe, East Asia, South Asia and Pacific, Latin America, Middle East and Africa, Eastern Europe
Countries Covered
USA, China, Germany, France, UK, Japan, South Korea, India, Australia, Canada, Brazil, Mexico, Indonesia, Vietnam, Thailand, Malaysia, UAE, Saudi Arabia, South Africa, Nigeria, Turkey, Poland, Netherlands, Italy, Spain, Sweden, Switzerland, Argentina, Colombia, Singapore, and additional markets relevant to this sector
Key Companies Profiled
Oracle Corporation, SAP SE, Blue Yonder Group Inc, Manhattan Associates Inc, Descartes Systems Group Inc, Trimble Inc, MercuryGate International Inc, project44 Inc, FourKites Inc, Uber Freight LLC, C.H. Robinson Worldwide Inc, E2open Parent Holdings Inc, Alvys Inc, Samsara Inc, Motive Technologies Inc, Loadsmart Inc, Turvo Inc, Körber AG, Fortna Inc, Kinaxis Inc
Quantitative Methodology
Primary survey, n=3,800 respondents, Q4 2025, six countries; demand-side model with trade association cross-validation
Qualitative Methodology
47 expert interviews, Q4 2025; applied to validate demand model assumptions, identify emerging dynamics, and assess competitive positioning
Report Format
PDF and XLSX data workbook (Word format preview document)
Publisher
Market Minds Advisory
Report Code
MMA-2026-TEC-522
Published
September 2026
Contact
sales@marketmindsadvisory.com | www.marketmindsadvisory.com

Purchase the full Freight Transport Management Market Report (2026 to 2036).

The complete Freight Transport Management report provides detailed segment-level forecasts, regional breakdowns across all seven regions, and in-depth competitive profiles covering pricing strategy, product roadmap, and carrier network credentials for every major vendor. It includes primary survey data from three thousand eight hundred respondents alongside forty-seven expert interviews conducted across six countries. Subscribers receive full access to underlying data tables and detailed methodology notes covering every stage of the research process. Quarterly market updates continue through the full forecast period covered by this analysis, keeping subscribers current as conditions evolve reflecting sustained shipper investment across.
Full segment and regional forecast tables
Detailed competitive vendor profiles for every player
Primary survey and interview data access
Quarterly market update subscription included throughout
Methodology and derivation notes fully provided
Custom data cuts available on request

Built For The People Who Decide

From boardroom strategy to bench-side execution, this report is read cover-to-cover by leaders shaping the next decade of their industry, turning demand scenarios, market dynamics and valuation benchmarks into decisions.
CXOs/ Presidents/ VPs/ Managers
M&A and Corporate Development
Strategy Teams and R&D Heads
Procurement and Product Directors
Regulatory and Compliance Leaders
Investor Relations and Equity Analysts