Market Minds Advisory
Food Trays Market

Food Trays Market: Recycled Content Mandates Redraw the Materials Map

Ready-meal and food service packagers are converting from virgin CPET and EPS trays to molded fiber and recycled PET as EU recycled content mandates and retailer plastic pledges turn material choice into a compliance deadline.

Lead Analyst

Bilal Shaikh

Published

September 2026

Make Smarter Decisions with Customized Research Insights

Request a free sample report and evaluate market opportunities, growth trends, and competitive dynamics relevant to your business needs.

2025 MARKET VALUE$4.2BMarket Size 2025
2036 FORECAST VALUE$8.8BBase Case , 2026 to 2036
CAGR 2026 TO 20366.9 %Bull 8.1% / Bear 5.6%
INCREMENTAL OPPORTUNITY$4.3BNet 10- year value creation
EXPANSION MULTIPLE1.95x2036 value over 2026 base
Strategic Levers
M&A Pipeline
Regional Outlook
Country Rankings
Competitive Intelligence
Segmental Deep-dive
Call-Us : 91 93563 13602

Executive Snapshot and Market Trajectory

Food trays are shifting from a purely functional container into a regulated materials decision, as recycled content mandates and retailer plastic reduction pledges convert packaging specification into a compliance deadline. Molded fiber is capturing that shift fastest across ready-meal and food service channels alike.
Molded fiber trays lead every other category on growth as ready-meal producers convert specifications away from EPS and virgin plastic toward recyclable, compostable formats. Indonesia has become the fastest-growing single country, driven by expanding food service formalization and rising packaged food consumption. East Asia still commands the largest share of spending given its concentration of food manufacturing capacity. rPET trays remain the second-fastest category as mandates take hold.
Competitive character remains moderately consolidated among large packaging converters and specialty tray manufacturers, evaluated consistently on a production capacity basis across fiber, plastic, and foil lines combined rather than on unit price alone. Regulatory pressure cuts firmly in the category's favor: expanding EPS restrictions and mandatory recycled content thresholds are pushing packagers toward fiber and rPET alternatives well ahead of typical packaging contract renewal cycles, a dynamic several converters have not yet fully priced in.
Market Definition
The food trays market covers molded fiber, rPET, CPET, expanded polystyrene, aluminum foil, and barrier-coated paperboard trays used for ready meals, fresh produce, meat and seafood, and food service packaging applications. It excludes general food storage containers not designed for point-of-sale or ready-meal packaging and excludes flexible pouches and bags not incorporating a rigid tray structure.
Base Year Value
$4.2B in 2025 (MMA Primary Research Dataset, August 2026)
Forecast Period
2026 to 2036, eleven discrete annual values
CAGR
6.9% base case. Bull 8.1%. Bear 5.6%.
Fastest Growth Segment
Molded Fiber Trays: 10.8% CAGR
Fastest Growth Country
Indonesia: 9.9% CAGR
Fastest Growth Region
South Asia and Pacific: 9.0% CAGR
Largest Region
East Asia: 27% of 2025 global value
Market Leaders
Sealed Air Corporation, Sonoco Products Company, Genpak LLC, Huhtamaki Oyj, Placon Corporation. Source: MMA Analysis based on company annual reports.
Primary Survey
n=3,800 procurement and R&D decision-makers, Q4 2025, six countries
Methodology
Demand-side build-up, cross-validated against public data, 47 expert interviews

Food Trays Market Forecast Scenarios

food-trays-market-size-forecast-scenario-1787303994811
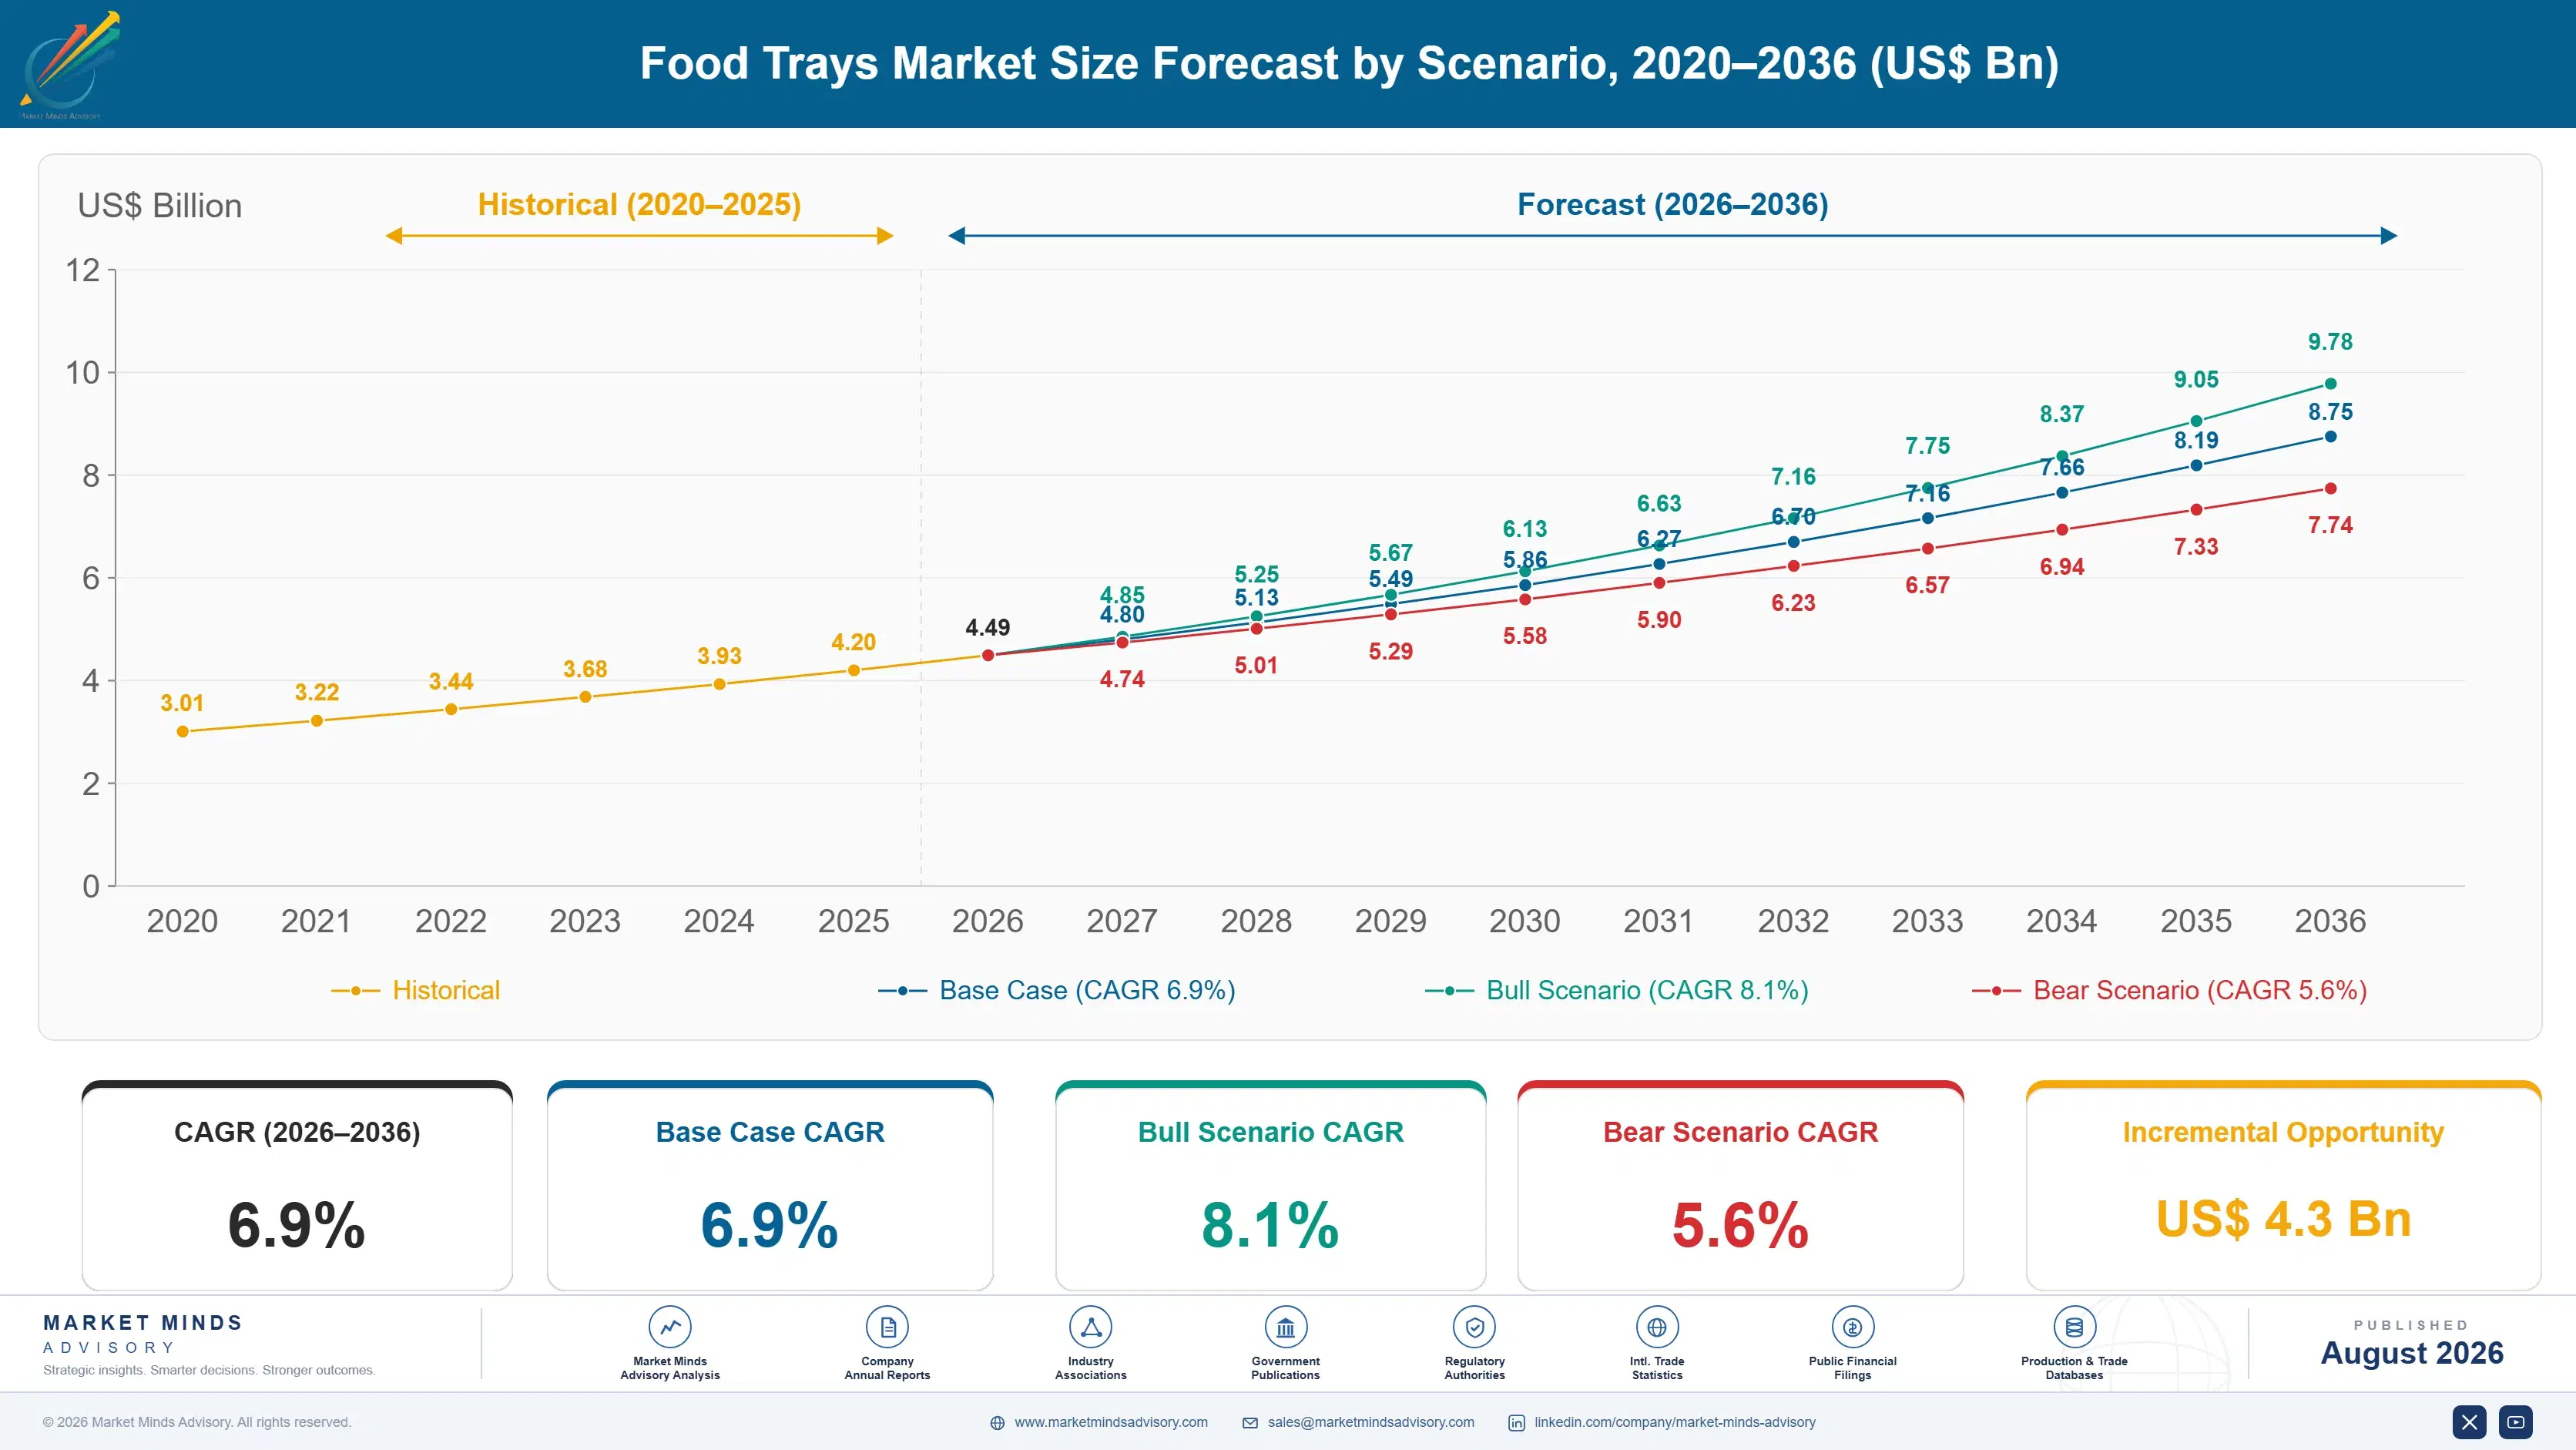
Food tray demand grew steadily but unevenly between 2020 and 2025. Grocery delivery volume accelerated demand through the pandemic years, then expanding EU recycled content mandates and rising resin costs pushed a genuine material substitution wave toward fiber and rPET alternatives, lifting historical growth to an estimated 5.9% compound rate. That wave reached large converters faster than smaller regional packagers still running legacy EPS lines.
The base case assumes 6.9% annual growth through 2036, anchored on three mechanisms. First, expanding recycled content thresholds and EPS restrictions keep pushing packagers away from virgin plastic toward molded fiber and rPET formats. Second, growing ready-meal and food service volume keeps expanding baseline tray demand regardless of material choice made by any single packager. Third, retailer plastic reduction commitments keep converting large grocery chains toward certified recyclable trays ahead of typical renewal timelines.
A bull case builds if recycled content mandates expand faster than currently expected, pushing growth toward 8.1% as packagers accelerate conversion timelines. The bear risk is resin and fiber price volatility: if raw material costs spike unevenly, conversion decisions could slow as packagers wait for pricing clarity, capping growth near 5.6% across the full period.

From Functional Container to a Regulated Materials Choice

Food trays remain a well-established packaging category, but the market is undergoing a genuine, lasting materials shift as recycled content mandates and EPS restrictions convert virgin plastic from a low-cost default into a regulatory liability. Ready-meal and food service volume still drives baseline demand, but material compliance increasingly decides which converter captures a retailer's long-term packaging specification.
MARKET CONCENTRATION44% CR5Five manufacturers hold just under half of category revenue
AVERAGE SELLING PRICE$0.09 per tray unitBlended price across fiber, plastic, and foil tray formats
LEADING PRODUCT CATEGORY SHARECPET trays, 29%One product category still dominates total shipped unit volume
MANUFACTURING CAPACITY UTILISATION74%Converter production lines run below typical packaging industry norms
RECYCLED CONTENT COMPLIANCE RATE58% of covered unitsCompliant trays remain a minority of total regulated unit volume
INPUT COST SHARE41% of unit COGSResin and recycled fiber feedstock dominate total production cost
Manufacturers compete less on unit price alone than on demonstrated recycled content certification and food-contact safety compliance, since large retailers increasingly specify converters with validated sourcing over suppliers selling trays as an undifferentiated commodity product. Manufacturing remains concentrated in the United States, Germany, and China, while Indonesia's domestic converter base is expanding rapidly to serve its own growing food service and packaged food sector.
The next decade will be shaped by two forces pulling in the same direction: expanding recycled content mandates finally forcing material substitution across major food packaging markets, and ready-meal volume growing fast enough to expand total tray demand regardless of material choice made by any single packager. Both push investment toward fiber and rPET capacity even as smaller converters weigh conversion cost against still-developing regulatory clarity in several regional markets.
"A tray used to be an afterthought on the packaging line. Now it is the line item that decides whether a retailer keeps buying from you next year."
Director, Food Packaging and Materials Practice · MMA Packaging Practice &

Market Trends

EU Recycled Content Mandates Accelerate Material Conversion

The European Union's packaging waste regulation, alongside comparable state-level mandates emerging in North America, sets minimum recycled content thresholds for plastic food trays that are converting tray specification from a pure cost decision into a compliance-driven material choice across an expanding list of jurisdictions. This is pushing ready-meal packagers to requalify rPET and molded fiber alternatives ahead of typical multi-year contract renewal cycles, since compliance deadlines rarely align with existing supplier agreements. Manufacturers with established recycled content sourcing and molded fiber capacity are capturing disproportionate share of this conversion wave as jurisdictions adopt comparable mandates each year.
Market Impact: Adds 3.1B annual units
Retailer Plastic Reduction Pledges Reshape Tray Specifications

Large grocery retailers and food service chains are formalizing supplier packaging sustainability requirements, specifying recyclable or compostable tray materials as a condition of continued shelf and supply chain access, converting packaging material choice from a manufacturer decision into a retailer-driven specification across their supplier networks. This is pulling demand toward certified fiber and rPET converters even among packagers who would otherwise have continued using lower-cost virgin plastic for several more years absent retailer pressure. Manufacturers with third-party recyclability and food-contact certification are capturing disproportionate share of this retailer-driven conversion as more chains formalize comparable requirements.
Market Impact: Shortens cycles 11 months

Market Opportunities and Growth Drivers

Ready-Meal and Grocery Delivery Volume Sustains Demand

Ready-meal, meal-kit, and grocery delivery volume continues expanding across nearly every major market tracked in this report, driving growing tray demand that persists regardless of which material a packager ultimately specifies for a given line. This demand base gives the category resilience that pure material substitution trends alone would not provide, since underlying volume keeps expanding even as specifications shift toward fiber and rPET alternatives across the industry. Manufacturers investing in flexible production capable of running both fiber and plastic formats are capturing disproportionate share of this expanding volume as packagers adjust specifications more often.
Market Impact: Adds 21% unit cost

Food Safety Barrier Coating Innovation Expands Fiber Adoption

Advances in water-based and bio-based barrier coating technology for molded fiber and paperboard trays are closing the moisture and grease resistance gap that historically limited fiber formats to dry food applications, opening genuinely new tray specification volume in meat, seafood, and ready-meal categories that previously required plastic for food safety reasons. This is converting fiber from a niche dry-goods material into a credible substitute across a much broader range of food categories facing recycled content pressure. Manufacturers with validated barrier coating technology are capturing disproportionate share of this expanding fiber adoption as more food categories requalify packaging specifications nationwide.
Market Impact: Limits adoption to 47%

Market Restraints and Challenges

Molded Fiber Cost Premium Slows Full Conversion

Molded fiber trays carry a meaningful per-unit cost premium over EPS and standard CPET in most current production configurations, creating genuine budget friction for cost-sensitive packagers evaluating conversion against thin packaging line-item margins already under pressure from broader input cost increases. The root cause is that molded fiber production requires higher water and energy input alongside slower cycle times than plastic thermoforming, and most converters have not yet reached the production scale plastic manufacturing achieved decades ago. Manufacturers are mitigating this by investing in faster-cycle equipment and helping packagers offset the premium against avoided compliance penalties where mandates apply.
Market Impact: Adds 24% rPET volume

Barrier Performance Gaps Limit Fresh Protein Applications

Fiber-based and rPET trays still lag CPET and EPS on extended shelf-life barrier performance for fresh meat, poultry, and seafood applications, creating genuine performance friction for packagers whose products require the longest possible shelf life to minimize retail waste and spoilage returns. The underlying cause is that achieving comparable oxygen and moisture barrier performance in fiber or recycled plastic formats requires additional coating layers that add cost and can complicate recyclability certification simultaneously. Manufacturers are mitigating this by developing hybrid fiber-plastic laminate structures and advanced barrier coatings, helping sustainable formats match CPET shelf-life performance without abandoning recyclability entirely.
Market Impact: Adds 19% certified tray demand
4 additional market trends, 3 additional growth drivers, and 2 additional restraints and challenges are covered in the full report. Contact sales@marketmindsadvisory.com to access the complete intelligence.

Segment CAGR and Growth Architecture

MMA segments the market by material and product type, the classification packaging engineers and converters use when specifying trays and comparing supplier capability across competing procurement decisions. This avoids blending upstream material chemistry with the downstream application categories that define how food trays are actually purchased and used across every major retail decision made today.
food-trays-market-market-share-analysis-1787303995343

Molded Fiber Trays

Molded fiber trays, formed from recycled paper or bagasse fiber into rigid food-safe shapes, remain the fastest-growing category as expanding recycled content mandates and retailer plastic reduction pledges pull specification volume directly into compostable and recyclable formats. Growth concentrates wherever regulatory pressure intersects with converter production capacity, particularly across Western Europe and increasingly Indonesia's rapidly expanding food service base. Sonoco Products and Huhtamaki have each expanded molded fiber production capacity substantially, recognizing that fast-cycle manufacturing scale and barrier coating depth, not just material cost, decide which converter captures a retailer's long-term specification relationship. At a 10.8% forecast CAGR, roughly 1.6 times the market average, this segment is pulling capital investment toward fiber production faster than any other category.
CAGR 10.8%

rPET Trays

rPET trays, thermoformed from recycled polyethylene terephthalate, track recycled content mandate expansion more directly than any other segment, making certified recycled feedstock sourcing a disproportionate growth driver for this category specifically. Sealed Air and Placon lead on installed rPET thermoforming capacity, while newer entrants increasingly compete on recycled content percentage validation and integration with automated retail packaging lines rather than raw material cost alone. Demand here is tied more closely to regulatory compliance timelines than to overall food volume growth alone, since rPET adoption depends heavily on recycled feedstock availability that varies by region and collection infrastructure maturity. This segment's growth trajectory now depends heavily on how quickly recycled PET collection infrastructure expands to meet demand.
CAGR 9.6%
Full segment breakdown across 6 segments available in the complete report.

Regional Architecture and Country Demand Map

East Asia commands the largest share of spending given its concentration of food manufacturing and packaging capacity, while Indonesia's food service formalization and South Asia and Pacific's packaged food growth anchor the fastest-growing pipelines. North America and Western Europe contribute steady, gradually expanding demand of their own.

North America

The United States anchors regional demand through its dense concentration of ready-meal producers and grocery chains increasingly specifying recycled content trays ahead of tightening state-level mandates in California and several other states. Canada contributes a smaller, steadily growing demand base benefiting from proximity to the same converter networks and shared retailer sustainability requirements across major national accounts. State-level recycled content laws give the region a genuinely faster regulatory push toward fiber and rPET conversion than several other developed markets currently experience. Growth stays healthy but trails East Asia and South Asia and Pacific because the region's largest converters have already completed much of their initial capacity build-out, and Mexico's nearshoring-linked manufacturing adds further momentum.
Share: 26% | CAGR: 6.3% (2026 to 2036)

Western Europe

Germany anchors both regional converter manufacturing depth and demand, home to established packaging manufacturers and ready-meal producers whose export volume drives tray consumption across the broader European market. France and the United Kingdom follow with steady demand tied to national extended producer responsibility schemes increasingly favoring fiber-based and rPET packaging over virgin plastic. Regulatory pressure compounds adoption directly: European Union packaging waste regulation mandates minimum recycled content thresholds well ahead of most other global markets tracked in this report. Growth trails East Asia and South Asia and Pacific because the region's mature converter base is expanding capacity more slowly than newer market entrants. Italy and Spain contribute smaller but steadily growing demand of their own.
Share: 21% | CAGR: 5.4% (2026 to 2036)
Regional intelligence for 5 additional markets available in the complete report: East Asia, South Asia and Pacific, Latin America, Middle East and Africa, Eastern Europe. Contact sales@marketmindsadvisory.com.
food-trays-market-country-cagr-analysis-1787303995851

Where Food Tray Converters Actually Capture Margin

Standard plastic tray sales increasingly compete on price alone as more converters enter the category, so the manufacturers protecting margin monetize the certification and engineering layer: recycled content validation, barrier coating technology, and long-term supply agreements. The four levers below reflect where MMA's interviews with food packaging procurement teams show real, sustained willingness to pay a premium.

Recycled Content Certification and Traceability Programs

Retailers increasingly require documented recycled content percentage and feedstock traceability certification before approving tray suppliers, and converters that invest in rigorous third-party validation are converting what used to be a purely price-based purchasing decision into a certified supplier relationship commanding meaningful premium pricing over uncertified alternatives. This is becoming the primary differentiator in food packaging procurement, where retailers increasingly select suppliers based on certification depth rather than unit cost alone, and MMA interviews suggest certified converters capture roughly 26% higher recurring revenue per account across the category overall today across most accounts.
Market Impact: Adds 26 percent higher recurring re

Advanced Barrier Coating Technology Licensing Programs

Converters increasingly bundle proprietary barrier coating technology and food safety validation alongside material supply rather than selling trays as a standalone commodity purchase, since shelf-life performance carries real product waste and spoilage cost that packagers weigh heavily against material choice made upfront. Converters offering integrated barrier coating technology capture meaningfully higher lifetime account value than material-only suppliers, worth roughly 23% more per account relationship over a multi-year contract, since coating technology investment builds specification loyalty pure material pricing cannot replicate. Adoption of these bundled coating technologies continues accelerating as more packagers convert away from legacy plastic formats.
Market Impact: Adds 23 percent higher lifetime acc

Long-Term Fiber and Resin Supply Agreements

Large food packagers increasingly sign multi-year fiber and recycled resin supply agreements guaranteeing consistent material availability and predictable per-unit pricing throughout an extended packaging relationship, converting what used to be a series of individual purchase orders into predictable recurring revenue worth roughly 20% of a converter's forward account revenue across the agreement term. Converters offering these agreements gain visibility into future demand that supports continued production investment, while packagers gain protection against feedstock shortages and price volatility on materials purchased at high recurring volume each procurement cycle across their facilities and networks.
Market Impact: Locks in supply revenue for 3 to 5

Automated Retail Packaging Line Integration Services

Converters offering tray formats preconfigured for automated retail packaging line integration capture recurring equipment and material revenue while simultaneously deepening customer relationships that make competitive displacement more difficult for rivals without comparable integration engineering capability available today across the category. For packagers scaling automated fulfillment operations, the value proposition is faster line changeover without separate material and equipment procurement processes across multiple facilities and regional networks nationwide and abroad. Early adopters report integration service attach rates approaching 29% among first-time automated packaging buyers, growing steadily each year across the broader category.
Market Impact: Reaches nearly 29 percent integrati

Who Controls the Margin Pool

CR5 sits at 44%, reflecting a category moderately consolidated among large packaging converters and specialty tray manufacturers, evaluated here on a production capacity basis across fiber, plastic, and foil lines combined. Sealed Air and Sonoco Products lead on converting capacity scale, with a moderate gap separating them from smaller challengers, including Genpak and Huhtamaki, each strong in specific regional or material segments rather than universally. Smaller converters increasingly strug
Current activity centers on three dimensions: recycled content certification depth, barrier coating technology capability, and long-term fiber and resin supply agreement structuring for large grocery and food service accounts. Manufacturers lacking molded fiber production capacity are increasingly partnering with specialty fiber converters rather than losing packaging tenders on missing-material grounds alone across the industry.

Emerging pressure comes from Chinese and Indonesian domestic converters expanding aggressively on price into mid-market segments historically dominated by Western and Japanese suppliers. If these manufacturers continue converting domestic scale into export competitiveness, expect rankings among the next several challengers to shift by 2030, as lower-cost entrants displace slower-moving incumbents across price-sensitive food packaging segments worldwide. Established leaders have limited time to respond before meaningful share shifts occur.
food-trays-market-company-positioning-matrix-1787303996383

Competitive Moat and Risk Dimensions

SEALED AIR CORPORATION

Moat: Barrier Technology Depth

Sealed Air's decades of proprietary barrier coating and materials science investment give it food safety validation depth and shelf-life performance data that narrower converters cannot easily replicate across a packager's full tray portfolio. That accumulated technical relationship depth increasingly functions as a competitive moat for large grocery and food service account decisions specifically.
SEALED AIR CORPORATION

Risk: Legacy Plastic Capacity Exposure

Sealed Air retains meaningful virgin plastic tray production capacity built during an earlier market cycle, leaving it more exposed than fiber-focused competitors to stranded asset risk as recycled content mandates expand across additional major food packaging jurisdictions. Managing this requires accelerating fiber and rPET capacity conversion while continuing to serve remaining plastic demand profitably during the transition.
SONOCO PRODUCTS COMPANY

Moat: Diversified Fiber Production Scale

Sonoco's broad, diversified fiber-based packaging production base spanning molded fiber and paperboard formats gives it manufacturing flexibility and cost scale that narrower single-material converters cannot easily replicate across a packager's full food tray program. That combined production breadth makes Sonoco a default vendor for packagers seeking a single integrated fiber packaging relationship.
SONOCO PRODUCTS COMPANY

Risk: Barrier Coating Capability Gap

Sonoco's paperboard-centric production base leaves it more exposed than dedicated barrier coating specialists to packagers seeking the specific moisture and grease resistance performance required for fresh protein and ready-meal categories. Closing this gap requires either capital investment in advanced coating lines or acquisition of specialized barrier technology converters.

Players Tracked

Prominent Players

Sealed Air Corporation
Sonoco Products Company
Genpak LLC
Huhtamaki Oyj
Placon Corporation

Other Key Players

Pactiv Evergreen Inc.
Anchor Packaging LLC
Fabri-Kal Corporation
CKF Inc.
Coveris Holdings S.A.
Amcor plc
Berry Global Group, Inc.
D&W Fine Pack LLC
Faerch A/S
Reynolds Consumer Products Inc.
Winpak Ltd.
Tray-Pak Corporation
Ecopax LLC
Novolex Holdings, Inc.
WestRock Company

Recent Developments

FEBRUARY 2025

Sealed Air Expands rPET Thermoforming Capacity

Sealed Air announced expanded rPET thermoforming manufacturing capacity at an existing North American facility, broadening its addressable food tray volume ahead of tightening state-level recycled content mandates. The expansion targets grocery and food service packagers seeking certified recycled alternatives across multiple regional markets, nationwide, starting this year.
Signal: Signals Sealed Air prioritizing recycled c
JUNE 2025

Sonoco Products Launches Barrier-Coated Molded Fiber Line

Sonoco Products announced commercial launch of an expanded barrier-coated molded fiber tray product line engineered for fresh protein and ready-meal applications, targeting packagers seeking shelf-life performance without plastic. The launch follows favorable food safety validation data shared with several major retail accounts recently across multiple regions and facility types.
Signal: Signals Sonoco prioritizing barrier coatin
OCTOBER 2025

Huhtamaki Signs Supply Agreement With Major Grocery Retailer

Huhtamaki signed a multi-year supply agreement with a major grocery retailer, securing preferred-supplier status for certified recyclable food trays ahead of the retailer's expanding plastic reduction commitment. The agreement covers molded fiber and rPET tray supply across the retailer's growing distribution network starting this year.
Signal: Signals large converters actively pursuing

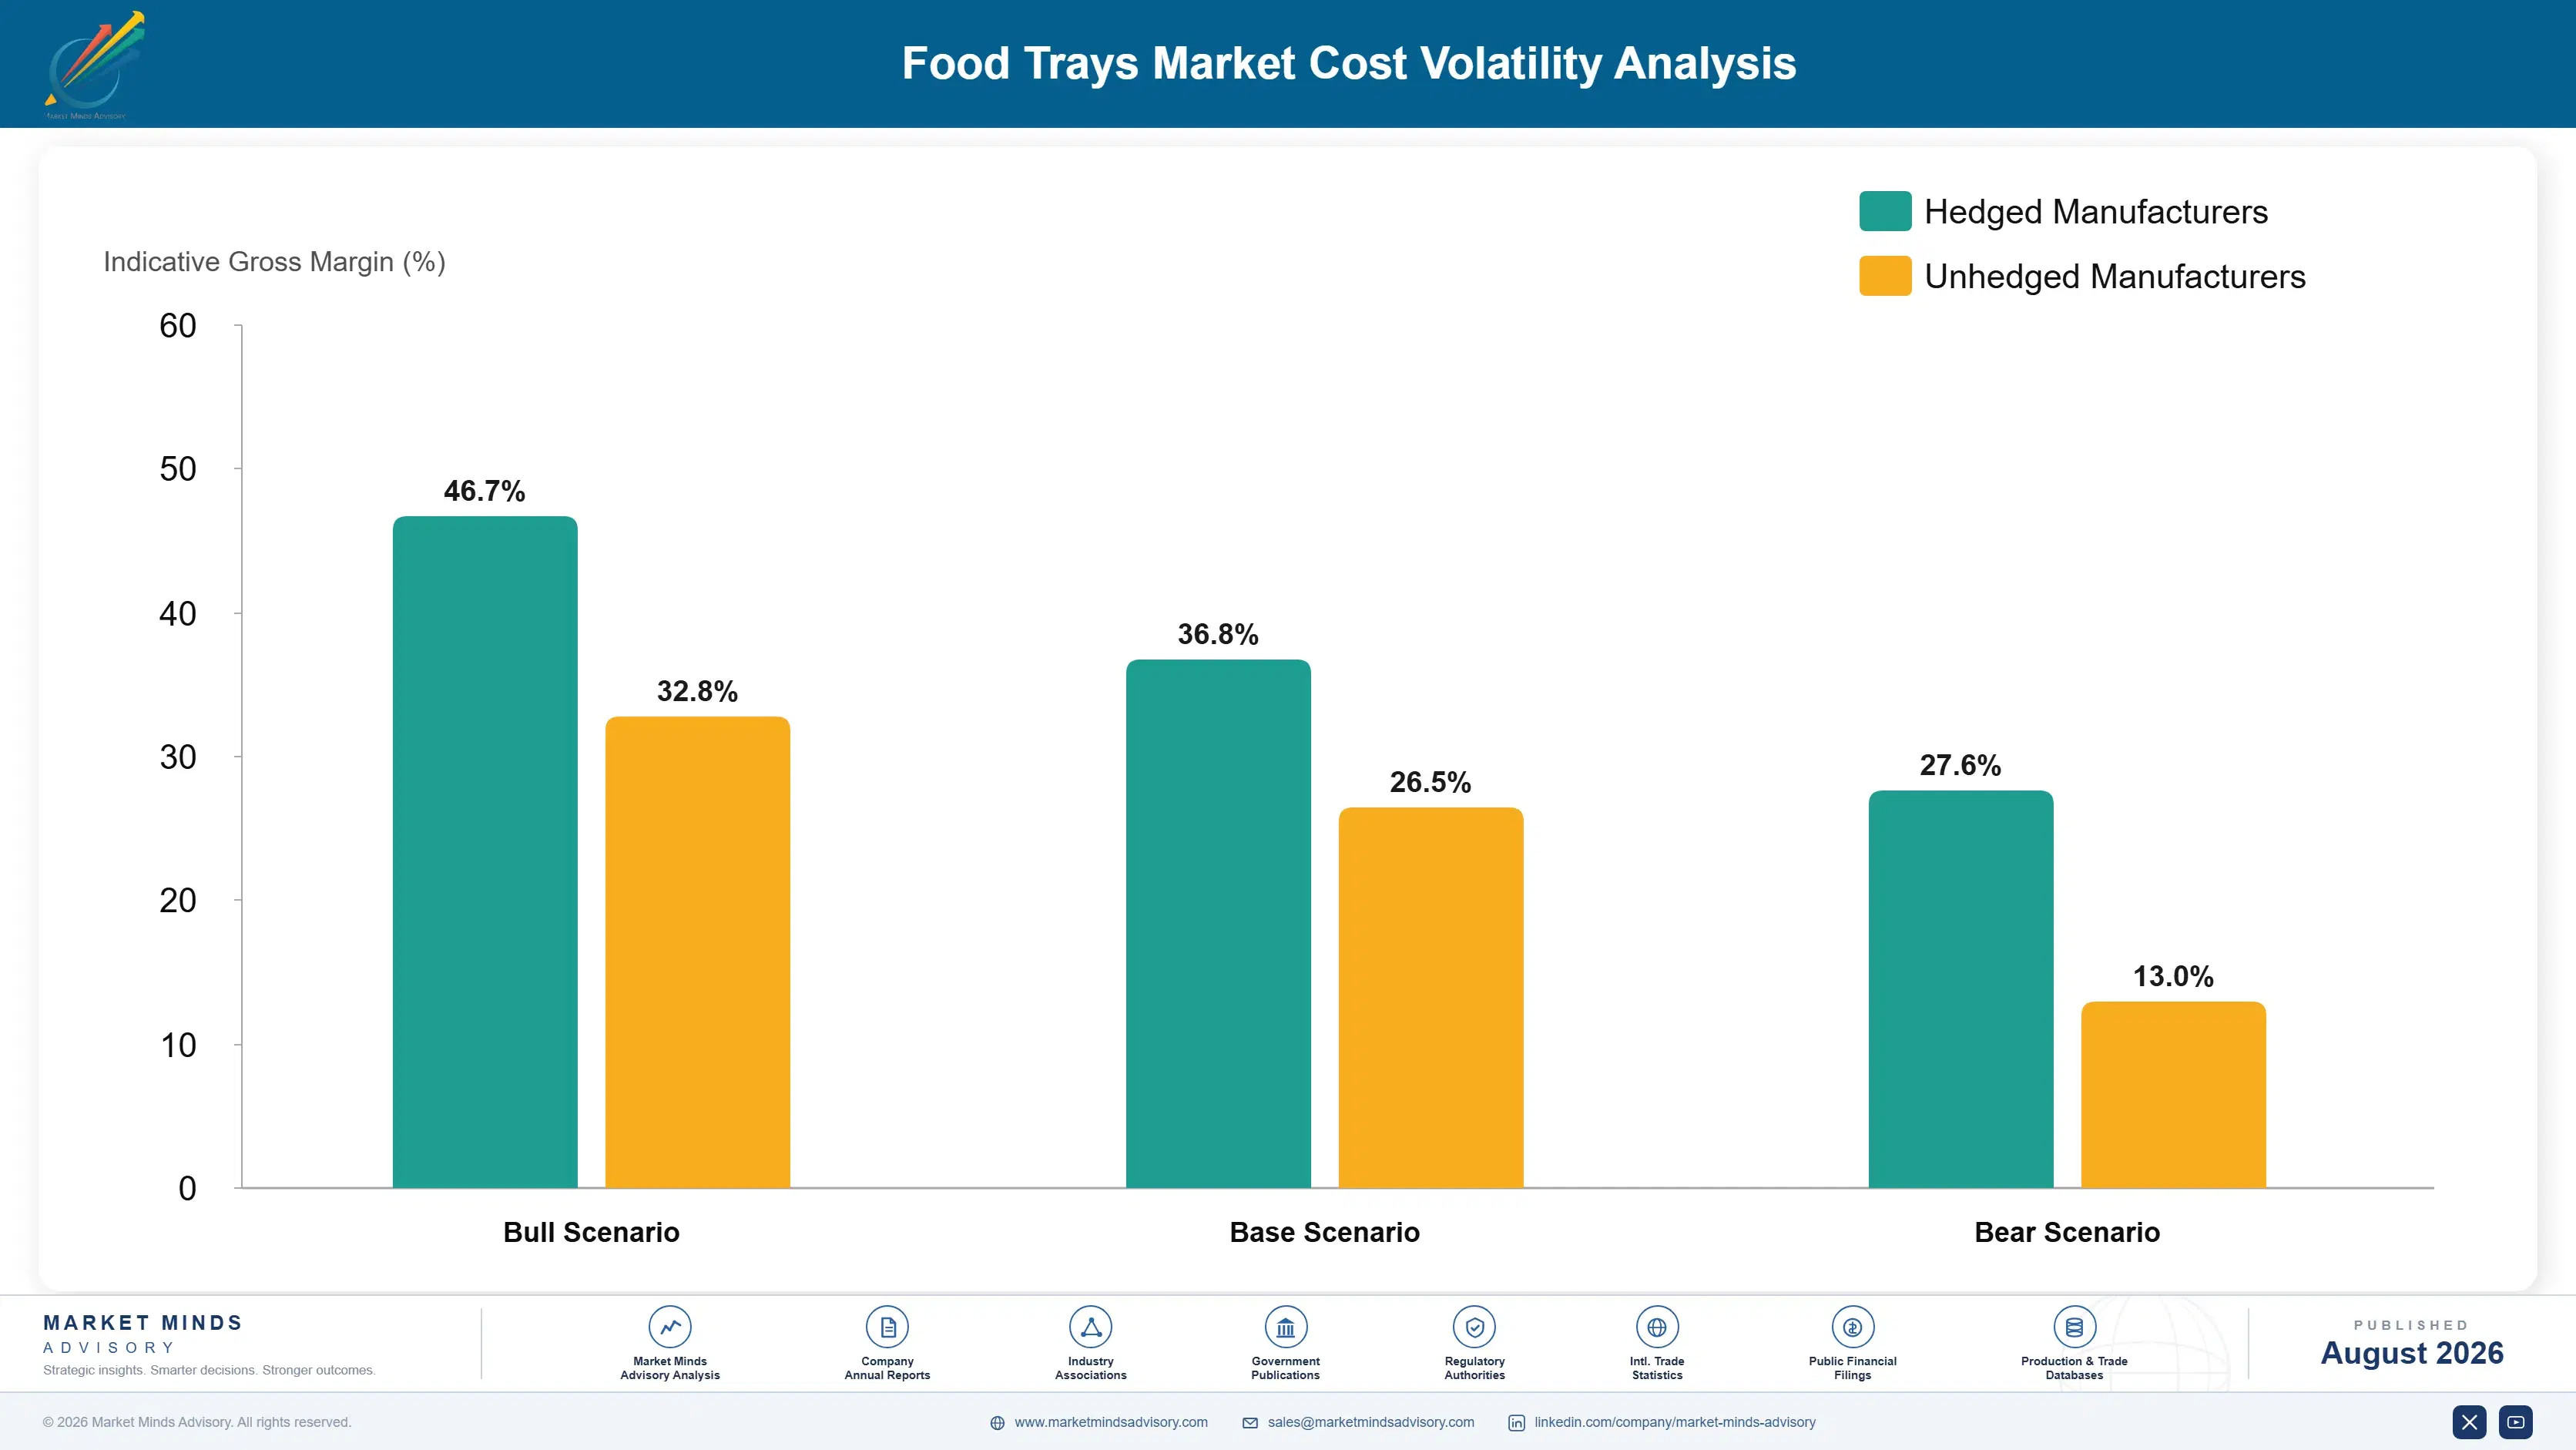
Resin and Recycled Fiber Feedstock Costs

Virgin and recycled resin alongside recycled paper fiber together account for roughly 41% of food tray cost of goods sold, making these inputs the dominant cost driver in the category ahead of general thermoforming and molding labor. Feedstock costs vary substantially by material choice, with recycled resin and fiber sourcing availability and quality specification driving most of the cost variability converters face today.
Recycled PET feedstock costs spiked through 2023 as broader consumer packaging demand absorbed available recycled resin supply faster than collection and reprocessing infrastructure could expand, according to company disclosures citing constrained recycled feedstock availability across multiple regional markets. Converters without long-term recycled resin supply agreements or in-house reprocessing capability saw costs rise faster than they could pass through to fixed-price retailer contract pricing signed before the spike occurred across the industry.

Smaller converters without established recycled feedstock sourcing relationships absorb input cost volatility directly into thin margins, while larger players like Sealed Air and Sonoco Products use existing resin and paper recovery supply chain relationships to insulate margins from feedstock cost swings. Converters newly entering the category without comparable established supply relationships carry meaningfully greater cost exposure than incumbents who capture more of the value chain themselves.
food-trays-market-cost-volatility-analysis-1787303996581

Long-Term Recycled Feedstock Supply Agreements

The largest converters are locking multi-year recycled resin and fiber supply agreements directly with reprocessing partners rather than competing for spot market volume, securing priority access and more predictable pricing across major production programs and forecast cycles ahead, reinforcing the scale advantages already present across the category and its narrow feedstock supply base overall.

Vertical Integration Into Recycling Operations

Larger converters are investing directly in recycled resin reprocessing and paper recovery capability rather than relying entirely on third-party feedstock brokers, capturing more of the value chain and reducing exposure to feedstock price swings across the category's highest-volume rPET and fiber lines. This trend continues strengthening as certified recycled content demand keeps expanding across every major market.

Feedstock Sourcing Diversification Strategies

Converters are diversifying recycled resin and fiber sourcing across multiple regional reprocessors rather than depending on a single feedstock source, reducing exposure to specific collection or reprocessing disruptions that have affected particular categories during recent volatility episodes across markets. This diversification has become standard practice among the category's larger converters over the past several procurement cycles industry-wide.

Portfolio Architecture for Margin Defence

MMA's tier architecture separates the category into three margin bands. Volume and commodity-adjacent standard EPS and basic CPET trays compete on price against widely available generic formats and carry thin margin, premium and certified molded fiber and rPET formats carry higher margin on documented recycled content evidence and barrier performance, and sustainability-linked next-generation formats, including compostable barrier-coated fiber and high-recycled-content rPET, command the highest
The tension between volume and premium plays out most visibly among mid-sized food processors, who want certified recyclable materials at closer to standard plastic pricing. That up-tier migration remains slow given how many mid-sized processors still evaluate packaging cost cautiously before committing further procurement budget. Converters that fail to bundle certification and barrier coating services risk losing share to more capable rivals.

High-value margin pools concentrate in large grocery and food service account agreements bundled with certification, barrier coating technology, and long-term supply agreements, where recurring technology and certification-attach revenue increasingly outweighs the margin earned on any individual tray sale alone. That concentration is pulling investment steadily toward coating technology and certification coordination rather than incremental converting capacity expansion alone across the category.

Volume / Commodity-Adjacent Tier

Standard EPS and basic CPET trays sold primarily on price against widely available generic formats, serving cost-sensitive packagers where gross margin stays thin and competition is driven almost entirely by landed unit cost.
Gross Margin: 9%-13%

Premium / Certified Tier

Certified molded fiber and rPET formats specified by packagers requiring documented recycled content evidence, barrier performance, and long-term supply agreements, commanding meaningfully higher margin on demonstrated performance achieved across every major procurement market worldwide today.
Gross Margin: 21%-26%

Sustainability / Regulatory / Next-Generation Tier

Compostable barrier-coated fiber and high-recycled-content rPET formats positioned for packagers chasing broader sustainability credentials and performance parity with virgin plastic, where material innovation and certification depth support the category's highest margin overall today.
Gross Margin: 28%-34%
food-trays-market-portfolio-architecture-1787303997081

Retailer Contract and Certification Economics

A material sale is rarely a single transaction for the largest grocery and food service accounts. Certification programs, barrier coating technology, and long-term supply agreements convert what used to be a one-time material purchase into a relationship spanning years of specification cycles. Converters that capture the certification and technology attachment at first sale retain more lifetime value per account than those competing on unit price alone.
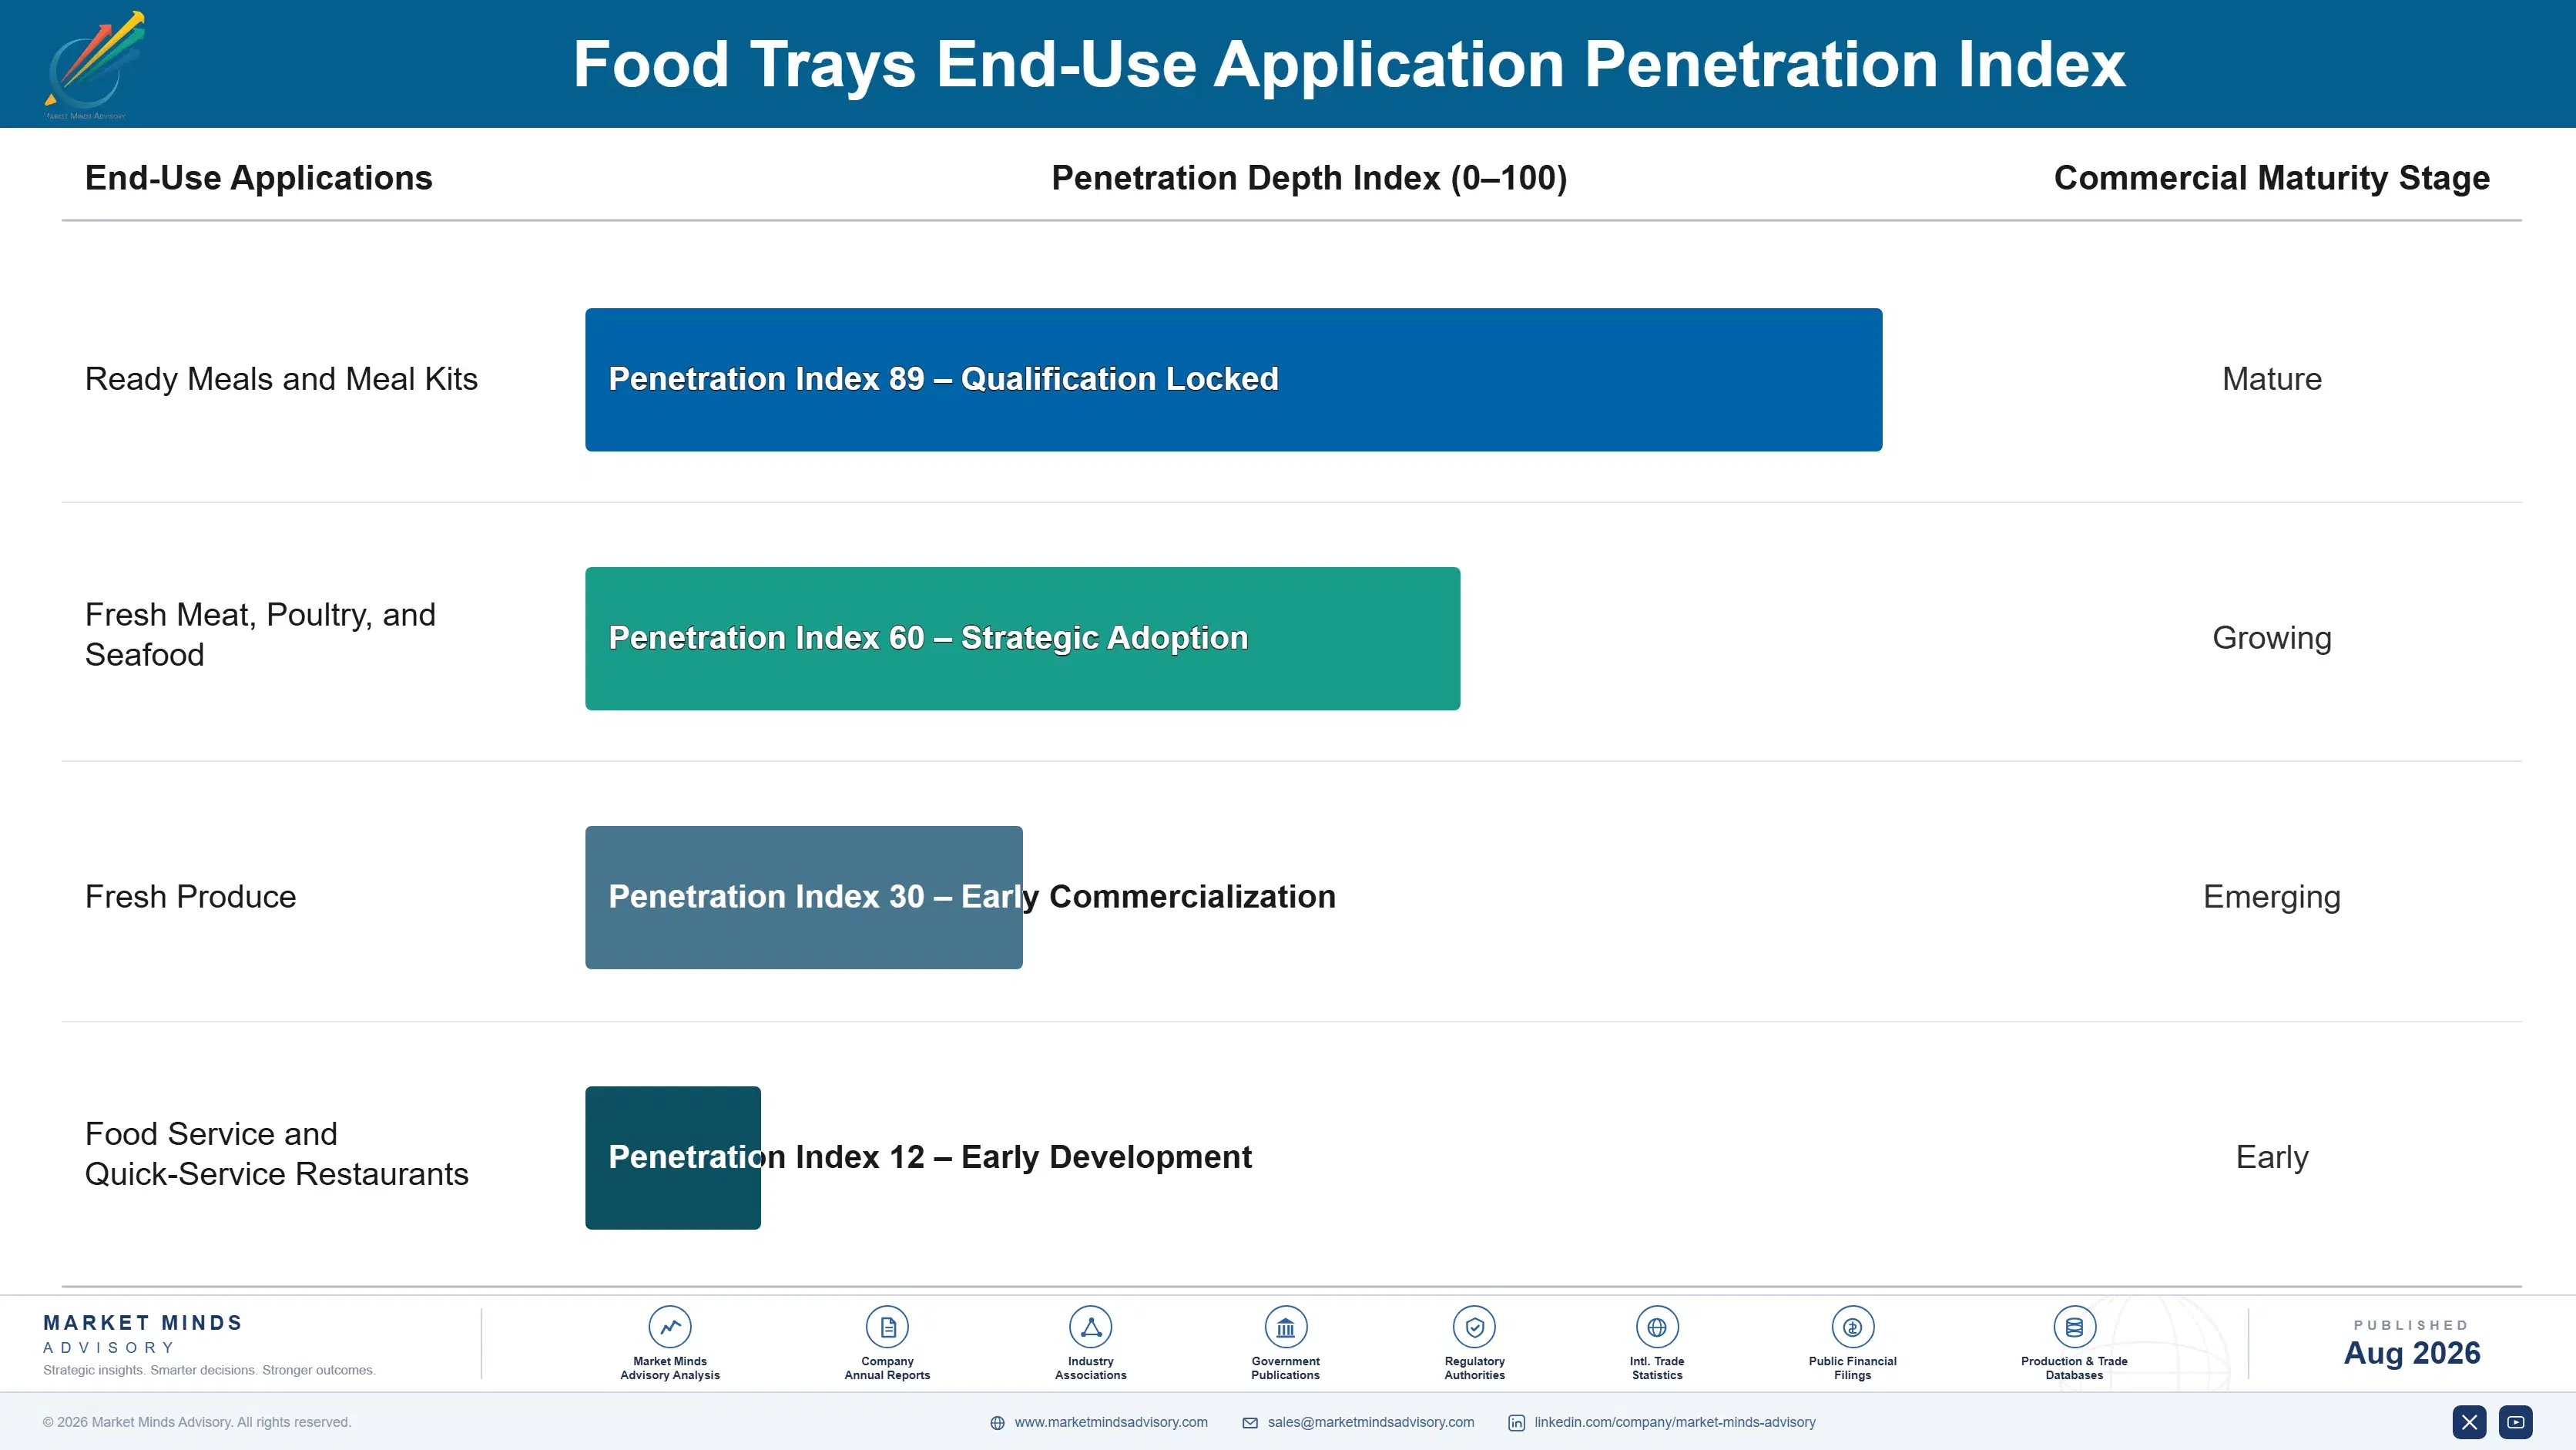
Adoption depth varies sharply by packager type. Large grocery chains and food service operators convert fastest and most completely, standardizing entire packaging specifications onto certified materials once regulatory pressure and retailer mandates align, making them the highest-value account type despite competitive pricing negotiated across the relationship. Smaller regional food processors convert more slowly, often relying on distributor recommendations for years before adopting certified materials directly.

A generational shift in packaging engineers is compounding the regulatory-driven shift. Younger engineers entering practice increasingly expect recycled content certification as standard specification criteria, a requirement an older generation, who trained primarily on cost-per-unit optimization alone, rarely weighted as heavily. That shift is accelerating premium-tier adoption even among packagers that have not yet faced direct pressure to convert away from virgin plastic.
food-trays-market-end-use-penetration-index-1787303997570

What Matters Most Through 2036

These are among the four positions where our research anticipates prominent divergence between winners and laggards over the coming forecast period. Each is grounded in the demand model, the regulatory perimeter, and the announced capacity pipeline.
01 / FIBER CAPACITY TIMING

Build recycled capacity ahead of the next mandate wave

Recycled content mandates continue expanding across additional major food packaging jurisdictions, and converters with established molded fiber and rPET capacity are already capturing disproportionate share of specification wins ahead of the broadest wave of regulatory deadlines still to come. Converters that invest in recycled capacity now will secure preferred-supplier status with major grocery accounts before competitors catch up on the capital investment required. Continuing to treat capacity as a future concern risks ceding the fastest-growing, most differentiated segment to converters already building certified production capacity.
02 / BARRIER COATING TECHNOLOGY DEPTH

Deepen barrier coating capability ahead of the next qualification cycle

Barrier coating performance increasingly decides purchasing decisions as much as unit cost itself, and converters that deepen validated coating pathways will capture disproportionate share of fresh protein and ready-meal category conversions as packagers seek shelf-life confidence without full specification risk. Converters that invest in rigorous, validated coating technology now will build switching costs that protect account relationships better than competitors relying on price alone. This technology investment requires sustained testing spending across multiple years before any single qualification cycle fully rewards that patient positioning choice.
03 / CERTIFICATION REVENUE CAPTURE

Bundle certification and coating technology into every large retail quote

Barrier coating technology and long-term supply agreements already generate meaningfully higher recurring revenue than standard material sales, yet many converters still sell these as separate negotiations rather than a default part of every quote presented to large grocery and food service buyers. Converters that make technology and certification attachment the default, requiring buyers to opt out rather than opt in, will capture materially more lifetime value per account than competitors treating these services as an afterthought. This remains underexploited by every converter outside the two largest players active today.
04 / ASIAN MANUFACTURING COMPETITION

Diversify toward certified segments ahead of continued Asian price pressure

Chinese and Indonesian domestic converters continue expanding aggressively into mid-market plastic and fiber segments, and manufacturers overly dependent on undifferentiated material sales into price-sensitive markets face real margin compression risk across the forecast period covered in this report. Converters that diversify toward certified, differentiated coating and certification sales in segments less exposed to Asian price competition will protect margin better than competitors continuing to compete primarily on undifferentiated commodity-grade material price. This repositioning requires sustained investment in certification well before oversupply pressure fully materializes in each affected market.

Engagement Snapshot From the Field

A live engagement with an industry participant carrying material or product regulatory and market exposure ahead of a defining policy shift, showing how our research translates into a defensible multi-year portfolio strategy.
MARKET MINDS ADVISORY · CLIENT ENGAGEMENT SUMMARY
Food Trays Producer Strategic Portfolio Review and Transition Roadmap 2026·Investment Scenario on Food Trays Exposure Evaluation 2025-26
CLIENT PROFILE
The client is a national grocery retail chain operating over 400 stores and a private-label ready-meal program, with a stated sustainability commitment requiring recyclable packaging across its private-label supply chain by 2027. Annual food packaging procurement spend exceeds $46 million (client-reported, unverified by MMA), concentrated across ready-meal trays, protein trays, and produce packaging nationwide across its network.
STRATEGIC CHALLENGE
The client faced a supplier transition decision balancing packaging material conversion timelines against existing CPET-based supplier relationships and uncertain shelf-life performance parity for fresh protein categories during extended cold chain distribution. Leadership needed a structured evaluation framework weighing sustainability commitment deadlines against spoilage risk across a diverse supplier network spanning multiple regions.
MMA APPROACH
MMA conducted a structured evaluation of the client's current supplier base against recycled content readiness and shelf-life performance data, benchmarked vendor-reported recyclability claims against MMA's proprietary food packaging materials database, and facilitated reference site visits with comparable retailers that had already converted. The engagement combined primary interviews with the client's packaging engineering team alongside independent spoilage rate data verification across multiple product categories.
KEY FINDINGS
  1. Four of the client's fifteen primary tray suppliers lacked molded fiber or rPET production capacity sufficient to support the client's full private-label conversion timeline.
  2. The client's fresh protein and seafood categories showed meaningfully higher spoilage rates with early barrier-coated fiber formats than with existing CPET trays.
  3. Prioritizing rPET for ready-meal categories reduced projected compliance penalty exposure by an estimated 22% relative to continued CPET use, per MMA's model.
  4. Regional recycled feedstock availability varied enough across the client's distribution network to require a phased rather than simultaneous nationwide conversion approach overall.
CLIENT PROFILE
The client is a national grocery retail chain operating over 400 stores and a private-label ready-meal program, with a stated sustainability commitment requiring recyclable packaging across its private-label supply chain by 2027. Annual food packaging procurement spend exceeds $46 million (client-reported, unverified by MMA), concentrated across ready-meal trays, protein trays, and produce packaging nationwide across its network.
STRATEGIC CHALLENGE
The client faced a supplier transition decision balancing packaging material conversion timelines against existing CPET-based supplier relationships and uncertain shelf-life performance parity for fresh protein categories during extended cold chain distribution. Leadership needed a structured evaluation framework weighing sustainability commitment deadlines against spoilage risk across a diverse supplier network spanning multiple regions.
MMA APPROACH
MMA conducted a structured evaluation of the client's current supplier base against recycled content readiness and shelf-life performance data, benchmarked vendor-reported recyclability claims against MMA's proprietary food packaging materials database, and facilitated reference site visits with comparable retailers that had already converted. The engagement combined primary interviews with the client's packaging engineering team alongside independent spoilage rate data verification across multiple product categories.
KEY FINDINGS
  1. Four of the client's fifteen primary tray suppliers lacked molded fiber or rPET production capacity sufficient to support the client's full private-label conversion timeline.
  2. The client's fresh protein and seafood categories showed meaningfully higher spoilage rates with early barrier-coated fiber formats than with existing CPET trays.
  3. Prioritizing rPET for ready-meal categories reduced projected compliance penalty exposure by an estimated 22% relative to continued CPET use, per MMA's model.
  4. Regional recycled feedstock availability varied enough across the client's distribution network to require a phased rather than simultaneous nationwide conversion approach overall.
RECOMMENDED STRATEGY
Phase 1: Phase 1 (Months 1 to 4): Complete supplier readiness assessment and convert ready-meal categories at distribution centers with strong rPET supply access. Phase 2: Phase 2 (Months 5 to 12): Deploy barrier-coated molded fiber for produce and dry goods while tracking spoilage rates against the existing baseline. Phase 3: Phase 3 (Months 13 to 22): Complete conversion across remaining distribution centers and fresh protein categories pending validated performance results.
OUTCOME
The client's first five distribution centers achieved full material conversion with spoilage rates within target range of the previous CPET baseline within ten months of launch (client-reported, unverified by MMA), supporting the phased national rollout that had originally motivated the supplier evaluation engagement. The remaining distribution centers are scheduled for phased conversion over the following twenty-two months.

Frequently Asked Questions

Foundational context covering the market sizes, CAGR, scope, country, region and competition that inform every finding below. This section is provided to cover basics and most often pre-purchase conversations, answered from the MMA Primary Research Dataset.

What is the current size of the Food Trays Market?

MMA estimates the global food trays market at $4.2 billion in 2025. Growth concentrates in molded fiber and rPET formats, driven by recycled content mandates and retailer plastic reduction commitments.

How large will the Food Trays Market be by 2036?

MMA forecasts the market reaching $8.75 billion by 2036, up from $4.49 billion in 2026. That represents roughly a 1.95 times expansion over the full ten-year forecast period covered.

What is the CAGR for the Food Trays Market 2026 to 2036?

MMA's base case forecasts a 6.9% compound annual growth rate, with a bull case of 8.1% and a bear case of 5.6% depending on recycled content mandate expansion timing.

Which segment is growing fastest?

Molded fiber trays lead at a 10.8% CAGR, roughly 1.6 times the overall market rate, as expanding recycled content mandates and retailer pledges pull specification volume into fiber formats.

Who are the major companies in the Food Trays Market?

Sealed Air, Sonoco Products, Genpak, Huhtamaki, and Placon Corporation lead the category, together holding an estimated 44% combined share on a production capacity basis worldwide.

Which country is growing fastest?

Indonesia leads at an estimated 9.9% CAGR, outpacing the global average as expanding food service formalization and rising packaged food consumption continue growing faster than any comparable economy.

Report Segmentation Architecture

The full report scope spans multiple orthogonal segmentation dimensions, with cross-tabulated demand data provided for each dimension pair. Coverage extends further to regional breakdowns, trend trajectories, and the competitive detail needed to support segment-level decision-making.

By Material and Product Type

  • Molded Fiber Trays
  • rPET Trays
  • CPET Trays
  • Expanded Polystyrene Trays
  • Aluminum Foil Trays
  • Paperboard Trays with Barrier Coating

By End-Use Application

  • Ready Meals and Meal Kits
  • Fresh Meat, Poultry, and Seafood
  • Fresh Produce
  • Food Service and Quick-Service Restaurants

By Commercial Dimension

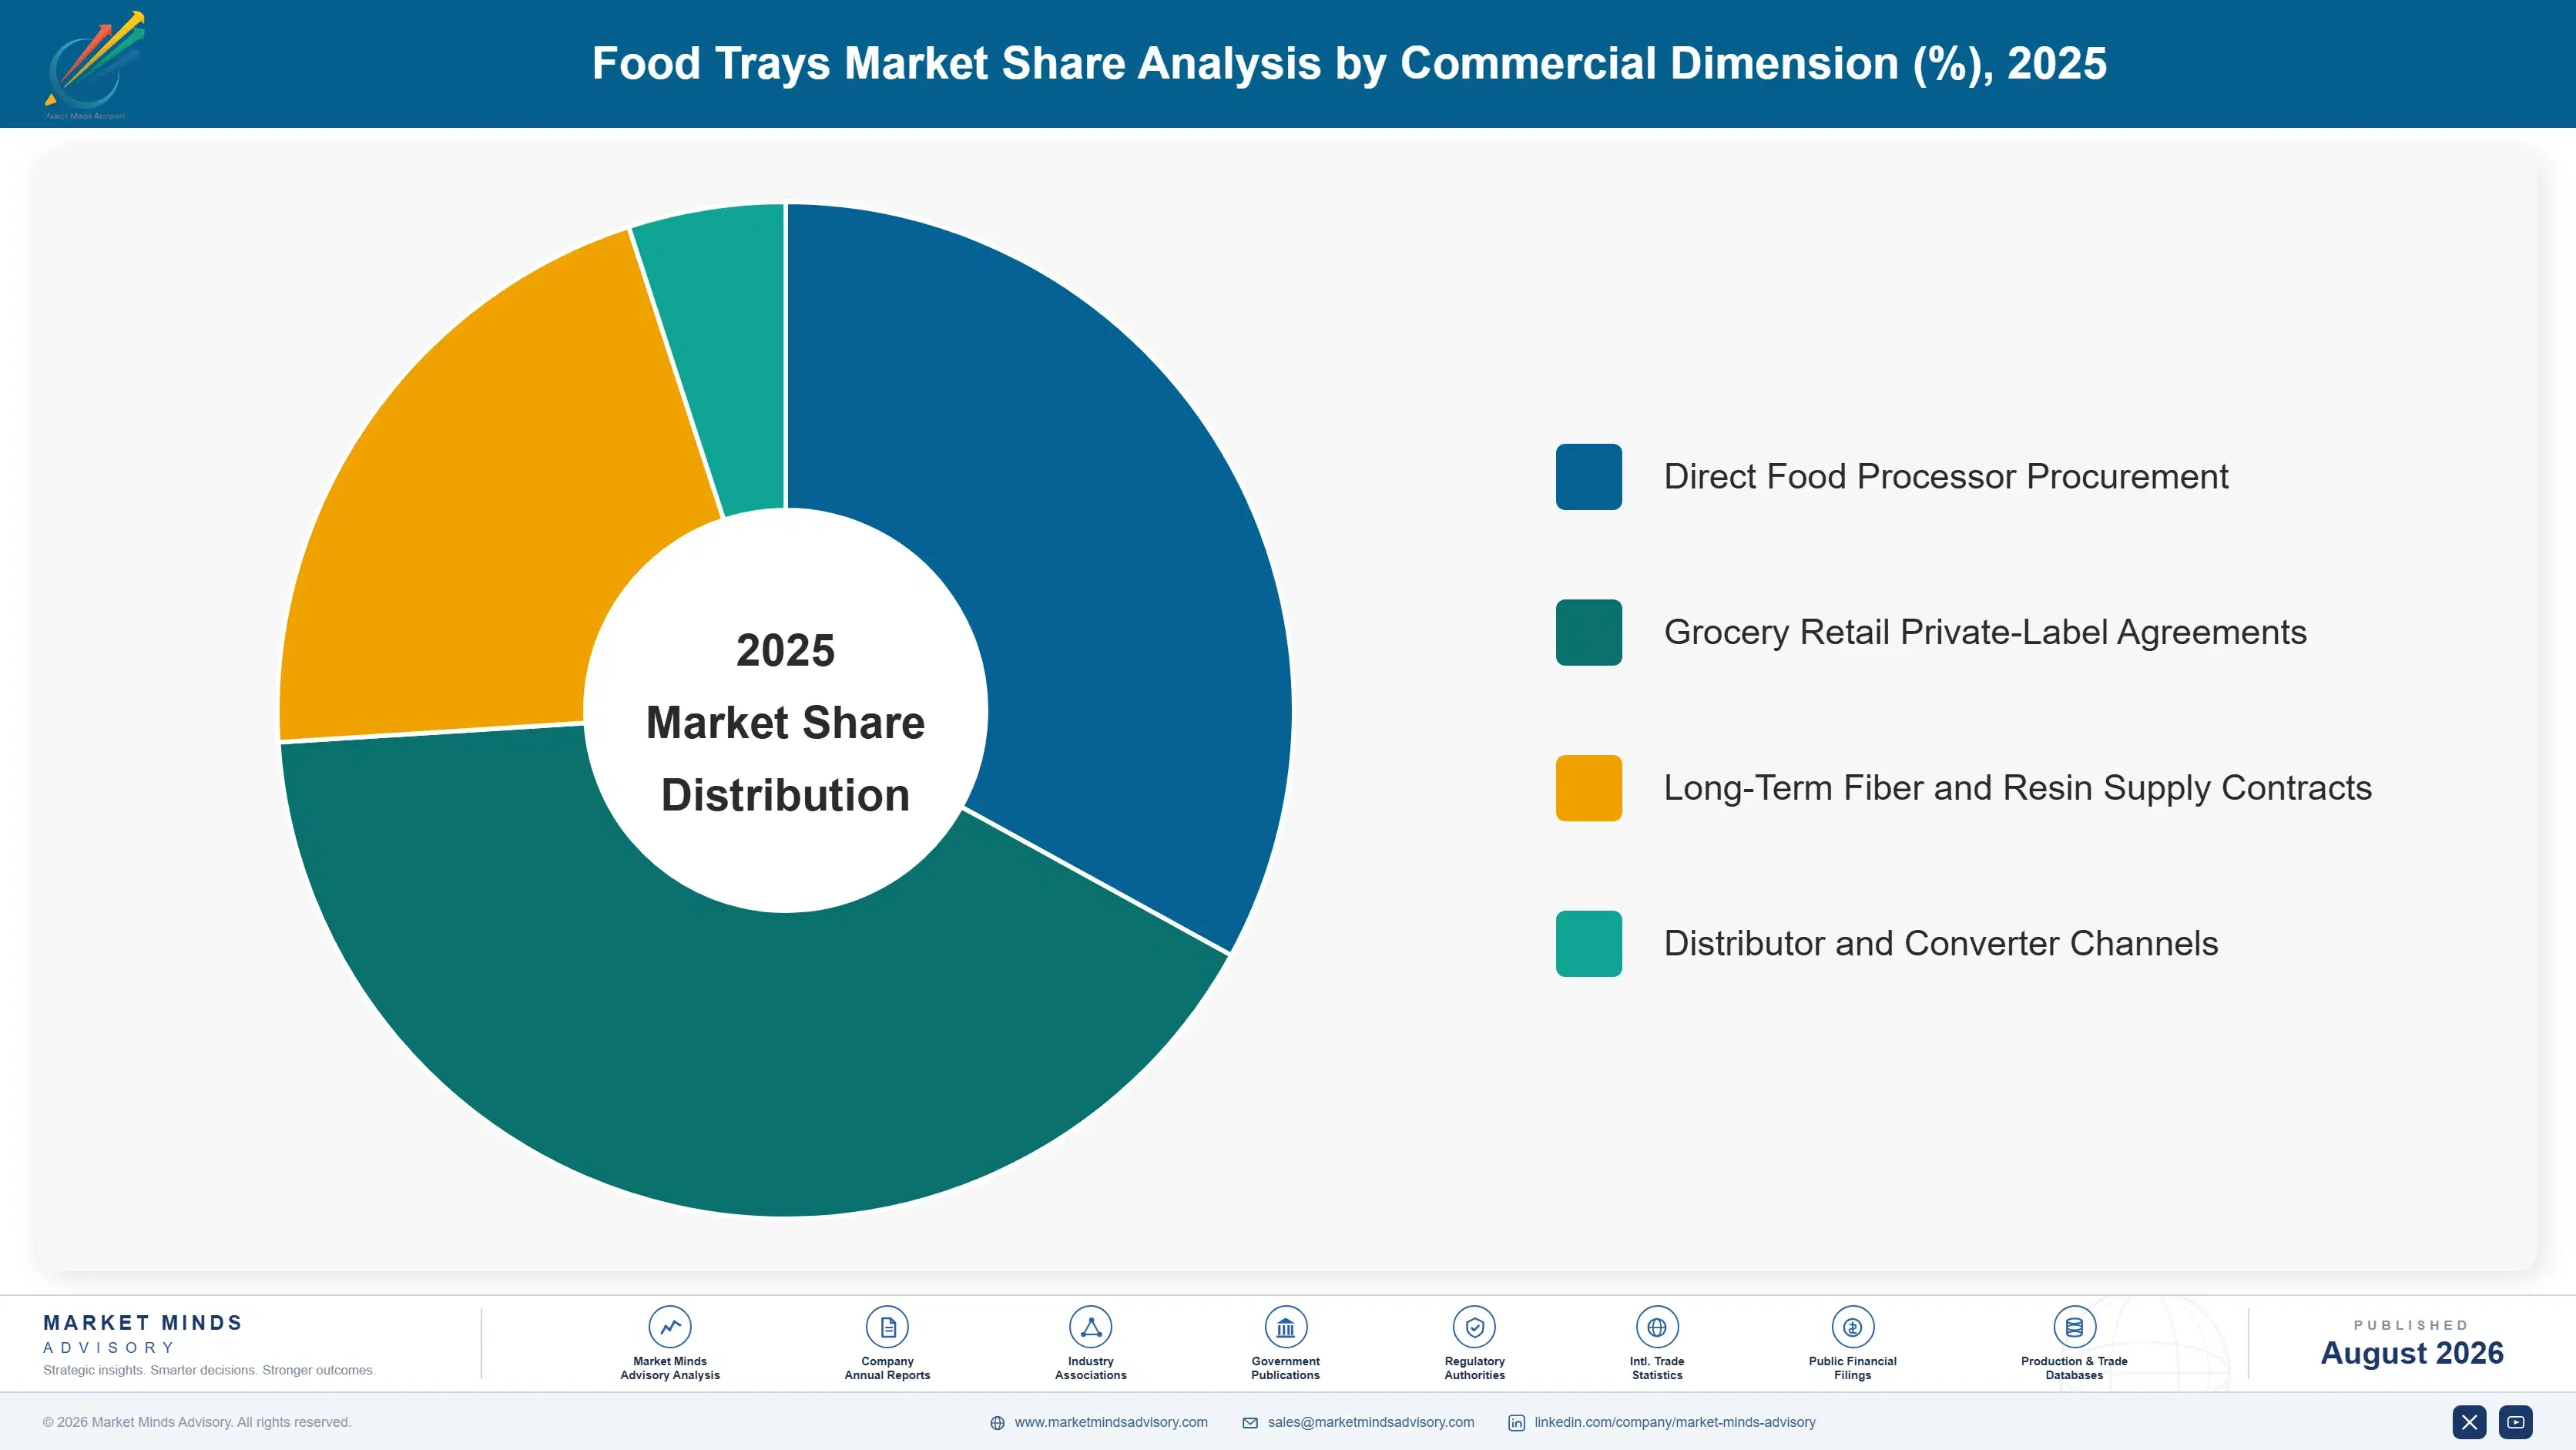
  • Direct Food Processor Procurement
  • Grocery Retail Private-Label Agreements
  • Long-Term Fiber and Resin Supply Contracts
  • Distributor and Converter Channels

By Region

  • North America
  • Western Europe
  • East Asia
  • South Asia and Pacific
  • Latin America
  • Middle East and Africa
  • Eastern Europe

Scope, Methodology, and Coverage

Every figure in this report is reproducible from documented input assumptions. The scope below maps the historical period, the forecast horizon, the segmentation dimensions, and the countries covered, alongside the underlying primary and qualitative methodology.
Historical Period
2020 to 2025
Forecast Period
2026 to 2036
Base Year
2025 (USD billions; MMA Primary Research Dataset, August 2026)
Market Definition
The food trays market covers molded fiber, rPET, CPET, expanded polystyrene, aluminum foil, and barrier-coated paperboard trays used for ready meals, fresh produce, meat and seafood, and food service packaging applications. It excludes general food storage containers not designed for point-of-sale or ready-meal packaging and excludes flexible pouches and bags not incorporating a rigid tray structure.
Quantitative Units
USD billions (current prices); unit shipment volume by material format where applicable
Segmentation Dimensions
By Material and Product Type; By End-Use Application; By Commercial Dimension; By Region
Regions Covered
North America, Western Europe, East Asia, South Asia and Pacific, Latin America, Middle East and Africa, Eastern Europe
Countries Covered
USA, China, Germany, France, UK, Japan, South Korea, India, Indonesia, Australia, Canada, Brazil, Mexico, Vietnam, Thailand, UAE, Saudi Arabia, South Africa, Nigeria, Turkey, Poland, Netherlands, Italy, Spain, Sweden, Switzerland, Argentina, Colombia, Singapore, and additional markets relevant to this sector
Key Companies Profiled
Sealed Air Corporation, Sonoco Products Company, Genpak LLC, Huhtamaki Oyj, Placon Corporation, Pactiv Evergreen Inc., Anchor Packaging LLC, Fabri-Kal Corporation, CKF Inc., Coveris Holdings S.A., Amcor plc, Berry Global Group, Inc., D&W Fine Pack LLC, Faerch A/S, Reynolds Consumer Products Inc., Winpak Ltd., Tray-Pak Corporation, Ecopax LLC, Novolex Holdings, Inc., WestRock Company
Quantitative Methodology
Primary survey, n=3,800 respondents, Q4 2025, six countries; demand-side model with trade association cross-validation
Qualitative Methodology
47 expert interviews, Q4 2025; applied to validate demand model assumptions, identify emerging dynamics, and assess competitive positioning
Report Format
PDF and XLSX data workbook (Word format preview document)
Publisher
Market Minds Advisory
Report Code
MMA-2026-PAC-105
Published
August 2026
Contact
sales@marketmindsadvisory.com | www.marketmindsadvisory.com

Purchase the full Food Trays Market Report (2026 to 2036).

The full Food Trays Market report delivers granular five-year and ten-year forecasts across all six material segments, packaging regulation tracking by region, and converter benchmarking drawn from MMA's proprietary food packaging materials database. It includes detailed profiles of all twenty companies covered here, extended regional analysis across every major food packaging market, and a regulatory tracker spanning recycled content mandates and EPS restrictions. Subscribers receive quarterly data refreshes through the full forecast period. Buyers also gain direct analyst access for engagement-specific questions throughout the subscription term.
Recycled content mandate tracker by region
Ten-year segment-level forecasts across all material types
Converter benchmarking data across capacity and pricing
EPS restriction and regulation tracking module
Twenty-company competitive profiles with moat analysis
Quarterly data refresh access throughout subscription

Built For The People Who Decide

From boardroom strategy to bench-side execution, this report is read cover-to-cover by leaders shaping the next decade of their industry, turning demand scenarios, market dynamics and valuation benchmarks into decisions.
CXOs/ Presidents/ VPs/ Managers
M&A and Corporate Development
Strategy Teams and R&D Heads
Procurement and Product Directors
Regulatory and Compliance Leaders
Investor Relations and Equity Analysts