Market Minds Advisory
Food Packaging Market

Food Packaging Market: Recyclability And Shelf Life Are Pulling Against Each Other

Strip the barrier layer out of a pack to make it recyclable and the food inside spoils sooner. Wasted food carries eight times the carbon of the packaging protecting it.

Lead Analyst

Bilal Shaikh

Published

August 2026

Make Smarter Decisions with Customized Research Insights

Request a free sample report and evaluate market opportunities, growth trends, and competitive dynamics relevant to your business needs.

2025 MARKET VALUE$382.0BMarket Size 2025
2036 FORECAST VALUE$626.5BBase Case , 2026 to 2036
CAGR 2026 TO 20364.6 %Bull 5.8% / Bear 3.4%
INCREMENTAL OPPORTUNITY$226.9BNet 10- year value creation
EXPANSION MULTIPLE1.57x2036 value over 2026 base
Strategic Levers
M&A Pipeline
Regional Outlook
Country Rankings
Competitive Intelligence
Segmental Deep-dive
Call-Us : 91 93563 13602

Executive Snapshot and Market Trajectory

This industry is being asked to do two things that directly conflict. Removing barrier layers makes a pack recyclable and shortens the shelf life of what is inside it, and wasted food carries roughly eight times the carbon impact of the packaging that was protecting it.
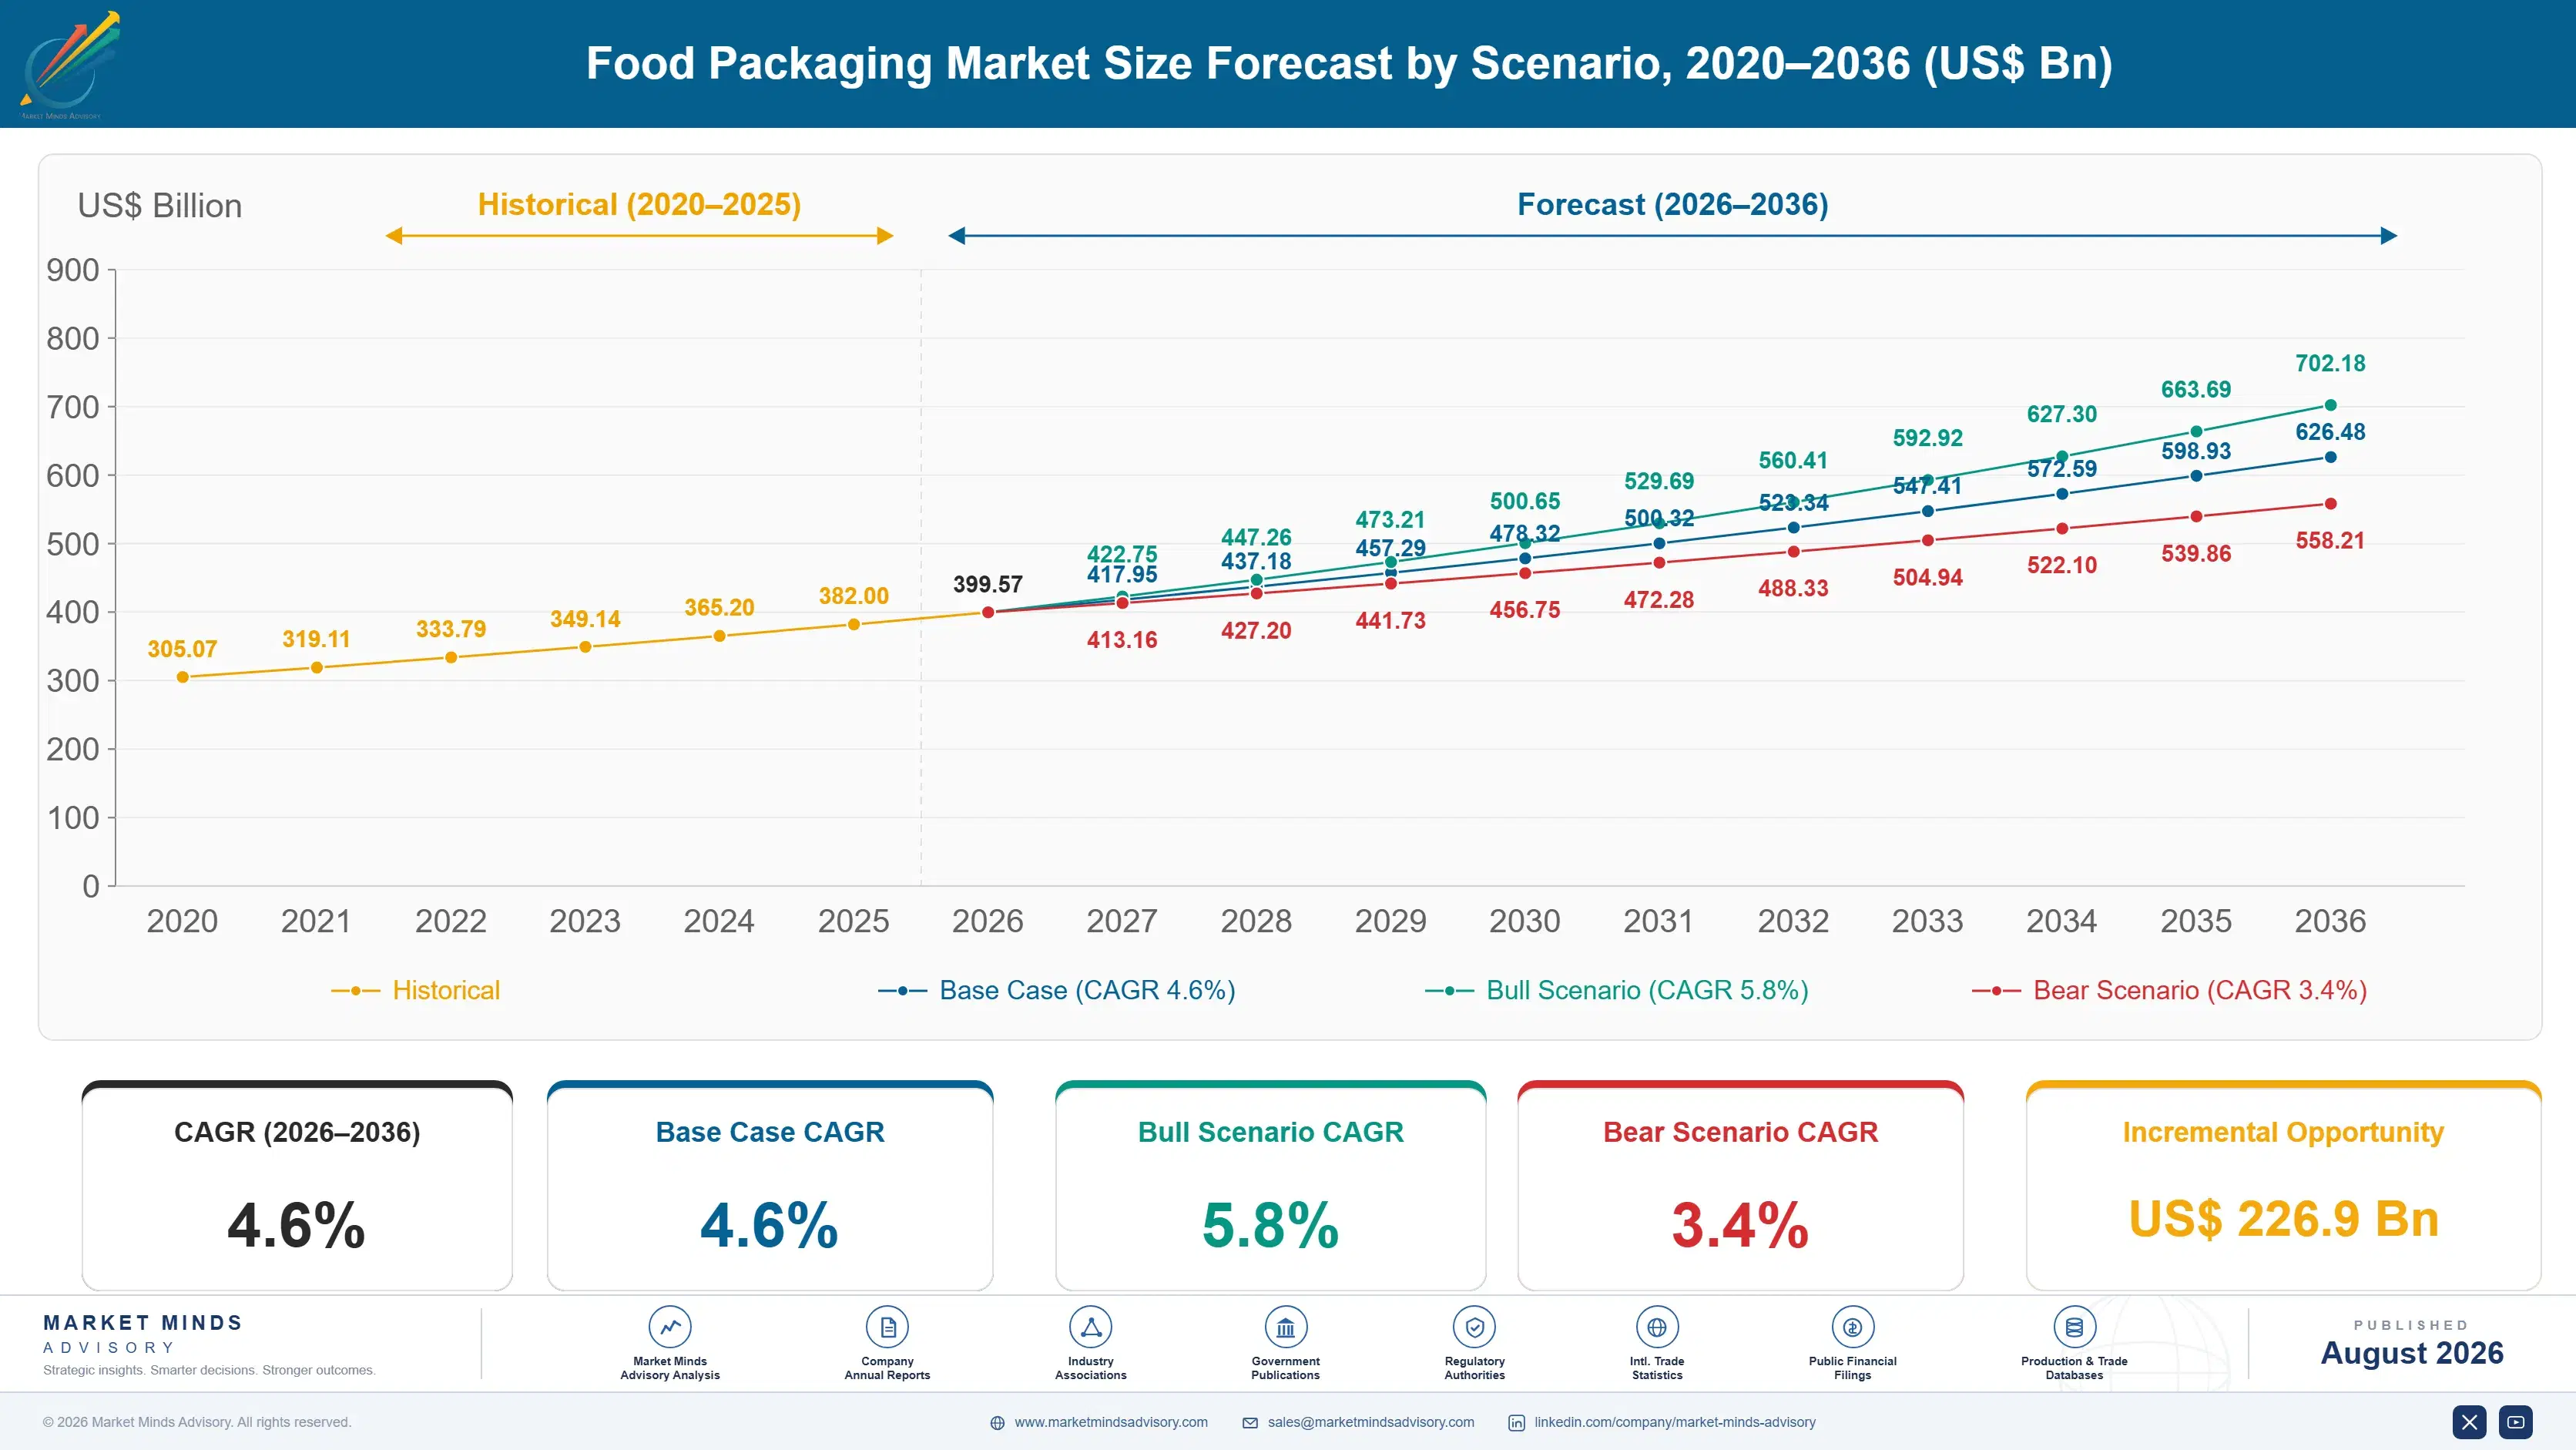
The market reaches USD 382.0 billion in 2025 and compounds at 4.6% to USD 626.49 billion by 2036. Compostable and bio-based materials grow fastest at 9.2%, exactly 2.00 times the market rate, though from a base small enough that the percentage overstates it. East Asia holds 30% of value, and South Asia and Pacific takes 14%, above this framework's band, on packaged food penetration rising from a low base.
Concentration is remarkably low at 17% across the top five, because packaging material, geography, and food category each fragment the supplier base quite independently of one another. Extended producer responsibility fees have quietly become the largest single regulatory variable in the whole of packaging design. Packaging structures are now selected against a published fee schedule at least as much as against any technical performance requirement that the food inside the pack actually imposes on them.
Market Definition
The food packaging market covers primary and secondary packaging in direct or protective contact with food products, spanning paper and paperboard formats, flexible plastic films and laminates, rigid plastic containers, metal cans and closures, glass containers, and compostable and bio-based materials. Beverage-only packaging including carbonated soft drink and alcoholic beverage containers, pet food packaging, food service disposables sold for on-premise use, packaging machinery, transit and distribution packaging, and food ingredient bulk containers are excluded.
Base Year Value
$382.0B in 2025 (MMA Primary Research Dataset, August 2026)
Forecast Period
2026 to 2036, eleven discrete annual values
CAGR
4.6% base case. Bull 5.8%. Bear 3.4%.
Fastest Growth Segment
Compostable And Bio-Based Materials: 9.2% CAGR
Fastest Growth Country
India: 8.2% CAGR
Fastest Growth Region
South Asia and Pacific: 7.0% CAGR
Largest Region
East Asia: 30% of 2025 global value
Market Leaders
Amcor, Tetra Pak, Berry Global, Smurfit Westrock, Sealed Air. Source: MMA Primary Research Dataset, July 2026.
Primary Survey
n=3,800 procurement and R&D decision-makers, Q4 2025, six countries
Methodology
Demand-side build-up, cross-validated against public data, 47 expert interviews

Food Packaging Market Forecast Scenarios

food-packaging-market-size-forecast-scenario-1787298198728
The 2020 to 2025 period saw demand shift channel rather than change size. Food service packaging collapsed through 2020 while retail grocery packaging surged, then the pattern reversed unevenly across 2022 and 2023. Resin and containerboard pricing moved violently in both directions underneath. A 3.6% historical CAGR describes an average across a period when no individual material or channel behaved like the total did.
Three mechanisms carry the 4.6% base case. Packaged food penetration across Asia is the largest, since urbanisation, refrigeration access, and organised retail all convert loose food sales into packaged ones. Regulatory material substitution is the second, as producer responsibility fees and recycled content rules push structures toward fibre and mono-material plastics. And convenience format proliferation is the third, since smaller portions and ready meals consume more packaging per kilogram sold.
The 5.8% bull case rests on regulators pricing food waste alongside packaging waste in producer responsibility calculations, which would reward barrier performance rather than penalising it and reopen material choices the industry has been forced to abandon. The 3.4% bear case is reuse and refill scaling faster than expected in developed grocery, since a returned container removes packaging demand permanently rather than substituting between materials.

Two Objectives Pulling Opposite Ways

The central tension in food packaging is arithmetic rather than ideological. A multi-layer laminate with an aluminium or ethylene vinyl alcohol barrier delivers shelf life that a recyclable mono-material structure currently cannot match, with the gap running near 40% on some chilled and ambient categories. Wasted food carries roughly eight times the carbon of the packaging protecting it. Regulation counts the packaging and ignores the food.
TOP FIVE CONCENTRATION17%Fragmented by material, geography and food category alike
FOOD WASTE MULTIPLE8 timesCarbon impact of wasted food against the packaging protecting it
MONO-MATERIAL BARRIER GAP40%Shelf life shortfall against equivalent multi-layer laminate structures
PRODUCER RESPONSIBILITY FEEUSD 240/tonneCharge levied on packaging placed onto European markets
RECYCLED CONTENT TARGET30%Share required in plastic food packaging under European rules
PACKAGING COST SHARE9%Portion of packaged food retail price attributable to packaging
Producer responsibility fees have quietly become the most important number in packaging design. European schemes now charge by weight and by recyclability grade at rates near USD 240 per tonne, and brands calculate that exposure centrally across their whole portfolio. A structure that costs slightly more to buy and considerably less in fees wins on total cost. Design teams now work to a fee schedule alongside a technical specification.
Fragmentation here is genuine rather than a measurement artefact. Glass, metal, fibre, rigid plastic, and flexible film are separate industries with separate assets and separate customers, food categories have incompatible requirements, and freight economics keep converting regional. Seventeen percent across the top five reflects a market that has never had a reason to consolidate across those boundaries.
"Every brand I speak with has a recyclability target and a food waste target, set by different teams, and nobody has reconciled them. The first one to publish an honest carbon comparison across both is going to embarrass a lot of packaging pledges."
Director, Packaging Materials And Sustainability Practice · MMA Packaging Practi

Market Trends

Mono-Material Structures Trade Barrier For Recyclability

Replacing multi-layer laminates with all-polyethylene or all-polypropylene structures makes a pack recyclable in existing streams, and it costs shelf life. Coated and metallised mono-material films have closed part of the gap, but on oxygen and moisture sensitive categories the shortfall still runs near 40% against a conventional barrier laminate. Brands are converting anyway, because producer responsibility fees and retailer commitments both price recyclability while nothing prices the resulting food waste. That asymmetry is doing considerably more to shape material selection today than any technical development has managed. Nothing in the current regulatory framework counts the spoilage that follows.
Market Impact: Penetration below 30% in India
Producer Responsibility Fees Drive Design Before Performance

European schemes now price packaging by weight and recyclability grade at rates near USD 240 per tonne, and the spread between best and worst material choice on the same function can exceed four times. Brands model that exposure centrally across entire portfolios and specify once for every market they serve. A structure that costs slightly more to buy and much less in fees wins the total cost comparison easily. Packaging design has therefore become partly a fee optimisation exercise, which nobody in this industry seriously anticipated even five years ago.
Market Impact: Uses 3 times more material

Market Opportunities and Growth Drivers

Asian Packaged Food Penetration Rises From A Low Base

Urbanisation, household refrigeration, and organised retail together convert loose and wet-market food sales into packaged ones, and the conversion is nowhere near complete across India, Indonesia, Vietnam, and much of China. Packaged food penetration in Indian urban households remains far below any developed market benchmark while rising every year. Each converted transaction adds packaging demand permanently rather than cyclically, and it never reverses. This is by some distance the largest single source of genuine volume growth anywhere in the industry across the forecast period, and it has decades left to run.
Market Impact: Food waste carries 8 times carbon

Convenience Formats Consume More Packaging Per Kilogram

Single-serve portions, ready meals, meal kits, and snacking formats all use substantially more packaging material per kilogram of food sold than bulk or family formats do, and household size has been falling across almost every developed and middle-income market. Ready meal trays, compartmented packs, and portion sachets each add material that a single large pack would not require. Retailers push the formats because they carry higher margin per kilogram. Packaging demand therefore follows the format shift rather than the underlying food volume, which is why tonnage keeps rising in markets where food consumption is flat.
Market Impact: Displaces 25 single-use packs

Market Restraints and Challenges

Recyclability Targets Ignore The Food Waste They Cause

Removing barrier layers to make packs recyclable shortens shelf life on sensitive categories by as much as 40%, and wasted food carries roughly eight times the carbon of the packaging that protected it. The root cause is that producer responsibility schemes measure packaging placed on market and nothing measures the spoilage that follows a specification change. Commercially this forces brands into conversions that raise their real environmental impact. Participants are mitigating through coated mono-material development, through fibre-based barrier systems, and through publishing comparative life cycle data that regulators have so far mostly ignored.
Market Impact: Shelf life falls up to 40%

Reuse And Refill Removes Packaging Demand Permanently

A returned and refilled container displaces every single-use pack it replaces across its service life, which is a permanent removal of demand rather than a substitution between materials. The root cause is that reuse systems finally have the retail logistics and deposit infrastructure to function at scale in dense urban markets. Commercially this is the only trend in packaging that shrinks the market outright. Mitigation runs toward supplying reusable container systems directly, toward washing and return logistics services, and toward food categories where hygiene rules make container reuse impractical for the foreseeable future.
Market Impact: Fee spread exceeds 4 times
3 additional market trends, 4 additional growth drivers, and 2 additional restraints and challenges are covered in the full report. Contact sales@marketmindsadvisory.com to access the complete intelligence.

Segment CAGR and Growth Architecture

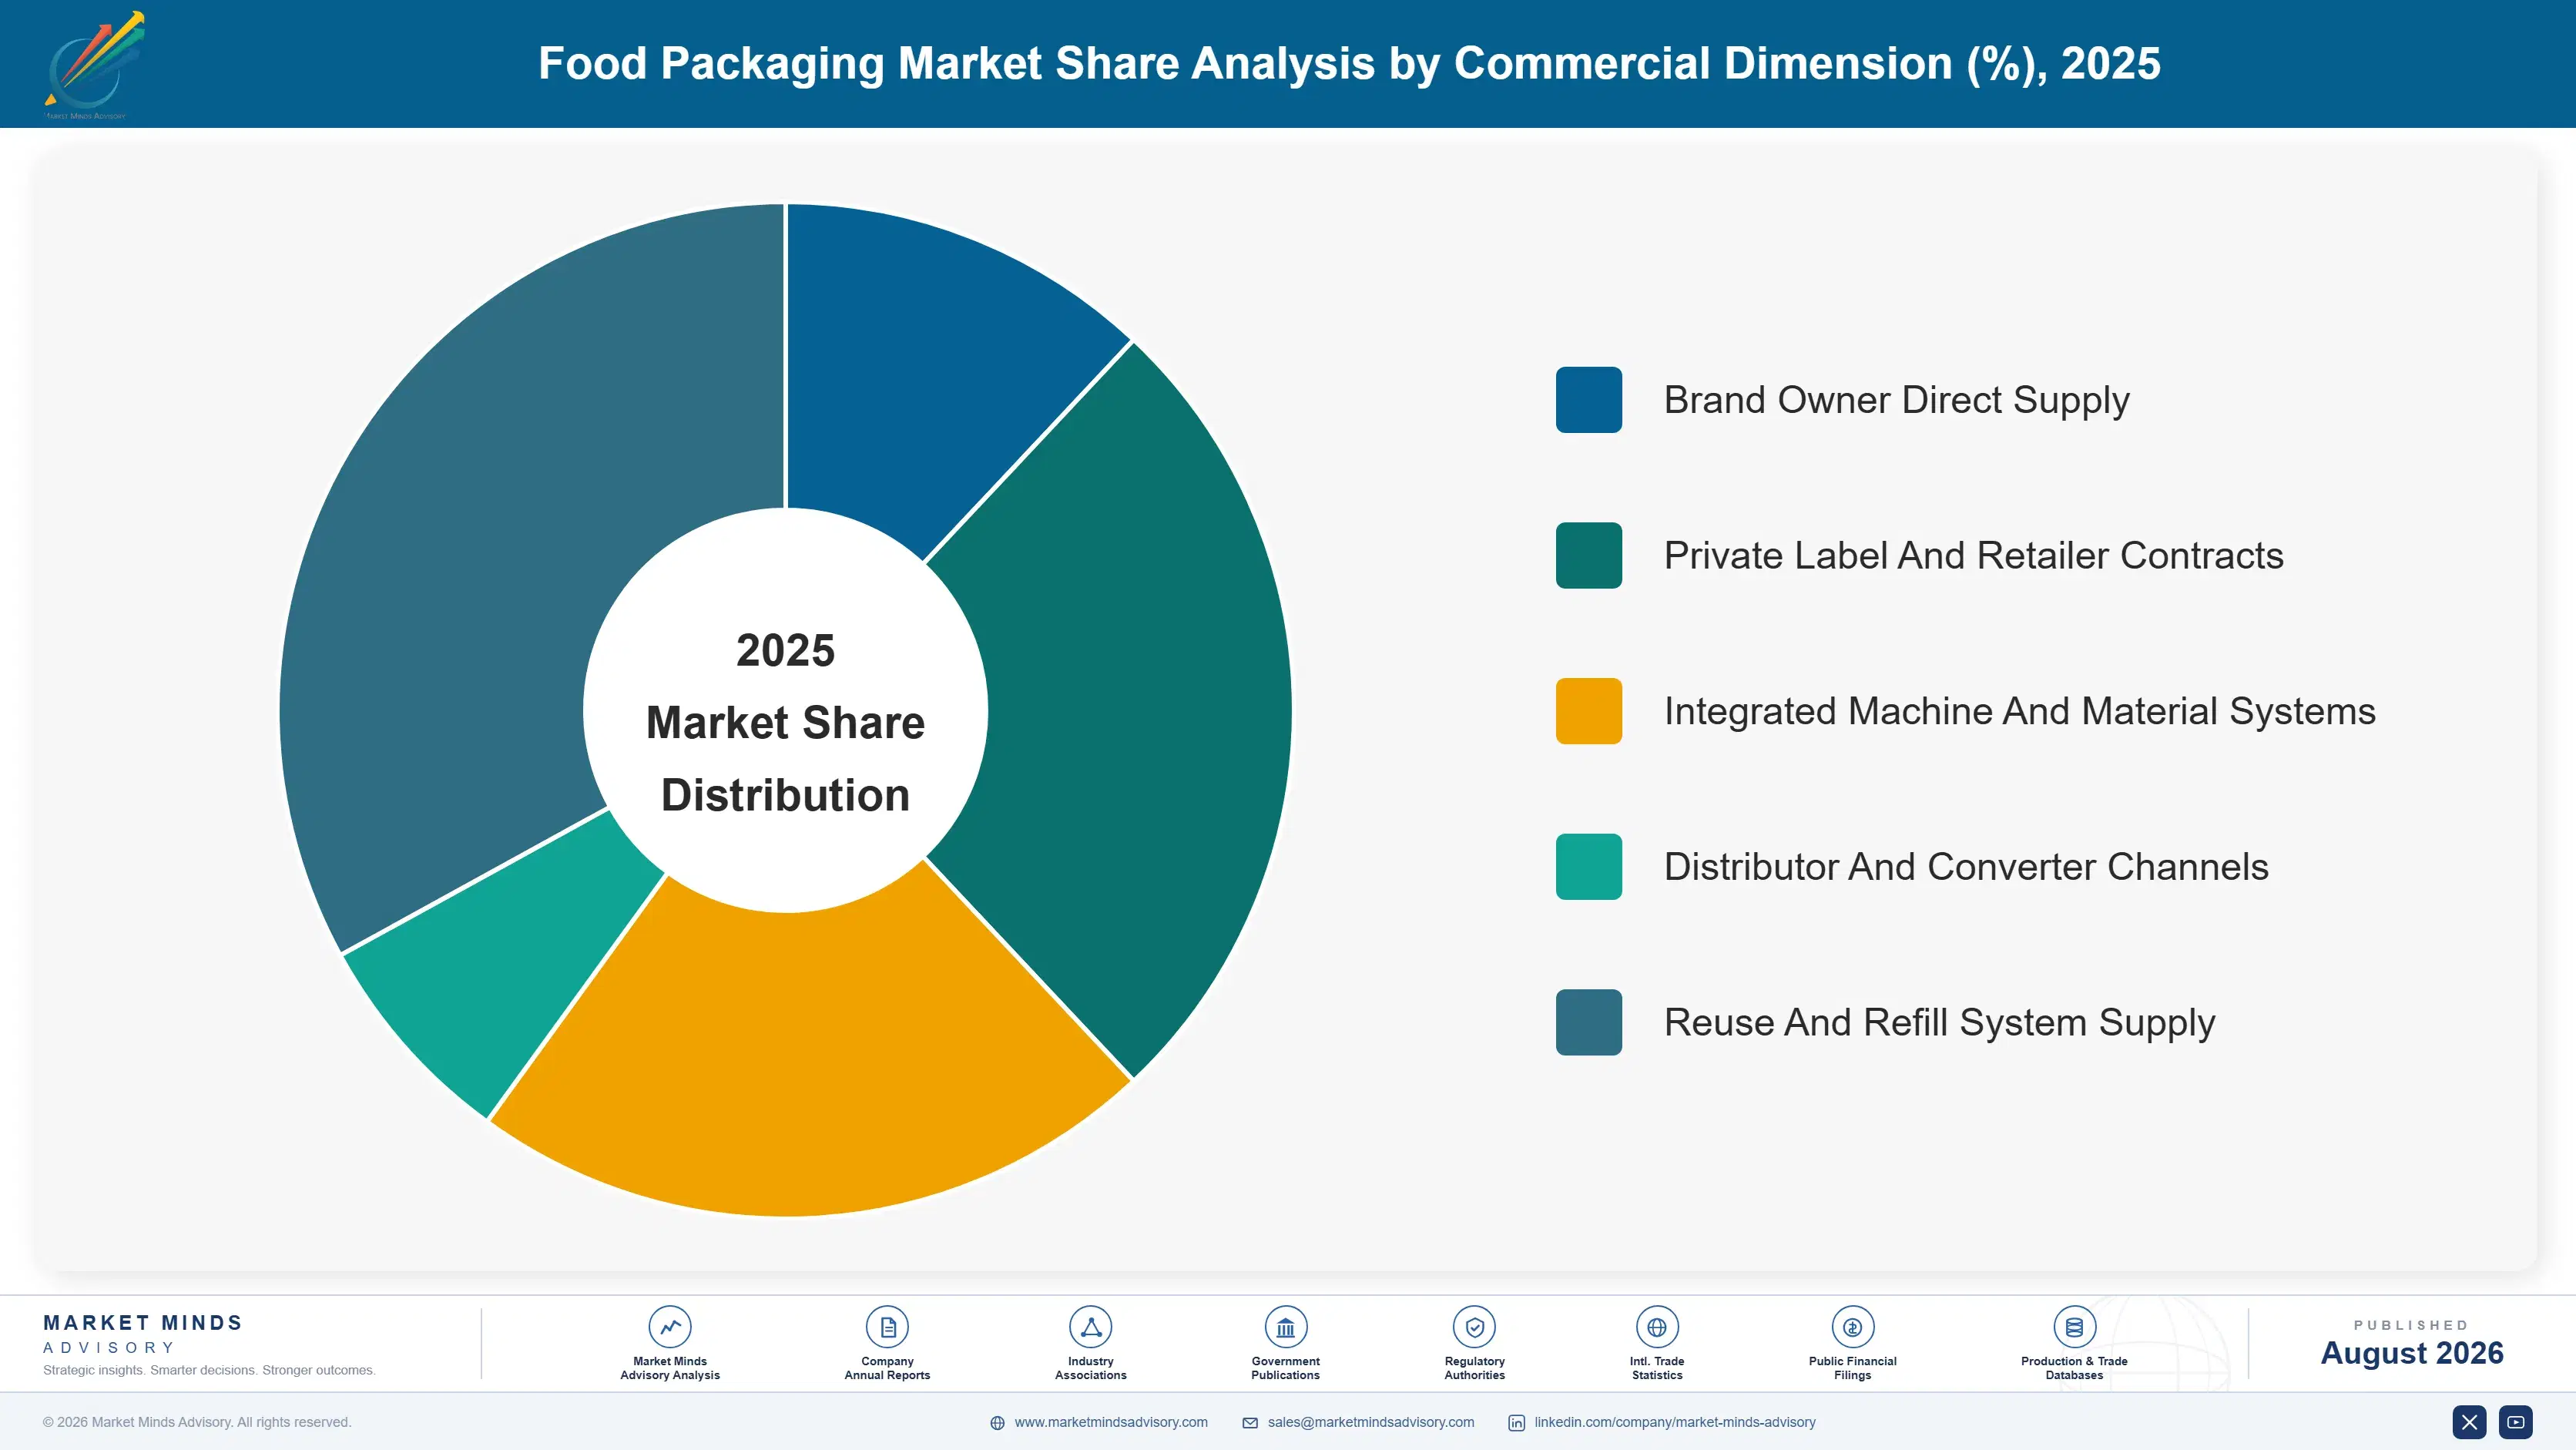
Segmentation follows packaging material, because material determines the converting assets required, the barrier performance achievable, the producer responsibility fee a brand pays, and which suppliers can even bid for the work. Food category, pack format, and distribution channel are handled in the framework and in commentary rather than being treated as separate segments here.
food-packaging-market-market-share-analysis-1787298199270

Compostable And Bio-Based Materials

Compostable and bio-based materials grow fastest at 9.2%, exactly 2.00 times the market rate, from a base small enough that the percentage overstates what is really happening on the ground. Polylactic acid, bagasse moulded fibre, cellulose films, and starch-based structures all sit here, and adoption concentrates where municipal composting infrastructure actually exists rather than where brands would like it to. Barrier performance remains the weak point on anything oxygen or moisture sensitive. Cost runs well above conventional equivalents on almost every format currently available. Regulatory support and retailer commitments rather than any performance advantage are carrying the growth here. Food service and fresh produce account for most of the volume actually shipping today.
CAGR 9.2%

Paper And Paperboard

Paper and paperboard grow at 6.1%, taking share from rigid and flexible plastics across trays, wraps, cartons, and secondary packaging as producer responsibility fees and retailer commitments both favour fibre. Barrier coatings have improved enough to reach categories that were plastic-only a decade ago, though grease, moisture, and oxygen sensitive products remain difficult and coatings frequently compromise the recyclability that justified the switch. Moulded fibre has moved well beyond egg cartons into fresh produce, ready meals, and chilled protein trays. Producer responsibility fees favour fibre heavily on both weight and recyclability grade. Fibre pricing is volatile and passes through to brands considerably faster than most of them expect. Secondary and transit-adjacent formats have converted almost entirely already.
CAGR 6.1%
Full segment breakdown across 6 segments available in the complete report.

Regional Architecture and Country Demand Map

Regional shares here track packaged food consumption rather than population, and the difference between the two is the whole growth story. Developed markets are converting between materials without adding any volume at all, while Asian markets are steadily converting loose and wet-market food sales into packaged ones.

East Asia

East Asia holds 30% of value, the largest share of any region, on Chinese food processing volume that exceeds anything elsewhere by a wide margin. Convenience formats, single-serve portions, and prepared meals have grown extremely fast in Chinese urban markets, and each consumes more packaging per kilogram than the loose sales they replaced. Domestic converters supply almost everything used here at prices imported packaging cannot begin to approach. Japanese and Korean packaging is technically sophisticated and heavily oriented toward small portions and freshness. Producer responsibility rules are developing but not yet binding at European levels. Growth at 5.5% exceeds the global rate on format shift rather than on any material substitution programme.
Share: 30% | CAGR: 5.5% (2026 to 2036)

South Asia and Pacific

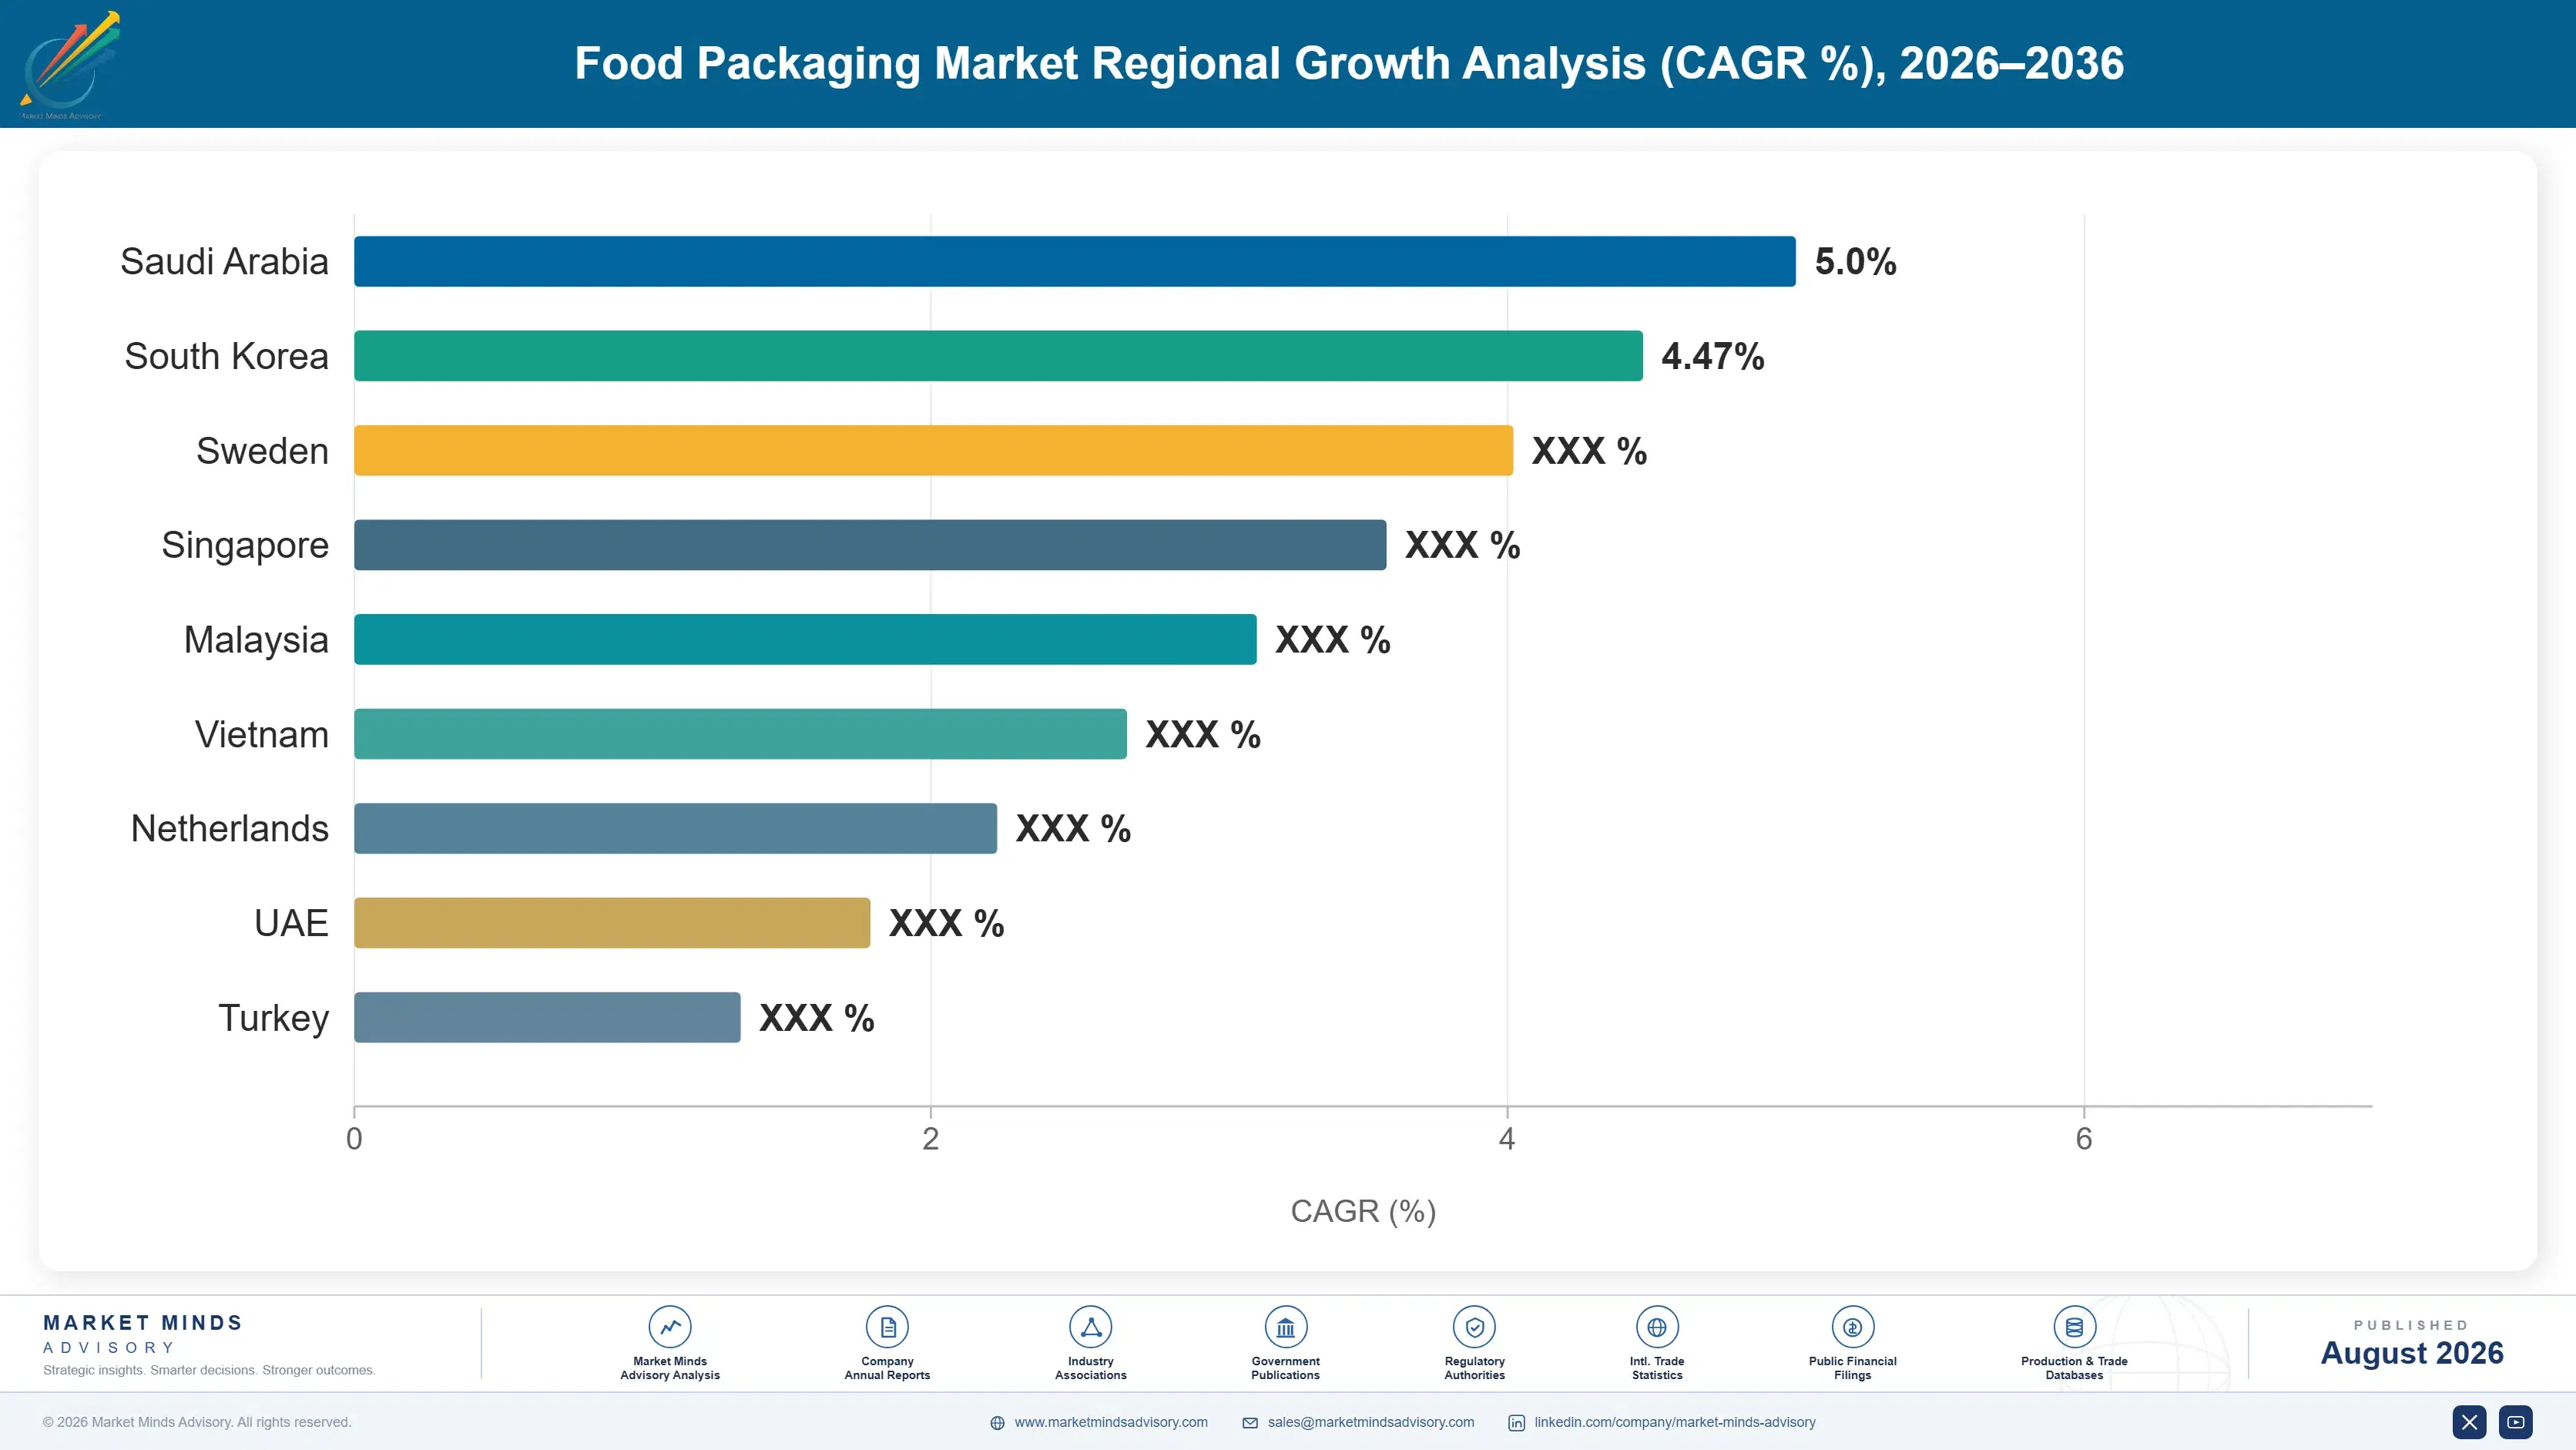
South Asia and Pacific takes 14% of value against a 12% ceiling in this framework, and Indian packaged food conversion explains the breach entirely. Packaged food penetration in Indian households remains far below developed market levels and rises every year as refrigeration access, organised retail, and urban incomes all expand together. Sachet and single-serve formats dominate because they match household purchasing patterns rather than because anybody prefers them. Southeast Asian markets follow broadly similar trajectories from comparably low penetration levels. Regional converters supply nearly all of it, with multinational groups holding only premium positions. Growth at 7.0% is the fastest of any region and it comes from genuinely new packaged volume.
Share: 14% | CAGR: 7.0% (2026 to 2036)
Regional intelligence for 5 additional markets available in the complete report: North America, Western Europe, Latin America, Middle East and Africa, Eastern Europe. Contact sales@marketmindsadvisory.com.
food-packaging-market-country-cagr-analysis-1787298199784

Where Converters Still Hold Pricing

Material substitution is happening whether a converter participates or not, so the levers that matter are about arriving before the specification is fixed rather than quoting against it afterwards. Fee modelling, barrier development, shelf life evidence, and reuse system supply each do that. Four follow, and none of them competes on price per thousand units.

Model Producer Responsibility Exposure Across Brand Portfolios

European fee schedules price packaging by weight and recyclability grade, and the spread between best and worst choice on the same function can exceed four times, at rates near USD 240 per tonne. Most brands calculate fees centrally while specifying packaging through procurement teams who never see that line. A converter modelling total portfolio exposure and redesigning against it reaches the specification years ahead of any tender, and it charges design fees of USD 60,000 to USD 200,000 for each portfolio programme it runs. Very few converters have built the capability to do this at all.
Market Impact: Design fees run USD 60,000 to 200,000 each

Develop Barrier Coatings For Fibre And Mono-Material

The single largest technical constraint in this market is that recyclable structures lose roughly 40% of shelf life on sensitive categories, and whoever closes that gap sells into every conversion programme running worldwide. Coating development costs USD 5 million to USD 20 million per platform and takes three to five years including food contact approval. It also creates a licensing revenue stream from every converter unable to develop a platform of their own. This is the one remaining place where genuine and defensible technical advantage still exists anywhere in food packaging.
Market Impact: Costs USD 5 to 20 million per platform

Sell Shelf Life Evidence Alongside Every Structure

Brands converting to recyclable materials rarely quantify the spoilage consequence, because nobody in the packaging supply chain volunteers a number that complicates the sale. A converter running comparative shelf life testing and publishing the results becomes the technical authority inside that account rather than one more supplier submitting a quotation. Testing programmes cost roughly USD 40,000 per category and routinely reveal that a slightly heavier structure delivers lower total impact, which protects the higher value specification rather than conceding it. Brands rarely have the testing capability to contradict a well-run comparison.
Market Impact: Testing costs around USD 40,000 for each category

Supply Reusable Container Systems And Return Logistics

Reuse is the only development in packaging that removes demand outright rather than simply moving it between materials, and a converter watching that happen from outside the system loses volume permanently. Supplying the reusable containers, the washing operations, and the return logistics converts that threat into a service business carrying genuinely recurring revenue instead. System contracts typically run five to seven years and cover somewhere between 40 and 120 retail sites, and the operator effectively holds the whole category once retail return infrastructure has been built around its own container format.
Market Impact: Contracts run 5 to 7 years per system

Who Controls the Margin Pool

Concentration is remarkably low at 17% across the top five, and it reflects genuine fragmentation rather than any measurement problem. Glass, metal, fibre, rigid plastic, and flexible film are separate industries with separate assets and customers. All participants here are compared on measured global revenue from food packaging specifically, which requires separating that line from beverage, industrial, and healthcare packaging inside the diversified groups.
Competition runs within material rather than across it, which is why a food brand routinely uses six suppliers for one product line. Amcor and Sealed Air compete in flexible films and protein packaging. Tetra Pak holds aseptic carton systems where the filling machine and the material are sold together. Smurfit Westrock and Graphic Packaging compete in fibre. Crown, Ball, and Ardagh hold metal and glass positions that barely interact with the plastics business.

Pressure is building around barrier technology rather than around price. Whoever closes the shelf life gap between recyclable and conventional structures sells into every conversion programme running worldwide, and several groups are investing heavily. Rankings shift most where a converter reaches a brand's packaging specification before the tender, since fee modelling and shelf life evidence both operate years upstream of any purchase order.
food-packaging-market-company-positioning-matrix-1787298200310

Competitive Moat and Risk Dimensions

AMCOR

Moat: Global Flexible Film Development Capability

Amcor operates flexible packaging development and manufacturing across most major markets, which lets a multinational brand qualify one structure and deploy it worldwide rather than requalifying regionally. Its mono-material and barrier coating development programmes are among the largest in the industry. That combination of scale and technical depth is genuinely difficult for a regional converter to match on any timeline.
AMCOR

Risk: Exposure To Flexible Plastic Regulation

The portfolio is weighted toward exactly the material category that packaging regulation targets hardest, and fibre substitution takes volume away from flexible film permanently rather than cyclically. Producer responsibility fees penalise multi-layer structures most heavily of all. Defending the position depends on barrier development that is genuinely difficult and may not arrive quickly enough.
TETRA PAK

Moat: Filling Machine And Material Integration

Tetra Pak sells aseptic filling systems and the carton material that runs on them together, so a dairy or liquid food producer who installs a line commits to the material for the equipment's working life. That integration removes the annual tender entirely and is unavailable to any material-only supplier. Installed base rather than product specification is what secures the position.
TETRA PAK

Risk: Carton Recyclability Under Regulatory Scrutiny

Multi-layer cartons combining fibre, polymer, and aluminium are difficult to recycle in most municipal streams, and producer responsibility schemes increasingly price that difficulty directly. The company has invested in collection and separation infrastructure, though coverage remains uneven across markets. Regulatory reclassification of carton recyclability would raise brand costs significantly across its installed base.

Players Tracked

Prominent Players

Amcor
Tetra Pak
Berry Global
Smurfit Westrock
Sealed Air

Other Key Players

Sonoco
Crown Holdings
Ball Corporation
Ardagh Group
Mondi
Huhtamaki
Constantia Flexibles
Winpak
Toyo Seikan
Nippon Paper
Graphic Packaging
SIG Group
Coveris
Greif
Pactiv Evergreen

Recent Developments

MARCH 2025

Amcor Expands Mono-Material Barrier Film Production Capacity

Amcor added production capacity for recyclable mono-material barrier films across two sites, targeting brands converting from multi-layer laminate structures under European packaging rules. The investment was organic and internally funded, and the company noted that barrier performance on oxygen sensitive categories remains below conventional laminate equivalents.
Signal: Even the largest converters now openly concede that recyclable structures still trail conventional laminates on barrier
JUNE 2025

European Regulators Confirm Recycled Content Requirements For Food Contact

European authorities confirmed recycled content requirements applying to plastic food contact packaging, with defined percentage thresholds and specific compliance dates. Food contact approval for recycled polymer remains considerably more restrictive than for non-food applications, which sharply limits the qualified material available to meet those targets.
Signal: Recycled content mandates have now outrun the available supply of food contact approved recyclate material entirely
SEPTEMBER 2025

Major Grocery Retailer Expands Reusable Container Programme

A large European grocery retailer expanded its reusable container scheme across additional store formats and product categories, covering deposit collection, washing, and redistribution. The operation runs through a third-party logistics and washing provider under a service contract rather than any equity arrangement between the parties.
Signal: Reuse removes packaging demand permanently, and any converter left outside the system simply loses that volume

Resin, Fibre And Energy

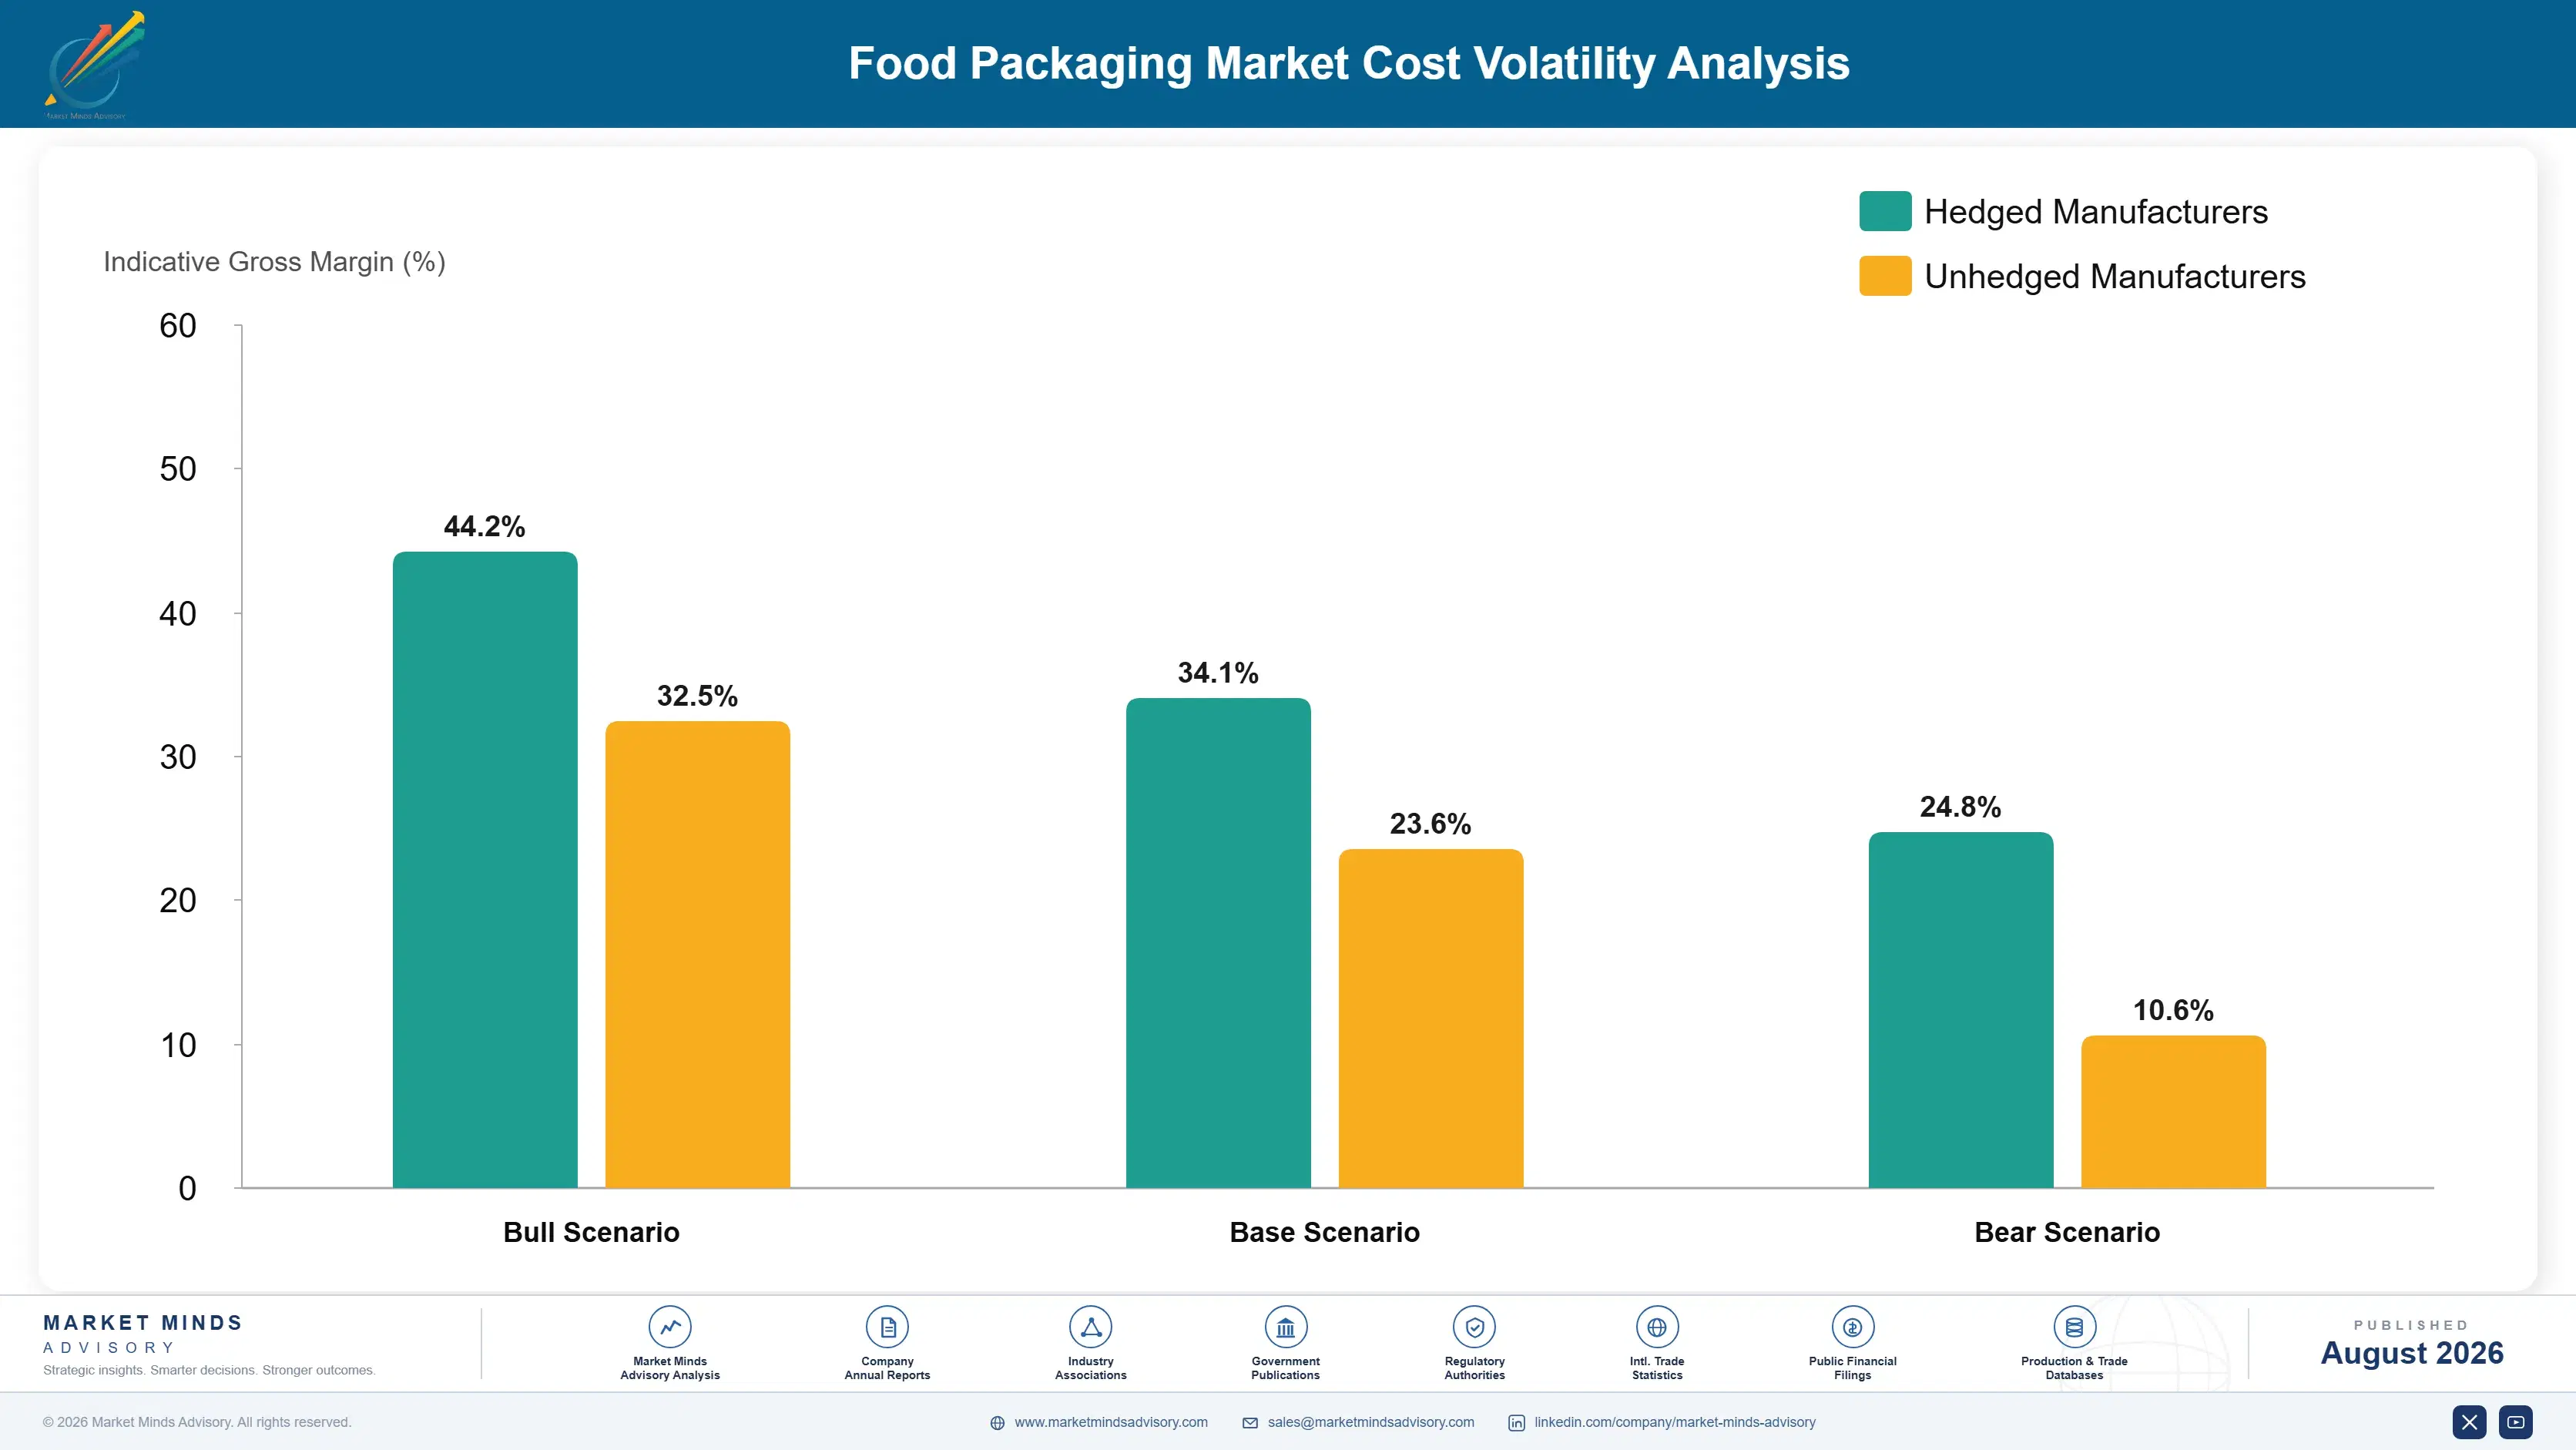
Polymer resin accounts for roughly 48% to 62% of converted cost on plastic formats, tracking naphtha and therefore crude, sourced from petrochemical producers across the Gulf, North America, and Northeast Asia. Containerboard and boxboard run 42% to 54% on fibre formats. Aluminium and steel drive metal can economics, and energy is the dominant input in glass container production at 25% to 34% of cost.
European glass and containerboard producers both took extended downtime through 2022 as energy costs rose with the gas price shock the IEA documented across that year, and glass furnaces in particular cannot be idled cheaply once cold. Ardagh Group's 2022 annual report described substantial energy cost inflation across its glass operations. Food brands holding annual fixed-price packaging contracts absorbed the whole increase before renewal allowed any repricing.

Exposure separates by material rather than by company size, which is unusual. Glass producers carry energy risk that no hedging fully removes, since a furnace runs continuously for years. Plastic converters carry resin exposure that reprices quarterly and passes through reasonably well. Fibre converters sit between the two. A diversified group holding all three is genuinely hedged across materials in a way no specialist can be.
food-packaging-market-cost-volatility-analysis-1787298200506

Index Every Material Input In Brand Supply Agreements

Annual fixed-price packaging contracts transfer resin, fibre, metal, and energy volatility entirely to the converter, and food brands accept indexation far more readily than most suppliers assume. Tying each material component to a published benchmark converts an unmanageable exposure into a pass-through, and it removes the risk premium that a padded fixed quotation carries for both parties.

Hold Diversified Material Positions Across Formats

Resin, fibre, aluminium, and energy rarely move together, so a converter present in several materials is naturally hedged in a way a single-format specialist cannot be. That diversification costs focus and capital efficiency in calm periods, and it repeatedly proves its worth during the input cost shocks this industry has absorbed roughly every four years.

Secure Long-Term Energy Contracts For Glass Operations

A glass furnace runs continuously for years and cannot be idled economically when energy prices spike, which makes energy exposure fundamentally different from any raw material position. Multi-year supply contracts and on-site generation both reduce that risk, and neither is cheap. The alternative is absorbing whatever the spot market does to a plant that cannot be turned off.

Portfolio Architecture for Margin Defence

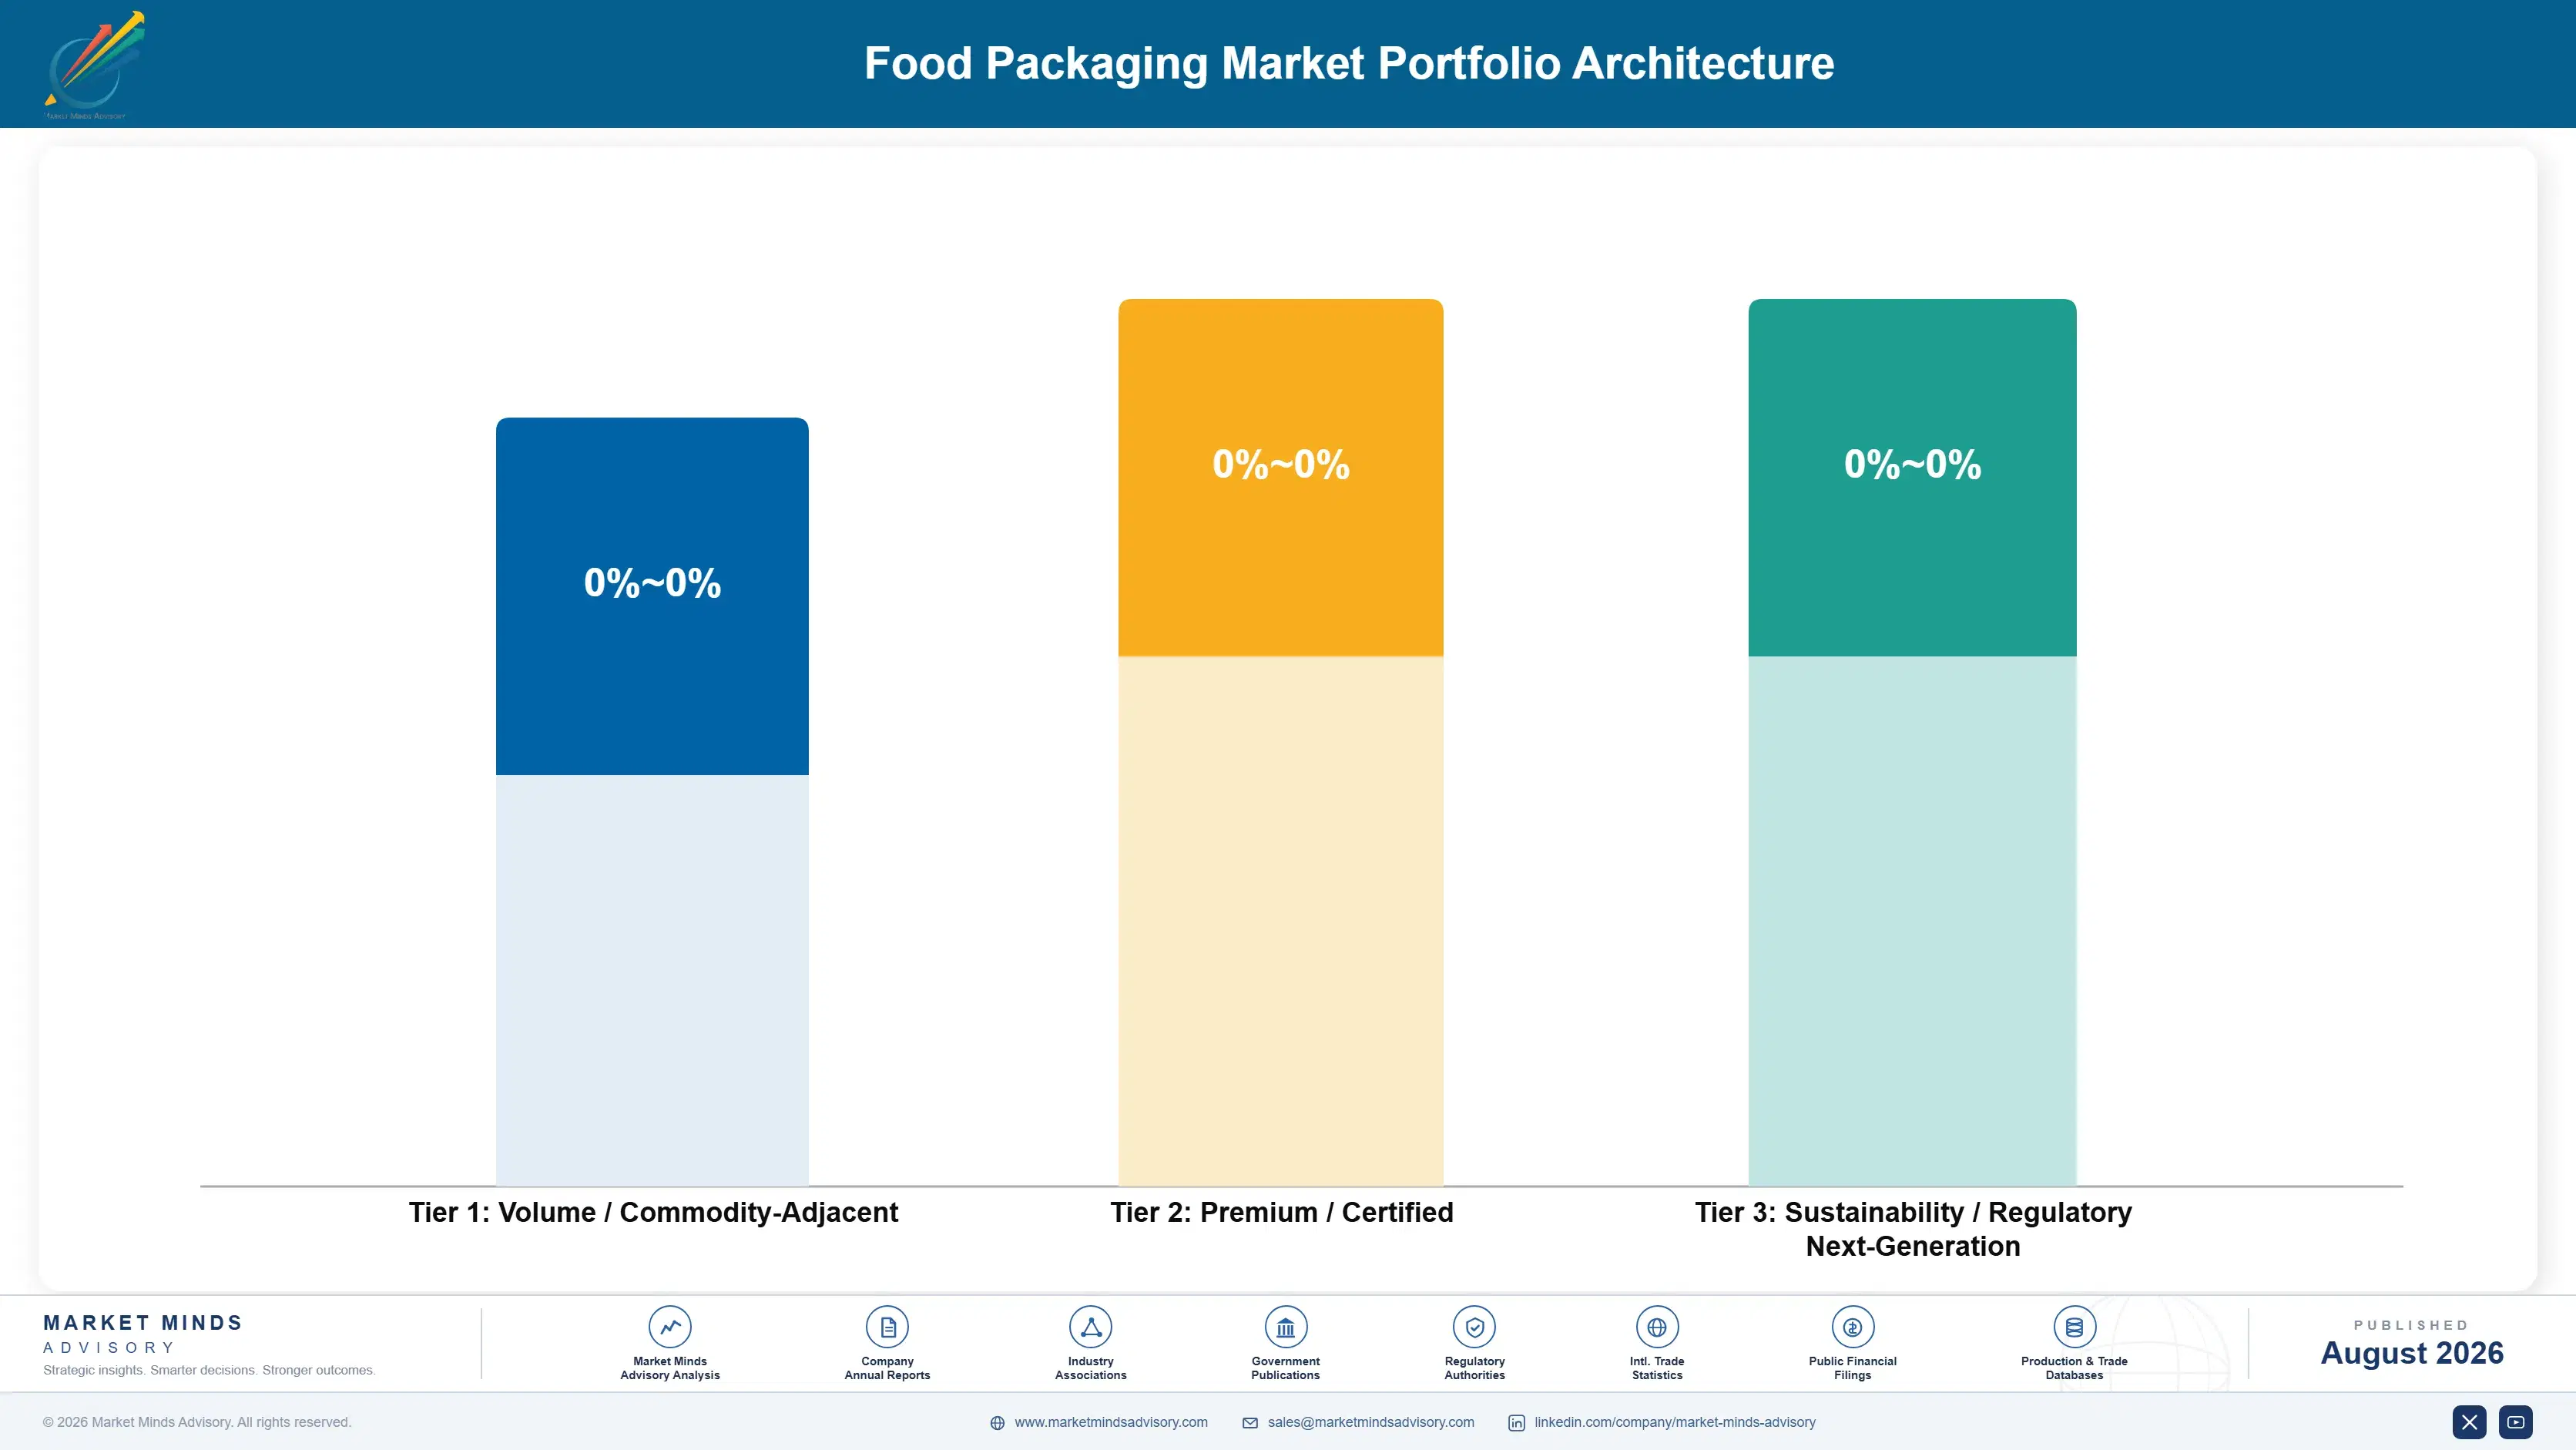
Margin architecture separates by whether a brand can requalify an alternative supplier easily. Commodity trays, films, and secondary cartons earn 9% to 17%, tendered annually against every converter within freight range. Barrier structures, aseptic systems, and technically qualified formats earn 21% to 32%, because food contact approval, shelf life validation, and filling line compatibility all take months to replicate.
The tension is that regulation is pushing volume from the technical tier toward the commodity one. A multi-layer barrier laminate is a genuinely engineered product; a mono-material film is much closer to a commodity, and fibre trays more so again. Converters are being pushed toward materials where they have less to defend, which is why barrier coating development matters more than any commercial initiative available.

High-value pools concentrate in barrier coating technology, aseptic filling systems, and reuse system operation. All three attach a converter to something beyond the material itself, whether a patent, an installed machine, or a logistics network. Compostable and bio-based materials carry the widest margin range of anything here, because premium niche formats and commodity moulded fibre share a category label and share nothing else commercially.

Volume / Commodity-Adjacent

Standard trays, films, secondary cartons, and closures tendered annually on delivered cost against every converter within freight range. The eight-point range separates integrated producers making their own substrate from converters buying film and board on the open market.
Gross Margin: 9% to 17%

Premium / Certified

Barrier laminates, aseptic carton systems, retort formats, and technically qualified structures where food contact approval and shelf life validation both take months to replicate. The eleven-point range separates qualified structures from integrated machine and material systems.
Gross Margin: 21% to 32%

Sustainability / Regulatory / Next-Generation

Barrier coating platforms, compostable and bio-based formats, recycled content structures, and reuse system supply and logistics. The twenty-four point range reflects real divergence: commodity moulded fibre competes on price while coating technology carries licensing economics.
Gross Margin: 14% to 38%
food-packaging-market-portfolio-architecture-1787298201005

High-value Sub-segments and Strategic Watch-out

Barrier Coating Technology

Highest value in the market and the only place genuine technical advantage remains, since whoever closes the shelf life gap sells into every conversion programme worldwide. Development runs five to twenty million dollars per platform across three to five years including food contact approval work.
Gross Margin: 28% to 38%

Aseptic Filling Systems

High value with steady growth, selling the filling machine and the carton material together so the customer commits for the equipment's working life. Installed base rather than specification secures it. Carton recyclability under producer responsibility rules is the live regulatory exposure across this whole segment.
Gross Margin: 26% to 34%

Commodity Trays And Films

The volume core of this market, tendered annually against every converter within freight range and offering nothing defensible whatsoever. Material substitution is pushing more volume into this tier rather than out of it. Resin and board price movement passes straight through to margin with nothing to absorb it.
Gross Margin: 9% to 17%

Reuse And Refill Container Systems

Strategic watch-out, and it cuts in both directions at once. Reuse removes single-use demand permanently rather than substituting between materials, and converters left outside the systems lose that volume for good. Supplying the containers, washing operations, and return logistics converts that threat into recurring service revenue instead.
Gross Margin: 18% to 34%

How Packaging Volume Repeats

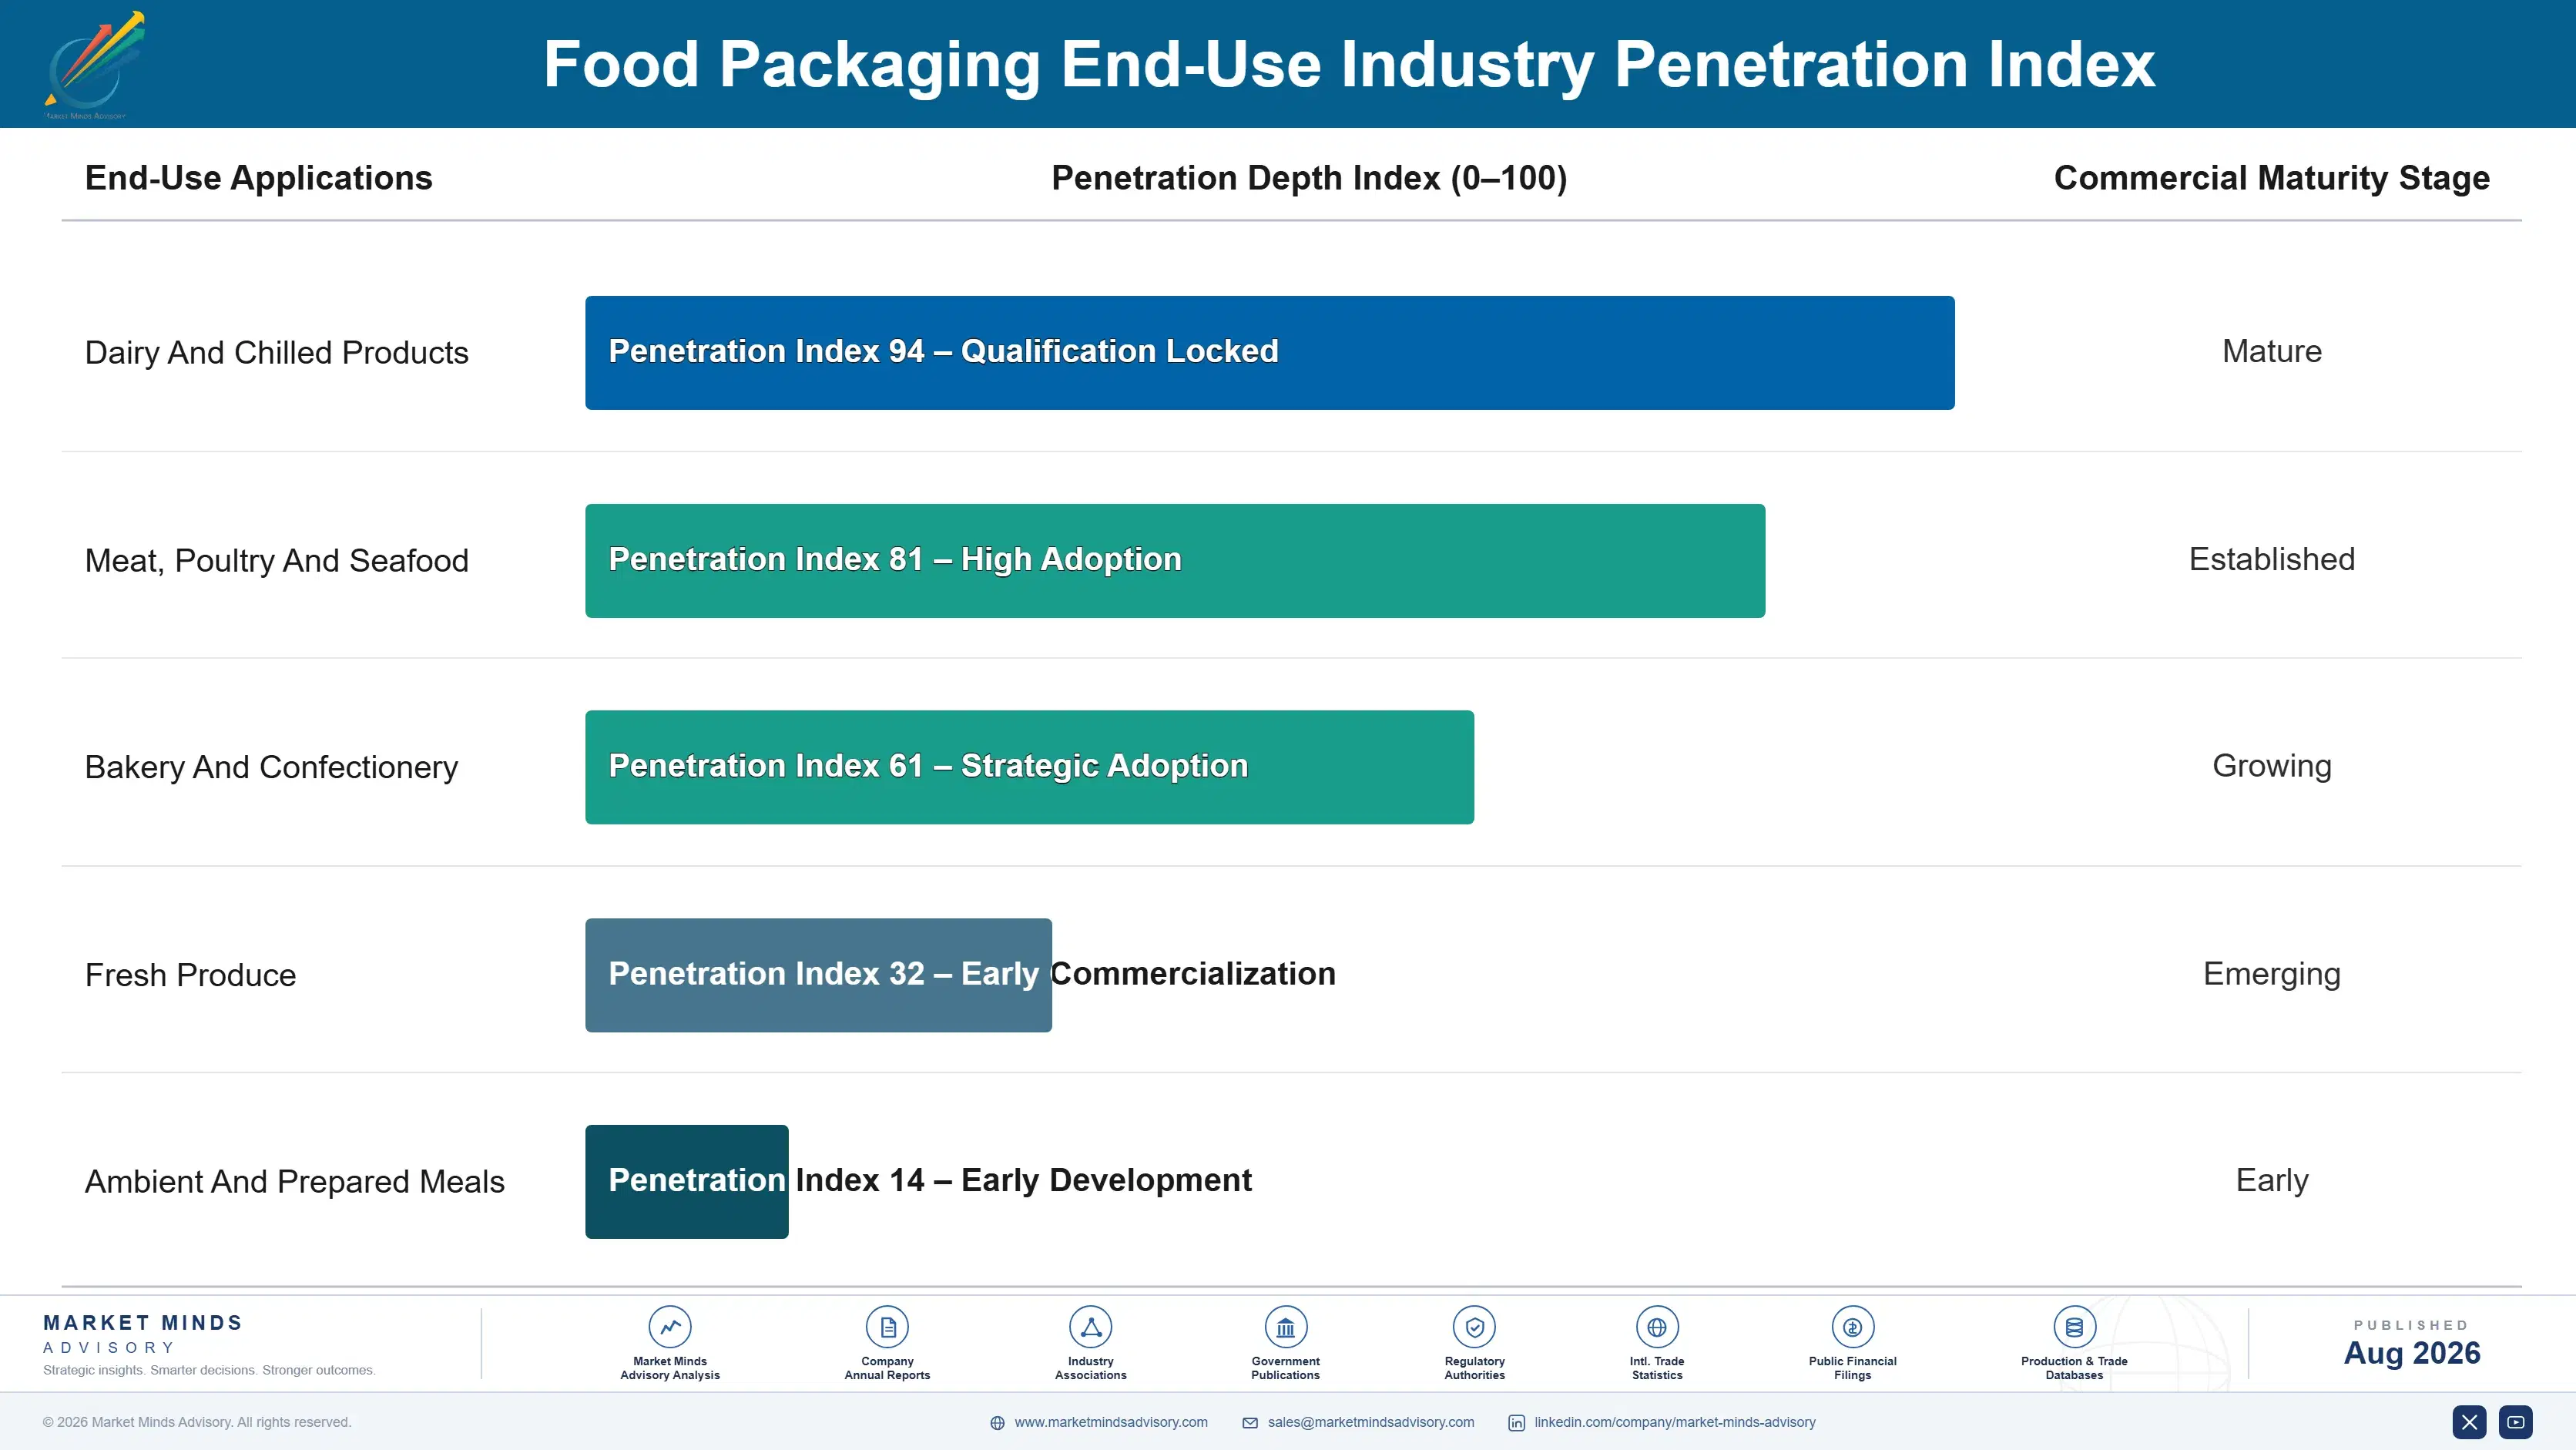
The annuity here is the product line rather than the customer. A qualified structure supplies a stock keeping unit for as long as that product exists, because requalifying an alternative means food contact approval, shelf life validation, and filling line trials that a brand will not run without cause. Purchase orders recur weekly while the decision was made once, which is why converters fight over specification and then discover the tender was almost a formality.
Depth varies sharply by technical requirement. Aseptic systems are the deepest, since the filling machine and material are sold together and switching means replacing capital equipment. Barrier laminates on sensitive categories are nearly as durable because shelf life validation is expensive to repeat. Chilled trays and secondary cartons are far shallower, moving annually on price. Private label supply is shallowest of all, retendered relentlessly.

Buyer profiles have changed considerably. Packaging decisions moved from procurement teams buying units toward cross-functional groups combining food technology, sustainability compliance, and producer responsibility fee modelling, and they specify years before any tender exists. Retailers now impose material requirements directly on suppliers. Both shifts reward converters who arrive at the design stage.
food-packaging-market-end-use-penetration-index-1787298201502

Where We Come Out

These are among the four positions where our research anticipates prominent divergence between winners and laggards over the coming forecast period. Each is grounded in the demand model, the regulatory perimeter, and the announced capacity pipeline.
01 / BARRIER TECHNOLOGY INVESTMENT

Closing the shelf life gap is the only real advantage left

Recyclable mono-material and fibre structures still lose as much as forty percent of shelf life against conventional barrier laminates on oxygen and moisture sensitive categories, and every brand converting knows it. Whoever closes that gap sells into every conversion programme running anywhere in the world, and can license the platform to converters unable to develop their own. Coating development costs five to twenty million dollars over three to five years including food contact approval, which is cheap against what it defends.
02 / FEE MODELLING ENGAGEMENT

Reach the specification through the fee schedule, not the tender

European producer responsibility fees near two hundred and forty dollars a tonne vary by more than four times across material choices delivering the same function, and brands calculate that exposure centrally while specifying packaging through procurement teams who never see the fee line. A converter modelling total portfolio exposure and redesigning against it arrives years ahead of any tender being issued. That turns into a consulting engagement ending in a sole-source award, which is a considerably better business than competing on price per thousand units.
03 / SHELF LIFE EVIDENCE DISCIPLINE

Quantify the food waste nobody in the chain wants to mention

Wasted food carries roughly eight times the carbon of the packaging protecting it, yet producer responsibility schemes count only the packaging and brands convert materials without ever quantifying the spoilage that follows. A converter running comparative shelf life testing at around forty thousand dollars a category becomes the technical authority in that account rather than another supplier quoting. It also frequently protects the higher value specification, because an honest comparison across both waste streams tends to favour the structure with better barrier performance.
04 / REUSE SYSTEM PARTICIPATION

Reuse is the one trend that deletes your volume entirely

Every other development in this market moves demand between materials, while a returned and refilled container displaces every single-use pack across its whole service life permanently. Converters watching reuse systems scale from outside will lose that volume and never recover it, particularly across dense urban grocery markets where the return logistics have finally started to work properly. Supplying the containers, the washing operations, and the return logistics converts an existential threat into a five to seven year service contract carrying genuinely recurring revenue.

Engagement Snapshot From the Field

A live engagement with an industry participant carrying material or product regulatory and market exposure ahead of a defining policy shift, showing how our research translates into a defensible multi-year portfolio strategy.
MARKET MINDS ADVISORY · CLIENT ENGAGEMENT SUMMARY
Food Packaging Producer Strategic Portfolio Review and Transition Roadmap 2026·Investment Scenario on Food Packaging Exposure Evaluation 2025-26
CLIENT PROFILE
A European flexible packaging converter supplying chilled and ambient food brands across eleven countries, with roughly EUR 340 million in annual revenue (client-reported, unverified by MMA). Around 64% of revenue came from multi-layer barrier laminates for oxygen sensitive categories, with the balance in mono-material films and secondary packaging, and the business held no proprietary coating technology of its own.
STRATEGIC CHALLENGE
Three major brand customers had committed publicly to fully recyclable packaging within four years, which would convert most of the client's barrier laminate volume into mono-material structures earning materially lower margins. The board needed to decide whether to invest in barrier coating development, buy a technology position, or accept the margin compression as unavoidable.
MMA APPROACH
MMA modelled margin and volume under three conversion scenarios across the client's actual product portfolio, interviewed twenty-seven brand packaging and food technology leads on shelf life tolerance and conversion timing, and assessed available coating technologies for licensing or acquisition. Producer responsibility fee exposure across customer portfolios was modelled separately as a route into specification decisions ahead of tender.
KEY FINDINGS
  1. Full conversion to available mono-material structures would cut blended gross margin by nine points while raising volume only marginally, since pack weights barely change between the two.
  2. Nineteen of twenty-seven brand contacts had no quantified view of the shelf life consequence of conversion, and none had modelled the resulting food waste at all.
  3. Producer responsibility fee spread across the client's customer portfolios reached 4.3 times between the best and worst material choices delivering identical function.
  4. Licensing an existing barrier coating platform was costed at roughly a third of internal development and would reach commercial supply eighteen months sooner.
CLIENT PROFILE
A European flexible packaging converter supplying chilled and ambient food brands across eleven countries, with roughly EUR 340 million in annual revenue (client-reported, unverified by MMA). Around 64% of revenue came from multi-layer barrier laminates for oxygen sensitive categories, with the balance in mono-material films and secondary packaging, and the business held no proprietary coating technology of its own.
STRATEGIC CHALLENGE
Three major brand customers had committed publicly to fully recyclable packaging within four years, which would convert most of the client's barrier laminate volume into mono-material structures earning materially lower margins. The board needed to decide whether to invest in barrier coating development, buy a technology position, or accept the margin compression as unavoidable.
MMA APPROACH
MMA modelled margin and volume under three conversion scenarios across the client's actual product portfolio, interviewed twenty-seven brand packaging and food technology leads on shelf life tolerance and conversion timing, and assessed available coating technologies for licensing or acquisition. Producer responsibility fee exposure across customer portfolios was modelled separately as a route into specification decisions ahead of tender.
KEY FINDINGS
  1. Full conversion to available mono-material structures would cut blended gross margin by nine points while raising volume only marginally, since pack weights barely change between the two.
  2. Nineteen of twenty-seven brand contacts had no quantified view of the shelf life consequence of conversion, and none had modelled the resulting food waste at all.
  3. Producer responsibility fee spread across the client's customer portfolios reached 4.3 times between the best and worst material choices delivering identical function.
  4. Licensing an existing barrier coating platform was costed at roughly a third of internal development and would reach commercial supply eighteen months sooner.
RECOMMENDED STRATEGY
Phase 1: Phase one: license an existing barrier coating platform rather than developing internally, accepting royalty terms in exchange for eighteen months of speed. Phase 2: Phase two: build a comparative shelf life testing capability and publish results with brand customers, positioning as technical authority rather than as a quoting supplier. Phase 3: Phase three: offer producer responsibility fee modelling as a chargeable service to reach specification decisions ahead of tender across the customer base.
OUTCOME
The client licensed a coating platform within two quarters and launched shelf life testing with four brand customers. Two of the three at-risk conversion programmes adopted the coated structure rather than uncoated mono-material, and blended gross margin fell three points rather than the nine modelled under full conversion (client-reported, unverified by MMA).

Frequently Asked Questions

Foundational context covering the market sizes, CAGR, scope, country, region and competition that inform every finding below. This section is provided to cover basics and most often pre-purchase conversations, answered from the MMA Primary Research Dataset.

What is the current size of the Food Packaging Market?

The global food packaging market reached USD 382.0 billion in 2025, covering primary and secondary packaging in direct or protective contact with food. That spans paper, flexible plastics, rigid plastics, metal, glass, and bio-based materials.

How large will the Food Packaging Market be by 2036?

MMA forecasts USD 626.49 billion by 2036, up from USD 399.57 billion in 2026, an increase of USD 226.91 billion. That represents an expansion multiple of 1.57 times across the forecast period.

What is the CAGR for the Food Packaging Market 2026 to 2036?

The base case CAGR is 4.6%, with a bull case of 5.8% and a bear case of 3.4%. Historical growth between 2020 and 2025 ran at 3.6%, across a period when no individual material behaved like the total did.

Which segment is growing fastest?

Compostable and bio-based materials grow fastest at 9.2%, exactly 2.00 times the market rate, though from a small base. Paper and paperboard follow at 6.1%, taking share from both rigid and flexible plastics.

Who are the major companies in the Food Packaging Market?

Amcor, Tetra Pak, Berry Global, Smurfit Westrock, and Sealed Air lead, together holding just 17% of the market. Material, geography, and food category each fragment the supplier base independently.

Which country is growing fastest?

India grows fastest at 8.2%, as refrigeration access, organised retail, and urban incomes convert loose food sales into packaged ones. Sachet and single-serve formats carry most of that volume.

Report Segmentation Architecture

The full report scope spans multiple orthogonal segmentation dimensions, with cross-tabulated demand data provided for each dimension pair. Coverage extends further to regional breakdowns, trend trajectories, and the competitive detail needed to support segment-level decision-making.

By Packaging Material

  • Paper And Paperboard
  • Flexible Plastic Films And Laminates
  • Rigid Plastic Containers
  • Metal Cans And Closures
  • Glass Containers
  • Compostable And Bio-Based Materials

By End-Use Industry

  • Dairy And Chilled Products
  • Meat, Poultry And Seafood
  • Bakery And Confectionery
  • Fresh Produce
  • Ambient And Prepared Meals

By Commercial Dimension

  • Brand Owner Direct Supply
  • Private Label And Retailer Contracts
  • Integrated Machine And Material Systems
  • Distributor And Converter Channels
  • Reuse And Refill System Supply

By Region

  • East Asia
  • South Asia and Pacific
  • North America
  • Western Europe
  • Latin America
  • Middle East and Africa
  • Eastern Europe

Scope, Methodology, and Coverage

Every figure in this report is reproducible from documented input assumptions. The scope below maps the historical period, the forecast horizon, the segmentation dimensions, and the countries covered, alongside the underlying primary and qualitative methodology.
Historical Period
2020 to 2025
Forecast Period
2026 to 2036
Base Year
2025 (USD billions; MMA Primary Research Dataset, August 2026)
Market Definition
The food packaging market covers primary and secondary packaging in direct contact with or providing protection to food products, across retail, food service supply, and industrial food manufacturing channels. Scope spans paper and paperboard formats, flexible plastic films and laminates, rigid plastic containers, metal cans and closures, glass containers, and compostable and bio-based materials, together with reusable container systems supplied for food applications. Beverage-only packaging, pet food packaging, on-premise food service disposables, packaging machinery, transit packaging, and bulk ingredient containers are excluded.
Quantitative Units
USD billions at converter revenue level; tonnes by material; packs produced annually.
Segmentation Dimensions
By packaging material; by end-use industry; by commercial dimension; by region.
Regions Covered
East Asia, South Asia and Pacific, North America, Western Europe, Latin America, Middle East and Africa, Eastern Europe
Countries Covered
United States, Canada, Mexico, Germany, France, United Kingdom, Italy, Spain, Netherlands, Poland, China, Japan, South Korea, India, Indonesia, Vietnam, Australia, Brazil, Saudi Arabia, South Africa.
Key Companies Profiled
Amcor, Tetra Pak, Berry Global, Smurfit Westrock, Sealed Air, Sonoco, Crown Holdings, Ball Corporation, Ardagh Group, Mondi, Huhtamaki, Constantia Flexibles, Winpak, Toyo Seikan, Nippon Paper, Graphic Packaging, SIG Group, Coveris, Greif, Pactiv Evergreen.
Quantitative Methodology
Primary survey, n=3,800 respondents, Q4 2025, six countries; demand-side model with trade association cross-validation
Qualitative Methodology
47 expert interviews, Q4 2025; applied to validate demand model assumptions, identify emerging dynamics, and assess competitive positioning
Report Format
PDF and XLSX data workbook (Word format preview document)
Publisher
Market Minds Advisory
Report Code
MMA-2026-PAC-820
Published
August 2026
Contact
sales@marketmindsadvisory.com | www.marketmindsadvisory.com

Purchase the full Food Packaging Market Report (2026 to 2036).

The full MMA report on food packaging covers material, regional, and competitive analysis in detail, with separate treatment of the conflict between recyclability targets and shelf life performance that now governs material selection. It includes producer responsibility fee modelling by material and jurisdiction, barrier performance benchmarking across mono-material and conventional structures, packaged food penetration forecasting by country, and reuse system economics by grocery format. Regional chapters cover twenty countries with regulation and packaged food conversion assessed individually. Competitive profiling spans twenty converters compared on a single consistent revenue basis.
Twenty country packaged food penetration demand chapters
Producer responsibility fee modelling by material choice
Barrier performance benchmarking across recyclable structures
Packaged food penetration forecasting by individual country
Twenty converter competitive profiles compared consistently
Reuse and refill system economics by grocery format

Built For The People Who Decide

From boardroom strategy to bench-side execution, this report is read cover-to-cover by leaders shaping the next decade of their industry, turning demand scenarios, market dynamics and valuation benchmarks into decisions.
CXOs/ Presidents/ VPs/ Managers
M&A and Corporate Development
Strategy Teams and R&D Heads
Procurement and Product Directors
Regulatory and Compliance Leaders
Investor Relations and Equity Analysts