Market Minds Advisory
Food-Grade PCR Polypropylene Market

Food-Grade PCR Polypropylene Market: Food-Grade PCR Polypropylene Market. Mechanically and Chemically Recycled Resin for Food Contact Packaging

Food-grade PCR polypropylene turns used packaging into resin regulators will actually let touch food again, so decontamination technology and FDA or EFSA letters of no objection decide who supplies brand-owner recycled content mandates.

Lead Analyst

Published

September 2026

Make Smarter Decisions with Customized Research Insights

Request a free sample report and evaluate market opportunities, growth trends, and competitive dynamics relevant to your business needs.

2025 MARKET VALUE$1.4BMarket Size 2025
2036 FORECAST VALUE$3.8BBase Case , 2026 to 2036
CAGR 2026 TO 20369.5 %Bull 11.0% / Bear 8.0%
INCREMENTAL OPPORTUNITY$2.3BNet 10- year value creation
EXPANSION MULTIPLE2.48x2036 value over 2026 base
Strategic Levers
M&A Pipeline
Regional Outlook
Country Rankings
Competitive Intelligence
Segmental Deep-dive
Call-Us : 91 93563 13602

Executive Snapshot and Market Trajectory.

Food-grade PCR polypropylene is post-consumer recycled polypropylene resin processed and decontaminated to meet food contact safety standards, used in packaging that touches food directly. Brand owners buy it to hit recycled content mandates without risking contamination. A resin batch that fails migration testing scraps an entire packaging run.
Chemically Recycled Food-Grade PCR Polypropylene grows fastest as advanced recycling technology clears higher purity thresholds than mechanical recycling alone, while mechanically recycled food-grade PP carries the largest volumes. Western Europe leads because EU packaging waste regulation and recycled content mandates concentrate demand, with North America second. Gross margins run 18% to 44%, and feedstock collection and decontamination technology shape profit. Margins stay firm. Converters reward reliable results. Feedstock costs stay high. Audits decide new contracts.
Five groups hold about 44% of value, led by Veolia, LyondellBasell and Indorama Ventures, so global recyclers compete with specialty decontamination technology licensors and regional reclaimers. Food contact regulation, recycled content mandates and buyer audits govern positioning, and converters check contamination testing, regulatory letters of no objection and consistency before committing a resin to a food packaging line. Buyers compare cost per tonne. Audits decide new contracts.
Market Definition
The market covers global manufacturer revenue from food-grade PCR polypropylene, defined as post-consumer recycled polypropylene resin processed and certified for direct food contact packaging applications, in mechanically recycled food-grade PP, chemically recycled food-grade PP, decontamination and super-clean process technology, food-grade PCR PP compounds and blends, and certification and traceability services, sold to packaging converters and brand owners and valued at manufacturer revenue. It excludes non-food-grade recycled PP, virgin polypropylene and other recycled resin types such as PET or HDPE.
Base Year Value
$1.4B in 2025 (MMA Primary Research Dataset, September 2026)
Forecast Period
2026 to 2036, eleven discrete annual values
CAGR
9.5% base case. Bull 11.0%. Bear 8.0%.
Fastest Growth Segment
Chemically Recycled Food-Grade PCR Polypropylene: 13.3% CAGR
Fastest Growth Country
China: 14.0% CAGR
Fastest Growth Region
South Asia and Pacific: 11.0% CAGR
Largest Region
Western Europe: 34% of 2025 global value
Market Leaders
Veolia, LyondellBasell, Indorama Ventures, PureCycle Technologies, Borealis. Source: MMA Analysis, company annual reports.
Primary Survey
n=3,800 procurement and R&D decision-makers, Q4 2025, six countries
Methodology
Demand-side build-up, cross-validated against public data, 47 expert interviews

Food-Grade PCR Polypropylene Market Forecast Scenarios

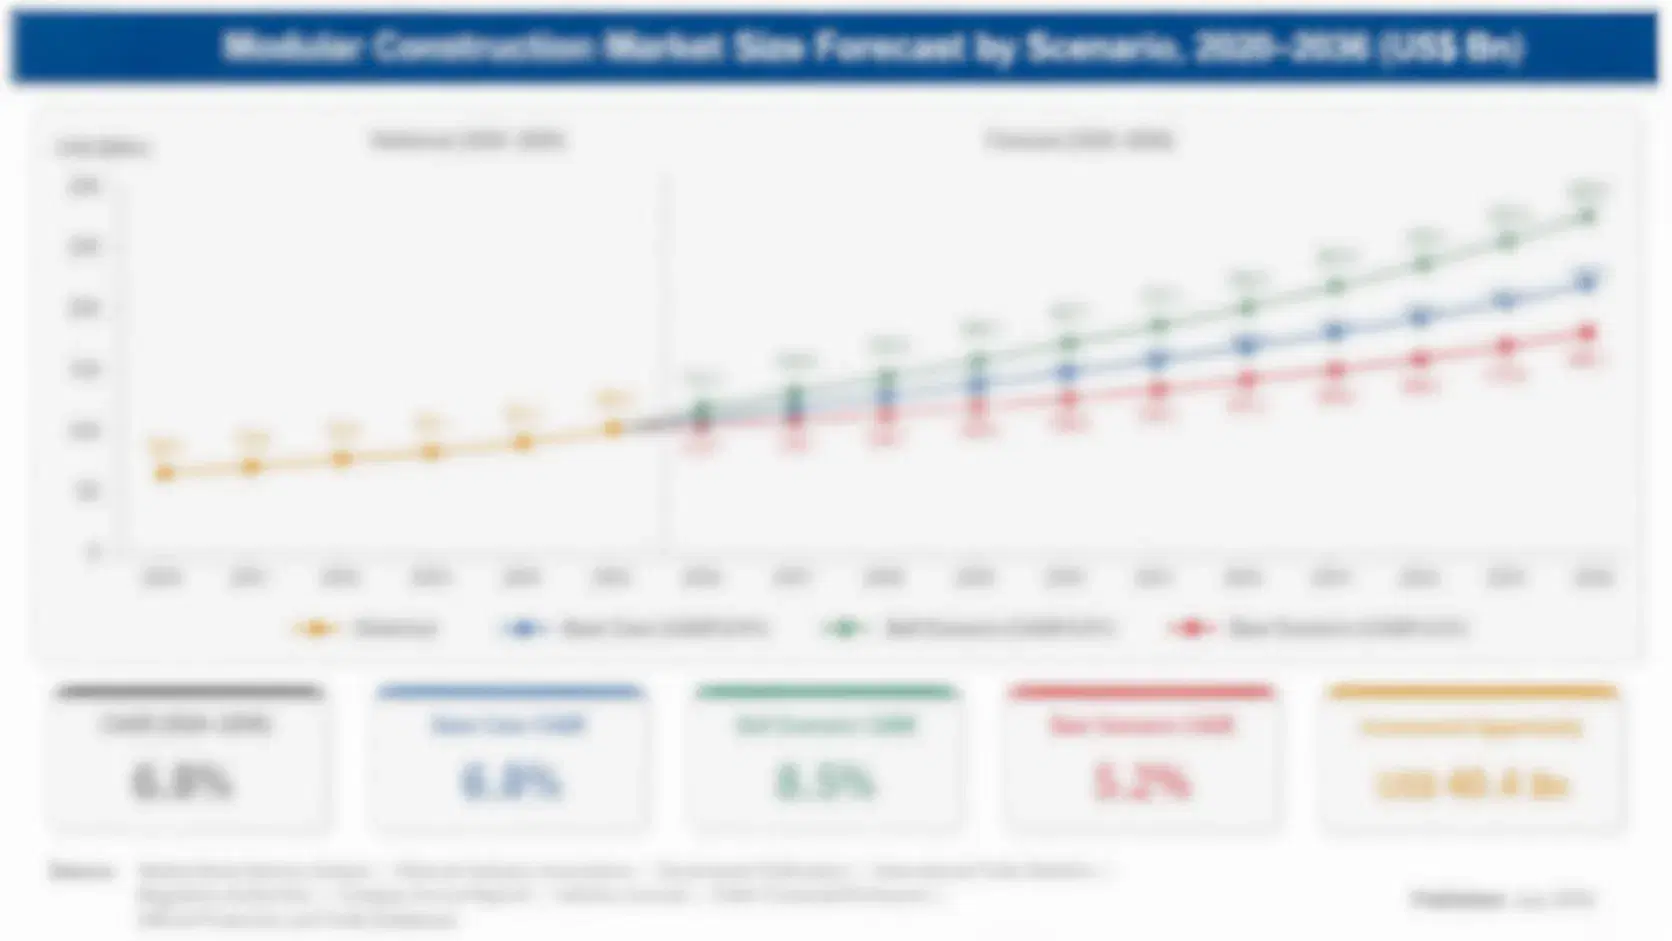
food-grade-pcr-polypropylene-market-size-forecast-scenario-1790048001351
From 2020 to 2025 food-grade PCR polypropylene revenue grew at about 7.0% a year. Early letters of no objection and pilot decontamination lines dominated 2020 and 2021, brand owner recycled content commitments accelerated demand in 2022 and 2023, and chemical recycling capacity additions then widened supply in 2024. Mechanically recycled resin dominated early volume, while chemically recycled resin gained share as purity requirements tightened.
The base case of 9.5% rests on three named mechanisms. European Union packaging waste regulation sets binding recycled content targets that food packaging must meet by defined deadlines. Brand owner sustainability commitments pull demand beyond regulatory minimums into flagship packaging lines. Chemical recycling capacity expansion widens the addressable supply of resin that clears strict food contact purity thresholds. Each mechanism is visible in regulation, brand policy and capacity investment over the last three years.
The bull case reaches 11.0% if recycled content mandates tighten faster and chemical recycling capacity scales. The bear case falls to 8.0% if mandates delay, feedstock collection costs spike and brands revert to virgin resin. Both cases assume stable food contact approval pathways. Neither case assumes a change in converter concentration. Both assume steady food contact rules.

Recycled Content Mandates, Decontamination Technology and Purity Set Resin Returns

Recyclers collect and sort post-consumer polypropylene bales, wash and decontaminate flakes through super-clean processes or chemical depolymerisation, then pelletise resin that must clear migration testing before earning a food contact letter of no objection. Purity and consistency decide acceptance, and each batch must hold contamination below strict thresholds, since a single failed migration test can end a supplier relationship. Converters audit suppliers and contamination records every year before renewing contracts.
MARKET CONCENTRATION44% CR5Top five participants hold well under half of category value
MECHANICAL RECYCLING SHARE58%Portion of revenue from mechanically recycled food-grade resin
RIGID PACKAGING SHARE64%Portion of revenue sold into rigid rather than flexible packaging
FEEDSTOCK COST SHARE40% of COGSPost-consumer bale and sortation inputs within manufacturing cost
TYPICAL RECYCLED CONTENT25-100%Typical recycled content share specified in food packaging formulas
APPROVAL TIMELINE1-3 yearsTypical time to obtain a food contact no objection letter
Value concentrates in five places. Chemically recycled food-grade PP grows fastest. Mechanically recycled food-grade PP carries the largest volumes, decontamination and super-clean process technology serves licensing and equipment sales, food-grade PCR PP compounds and blends serve converters needing tailored formulations, and certification and traceability services serve brand owners proving recycled content claims. Process and decontamination details stay closely guarded within each recycler.
Supply combines global waste management and chemical groups, specialty recycling technology licensors and regional reclaimers. Veolia and Indorama run integrated collection and recycling networks, LyondellBasell and Borealis add chemical recycling capacity and compounding depth, and PureCycle licenses proprietary purification technology. Converters qualify resin over extended trials and audit supply chain traceability every year. Buyers compare cost per tonne before awarding contracts.
"A recycled resin does not earn a place on a food package because it is green. It earns it because a migration test came back clean and a regulator signed a letter saying so. The suppliers that will grow are the ones whose paperwork is as consistent as their pellets, because one failed batch undoes years of trust."
Senior Analyst, Recycled Plastics and Food Packaging Materials Practice · MMA Food-Grade PCR Polypropylene Practice · September 2026

Market Trends

Chemical Recycling Clears Strict Purity Thresholds

Mechanical recycling struggles to consistently clear the strictest food contact purity thresholds for certain applications, and chemical recycling processes that break polymer chains down and rebuild them offer higher and more consistent purity, so companies such as PureCycle and LyondellBasell have expanded chemical recycling capacity specifically targeting food contact approval. Chemically Recycled Food-Grade PCR Polypropylene grows about 13.3% a year, and gross margins run 34% to 44%. The trend needs significant capital and feedstock supply, and it rewards suppliers with credibility. Buyers judge suppliers on contamination testing, consistency and regulatory support.
Market Impact: EU targets phase in through 2030
Traceability and Certification Services Prove Recycled Content Claims to Regulators

Brand owners face increasing scrutiny over recycled content claims from regulators and consumer advocacy groups, and suppliers now offer blockchain-based or third-party audited traceability services that document the chain of custody from collection through finished resin. Certification and Traceability Services grow about 10.4% a year, and gross margins run 30% to 42%. The trend needs digital infrastructure and audit partnerships, and it rewards suppliers with speed, while smaller reclaimers struggle to fund the documentation systems. Suppliers with scale and clear plans hold the strongest positions. Early movers set the standard that later entrants must match.
Market Impact: over 60% of brands set targets

Market Opportunities and Growth Drivers

European Union Packaging Waste Regulation Sets Binding Recycled Content Targets

The European Union's Packaging and Packaging Waste Regulation sets binding recycled content targets for plastic packaging with defined compliance deadlines through 2030, and food contact packaging faces specific pathways requiring approved decontamination processes. The driver rewards suppliers with approved technology and regulatory relationships, and it supports steady demand growth as compliance deadlines approach, though smaller converters face proportionally higher compliance cost relative to packaging volume. Early movers set the standard that later entrants must match. Converters reward suppliers that respond quickly to certification and audit needs. Progress should be reviewed every quarter against the agreed targets.
Market Impact: feedstock takes 40% of manufacturing cost

Brand Owner Sustainability Commitments Pull Demand Into Flagship Packaging Lines

Major food and beverage brands have made public recycled content commitments for their packaging portfolios, and these commitments increasingly extend to flagship product lines rather than staying confined to secondary packaging, pulling demand for certified food-grade resin into high-visibility applications. The driver rewards suppliers with proven consistency and brand-ready certification, and it supports demand growth beyond regulatory minimums, though premium cost over virgin resin still constrains adoption pace at some brands. Converters reward suppliers that respond quickly to certification and audit needs. Progress should be reviewed every quarter against the agreed targets.
Market Impact: approvals take 1-3 years

Market Restraints and Challenges

Feedstock Collection Costs and Contamination Variability Squeeze Recycler Margins

Post-consumer bale and sortation inputs make up about 40% of manufacturing cost, and collection infrastructure quality varies significantly by region, according to industry association guidance, while contamination levels in collected material vary batch to batch and can force costly rejection or reprocessing. The root cause is fragmented, inconsistent municipal collection systems feeding variable-quality feedstock into recycling operations. Recyclers can pass through only part of the cost, so margins fall two to four points. Recyclers respond with feedstock supply contracts and sorting technology investment. Progress should be reviewed every quarter against the agreed targets.
Market Impact: chemical recycling grows 13.3% yearly

Regulatory Approval Timelines Delay New Decontamination Process Commercialisation

New decontamination processes require extensive migration testing and regulatory review before earning a food contact letter of no objection, and the United States Food and Drug Administration and European Food Safety Authority often take one to three years to approve genuinely novel processes, according to industry association guidance. The root cause is the rigorous safety testing required for materials that will contact food directly. Delays push back revenue and raise development cost. Suppliers respond with parallel filings and phased process introduction. Smaller suppliers carry the heaviest exposure and have the least room to adjust.
Market Impact: traceability services grow 10.4% yearly
3 additional market trends, 2 additional growth drivers, and 4 additional restraints and challenges are covered in the full report. Contact sales@marketmindsadvisory.com to access the complete intelligence.

Segment CAGR and Growth Architecture

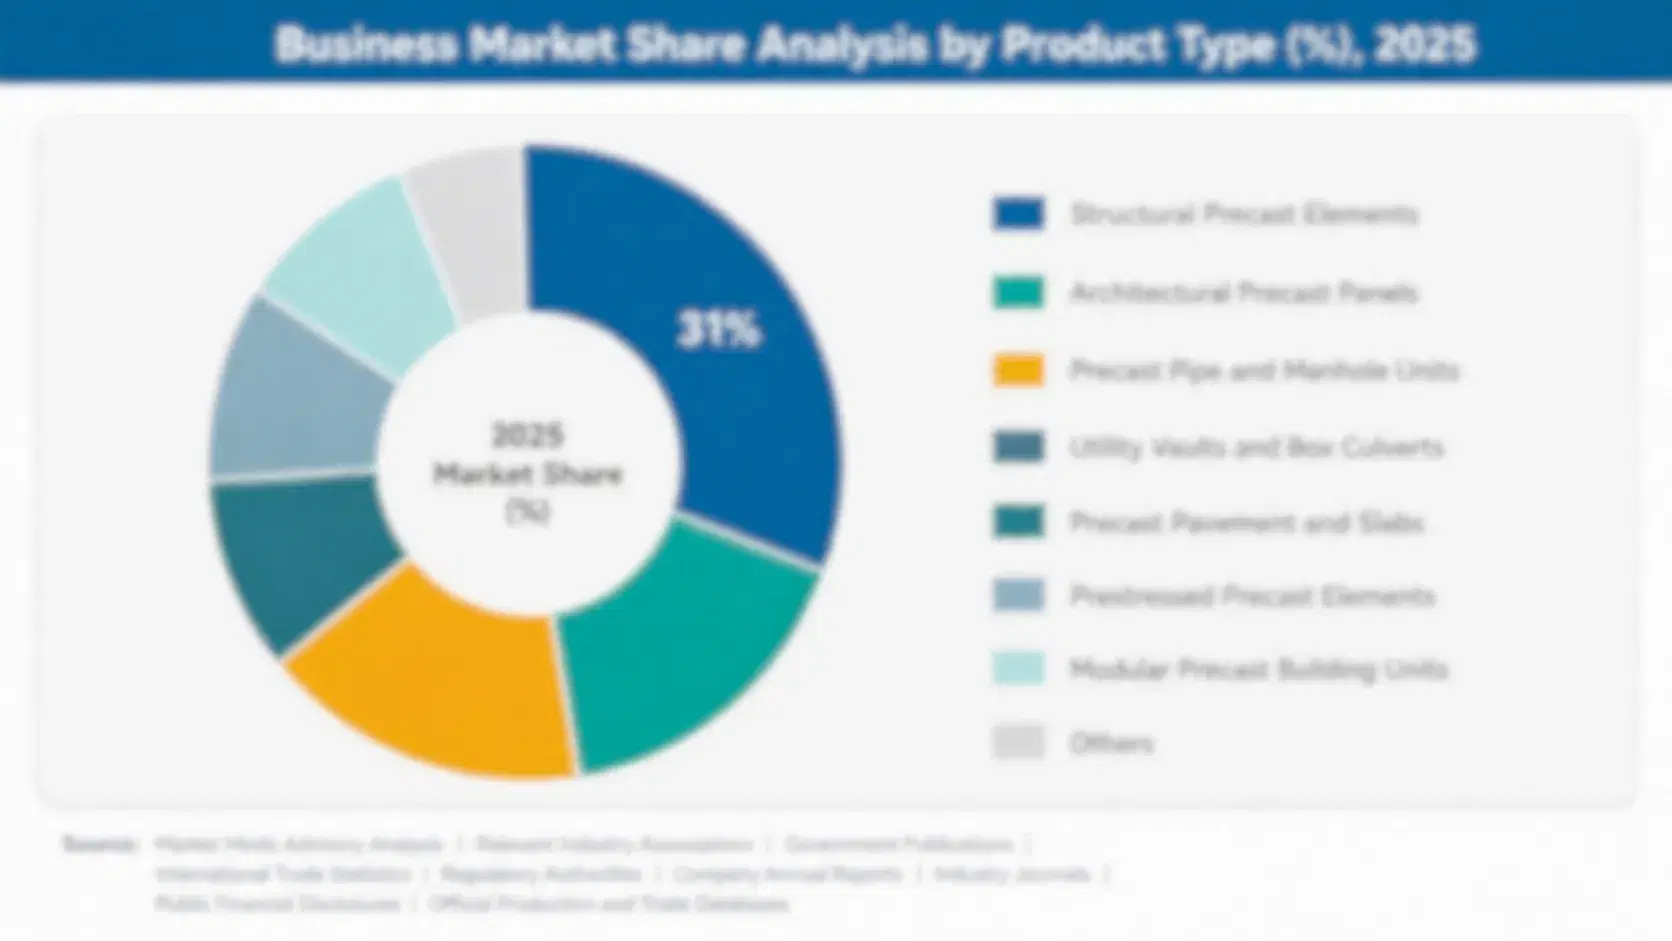
The food-grade PCR polypropylene market is segmented by processing type, which shows where purity, margins and buyer use differ. Five segments cover mechanically recycled food-grade PP, chemically recycled food-grade PP, decontamination and super-clean process technology, food-grade PCR PP compounds and blends and certification and traceability services. Chemically recycled resin grows fastest, while mechanically recycled resin carries the largest volumes.
food-grade-pcr-polypropylene-market-market-share-analysis-1790048001543

Chemically Recycled Food-Grade Polypropylene

Chemically Recycled Food-Grade Polypropylene is the fastest-growing segment at 13.3% a year, about 1.40 times the overall market rate. Converters buy resin processed through depolymerisation methods that clear the strictest purity thresholds consistently, and prices run 30% to 60% above mechanically recycled resin per tonne. Gross margins of 34% to 44% reward suppliers with proprietary technology, capital scale and regulatory approval. Growth depends on capacity expansion, purity requirements and brand commitments, while capital intensity limits speed of adoption. Early movers set the standard that later entrants must match. Converters reward suppliers that respond quickly to certification and audit needs. Progress should be reviewed every quarter against the agreed targets. Buyers judge suppliers on contamination testing, consistency and regulatory support.
CAGR 13.3%

Certification and Traceability Services

Certification and Traceability Services grows at 10.4% a year, about 1.20 times the overall market rate, because brand owners need documented, auditable proof of recycled content claims to satisfy regulators and consumer scrutiny rather than simple supplier assurances alone. Suppliers use digital chain-of-custody systems and third-party audits to differentiate. Gross margins of 30% to 42% support suppliers with technical infrastructure and reach. Growth depends on regulatory scrutiny, brand requirements and price, and suppliers with reliable documentation hold the strongest positions. Converters reward suppliers that respond quickly to certification and audit needs. Progress should be reviewed every quarter against the agreed targets. Smaller suppliers carry the heaviest exposure and have the least room to adjust.
CAGR 10.4%
Full segment breakdown across 5 segments available in the complete report.

Regional Architecture and Country Demand Map

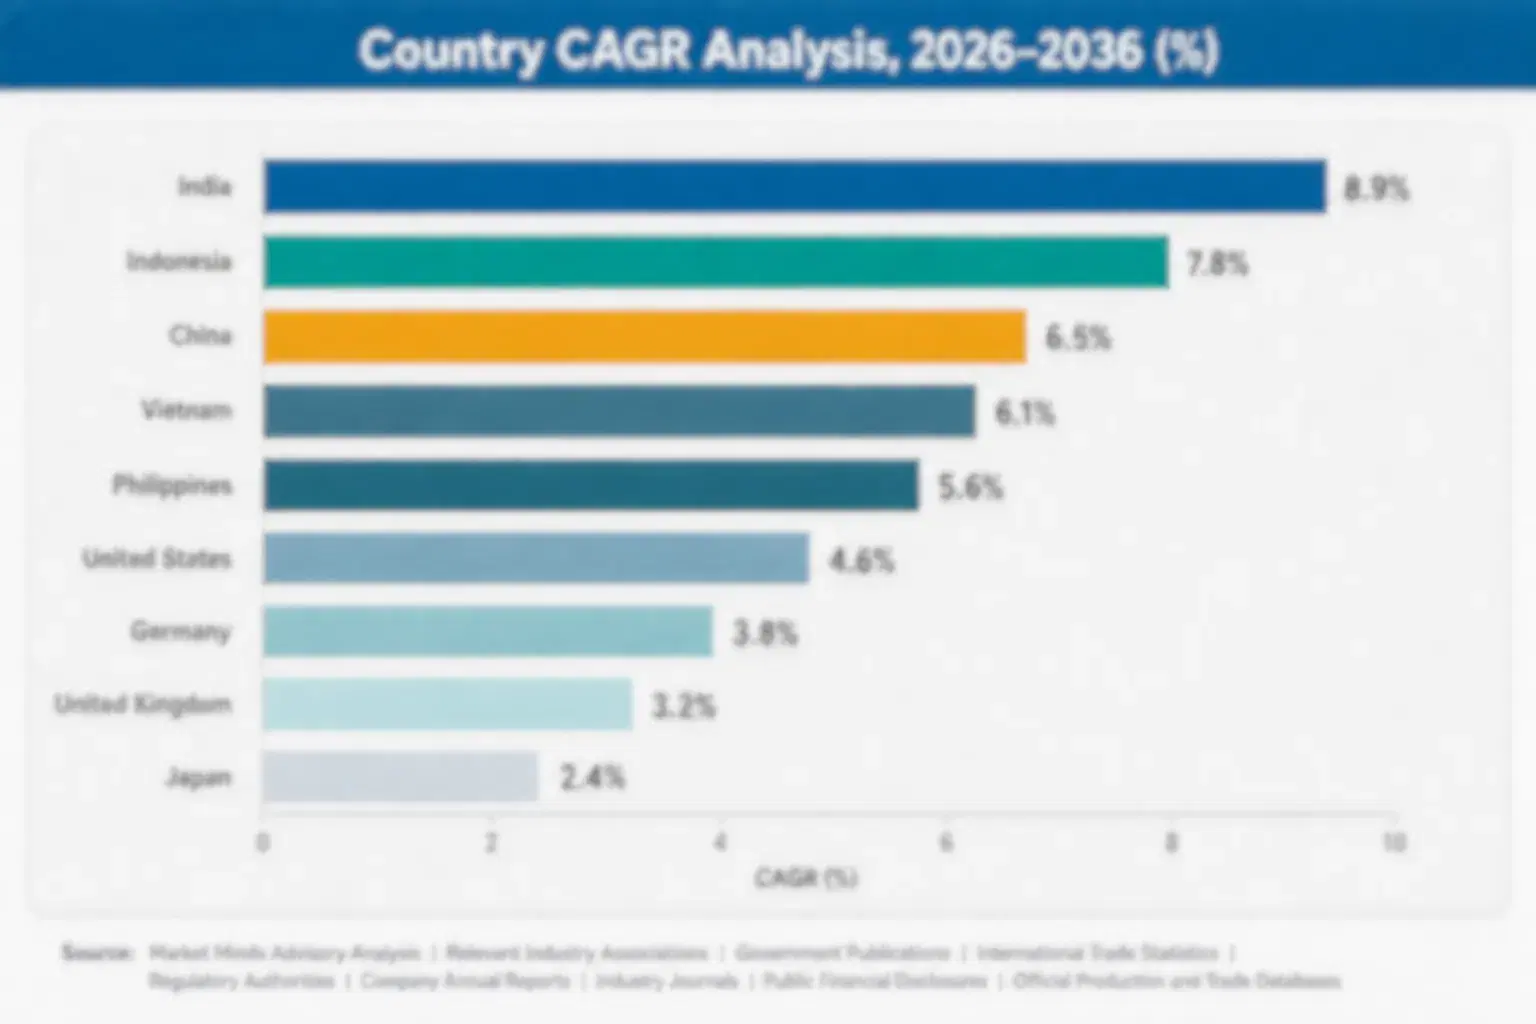
Western Europe leads at 34% because EU packaging waste regulation and recycled content mandates concentrate demand, while North America holds 24% through growing brand commitments. East Asia holds 20%. South Asia and Pacific holds 9%. Latin America holds 7%. Middle East and Africa and Eastern Europe hold 3% each.

North America

North America holds 24% share, inside its band, and growth of 9.9%, close to the global rate. The United States and Canada see rising brand owner recycled content commitments and state-level extended producer responsibility laws, and Veolia, LyondellBasell and PureCycle supply from domestic recycling and chemical recycling capacity. Converters qualify resin over extended trials, and buyers demand contamination testing and regulatory documentation. Converters also review contamination records and audit results before every annual contract renewal. Volumes stay steady, and suppliers compete mainly on purity proof, documentation and delivery reliability. Distributors handle most shipments and set order sizes. Currency moves and freight rates change landed cost each quarter. Suppliers offering multi-year terms win repeat volume.
Share: 24% | CAGR: 9.9% (2026 to 2036)

Western Europe

Western Europe holds 34% share, above its band, and growth of 8.5%, below the global rate. The European Union's binding recycled content targets and packaging waste regulation drive the world's most developed food-grade recycling infrastructure, which justifies the out-of-band share, and Veolia, Borealis and regional reclaimers supply. Mature regulatory frameworks temper growth, and buyers demand full certification and audit-ready traceability. Converters also review contamination records and audit results before every annual contract renewal. Volumes stay steady, and suppliers compete mainly on purity proof, documentation and delivery reliability. Distributors handle most shipments and set order sizes. Currency moves and freight rates change landed cost each quarter. Suppliers offering multi-year terms win repeat volume.
Share: 34% | CAGR: 8.5% (2026 to 2036)
Regional intelligence for 5 additional markets available in the complete report: East Asia, South Asia and Pacific, Latin America, Middle East and Africa, Eastern Europe. Contact sales@marketmindsadvisory.com.
food-grade-pcr-polypropylene-market-country-cagr-analysis-1790048001726

Four Margin Routes for Food-Grade PCR Suppliers

Margin in food-grade PCR polypropylene comes from chemical recycling scale, certification services, brand exclusivity partnerships and cost control on feedstock rather than volume alone. The routes below apply to global recyclers and technology licensors, and each can start inside one planning cycle, with measures in gross margin points and cost per tonne. Reviews are quarterly.

Scaling Chemical Recycling Capacity for Strict Purity Applications

Converters need resin that clears the strictest purity thresholds, so suppliers that scale chemical recycling capacity with regulatory approval win sales worth 10% to 18% of revenue at gross margins of 34% to 44%. Capacity costs $10 million to $50 million per plant. Suppliers should secure feedstock supply, complete regulatory filings and publish purity data, since unapproved processes earn no food contact revenue at all. Management should assign one owner to each programme from the start. Early results also help persuade sceptical buyers. Costs are recovered faster in larger groups. Payback runs about three years.
Market Impact: chemical recycling adds sales worth 10-18% of revenue

Building Certification and Traceability Platforms That Brands Trust Completely

Brands want auditable proof of recycled content claims, so suppliers that build digital certification and traceability platforms win contracts worth 8% to 15% of revenue at gross margins of 30% to 42%. Programmes cost $1 million to $8 million. Suppliers should build chain-of-custody systems, secure third-party audits and integrate with brand reporting tools, since unverifiable claims draw regulatory and consumer scrutiny. Early results also help persuade sceptical buyers. Costs are recovered faster in larger groups. Payback runs about three years. Management should assign one owner to each programme from the start.
Market Impact: traceability platforms win contracts worth 8-15% of revenue

Securing Exclusive Brand Partnerships for Flagship Packaging Lines

Brands want differentiation and supply security, so suppliers that secure exclusive partnerships for flagship packaging lines win contracts worth 8% to 14% of revenue at premiums of 5% to 12% per tonne. Programmes cost $1 million to $6 million. Suppliers should co-develop formulations, guarantee supply volumes and protect intellectual property, since generic resin cannot command the same premium. Costs are recovered faster in larger groups. Payback runs about three years. Management should assign one owner to each programme from the start. Early results also help persuade sceptical buyers. Payback runs about three years.
Market Impact: exclusive partnerships win contracts worth 8-14% of revenue

Diversifying Feedstock Collection Across Regions and Sorting Technology

Feedstock makes up about 40% of cost, so suppliers that diversify collection across regions and invest in advanced sorting technology cut cost and contamination swings by 15% to 30% and protect margins worth 5% to 9% of profit. Programmes cost $2 million to $10 million. Suppliers should qualify multiple collection sources, invest in optical sorting and monitor contamination rates closely, since single-source dependence raises quality risk. Payback runs about three years. Management should assign one owner to each programme from the start. Early results also help persuade sceptical buyers. Costs are recovered faster in larger groups.
Market Impact: diversified sourcing cuts cost swings by 15-30% yearly

Who Controls the Margin Pool

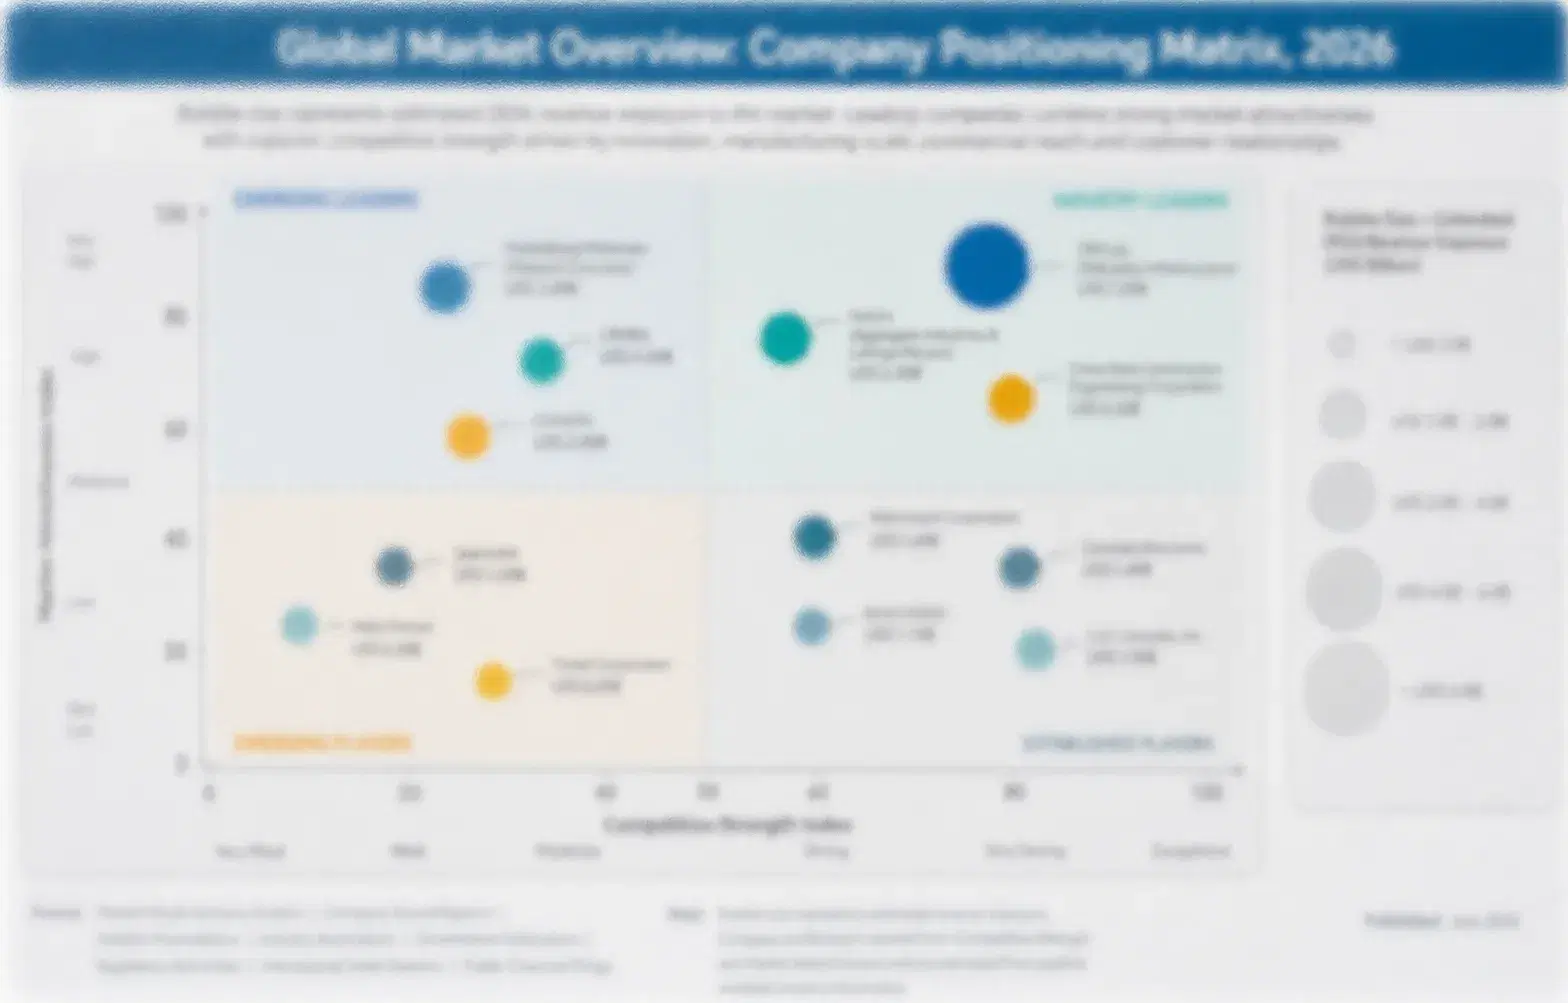
The food-grade PCR polypropylene market is fragmented, with a CR5 of 44%, because global waste management and chemical groups compete with specialty technology licensors and many regional reclaimers across geographies and application types. This assessment measures participants on estimated food-grade PCR polypropylene production volume, held constant across all players. Veolia and LyondellBasell lead through collection network scale and chemical recycling investment, Indorama, PureCycle and Borealis follow, and the gap between the leader and the fifth player is moderate.
Competition runs on four dimensions today: purity and contamination consistency, regulatory approval status, feedstock supply security, and price per tonne. Global groups win on collection scale and processing investment, technology licensors win on proprietary purification methods, and regional reclaimers win on local feedstock access. Buyers compare contamination testing, regulatory documentation and delivery reliability.

Emerging pressure comes from chemical recycling capacity displacing mechanical recycling for strict purity applications, from traceability platforms that lock in brand relationships and from feedstock costs that favour scale collectors. Rankings shift where a supplier secures regulatory approval, wins brand exclusivity or builds resilient feedstock collection, and consolidation continues as small reclaimers face capital and certification costs.
food-grade-pcr-polypropylene-market-company-positioning-matrix-1790048001909

Competitive Moat and Risk Dimensions

VEOLIA

Moat: Collection Scale and Feedstock Access

Veolia operates one of the world's largest waste collection and recycling networks, giving it direct feedstock access and processing scale across Europe, North America and parts of Asia. Its collection network, feedstock access and integrated processing give it strong access to converters and brand owners, and its scale supports continued investment in food-grade decontamination capacity.
VEOLIA

Risk: Feedstock Cost Exposure and Competition

Veolia faces feedstock collection cost swings that squeeze recycling margins directly, while chemical recycling technology licensors compete on purity claims for premium applications. Contamination variability raises processing cost, regulatory approval delays can slow expansion, and rule changes can shift demand quickly. Investors expect steady returns and disciplined capital use.
LYONDELLBASELL

Moat: Chemical Scale and Recycling Investment

LyondellBasell applies its global polyolefin manufacturing scale and chemical engineering expertise to both mechanical and chemical recycling of polypropylene, giving it processing depth beyond typical recyclers. Its chemical scale, compounding capability and brand relationships give it strong access to converters, and its scale supports investment in advanced recycling technology.
LYONDELLBASELL

Risk: Capital Intensity and Feedstock Dependence

LyondellBasell's chemical recycling investment requires significant capital that takes years to generate returns, and the business depends on consistent feedstock supply from third-party collectors it does not fully control. Regulatory approval delays can slow expansion, feedstock costs squeeze margins, and rule changes can shift demand quickly. Investors expect steady returns.

Players Tracked

Prominent Players

Veolia
LyondellBasell
Indorama Ventures
PureCycle Technologies
Borealis

Other Key Players

SABIC
TotalEnergies
Berry Global
Plastic Energy
Loop Industries
Renewi
Suez
ALPLA
Greenback Recycling Technologies
Poly Recycling
Corepla
Morssinkhof Rymoplast
Lucro Plastecycle
Nordsjaelland Genbrug
ReVital Polymers

Recent Developments

JANUARY 2026

Recycling Group Launches Chemically Recycled Food-Grade Polypropylene Line for High-Purity Packaging Applications

A recycling group launched a chemically recycled food-grade polypropylene line for high-purity packaging applications, according to company communications. It is a product launch, not an acquisition, and it tests chemical recycling demand. The line uses depolymerisation technology. Sales terms were not disclosed. Rollout follows converter reviews.
Signal: Confirms recyclers are widening chemical recycling lines because strict purity thresholds favour depolymerisation over mechanical processing.
FEBRUARY 2026

Waste Management Group Expands Collection and Sortation Capacity to Serve Growing Food-Grade Resin Demand

A waste management group expanded collection and sortation capacity to serve growing food-grade resin demand, according to company communications. It is an organic capacity expansion, not an acquisition, and it tests supply readiness. The facility adds sorting lines. Financial terms were not disclosed. Rollout follows converter reviews.
Signal: Shows recyclers are scaling collection because feedstock supply increasingly limits food-grade resin production capacity. Buyers confirm results.
MARCH 2026

Regulator Announces Updated Guidance for Chemical Recycling Process Approval Under Food Contact Rules

A regulator announced updated guidance for chemical recycling process approval under food contact rules, according to public announcements. It is a regulatory action, not a commercial deal, and it tests approval clarity. The guidance covers several process types. Timing of adoption remains open. Rollout follows converter reviews.
Signal: Indicates regulators are clarifying chemical recycling pathways because packaging waste targets increasingly depend on approved processes.

Feedstock, Decontamination and Regulatory Cost Exposure

Post-consumer bale and sortation inputs account for roughly 40% of manufacturing cost, decontamination processing energy about 18%, regulatory and testing expense amortised per unit about 12%, labour and quality control about 14%, packaging and logistics about 10%, and equipment depreciation about 6%. Feedstock comes from municipal and commercial collection systems in Europe, North America and increasingly Asia, and decontamination equipment from specialist processing technology suppliers.
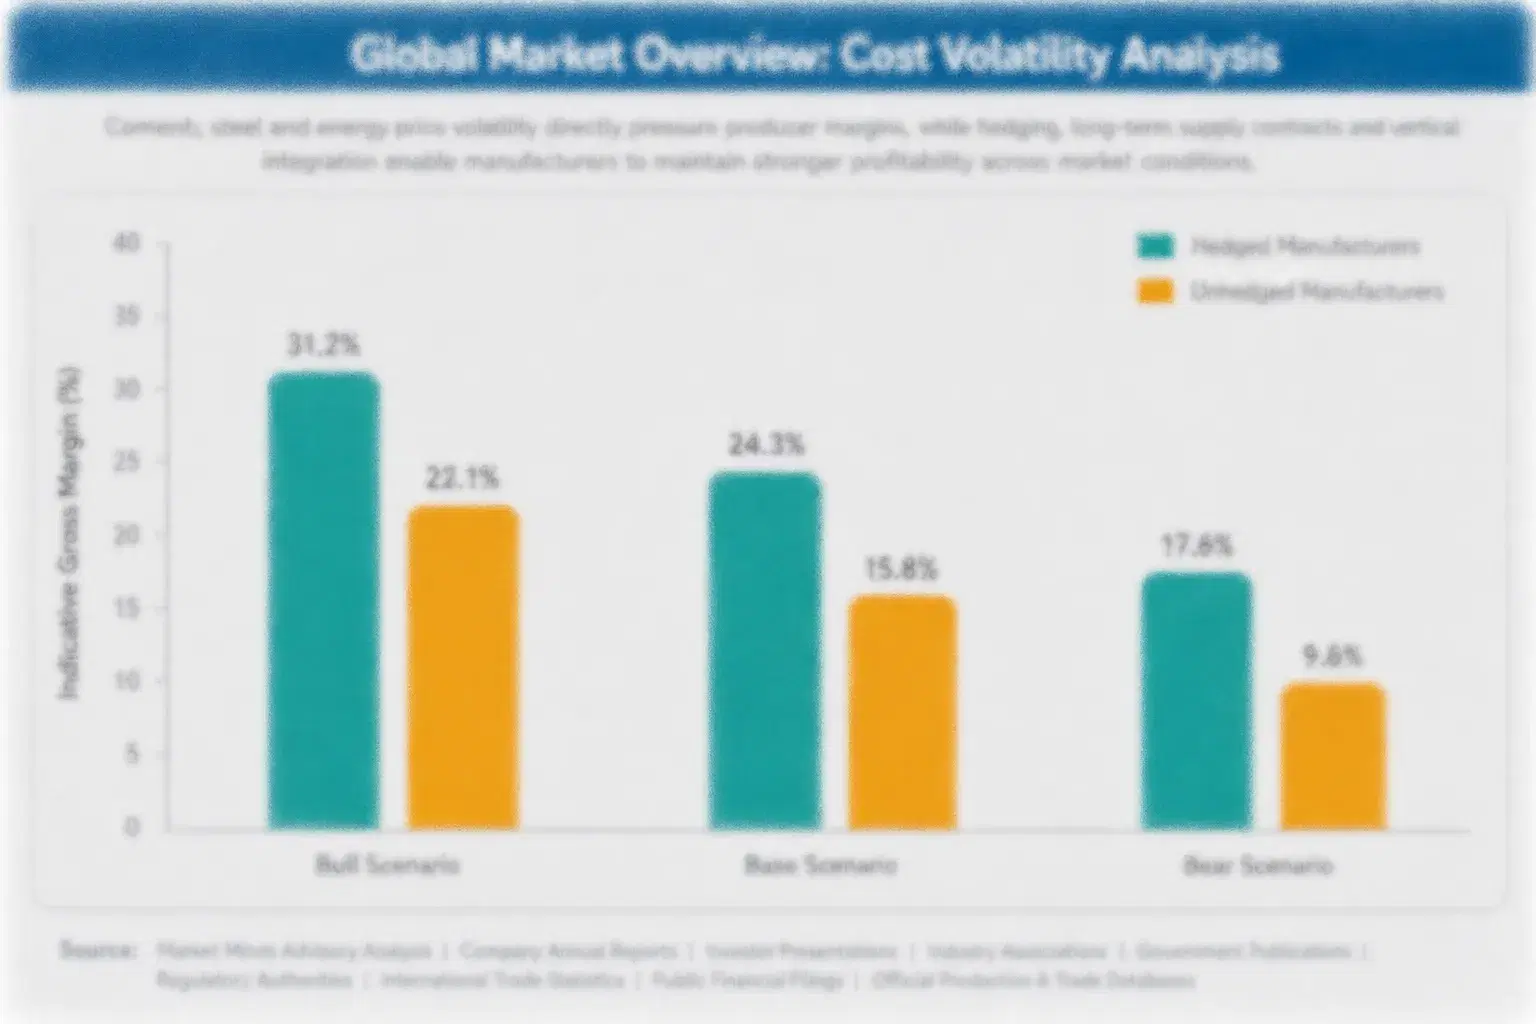
The clearest recent shock came in 2022 and 2023. Post-consumer resin prices rose sharply as recycled content mandates increased demand faster than collection infrastructure could scale, according to industry pricing data, and IEA data show energy costs affecting decontamination processing. Recyclers absorbed part of the increase, raised prices gradually and invested in collection infrastructure, which compressed margins. Some relief came in 2024 as collection volumes grew.

The disadvantage falls on small reclaimers without collection scale, decontamination technology or capital access, because they pay more per tonne for feedstock and cannot spread fixed regulatory cost across sufficient volume. Exposure varies by player type: global groups hold collection scale and processing investment, technology licensors depend on feedstock partnerships, and regional reclaimers depend on local collection quality. Scale decides who reaches consistent purity first.
food-grade-pcr-polypropylene-market-cost-volatility-analysis-1790048002099

Feedstock Supply Contracts and Collection Infrastructure Investment

Recyclers sign multi-year feedstock supply contracts and invest directly in collection infrastructure to cut cost swings of 15% to 30% per year. The main challenge is capital of $5 million to $30 million and multi-year infrastructure build time, so recyclers stage investment. Procurement teams monitor bale prices each month against budgets, and managers review terms yearly.

Advanced Optical Sorting and Contamination Reduction Technology

Recyclers invest in advanced optical sorting technology to cut contamination rates and reprocessing cost by 20% to 35%. The main challenge is capital of $3 million to $15 million per facility, so recyclers stage investment by facility priority. Quality teams review sorting accuracy weekly and report deviations to management. Managers approve each shift. Records stay current.

Regional Processing Hubs Near Dense Collection Areas

Recyclers site processing hubs near dense collection areas to cut transport cost by 10% to 20% and shorten feedstock delivery times. The main challenge is capital and permitting delays, so recyclers prioritise the largest collection markets first. Results are reviewed each year, and audits confirm delivered cost against targets. Sites open in stages. Costs stay tracked.

Portfolio Architecture for Margin Defence

Margins run from thin returns on standard mechanically recycled resin to strong returns on chemically recycled resin and certification services sold with regulatory credibility and brand trust. Three tiers separate volume products, premium certified products and next-generation solutions, and each draws on different collection scale, decontamination technology and brand relationships in a fragmented market. Margin gaps between tiers run to 26 points.
The tension between volume and premium is sharp. Standard mechanically recycled resin fills processing capacity at moderate prices and faces feedstock swings, while chemically recycled resin and certification services earn higher margins on smaller volumes and depend on regulatory approval, purity consistency and brand trust. Recyclers that run only volume suffer when feedstock costs rise, while premium-only recyclers struggle to fund broad collection infrastructure.

High-value pools concentrate in chemically recycled food-grade polypropylene and in certification and traceability services for brands facing regulatory scrutiny. They gather where converters and brands pay for measured purity, verified sourcing and audit-ready documentation, not for resin volume alone. Compounds and blends add a tailored formulation pool, and strong suppliers hold more than one, though each needs different processing skills.

Volume / Commodity-Adjacent

Standard mechanically recycled food-grade resin sold on price per tonne to converters for moderate recycled content applications. Buyers focus on cost and availability, contracts follow annual tenders, and differentiation is limited by shared processing methods.
Gross Margin: 18%-28%

Premium / Certified

Compounded and blended food-grade resin with consistent purity and regulatory documentation sold to commercial converters and brand owners. Buyers value proof of contamination testing, consistency and reliable supply, and contracts run for one or more years with regular audits.
Gross Margin: 24%-36%

Sustainability / Regulatory / Next-Generation

Chemically recycled resin and bundled certification and traceability services sold to brands managing regulatory compliance and flagship packaging commitments. Sales depend on regulatory approval, purity data and documentation transparency across regions, and suppliers must show reliable capacity.
Gross Margin: 30%-44%
food-grade-pcr-polypropylene-market-portfolio-architecture-1790048002295

High-value Sub-segments and Strategic Watch-out

Chemically Recycled Food-Grade Polypropylene

Chemically recycled food-grade polypropylene combines the fastest growth with the strongest pricing, since converters accept gross margins of 34% to 44% for consistent purity that clears strict thresholds. Proprietary technology, capital scale and regulatory approval form the entry barrier, and suppliers with credible purity data lead.
Gross Margin: 34%-44%

Certification and Traceability Services

Certification and traceability services deliver solid growth with premium pricing, since brands support gross margins of 30% to 42% for auditable proof of recycled content claims. Digital infrastructure and audit partnerships limit competition, though documentation cost adds risk. Reviews occur each season. Converters renew contracts each year.
Gross Margin: 30%-42%

Mechanically Recycled Food-Grade Polypropylene

Mechanically recycled food-grade polypropylene is the volume core, with value growing about 7.0% a year. Feedstock cost, contamination variability and price competition decide profit, and global groups and regional reclaimers hold most sales. Converters renew contracts yearly at prices linked to competing bids. Converters renew contracts each year.
Gross Margin: 18%-28%

Food-Grade PCR Compounds and Blends

Food-grade PCR compounds and blends are the strategic watch-out, since growth of about 6.2% a year trails the leaders, tailored formulation applications serve narrower niches and standard resin increasingly meets most converter needs directly. Suppliers should manage ranges selectively and steer investment toward chemical recycling and certification services.
Gross Margin: 20%-32%

Why Converters Keep Buying Certified Resin

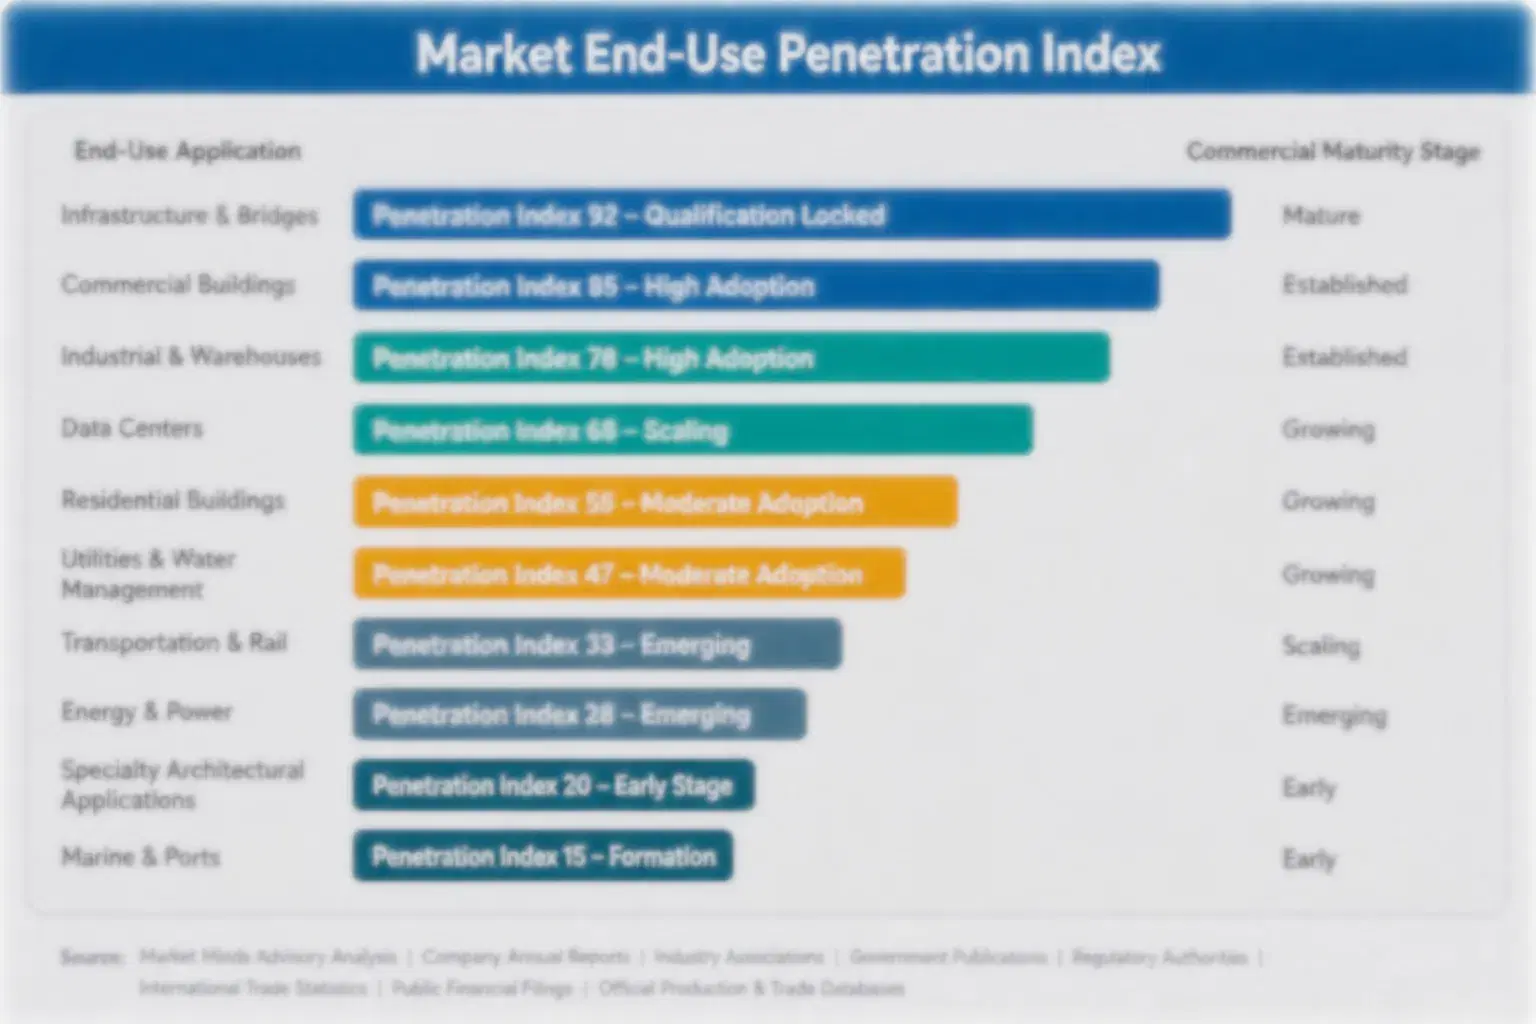
Food-grade PCR polypropylene demand behaves like an annuity attached to every packaging reformulation cycle. Once a converter qualifies a resin supplier's purity and regulatory documentation, orders repeat with every production run, and switching means requalifying against migration testing and risking packaging line performance. Contracts run around volume, regulatory status and consistency, so suppliers with reliable purity earn recurring revenue. Trust, once earned, takes years to lose.
Adoption stickiness differs by end-use vertical. Brand owners with public recycled content commitments are the deepest, since resin sourcing is embedded in sustainability reporting and switching risks public claims. Mid-sized converters are moderately sticky, driven by cost and general compliance needs. Small packagers are more fluid, buying opportunistically and switching more readily, though a failed migration test holds interest in verified suppliers for years.

Buyer profiles are shifting between generations. Older packaging engineers saw recycled resin as a niche secondary packaging option, while younger sustainability and procurement teams treat certified food-grade resin as a mainstream sourcing requirement and compare suppliers on documentation depth. Regulators and retailers add a third group that sets compliance expectations. Suppliers that publish clear purity and traceability data win newer buyers.
food-grade-pcr-polypropylene-market-end-use-penetration-index-1790048002484

MMA Verdict: PCR Polypropylene Strategy

These are among the four positions where our research anticipates prominent divergence between winners and laggards over the coming forecast period. Each is grounded in the demand model, the regulatory perimeter, and the announced capacity pipeline.
01 / CHEMICAL RECYCLING STRATEGY

Scale Chemical Recycling Before Converters Standardise on Approved Purity Suppliers

Converters need resin that clears the strictest purity thresholds, and suppliers that scale chemical recycling capacity with regulatory approval win sales worth 10% to 18% of revenue at gross margins of 34% to 44%. Suppliers should invest $10 million to $50 million per plant, secure feedstock supply and complete regulatory filings. Those that delay will lose converters over the next two years, while early movers hold clearly higher prices and stronger margins across every annual review, audit, planning stage and season.
02 / TRACEABILITY PLATFORM STRATEGY

Build Certification Platforms Before Brands Standardise on Rival Documentation Providers

Brands want auditable proof of recycled content claims, and suppliers that build digital certification and traceability platforms win contracts worth 8% to 15% of revenue at gross margins of 30% to 42%. Suppliers should invest $1 million to $8 million, build chain-of-custody systems and secure third-party audits. Those that delay will lose valuable contracts over the next two years, while early movers hold much stronger, deeper and lasting ties and clearly better margins across every review, season and annual negotiation.
03 / BRAND EXCLUSIVITY DISCIPLINE

Secure Exclusive Partnerships Before Rival Suppliers Capture Flagship Packaging Contracts

Brands want differentiation and supply security, and suppliers that secure exclusive partnerships for flagship packaging lines win contracts worth 8% to 14% of revenue at premiums of 5% to 12% per tonne. Suppliers should invest $1 million to $6 million, co-develop formulations and guarantee supply volumes. Those that delay will lose important exclusivity across every major market over the next two years, while early movers hold clearly, deeply and lastingly stronger loyalty and better margins across every review, season and annual negotiation.
04 / FEEDSTOCK SUPPLY STRATEGY

Diversify Feedstock Collection Before Contamination Swings Erode Recycler Margins Again

Feedstock makes up about 40% of cost, and suppliers that diversify collection across regions and invest in advanced sorting technology cut cost and contamination swings by 15% to 30% and protect margins worth 5% to 9% of profit. Suppliers should invest $2 million to $10 million, qualify multiple collection sources and invest in optical sorting. Those that delay will pay rising input bills over the next two years, while early movers hold lower costs and stronger margins across every production cycle and annual budget review.

Engagement Snapshot From the Field

A live engagement with an industry participant carrying material or product regulatory and market exposure ahead of a defining policy shift, showing how our research translates into a defensible multi-year portfolio strategy.
MARKET MINDS ADVISORY · CLIENT ENGAGEMENT SUMMARY
Food-Grade PCR Polypropylene Producer Strategic Portfolio Review and Transition Roadmap 2026·Investment Scenario on Food-Grade PCR Polypropylene Exposure Evaluation 2025-26
CLIENT PROFILE
The client is a mid-sized European food packaging converter with annual revenue near $340 million (client-reported, unverified by MMA), supplying rigid containers to several major food brands facing binding recycled content deadlines under EU packaging waste regulation, with limited existing relationships with qualified food-grade resin suppliers. The board wanted a defensible plan before next year's contracts closed.
STRATEGIC CHALLENGE
Two major customers required 30% recycled content by 2027 under regulatory deadlines (client-reported, unverified by MMA), the converter's current resin supplier lacked chemical recycling capability for higher-purity applications and management had to decide between supplier diversification or deeper investment with the existing partner. Customers wanted a credible supply roadmap before committing to next year's contracts.
MMA APPROACH
MMA analysed resin purity, cost and regulatory status across five supplier options, interviewed 14 packaging engineers, brand sustainability teams and resin suppliers, and ran a supplier comparison on chemical recycling capacity, certification depth and pricing across six countries. It modelled supply risk and cost by supplier mix and compared diversification against deepened partnership options.
KEY FINDINGS
  1. Qualifying two chemical recycling suppliers alongside the existing mechanical recycling partner would meet the 30% target with supply redundancy (client-reported, unverified by MMA).
  2. Certification and traceability documentation from qualified suppliers would satisfy both customers' regulatory audit requirements directly and simplify audit preparation (client-reported, unverified by MMA).
  3. A blended sourcing strategy would cost about 12% more than virgin resin but well within customer-approved premium budgets (client-reported, unverified by MMA).
  4. Early supplier qualification would secure allocation ahead of expected capacity constraints as more converters pursue similar targets and protect long-term supply (client-reported, unverified by MMA).
CLIENT PROFILE
The client is a mid-sized European food packaging converter with annual revenue near $340 million (client-reported, unverified by MMA), supplying rigid containers to several major food brands facing binding recycled content deadlines under EU packaging waste regulation, with limited existing relationships with qualified food-grade resin suppliers. The board wanted a defensible plan before next year's contracts closed.
STRATEGIC CHALLENGE
Two major customers required 30% recycled content by 2027 under regulatory deadlines (client-reported, unverified by MMA), the converter's current resin supplier lacked chemical recycling capability for higher-purity applications and management had to decide between supplier diversification or deeper investment with the existing partner. Customers wanted a credible supply roadmap before committing to next year's contracts.
MMA APPROACH
MMA analysed resin purity, cost and regulatory status across five supplier options, interviewed 14 packaging engineers, brand sustainability teams and resin suppliers, and ran a supplier comparison on chemical recycling capacity, certification depth and pricing across six countries. It modelled supply risk and cost by supplier mix and compared diversification against deepened partnership options.
KEY FINDINGS
  1. Qualifying two chemical recycling suppliers alongside the existing mechanical recycling partner would meet the 30% target with supply redundancy (client-reported, unverified by MMA).
  2. Certification and traceability documentation from qualified suppliers would satisfy both customers' regulatory audit requirements directly and simplify audit preparation (client-reported, unverified by MMA).
  3. A blended sourcing strategy would cost about 12% more than virgin resin but well within customer-approved premium budgets (client-reported, unverified by MMA).
  4. Early supplier qualification would secure allocation ahead of expected capacity constraints as more converters pursue similar targets and protect long-term supply (client-reported, unverified by MMA).
RECOMMENDED STRATEGY
Phase 1: Phase 1 (Months 1-6): Qualify two chemical recycling suppliers and begin blended trial runs alongside the existing mechanical recycling partner. Phase 2: Phase 2 (Months 7-15): Scale blended sourcing across priority customer lines and formalise certification documentation for regulatory audits. Customers reviewed the documentation closely. Phase 3: Phase 3 (Months 16-24): Extend the blended approach to remaining product lines using cost and supply data from the pilot phases.
OUTCOME
Within 24 months, the converter reached 32% average recycled content across customer lines, both customers renewed contracts under the new supply structure and documentation passed regulatory review cleanly (client-reported, unverified by MMA). The converter credited early supplier qualification with securing capacity ahead of market tightening.

Frequently Asked Questions

Foundational context covering the market sizes, CAGR, scope, country, region and competition that inform every finding below. This section is provided to cover basics and most often pre-purchase conversations, answered from the MMA Primary Research Dataset.

What is the current size of the Food-Grade PCR Polypropylene Market?

The global food-grade PCR polypropylene market was valued at $1.4 billion in 2025 on a manufacturer revenue basis. Growth comes from EU recycled content mandates, brand sustainability commitments and chemical recycling capacity, and faces feedstock costs and approval timelines.

How large will the Food-Grade PCR Polypropylene Market be by 2036?

The market is projected to reach $3.80 billion by 2036, up from $1.53 billion in 2026. The increase of $2.27 billion reflects chemical recycling, certification services and Asian capacity growth.

What is the CAGR for the Food-Grade PCR Polypropylene Market 2026 to 2036?

The market is forecast to grow at a 9.5% CAGR from 2026 to 2036. The bull case reaches 11.0% and the bear case 8.0%, depending on mandate timing, chemical recycling scale-up and feedstock costs.

Which segment is growing fastest?

Chemically Recycled Food-Grade Polypropylene is the fastest-growing segment at 13.3% CAGR, roughly 1.40 times the overall market rate. Certification and Traceability Services follows at 10.4% CAGR, led by regulatory documentation demand.

Who are the major companies in the Food-Grade PCR Polypropylene Market?

Major companies include Veolia, LyondellBasell, Indorama Ventures, PureCycle Technologies and Borealis worldwide. SABIC, TotalEnergies, Berry Global, Plastic Energy and Loop Industries also hold meaningful positions.

Which country is growing fastest?

China is growing fastest at about 14.0% CAGR, because rapid recycling capacity investment and export-linked brand requirements expand together. India and Vietnam follow through similar infrastructure investment.

Report Segmentation Architecture

The full report scope spans multiple orthogonal segmentation dimensions, with cross-tabulated demand data provided for each dimension pair. Coverage extends further to regional breakdowns, trend trajectories, and the competitive detail needed to support segment-level decision-making.

By Primary Market Dimension

  • Mechanically Recycled Food-Grade Polypropylene
  • Chemically Recycled Food-Grade Polypropylene
  • Decontamination and Super-Clean Process Technology
  • Food-Grade PCR Compounds and Blends
  • Certification and Traceability Services

By End-Use Industry

  • Rigid Food Packaging Converters
  • Flexible Food Packaging Converters
  • Beverage Container Manufacturers
  • Food Brand Owners

By Commercial Dimension

  • Direct Sales to Converters
  • Brand Exclusivity Partnership Contracts
  • Distributor Networks
  • Certification and Traceability Bundles
  • Technology Licensing Agreements

By Region

  • North America
  • Western Europe
  • East Asia
  • South Asia and Pacific
  • Latin America
  • Middle East and Africa
  • Eastern Europe

Scope, Methodology, and Coverage

Every figure in this report is reproducible from documented input assumptions. The scope below maps the historical period, the forecast horizon, the segmentation dimensions, and the countries covered, alongside the underlying primary and qualitative methodology.
Historical Period
2020 to 2025
Forecast Period
2026 to 2036
Base Year
2025 (USD billions; MMA Primary Research Dataset, September 2026)
Market Definition
The market covers global manufacturer revenue from food-grade PCR polypropylene, defined as post-consumer recycled polypropylene resin processed and certified for direct food contact packaging applications, in mechanically recycled food-grade PP, chemically recycled food-grade PP, decontamination and super-clean process technology, food-grade PCR PP compounds and blends, and certification and traceability services, sold to packaging converters and brand owners and valued at manufacturer revenue. It excludes non-food-grade recycled PP, virgin polypropylene and other recycled resin types such as PET or HDPE.
Quantitative Units
USD billions (manufacturer revenue); thousand tonnes for volume references
Segmentation Dimensions
By Processing Type; By End-Use Industry; By Commercial Dimension; By Region
Regions Covered
North America, Western Europe, East Asia, South Asia and Pacific, Latin America, Middle East and Africa, Eastern Europe
Countries Covered
United States, Canada, Mexico, Germany, France, Netherlands, United Kingdom, Belgium, Italy, China, Japan, South Korea, India, Vietnam, Australia, Brazil, Mexico Central, Argentina, Saudi Arabia, United Arab Emirates, South Africa, Poland, Czechia, Denmark, and additional markets relevant to this sector
Key Companies Profiled
Veolia, LyondellBasell, Indorama Ventures, PureCycle Technologies, Borealis, SABIC, TotalEnergies, Berry Global, Plastic Energy, Loop Industries, Renewi, Suez, ALPLA, Greenback Recycling Technologies, Poly Recycling, Corepla, Morssinkhof Rymoplast, Lucro Plastecycle, Nordsjaelland Genbrug, ReVital Polymers
Quantitative Methodology
Primary survey, n=3,800 respondents, Q4 2025, six countries; demand-side model with trade association cross-validation
Qualitative Methodology
47 expert interviews, Q4 2025; applied to validate demand model assumptions, identify emerging dynamics, and assess competitive positioning
Report Format
PDF and XLSX data workbook (Word format preview document)
Publisher
Market Minds Advisory
Report Code
MMA-2026-CHM-358
Published
September 2026
Contact
sales@marketmindsadvisory.com | www.marketmindsadvisory.com

Purchase the full Food-Grade PCR Polypropylene Market Report (2026 to 2036).

The full report delivers a detailed assessment of the global food-grade PCR polypropylene market through 2036, covering processing type, end-use industry, channel and regional forecasts, competitive benchmarking of leading recyclers and technology licensors, and input cost analysis. It combines MMA primary research, including a six-country survey of 3,800 respondents and 47 expert interviews, with public statistical and company data. Analysts also model feedstock, decontamination and regulatory cost scenarios. Clients receive segment margin ranges, capacity trackers and a case study on converter sourcing strategy. Buyer negotiation frameworks are also included.
Ten-year processing type and end-use demand forecasts
Feedstock, decontamination and regulatory cost tracking
Competitive benchmarking of leading recycled resin suppliers
Packaging waste and food contact regulation tracker
Regional comparative analysis and forecasts included
Quarterly primary survey data update access

Built For The People Who Decide

From boardroom strategy to bench-side execution, this report is read cover-to-cover by leaders shaping the next decade of their industry, turning demand scenarios, market dynamics and valuation benchmarks into decisions.
CXOs/ Presidents/ VPs/ Managers
M&A and Corporate Development
Strategy Teams and R&D Heads
Procurement and Product Directors
Regulatory and Compliance Leaders
Investor Relations and Equity Analysts