Market Minds Advisory
Food and Beverage Industry Software Market

Food and Beverage Industry Software Market: Food and Beverage Industry Software Market. Compliance, Traceability, and Operations Platforms for Food Manufacturers

Tightening food safety traceability mandates are pushing manufacturers toward specialized compliance software faster than generic ERP vendors can retrofit their platforms, forcing a costly modernization race across regulated food supply chains.

Lead Analyst

Published

September 2026

Make Smarter Decisions with Customized Research Insights

Request a free sample report and evaluate market opportunities, growth trends, and competitive dynamics relevant to your business needs.

2025 MARKET VALUE$4.2BMarket Size 2025
2036 FORECAST VALUE$12.0BBase Case , 2026 to 2036
CAGR 2026 TO 203610.0 %Bull 11.3% / Bear 8.7%
INCREMENTAL OPPORTUNITY$7.4BNet 10- year value creation
EXPANSION MULTIPLE2.59x2036 value over 2026 base
Strategic Levers
M&A Pipeline
Regional Outlook
Country Rankings
Competitive Intelligence
Segmental Deep-dive
Call-Us : 91 93563 13602

Executive Snapshot and Market Trajectory.

Tightening food safety traceability mandates are pushing manufacturers toward specialized compliance software faster than generic ERP vendors can retrofit their platforms, forcing a costly modernization race across regulated food supply chains worldwide, and adoption is spreading well beyond the largest multinational food manufacturers into mid-sized regional producers.
Manufacturers running mission-critical recall and traceability operations increasingly demand real-time lot-level tracking capability rather than the periodic batch reporting most legacy ERP systems were built to support. Specialized food safety vendors are capturing this shift by offering pre-built regulatory reporting templates that cut compliance implementation time meaningfully compared to custom-configured ERP modules, pulling mid-sized manufacturers who previously found dedicated compliance software too costly to justify into serious purchase consideration.
Generic ERP vendors face genuine platform transition risk as specialized food safety and traceability challengers capture new compliance software budgets, while established players extending into food-specific modules from horizontal ERP roots race to prove integration paths that preserve existing operational investments rather than requiring manufacturers to replace core systems entirely. Design win cycles now run twelve to eighteen months from evaluation to production deployment, rewarding vendors who committed engineering resources to food-specific compliance features early.
Market Definition
The food and beverage industry software market covers vertical software platforms purpose-built for food and beverage manufacturers, including food safety compliance, traceability, recipe formulation, and production planning systems. It excludes general-purpose horizontal ERP software without food-specific configuration and consumer-facing food delivery or restaurant point-of-sale applications unrelated to manufacturing operations.
Base Year Value
$4.2B in 2025 (MMA Primary Research Dataset, September 2026)
Forecast Period
2026 to 2036, eleven discrete annual values
CAGR
10.0% base case. Bull 11.3%. Bear 8.7%.
Fastest Growth Segment
Food Safety and Traceability Compliance Software: 14.0% CAGR
Fastest Growth Country
India: 12.2% CAGR
Fastest Growth Region
South Asia and Pacific: 12.2% CAGR
Largest Region
North America: 30% of 2025 global value
Market Leaders
SAP, Infor, Aptean, TraceGains, and ParityFactory lead the market. Source: MMA Analysis, July 2026.
Primary Survey
n=3,800 procurement and R&D decision-makers, Q4 2025, six countries
Methodology
Demand-side build-up, cross-validated against public data, 47 expert interviews

Food and Beverage Industry Software Market Forecast Scenarios

food-and-beverage-industry-software-market-size-forecast-scenario-1789985911273
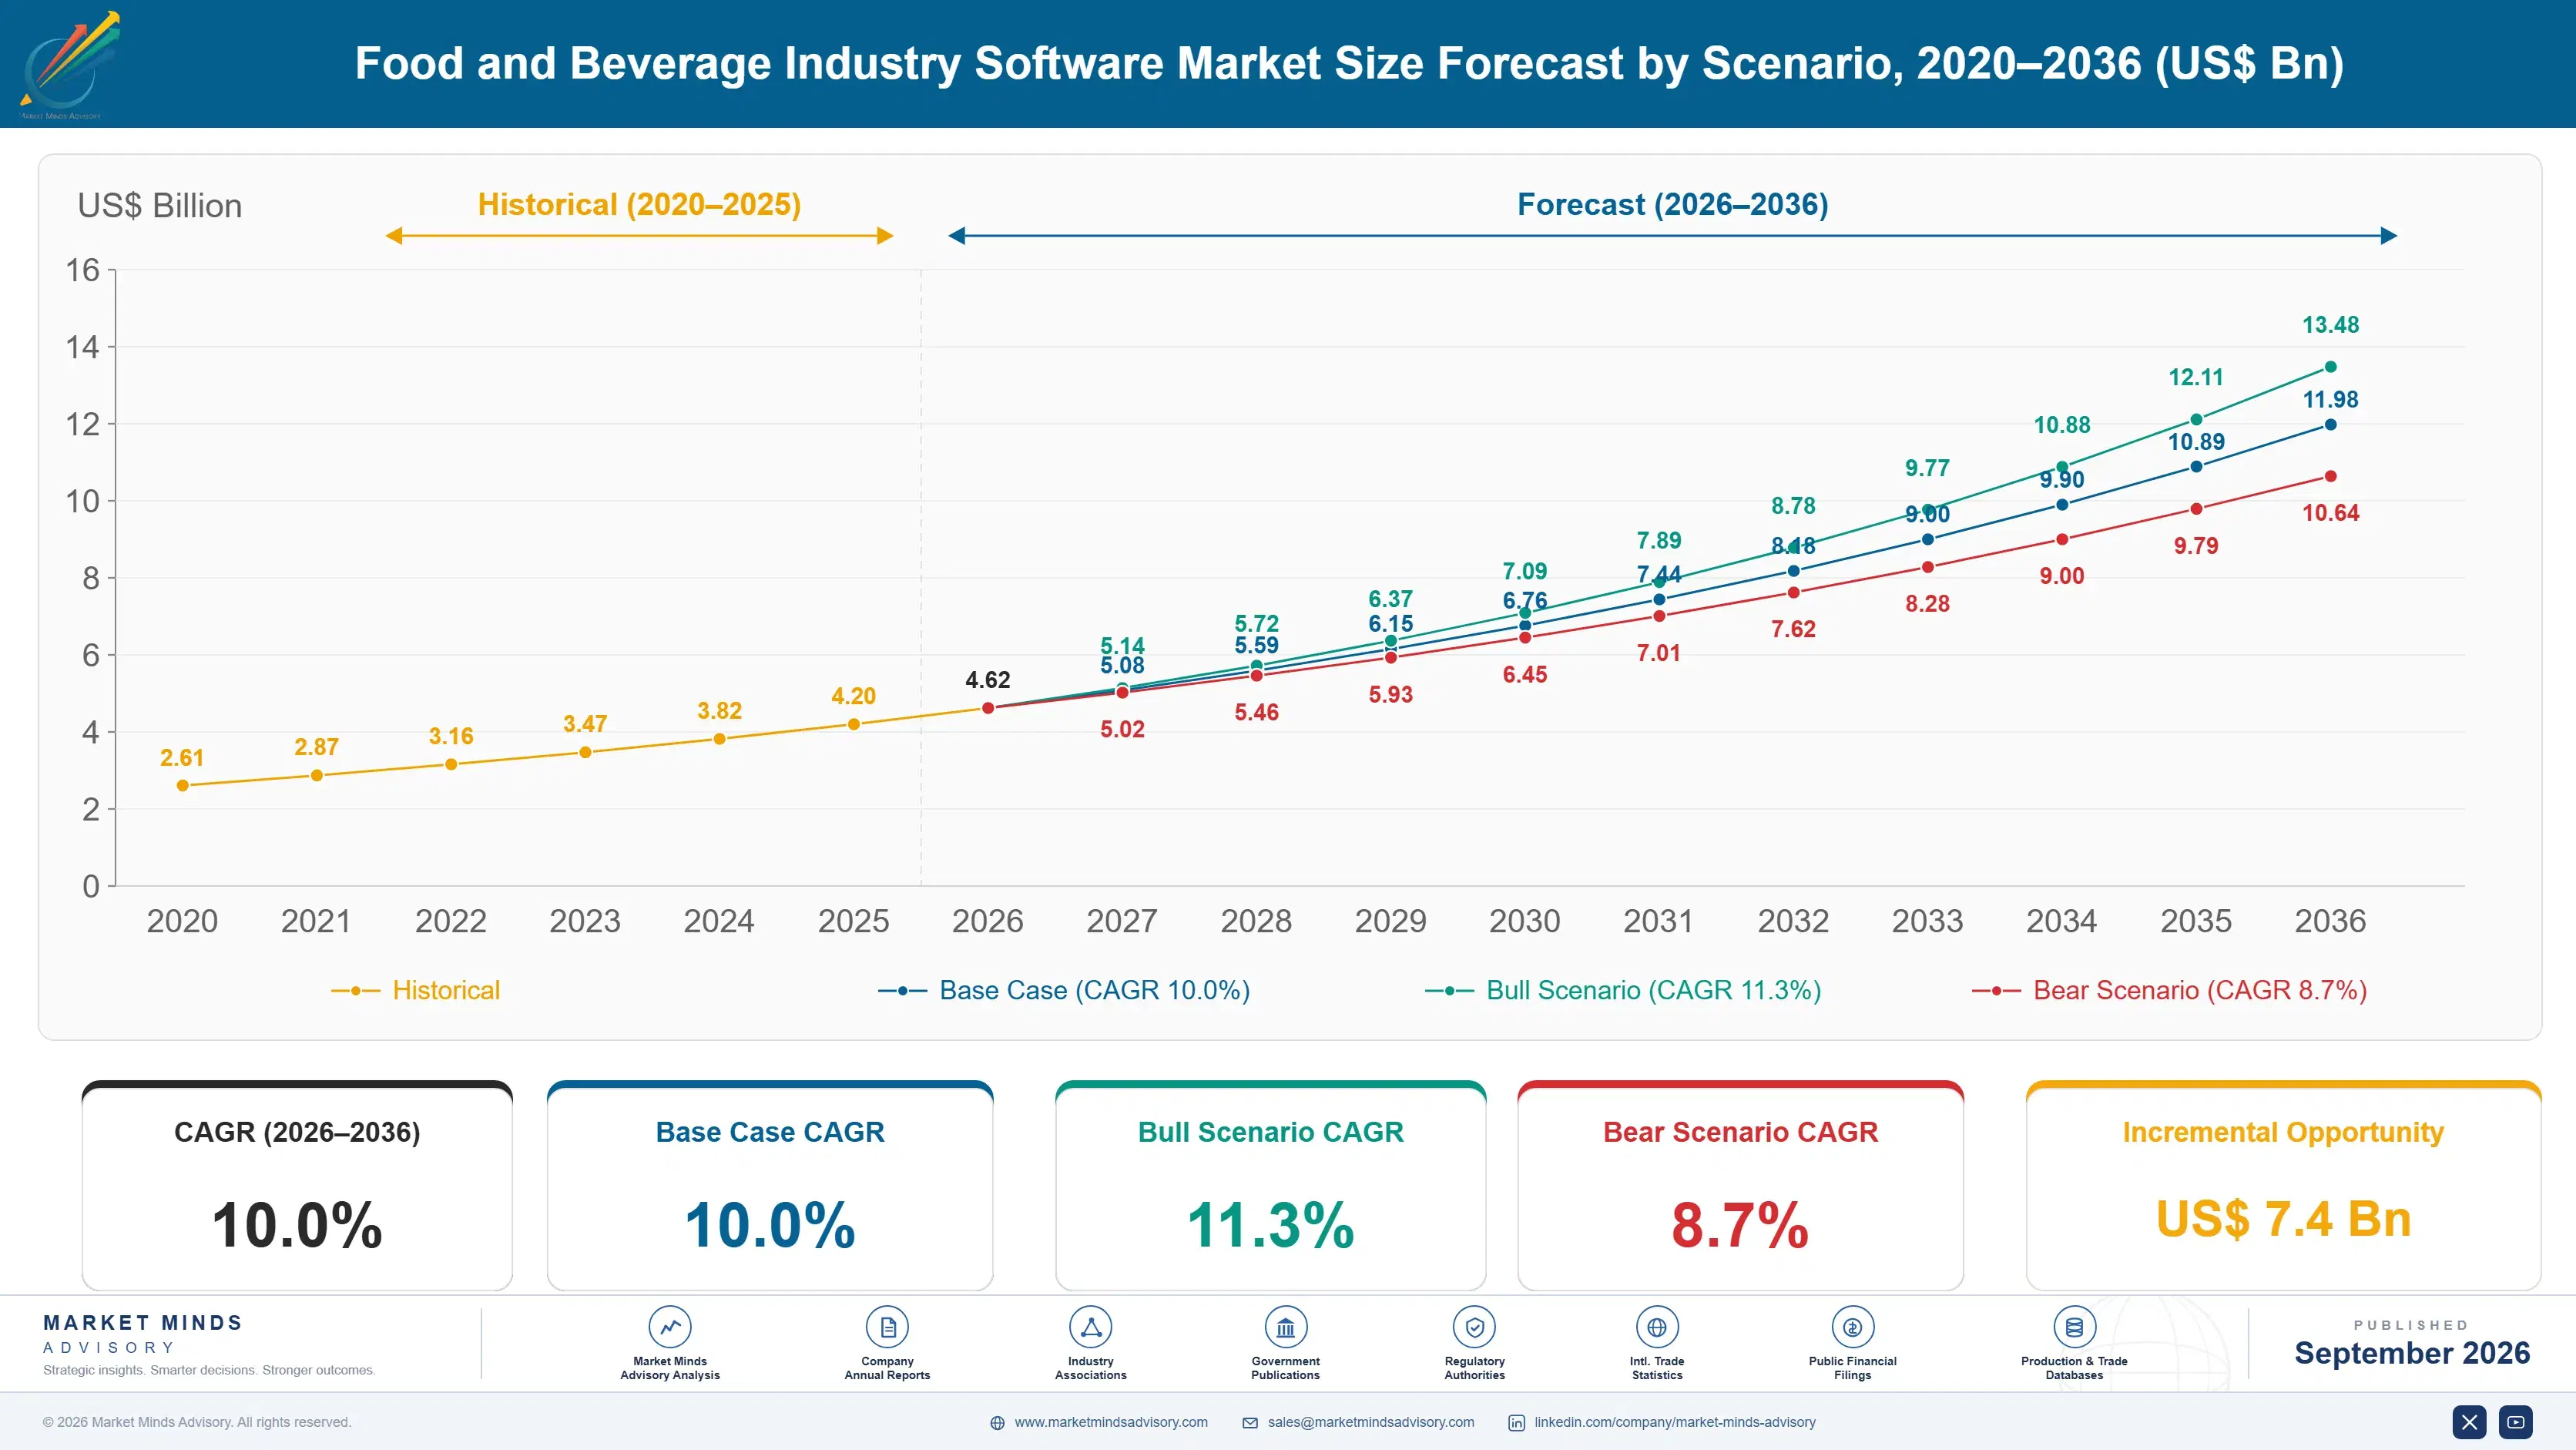
The food and beverage industry software market grew at an estimated 9.0 percent historical CAGR between 2020 and 2025, as pandemic-era supply chain disruption exposed the limitations of manual and spreadsheet-based traceability systems across food manufacturers. Regulatory tightening around lot-level recall reporting accelerated demand for specialized compliance software beyond what generic ERP configuration could reliably deliver.
The base case assumes 10.0 percent CAGR through 2036, driven by three commercial mechanisms working together: regulators mandating real-time lot-level traceability that legacy batch-reporting ERP systems cannot reliably meet, manufacturers replacing spreadsheet-based recall management with automated software as supply chain complexity grows, and software vendors integrating food safety compliance directly into broader ERP suites rather than selling standalone compliance modules, a bundling trend expanding the addressable buyer base into mid-sized manufacturers previously priced out of dedicated compliance software entirely.
The bull case centers on accelerated regulatory enforcement pulling compliance software demand upward faster than modeled, with expanded traceability mandates in major food export markets acting as the named catalyst. The bear case centers on manufacturer capital expenditure delays, a named risk that could push meaningful software purchases later into the forecast window than currently modeled.

Compliance Software Becomes the Manufacturing Baseline

Food and beverage industry software sits underneath nearly every operational decision a manufacturer makes, from raw material sourcing through recipe formulation to finished product recall management. The category has moved well past its original spreadsheet replacement role. Modern platforms now serve as the primary compliance and traceability backbone connecting suppliers, production floors, and distribution partners, and that shift is reshaping how manufacturers evaluate software beyond simple inventory tracking.
MARKET CONCENTRATION35% CR5share of market revenue held by top vendors
AVERAGE CONTRACT VALUE$135Ktypical annual spend for mid-tier manufacturer software deployment
TRACEABILITY SOFTWARE ATTACH RATE52%manufacturers now running dedicated real-time lot-level tracking capability
PLATFORM REPLACEMENT CYCLE5 Yearsaverage interval before manufacturers re-tender their software contracts
CLOUD DEPLOYMENT MIX58%revenue delivered through cloud-native rather than on-premises deployment
REGULATORY REPORTING AUTOMATION RATE44%recall documentation now generated automatically rather than manually
Regulatory enforcement has become the sharpest growth vector, pulling software demand from a category once dominated by generic inventory and production planning tools into real-time, lot-level traceability infrastructure required to meet tightening recall reporting mandates. These requirements demand tighter supplier data integration than legacy ERP systems were originally built to support, forcing incumbents to add capability quickly or lose ground to specialized compliance vendors.
Cloud-native specialist vendors bundling food safety, quality management, and supply chain visibility into unified platforms compound the competitive pressure on legacy ERP providers. As manufacturers consolidate software spending onto fewer platforms, specialist vendors increasingly compete on regulatory reporting depth and industry-specific configuration rather than raw price, and that repositioning is reshaping which vendors win the largest manufacturer renewal contracts.
"Every manufacturer used to buy inventory software and hope compliance would follow. Now compliance is the first question in every vendor evaluation. That single shift has rewritten most product roadmaps in the last two years."
Senior Director, Food and Beverage Technology Practice · MMA Vertical Enterprise Software for Food and Beverage Manufacturing Practice · September 2026

Market Trends

Real-Time Lot-Level Traceability Displaces Batch Reporting

Regulators in several major food export markets are mandating traceability capability that lets manufacturers identify every supplier and distribution point touching a specific product lot within hours rather than days, a requirement legacy batch-reporting ERP systems cannot reliably meet under current compliance timelines. Vendors that shipped real-time lot-level tracking capability over the past two years are winning enterprise software contracts worth eight figures annually from manufacturers previously running manual spreadsheet-based recall processes. Consolidating traceability and production data onto a single platform cuts compliance risk meaningfully, and manufacturers increasingly treat real-time tracking as a baseline requirement during vendor evaluation.
Market Impact: Cuts compliance reporting time 35 percent
Quality Management Software Integrates With Recall Systems

Manufacturers historically ran separate quality management and recall reporting systems that required manual data reconciliation between platforms during actual recall events, slowing response time when speed matters most. Vendors integrating quality management directly with automated recall documentation are cutting recall response time meaningfully compared to manufacturers running disconnected systems in comparable operational testing. Adoption has moved from a competitive edge reserved for the largest manufacturers to a widely expected baseline capability across mid-sized food producers over the past two years, particularly among regulated dairy, meat, and ready-to-eat food processing operations facing the strictest recall requirements.
Market Impact: Cuts disruption response time 30 percent

Market Opportunities and Growth Drivers

Expanded Recall Mandates Require Automated Reporting

Food safety authorities in several major markets are expanding mandatory recall documentation requirements to cover a broader range of product categories and supplier tiers than previous regulatory frameworks required, a shift legacy manual reporting processes cannot reliably meet within tightened compliance timelines. This regulatory push is pulling even conservative, compliance-focused manufacturers toward automated software they previously deferred adopting. Vendors serving regulated buyer segments report unusually sticky, multi-year contracts once a platform is embedded into core compliance reporting infrastructure, since migration risk during active audit cycles discourages frequent vendor switching among risk-averse manufacturers.
Market Impact: Extends migration timelines 35 percent longer

Supply Chain Disruption Drives Supplier Visibility Demand

Manufacturers rebuilding supply chain resilience after recent disruption increasingly require real-time visibility into supplier ingredient sourcing, shipment status, and inventory levels rather than relying on periodic manual check-ins that arrive days after conditions have already changed. Vendors serving this buyer segment report meaningfully faster disruption response times for clients running real-time supplier visibility compared to manual-based alternatives in comparable operational testing. Adoption has moved from a competitive edge reserved for the largest manufacturers to a widely expected baseline capability across mid-sized food producers over the past two years across most regulated ingredient categories.
Market Impact: Adds 20 percent to compliance cost

Market Restraints and Challenges

Legacy System Migration Complexity Slows Modernization

Manufacturers running decades-old ERP infrastructure often have hundreds of custom configurations and supplier data mappings built up over years, a friction point rooted in the accumulated technical debt these long-running systems carry after years of incremental patching and workarounds. The commercial impact extends migration timelines well beyond typical software replacement projects, delaying compliance benefits and increasing project cost meaningfully for manufacturers with the most heavily customized legacy systems. Vendors are mitigating the barrier through automated migration tooling that maps legacy configurations to modern platforms, cutting manual remapping effort substantially for large-scale migrations.
Market Impact: Lifts traceability attach rate 52 percent

Fragmented Regulatory Requirements Complicate Global Compliance

Manufacturers operating across multiple countries face divergent food safety regulatory requirements that differ meaningfully by jurisdiction, a friction point whose root cause is the absence of any unified global traceability standard covering every export market simultaneously. The commercial impact shows up as rising software configuration complexity and compliance engineering cost for manufacturers serving multiple regulatory jurisdictions from a single production facility. Vendors are mitigating the burden by building modular compliance rule engines that adapt to jurisdiction-specific requirements automatically, while some manufacturers standardize production processes around the strictest applicable regulatory standard globally.
Market Impact: Cuts recall response time 40 percent
3 additional market trends, 4 additional growth drivers, and 2 additional restraints and challenges are covered in the full report. Contact sales@marketmindsadvisory.com to access the complete intelligence.

Segment CAGR and Growth Architecture

The food and beverage industry software market splits into six segments by underlying operational function, spanning traceability, quality management, recipe formulation, and supply chain planning tools. Food safety compliance software and quality management platforms are growing fastest as regulatory enforcement tightens across major food export markets and manufacturers move away from spreadsheet-based tracking toward automated platforms.
food-and-beverage-industry-software-market-market-share-analysis-1789985911895

Food Safety and Traceability Compliance Software

This segment covers software that tracks ingredient lots and finished products through the entire supply chain, from raw material receipt through distribution, enabling manufacturers to identify every touchpoint a specific product lot passed through during a recall event. Growth is outpacing every other segment as regulators tighten mandatory recall documentation requirements across major food export markets, forcing manufacturers to move beyond spreadsheet-based tracking toward automated, real-time traceability platforms. Vendors shipping pre-built regulatory reporting templates are capturing outsized share of new compliance software budgets. This segment barely existed in its current automated form a decade ago and continues expanding into new regulated product categories each year, from dairy and meat into ready-to-eat and infant nutrition products.
CAGR 14.0%

Quality Management and Batch Recall Software

This segment covers software that manages quality inspection workflows, batch testing results, and automated recall documentation generation, replacing manual quality control processes that historically required extensive paper-based recordkeeping across production facilities. Demand is expanding rapidly as manufacturers face growing pressure to demonstrate quality control rigor to both regulators and increasingly discerning retail customers demanding supplier documentation. Vendors serving this buyer segment are winning contracts by letting quality teams generate recall documentation automatically rather than compiling records manually during time-sensitive recall events, cutting response timelines meaningfully across most manufacturers adopting this integrated approach, from mid-sized regional producers to the largest multinational food brands operating across dozens of production facilities and multiple regulatory jurisdictions simultaneously.
CAGR 12.0%
Full segment breakdown across 6 segments available in the complete report.

Regional Architecture and Country Demand Map

North America leads on concentrated food safety regulatory enforcement and the deepest specialized software vendor headquarters presence, while South Asia and Pacific posts the fastest regional growth as food manufacturing and export compliance requirements scale rapidly across expanding food manufacturing and export bases tracked in this report.

North America

North America holds the largest food and beverage software share on the strength of concentrated FDA food safety enforcement, the deepest specialized software vendor headquarters presence globally, and early lot-level traceability adoption among major US dairy and meat processors. Silicon Valley and Chicago-based software providers anchor a supplier base most global manufacturers still default to when selecting compliance platforms. Canadian manufacturers are following a similar traceability adoption curve roughly two years behind their US counterparts. Regulatory attention on recall reporting standards is pushing vendors here toward real-time compliance capability faster than almost any other region tracked in this report, reinforcing the local supplier advantage further and shortening enterprise procurement cycles relative to markets with less mature supplier relationships.
Share: 30% | CAGR: 10.5% (2026 to 2036)

Western Europe

Regulatory structure shapes demand across Western Europe more directly than most regions, since EU food traceability regulations and cross-border supply chain requirements push manufacturers toward software capable of meeting strict lot-level documentation and audit trail standards. German and French manufacturers lead adoption of automated compliance reporting, migrating away from manual processes faster than most peer markets given stricter enforcement posture around food safety. UK food producers, still adjusting to a post-Brexit regulatory track separate from the EU, show somewhat slower platform replacement cycles. Nordic manufacturers have emerged as an unusually strong niche for cold chain software adoption relative to their modest population base, reflecting unusually strong regional dairy and seafood export activity overall.
Share: 22% | CAGR: 8.5% (2026 to 2036)
Regional intelligence for 5 additional markets available in the complete report: East Asia, South Asia and Pacific, Latin America, Middle East and Africa, Eastern Europe. Contact sales@marketmindsadvisory.com.
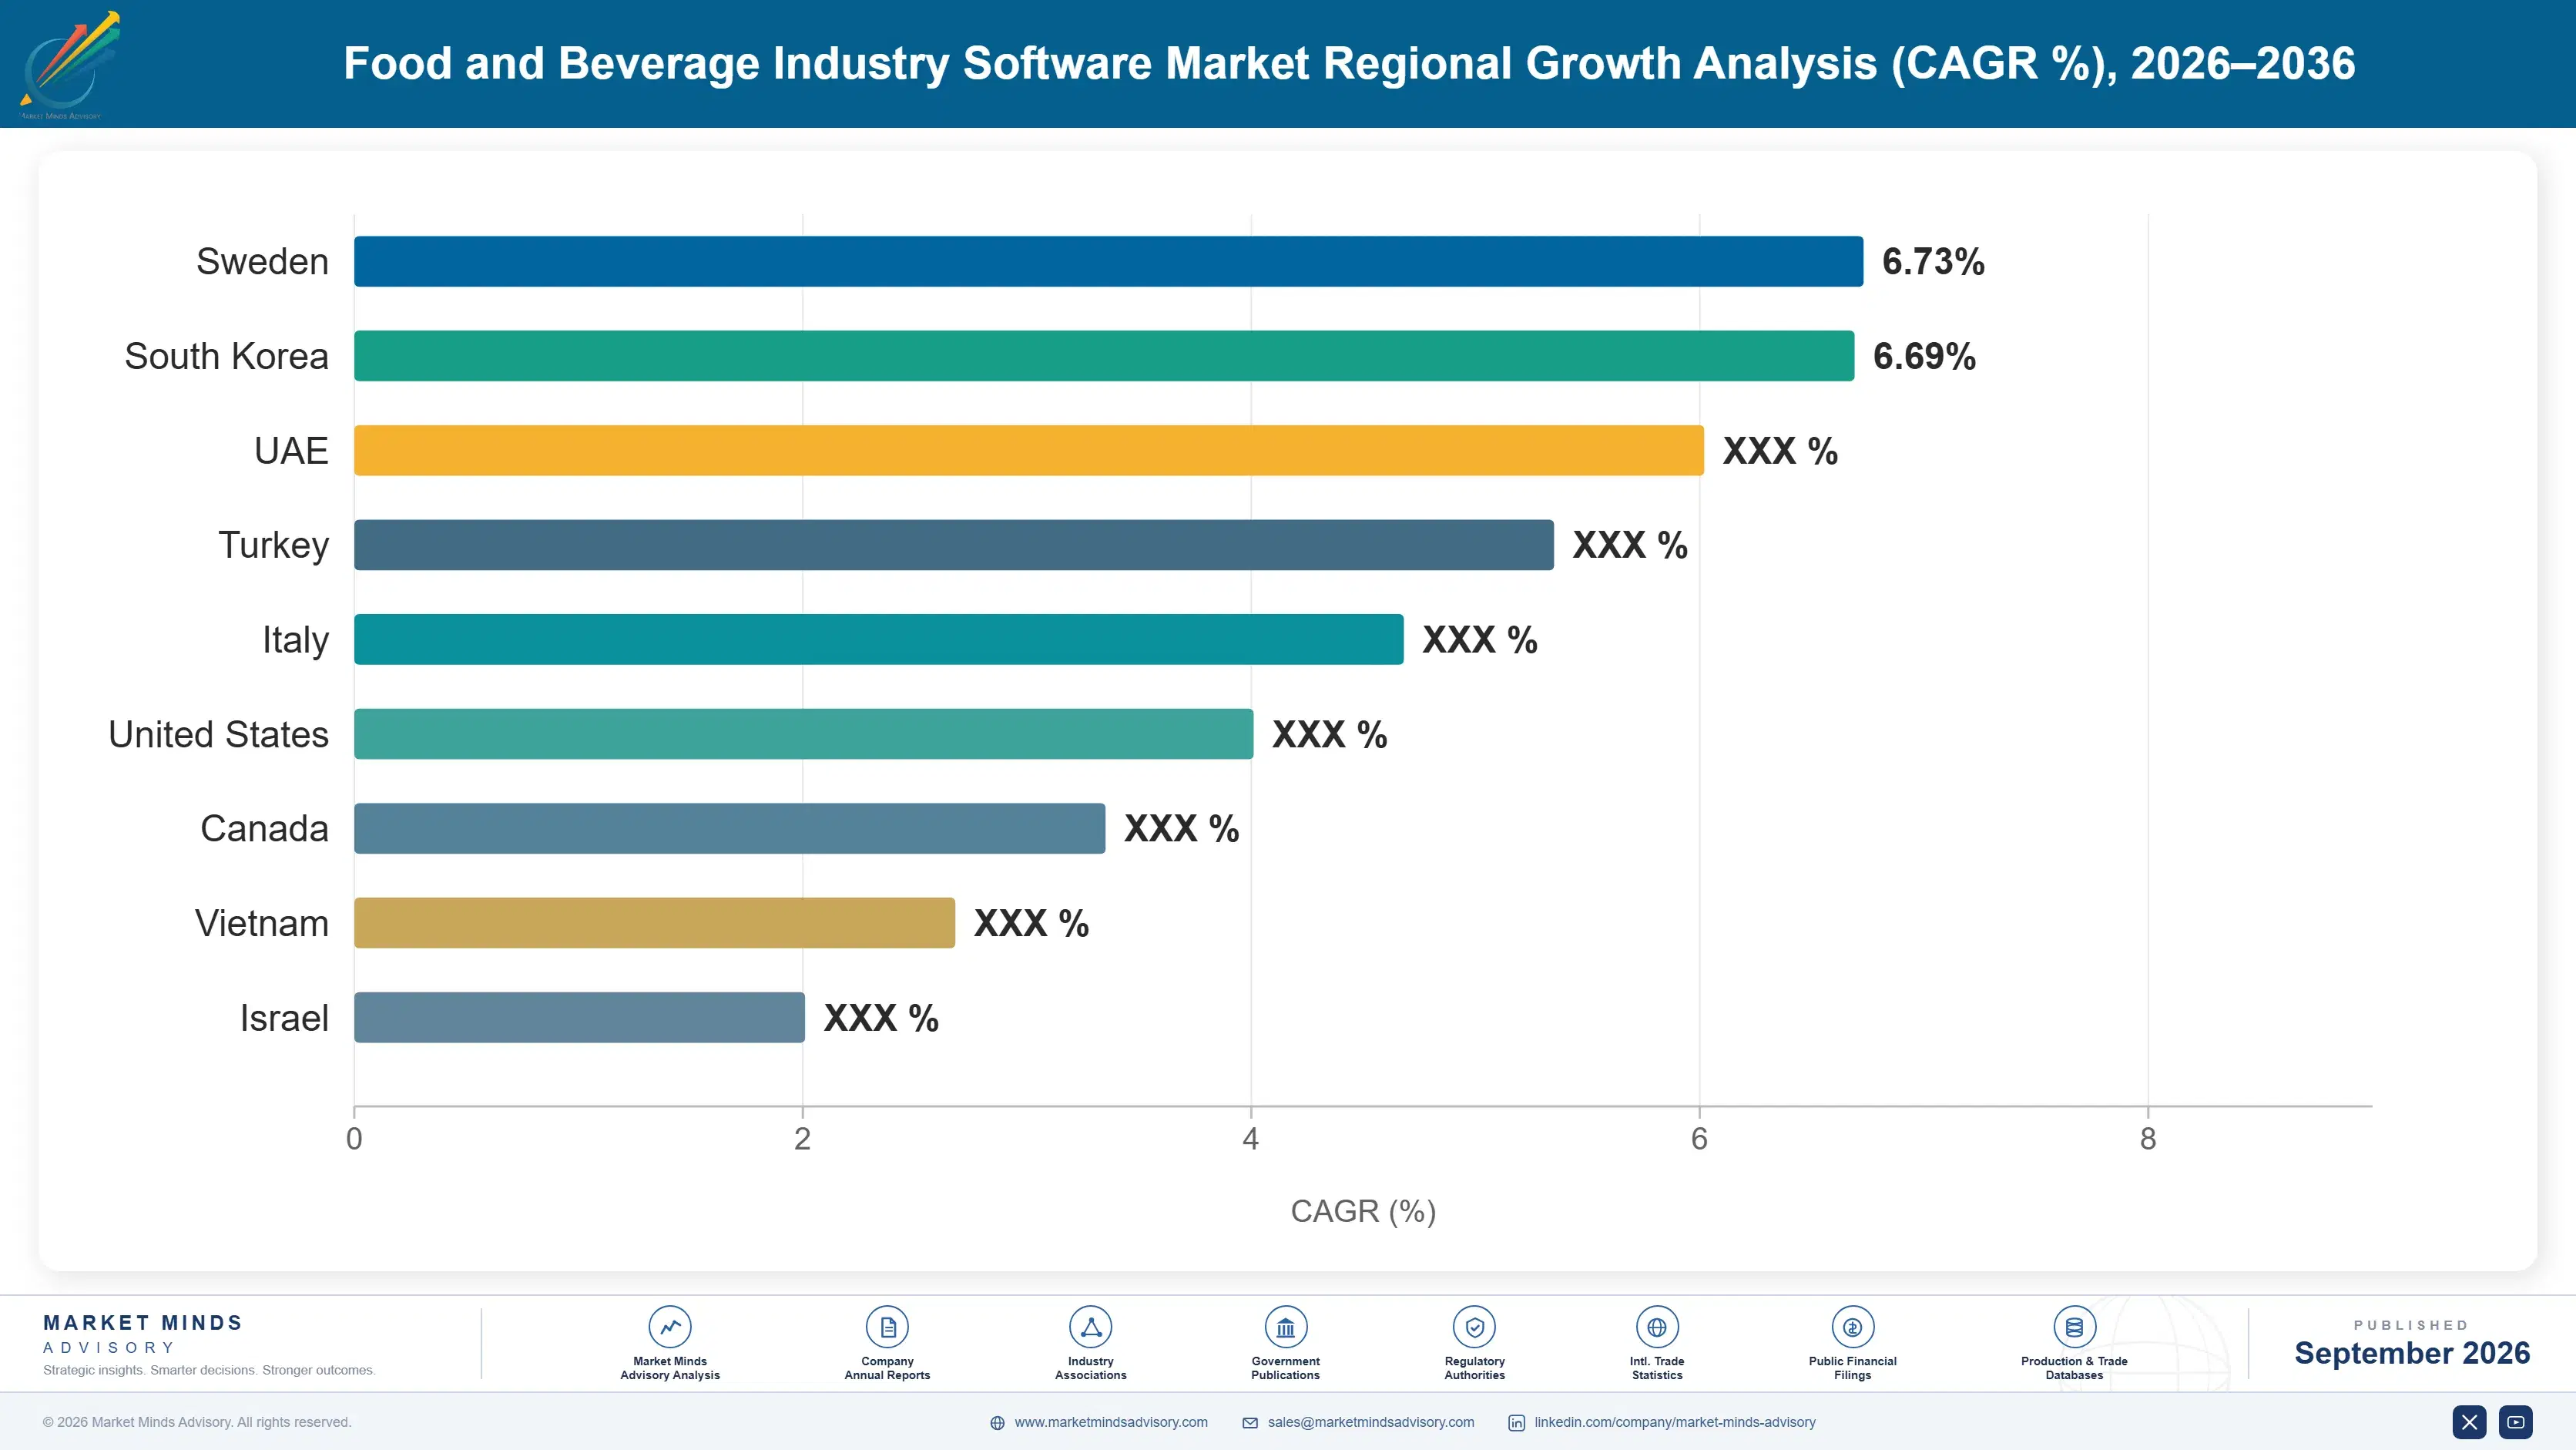
food-and-beverage-industry-software-market-country-cagr-analysis-1789985912425

Where Software Vendors Can Capture Incremental Margin

Food and beverage software economics reward vendors who move beyond per-seat licensing toward consumption-based and compliance-linked pricing. Four levers stand out for capturing incremental revenue over the forecast window: traceability bundling, consumption pricing, regulatory reporting automation, and geographic expansion through regional systems integrator partners across underserved markets where direct enterprise sales investment is not yet economically justified.

Bundle Traceability Capability Into Core ERP Platforms

Vendors bundling real-time lot-level traceability directly into their core ERP platform, rather than requiring manufacturers to run a separate compliance system, are capturing outsized share of new food safety infrastructure spending. This consolidation cuts integration complexity for manufacturers while raising average contract value roughly 28 percent versus standalone core licensing without traceability capability included. Vendors without a credible traceability roadmap are increasingly excluded from enterprise food safety shortlists entirely, since generic ERP platforms cannot handle the workload requirements these buyers now expect as a baseline capability at every renewal cycle now.
Market Impact: Raises average contract value by roughly 28 percent

Shift Pricing to Consumption-Based Billing Models

Vendors moving from flat per-seat licensing toward consumption-based billing tied to actual production volume are seeing materially higher account expansion rates at renewal, since this model removes the large upfront budget approval friction flat licensing faces during procurement cycles. Early adopters report roughly 24 percent higher net revenue retention among accounts moved onto consumption pricing versus those still on traditional flat licensing structures. The approach is spreading fastest among mid-sized manufacturers who previously found large upfront license commitments difficult to justify against uncertain future production volume, particularly at fast-growing manufacturers scaling capacity unpredictably.
Market Impact: Lifts net revenue retention by roughly 24 percent

Automate Regulatory Reporting Across Multiple Jurisdictions

Vendors building automated, jurisdiction-specific regulatory reporting capability that adapts to differing food safety requirements across export markets, rather than requiring manufacturers to configure compliance logic manually for each jurisdiction, are winning larger enterprise contracts and commanding meaningfully higher margins than generalist competitors serving the same multinational buyer segments. This automation creates ongoing revenue through recurring regulatory update subscriptions that persist well beyond the initial platform deployment. Vendors offering this bundle report contract values roughly 32 percent higher than manually configured bids submitted for comparable multi-jurisdiction programs across similar buyer segments tracked in this report.
Market Impact: Raises multi-jurisdiction contract value by roughly 32 percent

License Platform Technology To Regional Integration Partners

Rather than building direct enterprise sales infrastructure in every market, several vendors are licensing core platform technology to regional systems integrators and local consulting partners across South Asia, Latin America, and Eastern Europe, collecting royalty and support fees while local partners handle sales, implementation, and regulatory compliance. This model lets vendors capture revenue from markets where direct enterprise sales investment would not otherwise be justified given account size, while partners gain access to platform capability they could not replicate independently, generating royalty revenue equal to roughly 10 percent of partner contract value.
Market Impact: Adds about 10 percent margin at low cost

Who Controls the Margin Pool

Food and beverage software concentration sits at moderate levels, with the top five vendors holding an estimated 35 percent combined revenue share on a platform-license-plus-managed-service basis, the yardstick applied throughout this section. SAP holds a clear leadership position given deep enterprise resource planning relationships, while Infor, Aptean, TraceGains, and ParityFactory compete on food-specific configuration depth, traceability capability, and industry expertise the largest platform has been slower to prioritize.
Competitive activity currently centers on traceability capability expansion, consumption-based pricing transition, and multi-jurisdiction regulatory automation rather than price competition on core licensing fees alone. Vendors are racing to add automated recall documentation ahead of rivals, and several announced expanded cold chain integration capability within the past year to capture logistics-focused buyers before competitors establish default positions in that fast-emerging distribution channel across major regional markets.

Rankings are most likely to shift where challengers out-execute the market leader on traceability breadth and multi-jurisdiction compliance depth, since manufacturers increasingly favor vendors offering pre-built regulatory templates over generalist platforms retrofitted after the fact. Smaller specialist vendors focused narrowly on mid-sized manufacturer adoption are gaining share fastest among accounts prioritizing flexibility over deep enterprise support depth.
food-and-beverage-industry-software-market-company-positioning-matrix-1789985912953

Competitive Moat and Risk Dimensions

SAP

Moat: Deep Enterprise Resource Planning Base

Decades of enterprise resource planning relationships give SAP a default position most large food manufacturers running core financial and operations systems never seriously reconsider, since switching costs include re-integrating an entire operations stack rather than just a traceability layer, a barrier few pure-play challengers can overcome quickly.
SAP

Risk: Slower Food-Specific Configuration Depth

SAP built its strategy primarily around horizontal enterprise resource planning rather than food-specific configuration depth, leaving it somewhat exposed to specialist vendors with deeper food safety expertise moving faster to capture mid-market and greenfield compliance budgets before broader horizontal-focused suppliers catch up meaningfully across the category as a whole.
INFOR

Moat: Broad Food Industry Vertical Depth

Infor built a comprehensive food and beverage vertical software suite that established early leadership in industry-specific ERP configuration, and that early positioning gives its commercial enterprise tier an unusually efficient sales funnel, since procurement teams frequently formalize a platform peers already trust rather than evaluating alternatives from scratch during vendor selection.
INFOR

Risk: Slower Cloud-Native Product Transition

Infor built its vertical depth primarily around on-premises deployment models rather than cloud-native architecture, leaving it somewhat exposed to nimbler cloud-native specialists moving faster to capture mid-market and greenfield compliance budgets before broader legacy-focused suppliers catch up meaningfully across the category as a whole this cycle.

Players Tracked

Prominent Players

SAP
Infor
Aptean
TraceGains
ParityFactory

Other Key Players

Oracle NetSuite
Microsoft Dynamics 365
Deacom
Wherefour
Plex Systems
Cority
SafetyChain Software
Repositrax
iFoodDS
Icicle Technologies
Champs Software
Kezzler
FusionOps
Sage Intacct
BlueYonder

Recent Developments

MARCH 2026

SAP Acquires AI-Assisted Recall Documentation Startup

SAP completed the acquisition of a smaller AI-assisted recall documentation startup to strengthen its food safety software stack ahead of further manufacturer compliance adoption, adding roughly 50 engineers and an established technology platform to its existing enterprise resource planning business line across both cloud and on-premises product families.
Signal: Signals accelerating consolidation around embedded AI software as a core compliance differentiator right now across the broader compliance software category.
OCTOBER 2025

Aptean Signs Multi-Year Systems Integrator Partnership

Aptean announced a multi-year technology partnership with a major global systems integrator to become preferred traceability platform for enterprise food manufacturer engagements, expanding its footprint in a channel previously served only through smaller regional consulting partnerships across a smaller set of geographic markets than this new agreement now covers.
Signal: Confirms systems integrator distribution has become a primary growth channel for specialist vendors across the category today.
JANUARY 2026

TraceGains Launches Multi-Jurisdiction Compliance Module Suite

TraceGains launched a suite of multi-jurisdiction compliance modules for manufacturers exporting into differing regulatory markets, positioning itself directly against larger competitors focused mainly on generalist traceability capability for the largest domestic-focused enterprise accounts with dedicated compliance and legal teams already in-house across most product lines today.
Signal: Shows specialist vendors deliberately targeting underserved multi-jurisdiction export segments larger rivals have mostly overlooked until recently.

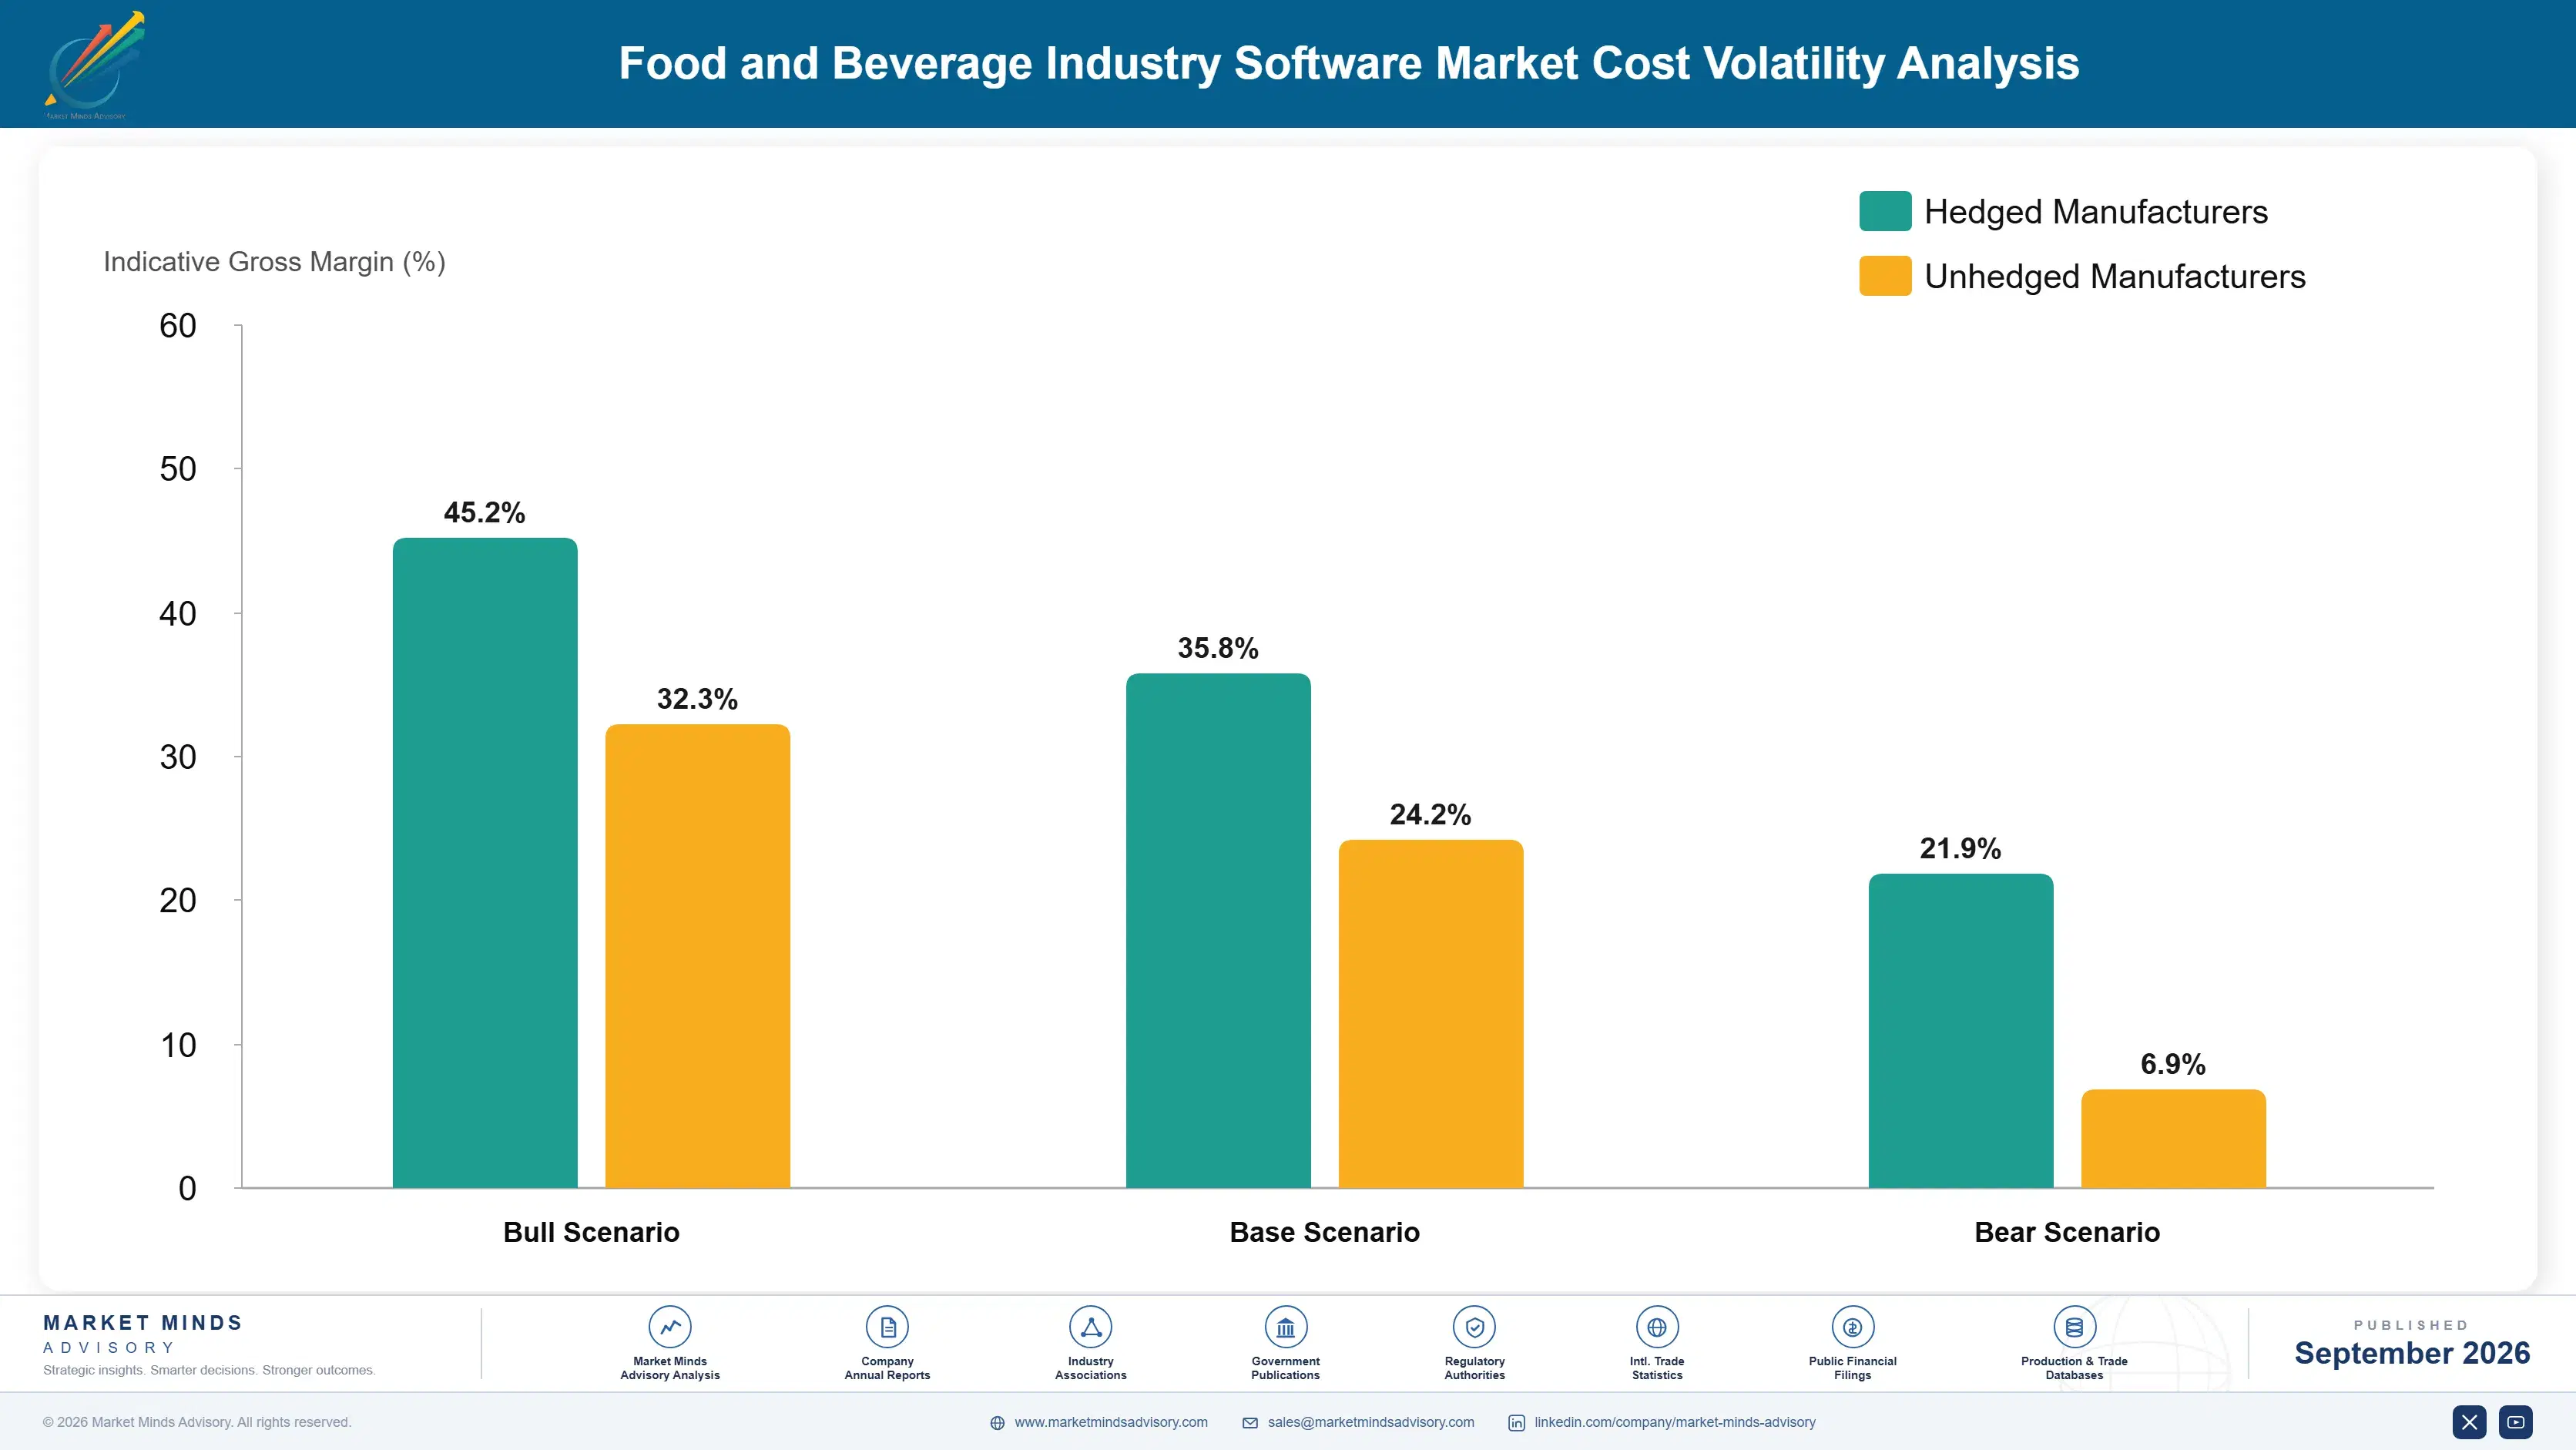
Cloud Infrastructure and Talent Cost Exposure

Cloud compute, storage, and specialized food-industry software engineering talent make up an estimated 35 to 45 percent of vendor cost of goods sold, since real-time traceability processing at manufacturer scale requires globally distributed infrastructure alongside deep regulatory expertise. Most vendors source cloud capacity from Amazon Web Services, Google Cloud, or Microsoft Azure rather than owning data centers outright, concentrating cost exposure in hyperscale suppliers.
Cloud compute pricing rose meaningfully across major hyperscale providers through 2024 and into 2025 as AI workload demand tightened data center capacity broadly, a dynamic documented in national statistical office data center reporting and corroborated by hyperscale provider capital expenditure disclosures. Software vendors running high-throughput compliance processing at scale felt this pressure directly, with several smaller vendors reporting compressed gross margins as they absorbed higher hosting bills rather than immediately repricing manufacturer contracts.

The disadvantage falls hardest on smaller vendors lacking negotiating leverage with hyperscale cloud providers, who pay meaningfully higher per-unit compute rates than scaled competitors able to commit to large multi-year capacity agreements. Vendors also face rising food regulatory engineering talent costs, since specialized compliance expertise remains scarce relative to demand, squeezing margins hardest at vendors without established engineering hubs in lower-cost talent markets.
food-and-beverage-industry-software-market-cost-volatility-analysis-1789985913152

Negotiate Multi-Year Committed Use Cloud Contracts

Vendors are locking in multi-year committed use discounts with hyperscale providers rather than paying on-demand rates, trading flexibility for meaningfully lower unit compute costs. This works best for vendors with predictable workload growth, letting them forecast capacity needs accurately enough to commit without overpaying for unused reserved capacity they cannot resell easily at a later date.

Establish Engineering Hubs in Lower-Cost Talent Markets

Vendors are opening dedicated compliance engineering hubs in lower-cost talent markets such as India and Eastern Europe, reducing per-engineer cost meaningfully while still accessing specialized regulatory expertise. This approach requires investment in remote collaboration infrastructure, but vendors report the cost savings outweigh the added coordination overhead for most engineering teams operating at meaningful scale.

Automate Regulatory Update Delivery Through Tooling

Vendors are deploying automated regulatory update tooling that reduces the engineering hours required to keep compliance rule engines current across multiple jurisdictions, cutting labor cost exposure directly per jurisdiction supported. This lowers total cost of ownership meaningfully while preserving compliance quality, a rare case where cost reduction and product breadth improve together rather than trading off.

Portfolio Architecture for Margin Defence

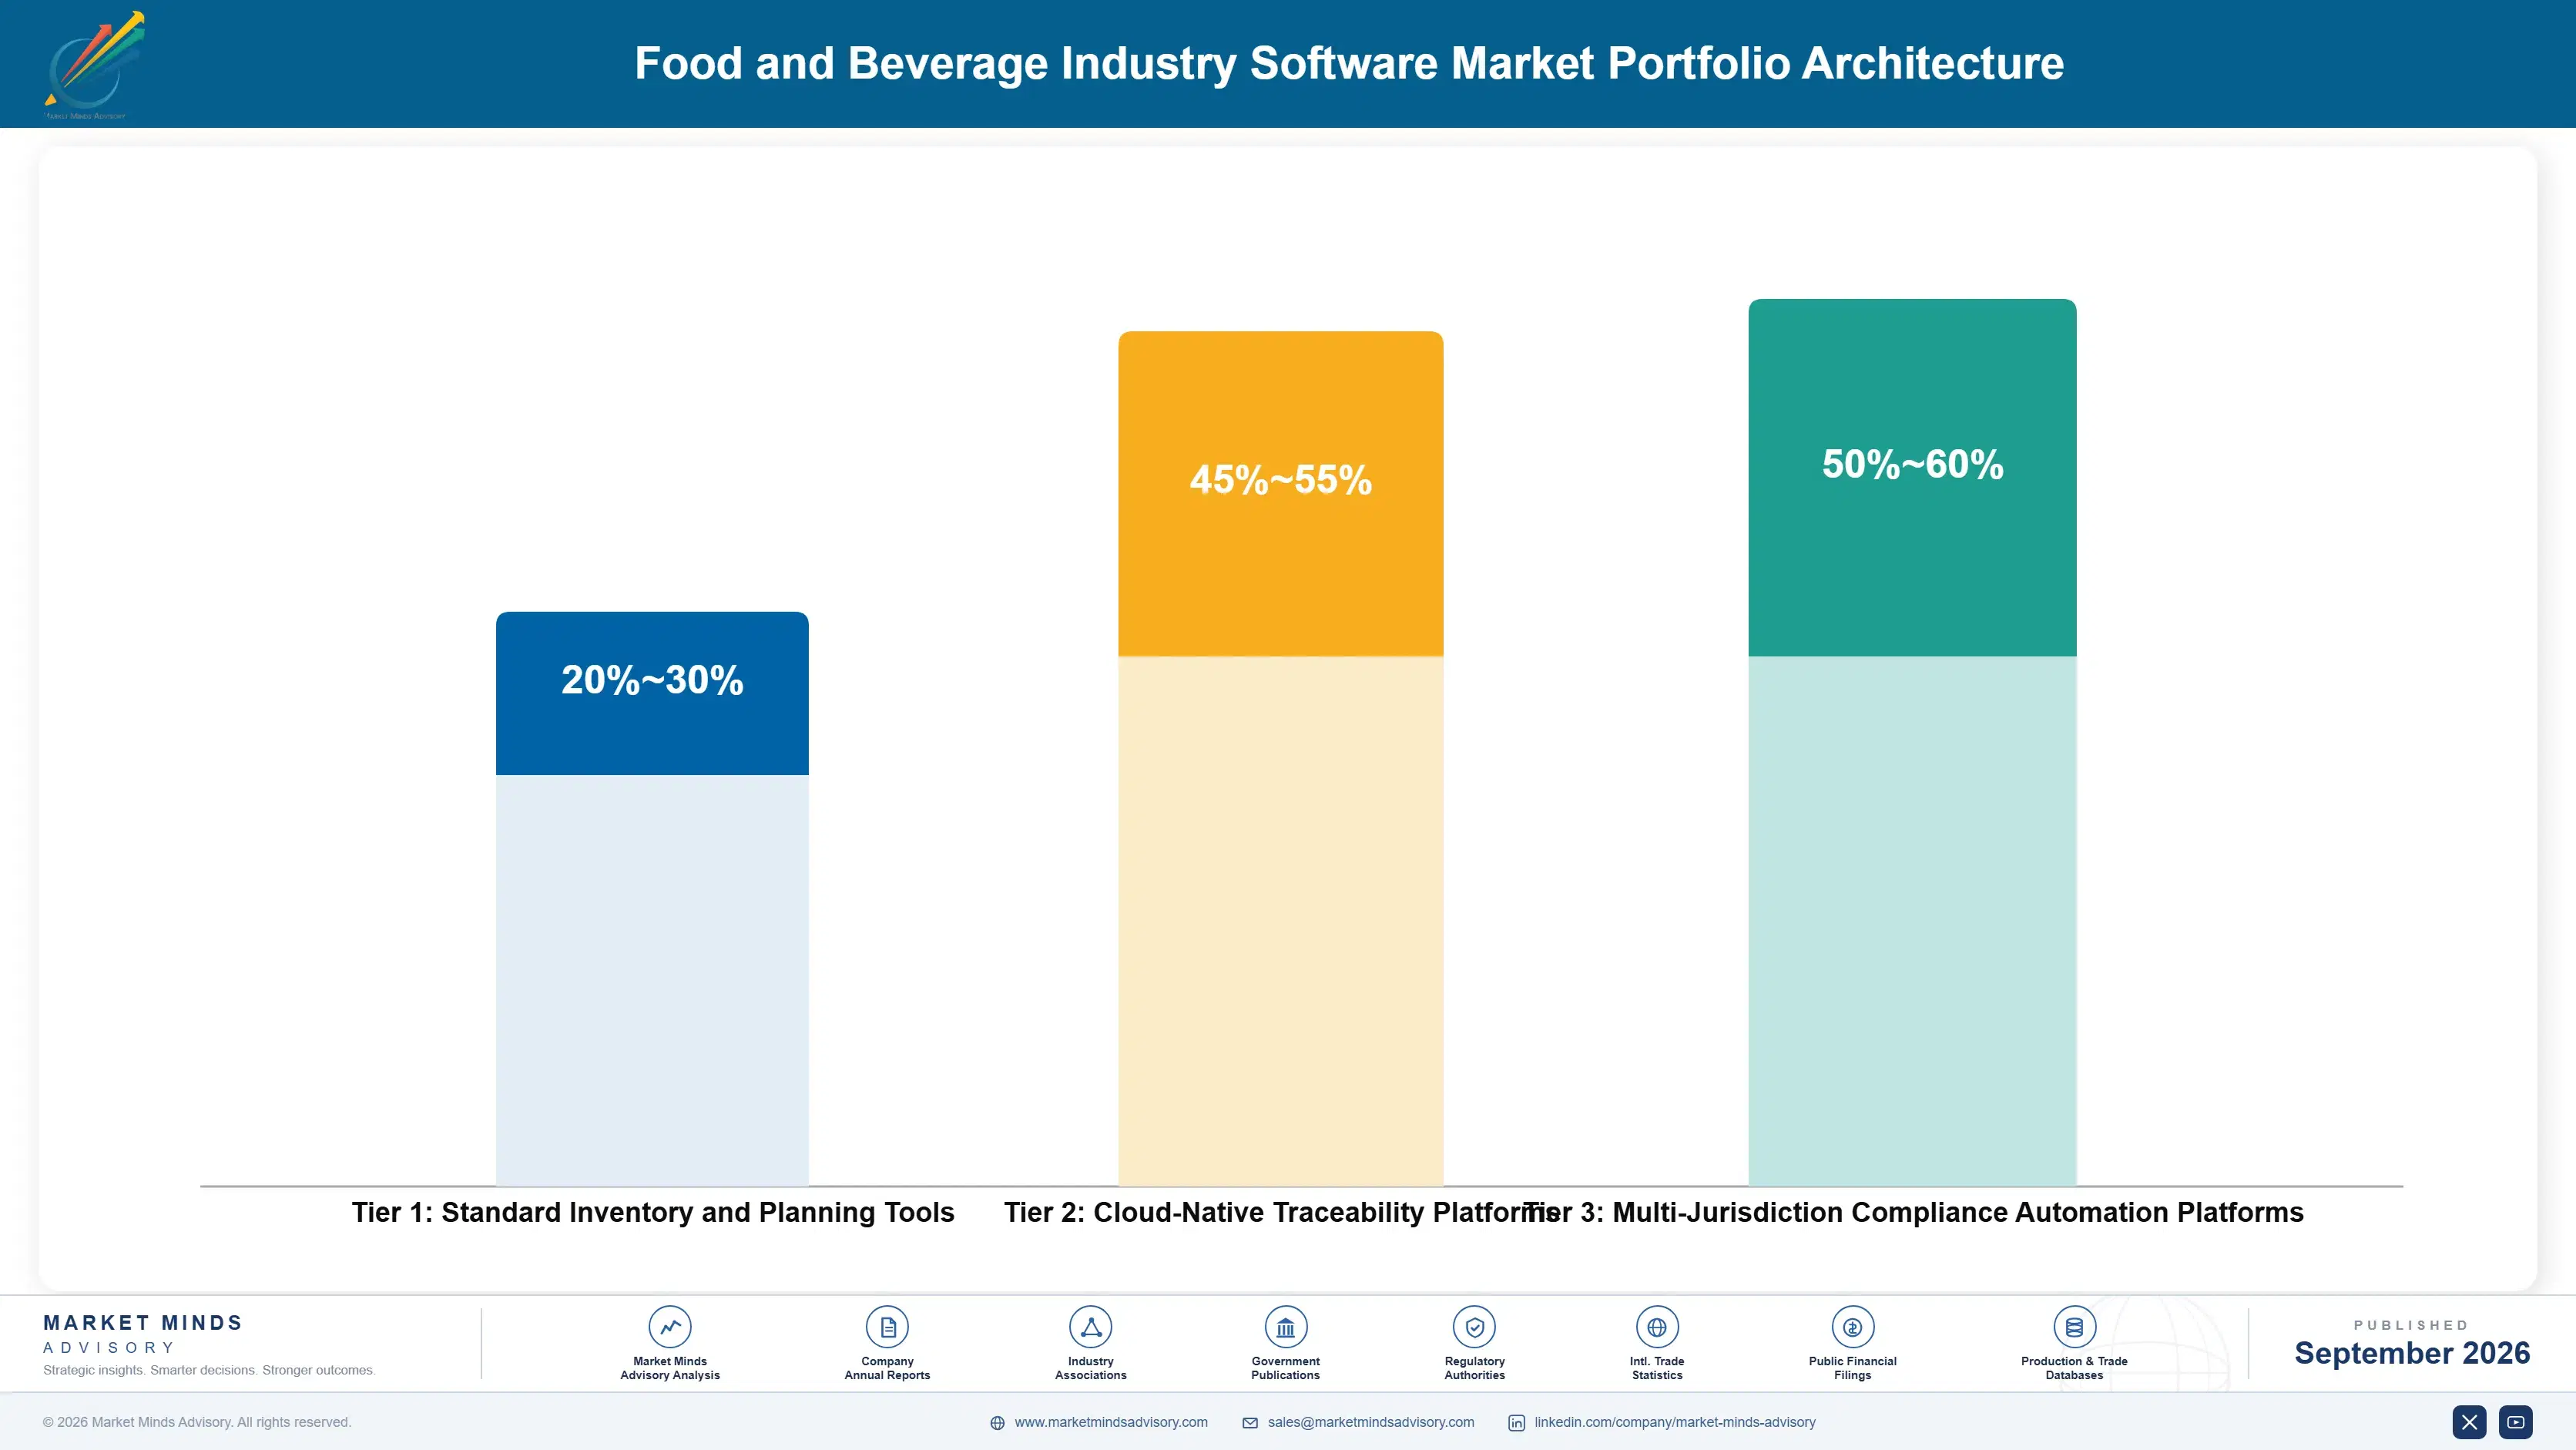
Food and beverage software margin economics split sharply by tier. Basic inventory and production planning tools compete largely on price against generic horizontal ERP alternatives, compressing gross margin toward the lower end of enterprise software norms, while traceability and multi-jurisdiction compliance platforms command materially higher margins reflecting specialized regulatory investment competitors cannot easily replicate without years of dedicated development effort behind them.
The volume versus premium tension shows up clearest in how vendors allocate engineering resources: teams chasing traceability capability and regulatory automation pull investment away from basic planning tooling, gradually letting commodity software margins compress further as vendors deprioritize that layer of the business relative to higher-margin specialty platforms capturing most new contract growth and driving the bulk of new bookings this cycle.

High-value margin pools concentrate overwhelmingly in real-time traceability and multi-jurisdiction regulatory automation, where technical differentiation remains real and defensible for now against both generic ERP competition and horizontal platform bundling pressure. Vendors positioned only in commodity planning tools face the steepest long-term margin pressure as buyers increasingly expect these baseline capabilities included in platform pricing rather than paid for separately going forward.

Standard Inventory and Planning Tools

Core inventory and production planning software competing largely on price against generic horizontal ERP alternatives, with thin margins and limited differentiation beyond reliability, uptime, and basic support quality across most manufacturing applications.
Gross Margin: 20-30%

Cloud-Native Traceability Platforms

Real-time lot-level traceability platforms bundling automated recall documentation, commanding premium pricing given specialized regulatory investment competitors cannot easily replicate at comparable quality within a short qualification and development timeline for most competitors.
Gross Margin: 45-55%

Multi-Jurisdiction Compliance Automation Platforms

Automated, jurisdiction-specific regulatory reporting platforms, the highest-margin layer given compliance approval barriers and its growing role as a substitute for costly manual configuration work across most large multi-jurisdiction enterprise deployments tracked in this report.
Gross Margin: 50-60%
food-and-beverage-industry-software-market-portfolio-architecture-1789985913650

High-value Sub-segments and Strategic Watch-out

Real-Time Traceability Platforms

The clearest high-value, high-growth pool in the category, combining premium pricing with the fastest unit growth as manufacturers treat real-time lot-level traceability as a baseline requirement for compliance investment across nearly every regulated food category now and through the remainder of the forecast window as adoption broadens.
Gross Margin: 50-60%

Multi-Jurisdiction Compliance Automation

A high-value pool growing at a more moderate pace than traceability, anchored by durable multi-year contracts with manufacturers exporting across multiple regulatory jurisdictions requiring automated compliance as a baseline requirement across most major regulatory jurisdictions tracked in this report, giving vendors more predictable revenue than discretionary spending provides.
Gross Margin: 45-55%

Standard Production Planning Software

The volume core of the market, generating dependable recurring revenue at thinner margins, serving as the baseline offering most vendors bundle premium compliance modules on top of rather than compete on directly against rival vendors in most procurement processes today across nearly every geography this report tracks in detail.
Gross Margin: 25-35%

Legacy Manual Reporting Systems

A strategic watch-out segment facing steady margin erosion as automated traceability and cloud-native platforms commoditize basic manual reporting capability further, pressuring vendors still dependent on this layer for meaningful revenue heading into the back half of the forecast window as buyers increasingly favor automated alternatives.
Gross Margin: 15-25%

The Anatomy of Recurring Compliance Revenue

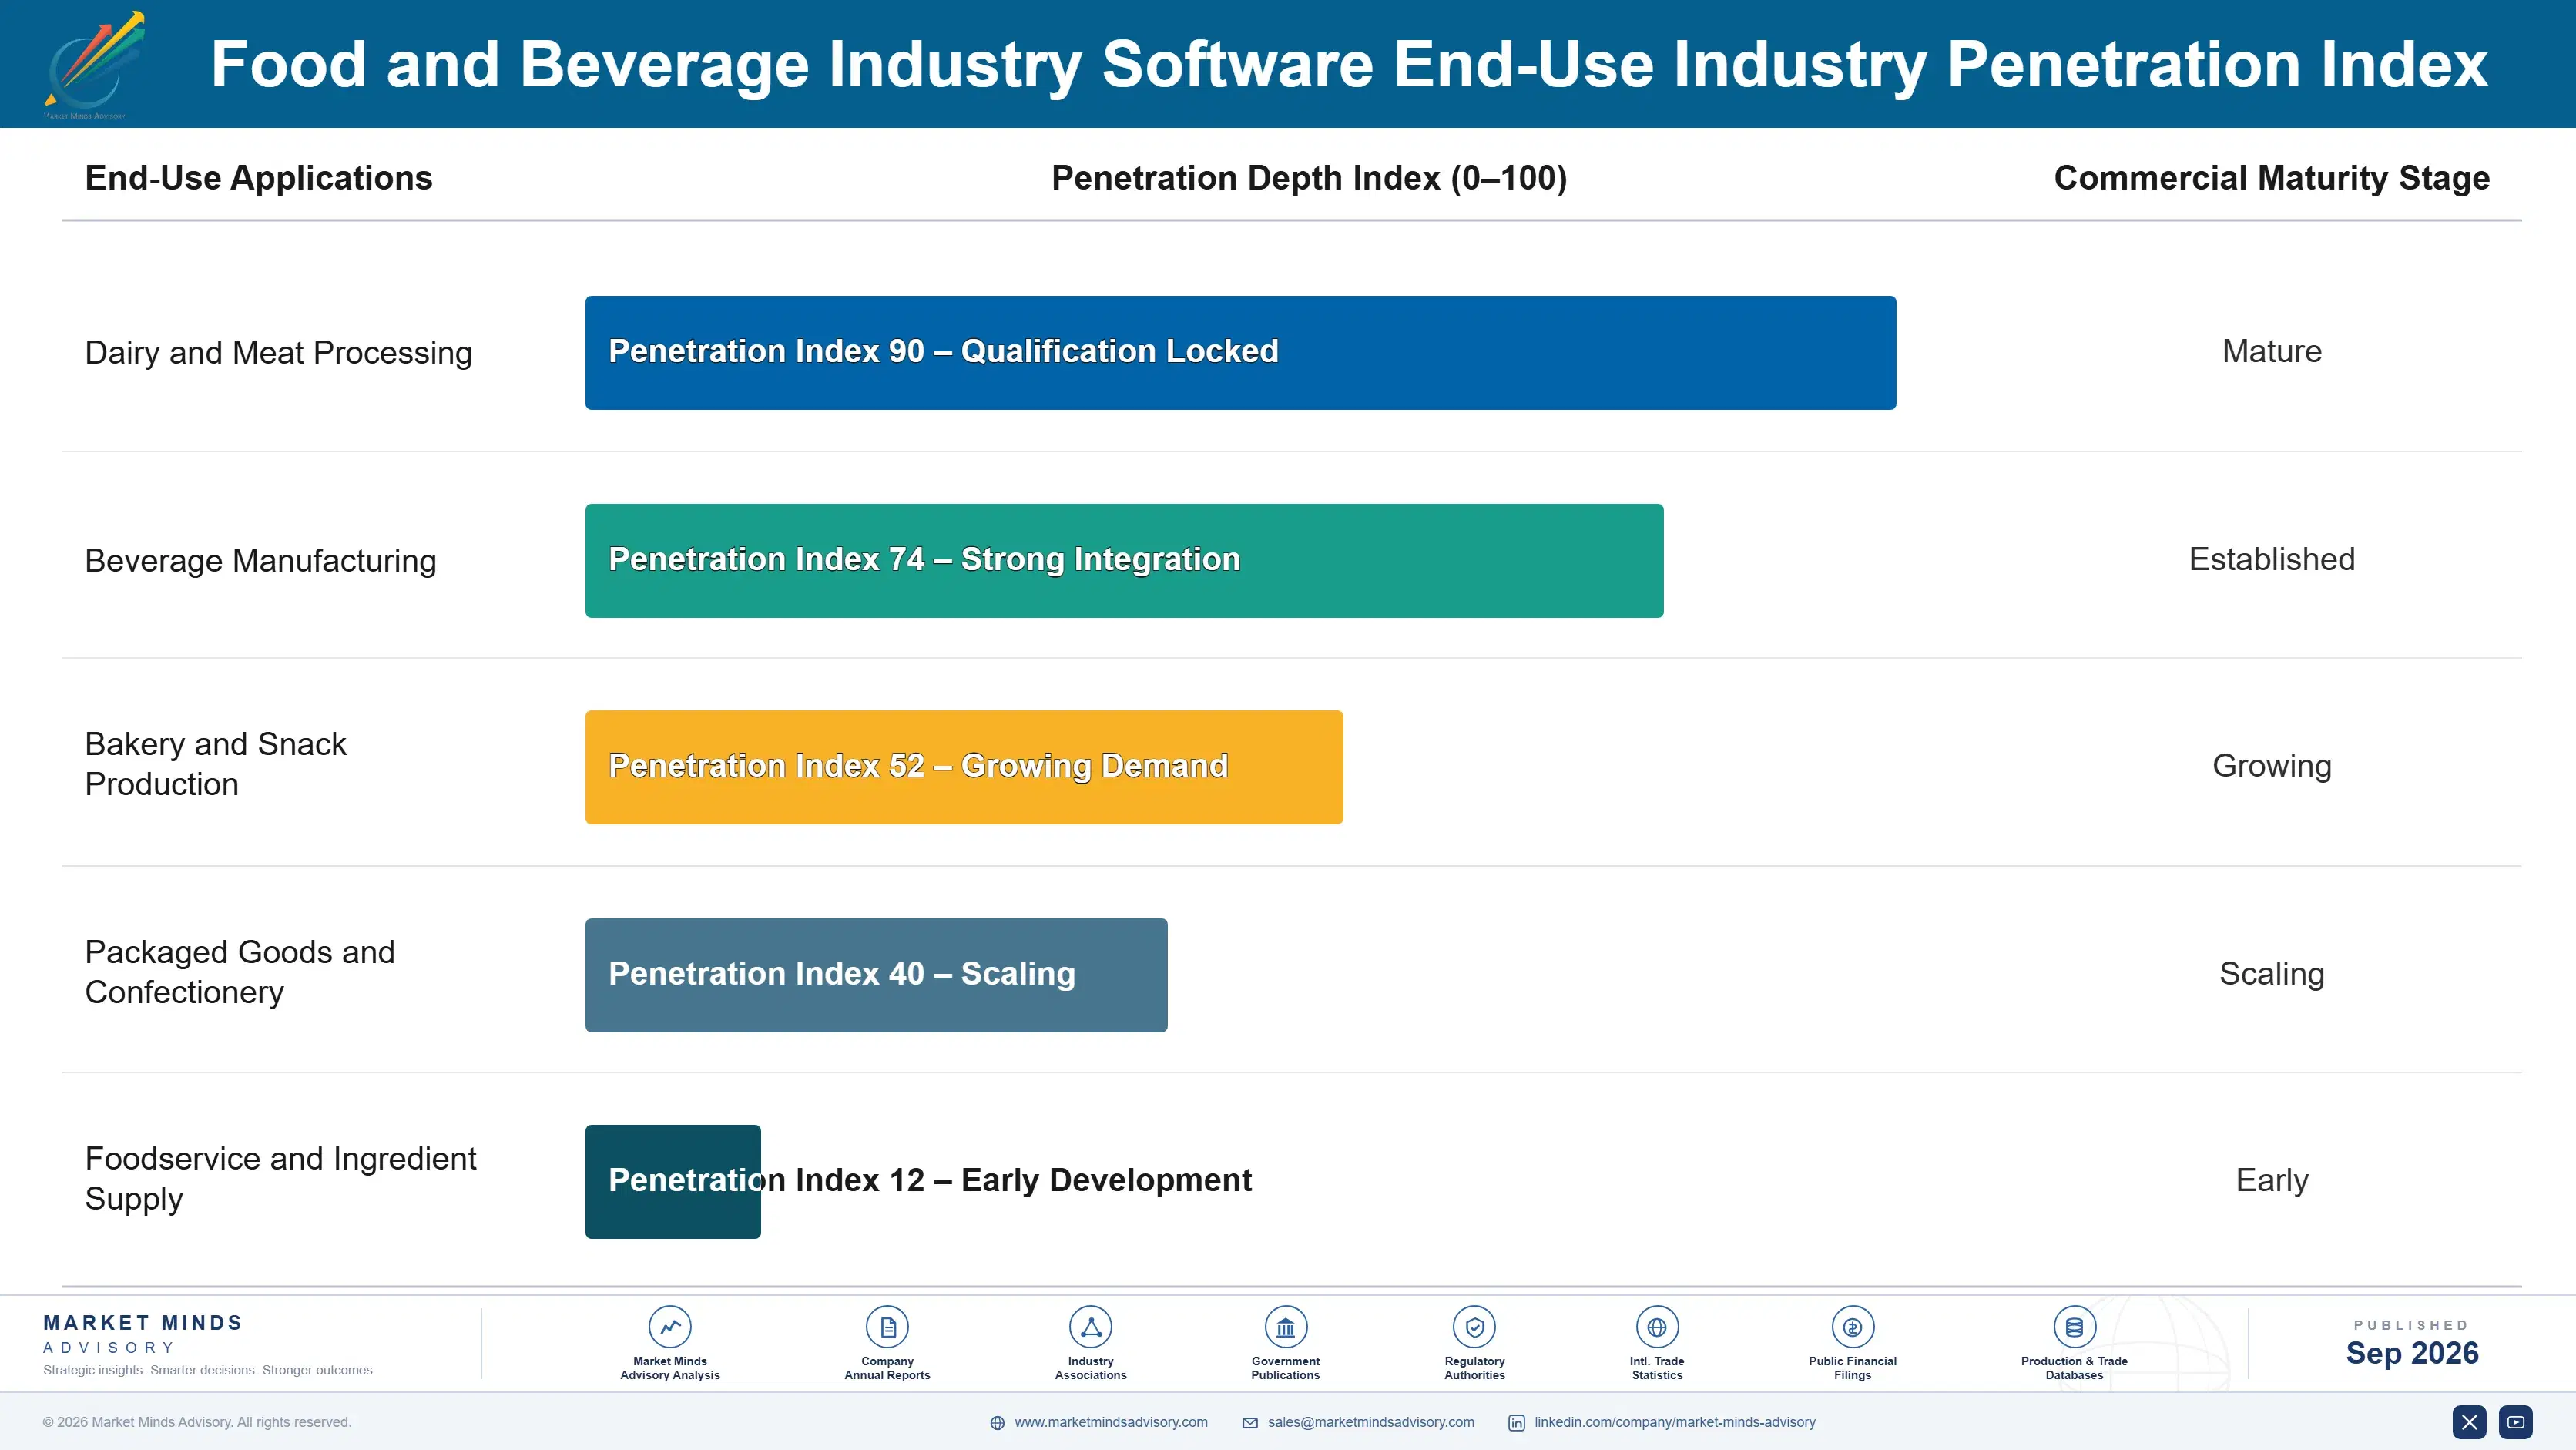
Food and beverage software runs heavily on annuity economics once embedded into core compliance infrastructure. Manufacturer contracts typically span three to five years with automatic renewal clauses, and switching costs, including re-mapping supplier data and retraining quality staff, keep churn low once a platform underpins production recall management operations.
Adoption stickiness varies meaningfully by end-use vertical. Dairy and meat processors embed software platforms deeply into regulated recall and traceability workflows, producing the lowest churn of any buyer segment tracked. Beverage and packaged goods manufacturers, newer to real-time traceability use cases, show somewhat higher switching willingness as they are still evaluating vendors against evolving supplier data requirements, while smaller producers churn fastest, driven mainly by cost sensitivity and simpler integration needs than enterprise accounts.

Buyer profiles are shifting generationally as compliance and quality assurance technologists, rather than traditional IT integration specialists, increasingly drive net new software demand. These buyers evaluate platforms on regulatory reporting automation and traceability depth rather than legacy inventory throughput metrics, pushing vendors to hire regulatory and food safety talent alongside traditional software engineering staff to serve this fast-expanding buyer base effectively and at scale.
food-and-beverage-industry-software-market-end-use-penetration-index-1789985914147

Where Software Vendors Should Focus Next

These are among the four positions where our research anticipates prominent divergence between winners and laggards over the coming forecast period. Each is grounded in the demand model, the regulatory perimeter, and the announced capacity pipeline.
01 / TRACEABILITY INVESTMENT PRIORITY

Build Real-Time Traceability Ahead of Regulatory Deadlines

Real-time lot-level traceability has moved from optional feature to baseline compliance requirement within roughly two years, and that shift is happening faster than most product roadmaps currently anticipate. Vendors without a credible traceability integration plan are increasingly losing shortlist position among manufacturers evaluating new compliance software purchases this cycle. Prioritizing traceability over incremental core planning improvements captures the fastest-growing segment of the category before rivals establish default positions with major manufacturer accounts across dairy, meat, and packaged goods segments alike.
02 / CONSUMPTION PRICING TRANSITION

Shift Toward Consumption Pricing Before Competitors Force It

Manufacturers increasingly resist large upfront license commitments in favor of consumption-based billing tied to actual production volume, and vendors slow to offer this model are losing deals to more flexible competitors during procurement. Early adopters of consumption pricing report materially higher net revenue retention at renewal than vendors still relying exclusively on flat per-seat licensing structures. Moving now, before consumption pricing becomes the unavoidable industry default, preserves negotiating leverage that will otherwise erode steadily as more competitors adopt the model.
03 / MULTI-JURISDICTION AUTOMATION BUILDOUT

Automate Multi-Jurisdiction Compliance For Global Exporters

Manufacturers exporting into multiple regulatory jurisdictions increasingly favor vendors offering native automated compliance capability over generalist platforms requiring manufacturers to configure regulatory logic manually for each market. Vendors without this capability are losing enterprise contracts to competitors who can offer a single integrated platform covering traceability, compliance, and reporting without additional vendor complexity. Building this capability now, before regulated compliance becomes the unavoidable industry default across every export market, preserves pricing power that will otherwise erode steadily as more generalist competitors add comparable automation features.
04 / REGIONAL GROWTH ALLOCATION

Prioritize South Asia and East Asia Over Mature Markets

South Asia and Pacific and East Asia post the fastest regional growth in this report, driven by expanding food manufacturing capacity and rapidly maturing export documentation infrastructure investment across the region. Vendors over-indexed on North American and Western European sales investment risk missing the fastest-growing accounts of the entire forecast window, particularly among Indian food manufacturers building compliance infrastructure from a near-zero starting base. Building regional partnerships or local sales presence now positions vendors ahead of slower-moving competitors still focused primarily on mature markets.

Engagement Snapshot From the Field

A live engagement with an industry participant carrying material or product regulatory and market exposure ahead of a defining policy shift, showing how our research translates into a defensible multi-year portfolio strategy.
MARKET MINDS ADVISORY · CLIENT ENGAGEMENT SUMMARY
Food and Beverage Industry Software Producer Strategic Portfolio Review and Transition Roadmap 2026·Investment Scenario on Food and Beverage Industry Software Exposure Evaluation 2025-26
CLIENT PROFILE
The client operates a mid-sized regional dairy processing company across the midwestern United States, generating revenue in the low hundreds of millions annually and managing several dozen supplier and distribution partner relationships through legacy spreadsheet-based traceability processes (client-reported, unverified by MMA). The organization was evaluating whether to modernize its manual recall system or migrate entirely to an automated traceability platform.
STRATEGIC CHALLENGE
Manual spreadsheet-based traceability left the client unable to identify affected product lots quickly during recall drills, while competitors running modern traceability platforms were completing simulated recalls in a fraction of the time, exposing the client to meaningful regulatory and reputational risk that leadership could no longer accept without addressing it directly.
MMA APPROACH
MMA conducted a structured vendor evaluation across four candidate traceability platforms, benchmarking each against the client existing supplier connection volume, migration complexity, and total cost of ownership over a five-year horizon. The engagement included primary interviews with the client quality and operations teams to surface compliance requirements the evaluation needed to weigh appropriately.
KEY FINDINGS
  1. Manual spreadsheet-based traceability delayed recall identification by a meaningful margin compared to automated alternatives in side-by-side recall drill testing across comparable supplier networks.
  2. Migration to automated traceability was projected to cut recall response time meaningfully within the first two quarters following deployment, based on comparable processor benchmarks reviewed during the engagement.
  3. Migration cost and operational disruption risk were concentrated almost entirely in the first ninety days, after which integration complexity dropped sharply according to vendor reference calls.
  4. None of the four evaluated platforms offered meaningfully differentiated pricing once traceability depth was factored into total cost of ownership across the full five-year contract horizon.
CLIENT PROFILE
The client operates a mid-sized regional dairy processing company across the midwestern United States, generating revenue in the low hundreds of millions annually and managing several dozen supplier and distribution partner relationships through legacy spreadsheet-based traceability processes (client-reported, unverified by MMA). The organization was evaluating whether to modernize its manual recall system or migrate entirely to an automated traceability platform.
STRATEGIC CHALLENGE
Manual spreadsheet-based traceability left the client unable to identify affected product lots quickly during recall drills, while competitors running modern traceability platforms were completing simulated recalls in a fraction of the time, exposing the client to meaningful regulatory and reputational risk that leadership could no longer accept without addressing it directly.
MMA APPROACH
MMA conducted a structured vendor evaluation across four candidate traceability platforms, benchmarking each against the client existing supplier connection volume, migration complexity, and total cost of ownership over a five-year horizon. The engagement included primary interviews with the client quality and operations teams to surface compliance requirements the evaluation needed to weigh appropriately.
KEY FINDINGS
  1. Manual spreadsheet-based traceability delayed recall identification by a meaningful margin compared to automated alternatives in side-by-side recall drill testing across comparable supplier networks.
  2. Migration to automated traceability was projected to cut recall response time meaningfully within the first two quarters following deployment, based on comparable processor benchmarks reviewed during the engagement.
  3. Migration cost and operational disruption risk were concentrated almost entirely in the first ninety days, after which integration complexity dropped sharply according to vendor reference calls.
  4. None of the four evaluated platforms offered meaningfully differentiated pricing once traceability depth was factored into total cost of ownership across the full five-year contract horizon.
RECOMMENDED STRATEGY
Phase 1: Phase one: run a parallel pilot on a subset of supplier connections to validate traceability accuracy before full platform migration. Phase 2: Phase two: migrate remaining supplier connections in stages by category, prioritizing highest-risk product lines first to capture compliance gains as quickly as possible. Phase 3: Phase three: retire the legacy manual system entirely once full migration completes and renegotiate supplier onboarding workflows under the new platform.
OUTCOME
The client selected an automated traceability platform and completed migration within the recommended phased timeline, reporting improved recall drill performance within the first two quarters post-migration (client-reported, unverified by MMA). Quality headcount previously dedicated to manual traceability was reallocated to supplier audit and quality assurance work.

Frequently Asked Questions

Foundational context covering the market sizes, CAGR, scope, country, region and competition that inform every finding below. This section is provided to cover basics and most often pre-purchase conversations, answered from the MMA Primary Research Dataset.

What is the current size of the Food and Beverage Industry Software Market?

The global food and beverage industry software market reached an estimated 4.2 billion dollars in 2025. This figure spans traceability, quality management, and production planning platforms across manufacturers of all sizes.

How large will the Food and Beverage Industry Software Market be by 2036?

The market is projected to reach approximately 12.0 billion dollars by 2036. This reflects sustained demand from regulatory enforcement, recall automation, and multi-jurisdiction compliance standardization worldwide.

What is the CAGR for the Food and Beverage Industry Software Market 2026 to 2036?

The market is projected to grow at a 10.0 percent compound annual growth rate through the forecast period. Bull and bear scenarios range from roughly 8.7 to 11.3 percent depending on regulatory pace.

Which segment is growing fastest?

Food safety and traceability compliance software is the fastest-growing segment, expanding at roughly 14 percent annually. That is close to 1.4 times the overall market growth rate through 2036.

Who are the major companies in the Food and Beverage Industry Software Market?

SAP, Infor, Aptean, TraceGains, and ParityFactory lead the market. These five vendors hold an estimated 35 percent combined revenue share on a consistent platform-license basis.

Which country is growing fastest?

India is the fastest-growing country market, expanding at roughly 12.2 percent annually. Growth is driven by a rapidly expanding food processing sector adopting cloud-native compliance platforms directly.

Report Segmentation Architecture

The full report scope spans multiple orthogonal segmentation dimensions, with cross-tabulated demand data provided for each dimension pair. Coverage extends further to regional breakdowns, trend trajectories, and the competitive detail needed to support segment-level decision-making.

By Primary Market Dimension

  • Food Safety and Traceability Compliance Software
  • Quality Management and Batch Recall Software
  • Recipe and Formulation Management Software
  • Supply Chain and Demand Planning Software
  • Warehouse and Cold Chain Logistics Management Software
  • Enterprise Resource Planning for Food and Beverage Manufacturers

By End-Use Industry

  • Dairy and Meat Processing
  • Beverage Manufacturing
  • Bakery and Snack Production
  • Packaged Goods and Confectionery
  • Foodservice and Ingredient Supply

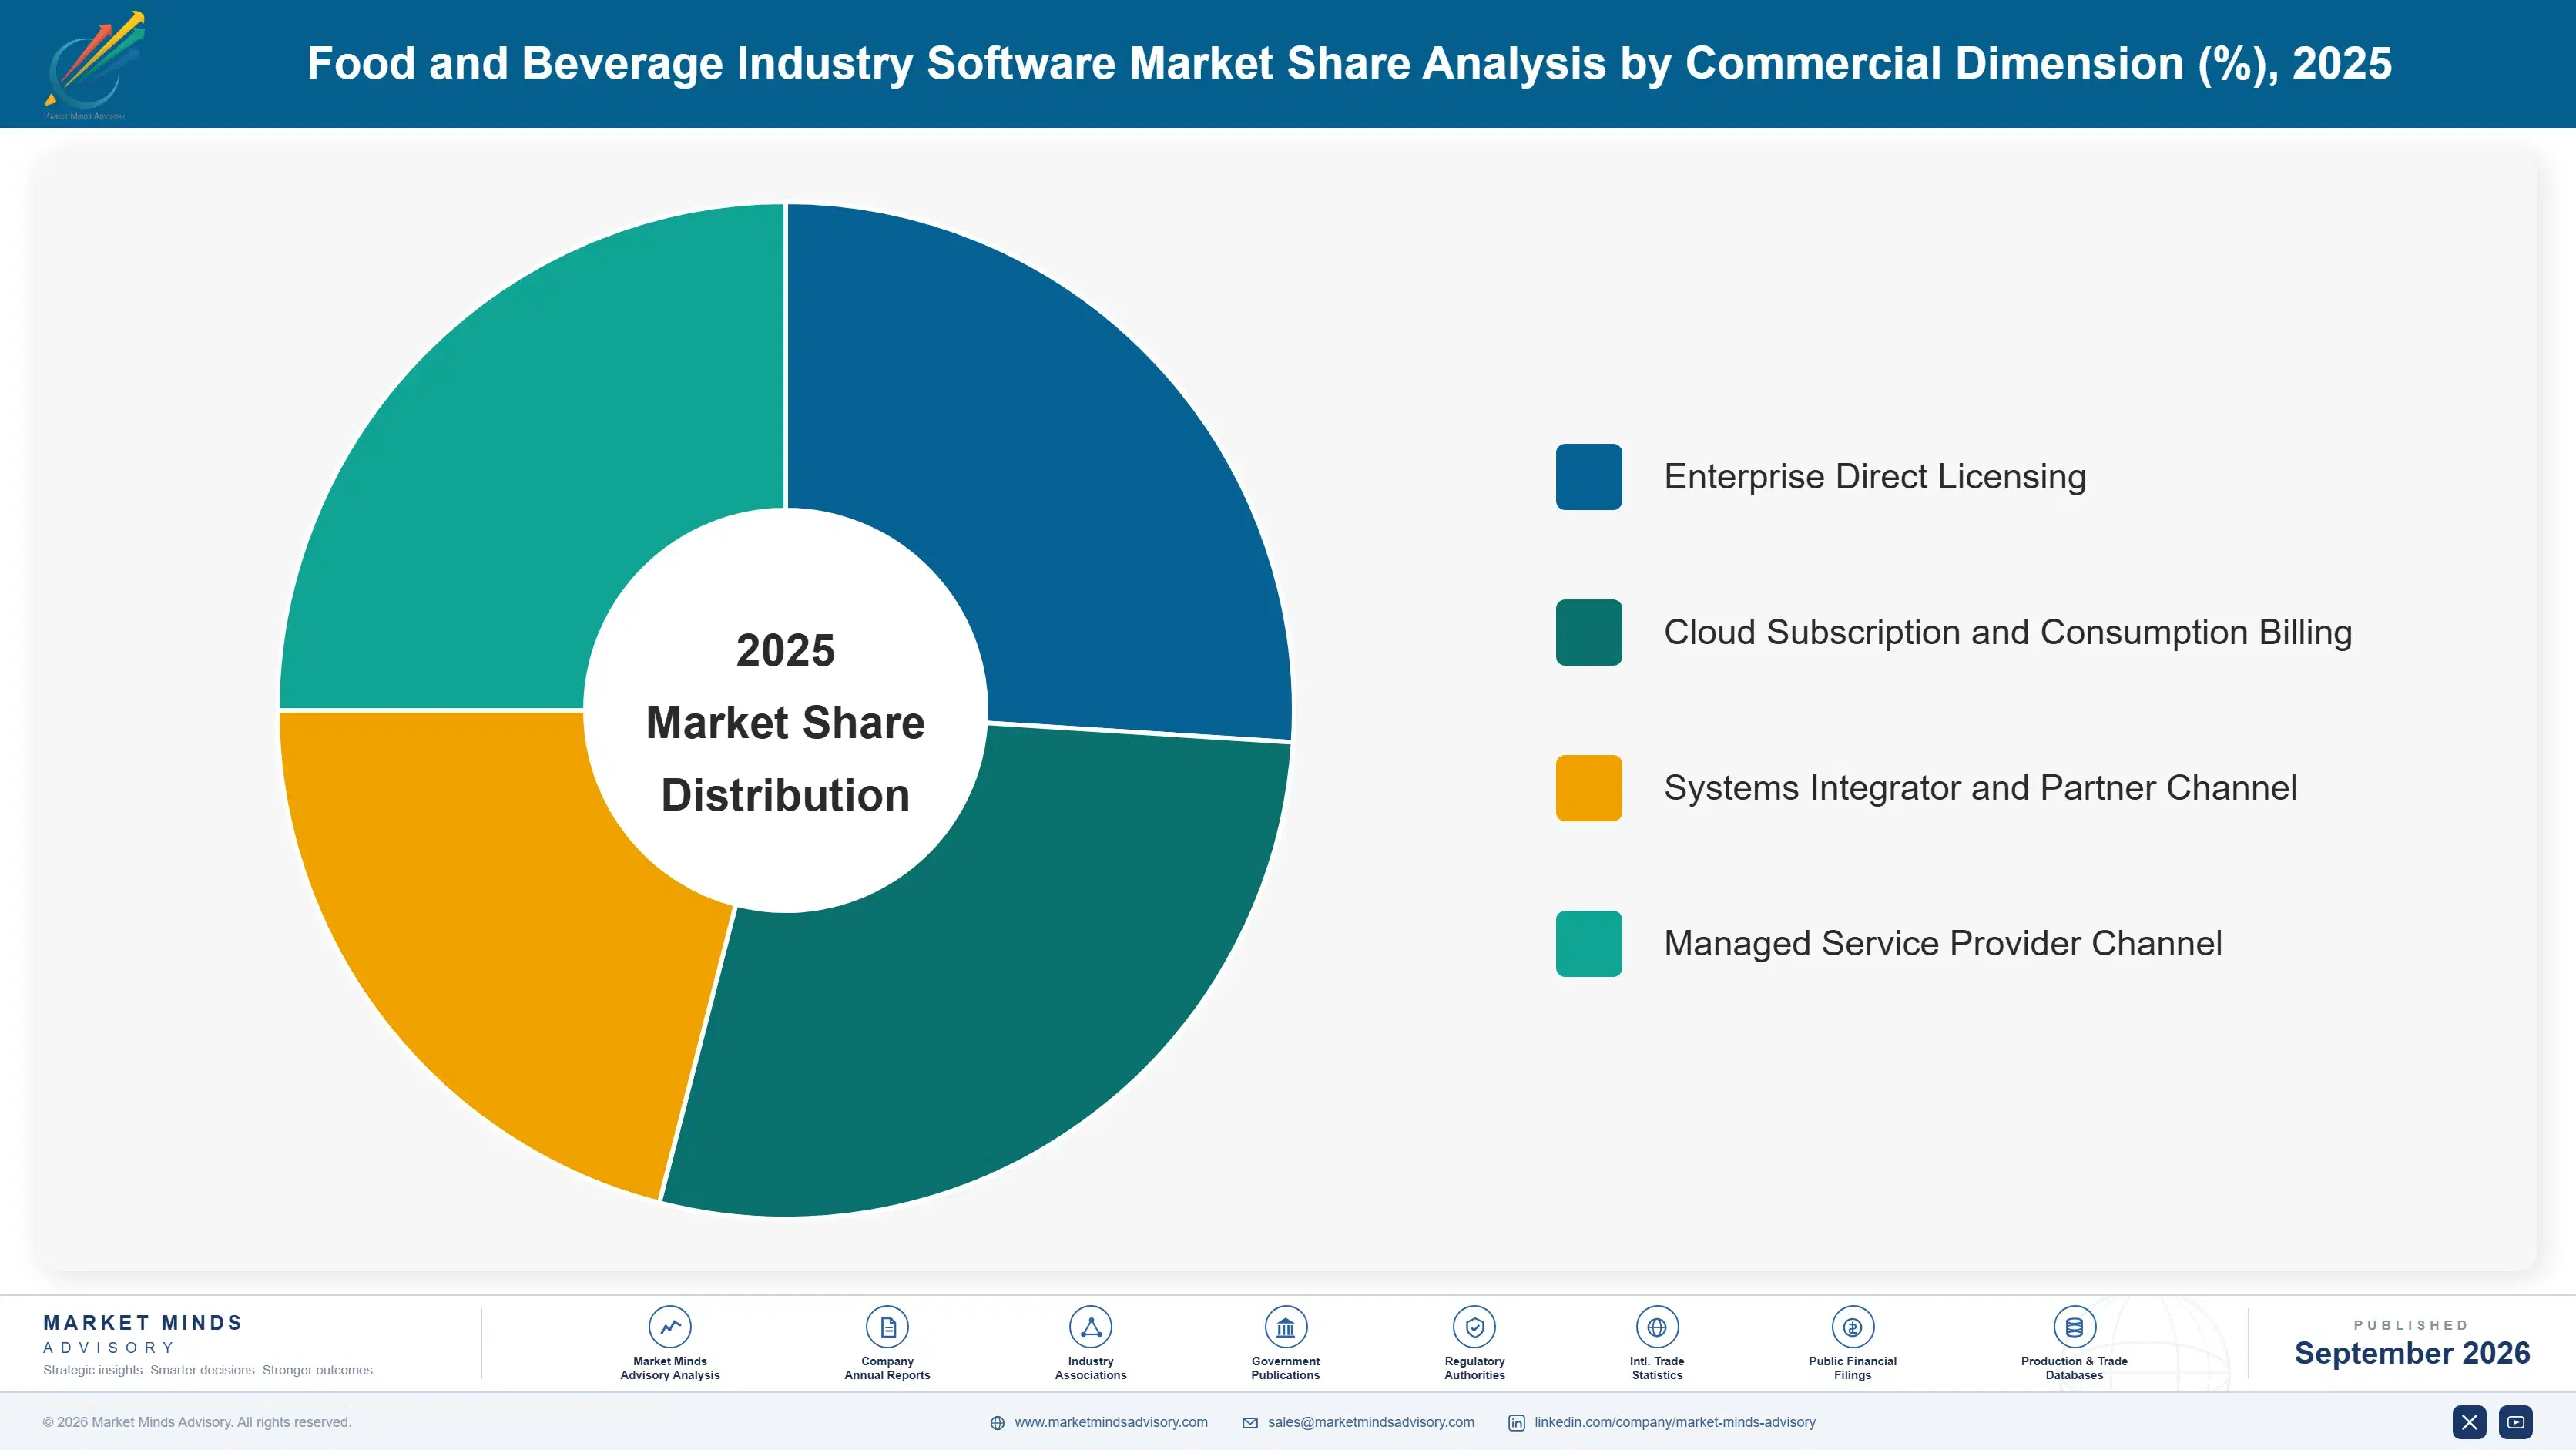
By Commercial Dimension

  • Enterprise Direct Licensing
  • Cloud Subscription and Consumption Billing
  • Systems Integrator and Partner Channel
  • Managed Service Provider Channel

By Region

  • North America
  • Western Europe
  • East Asia
  • South Asia and Pacific
  • Latin America
  • Middle East and Africa
  • Eastern Europe

Scope, Methodology, and Coverage

Every figure in this report is reproducible from documented input assumptions. The scope below maps the historical period, the forecast horizon, the segmentation dimensions, and the countries covered, alongside the underlying primary and qualitative methodology.
Historical Period
2020 to 2025
Forecast Period
2026 to 2036
Base Year
2025 (USD billions; MMA Primary Research Dataset, September 2026)
Market Definition
The food and beverage industry software market covers vertical software platforms purpose-built for food and beverage manufacturers, including food safety compliance, traceability, recipe formulation, and production planning systems. It excludes general-purpose horizontal ERP software without food-specific configuration and consumer-facing food delivery or restaurant point-of-sale applications unrelated to manufacturing operations.
Quantitative Units
USD billions, base year 2025, forecast period 2026 to 2036
Segmentation Dimensions
Product/technology type, end-use industry, commercial licensing model, region
Regions Covered
North America, Western Europe, East Asia, South Asia and Pacific, Latin America, Middle East and Africa, Eastern Europe
Countries Covered
United States, Canada, Germany, United Kingdom, France, China, Japan, South Korea, India, Australia, Brazil, Mexico, United Arab Emirates, South Africa, Poland
Key Companies Profiled
SAP, Infor, Aptean, TraceGains, ParityFactory, Oracle NetSuite, SafetyChain Software, Repositrax
Quantitative Methodology
Primary survey, n=3,800 respondents, Q4 2025, six countries; demand-side model with trade association cross-validation
Qualitative Methodology
47 expert interviews, Q4 2025; applied to validate demand model assumptions, identify emerging dynamics, and assess competitive positioning
Report Format
PDF and XLSX data workbook (Word format preview document)
Publisher
Market Minds Advisory
Report Code
MMA-2026-TEC-342
Published
September 2026
Contact
sales@marketmindsadvisory.com | www.marketmindsadvisory.com

Purchase the full Food and Beverage Industry Software Market Report (2026 to 2036).

This report provides a comprehensive assessment of the global food and beverage industry software market, covering sizing, segmentation, regional dynamics, and competitive positioning through 2036. It examines the shift from manual spreadsheet-based traceability toward automated, real-time compliance systems, tracking regulatory automation, consumption pricing, and cold chain integration reshaping vendor selection criteria across manufacturer buyer segments. The analysis draws on primary survey data, expert interviews, and company disclosures to quantify demand across seven world regions and six product segments. Product and investment teams gain a grounded view of where competitive advantage is shifting fastest.
Segment-level sizing and ten-year growth forecasts
Regional demand mapping across seven world regions
Competitive landscape and detailed player profiling
Revenue lever analysis with margin impact figures
Input cost exposure and supply risk assessment
Strategic verdict with prioritized action recommendations

Built For The People Who Decide

From boardroom strategy to bench-side execution, this report is read cover-to-cover by leaders shaping the next decade of their industry, turning demand scenarios, market dynamics and valuation benchmarks into decisions.
CXOs/ Presidents/ VPs/ Managers
M&A and Corporate Development
Strategy Teams and R&D Heads
Procurement and Product Directors
Regulatory and Compliance Leaders
Investor Relations and Equity Analysts