Market Minds Advisory
Foldable Steel Containers Market

Foldable Steel Containers Market: The Return Leg Is Where the Money Is Lost

Folding a steel container flat cuts return freight by roughly four fifths, yet most fleets still lose containers faster than they wear out, because nobody owns the empty on its way back.

Lead Analyst

Bilal Shaikh

Published

September 2026

Make Smarter Decisions with Customized Research Insights

Request a free sample report and evaluate market opportunities, growth trends, and competitive dynamics relevant to your business needs.

2025 MARKET VALUE$2.9BMarket Size 2025
2036 FORECAST VALUE$5.8BBase Case , 2026 to 2036
CAGR 2026 TO 20366.4 %Bull 7.6% / Bear 5.2%
INCREMENTAL OPPORTUNITY$2.7BNet 10- year value creation
EXPANSION MULTIPLE1.86x2036 value over 2026 base
Strategic Levers
M&A Pipeline
Regional Outlook
Country Rankings
Competitive Intelligence
Segmental Deep-dive
Call-Us : 91 93563 13602

Executive Snapshot and Market Trajectory

A folded steel container occupies about a fifth of the volume it holds erected, which is the whole commercial case for buying one. The problem is that fleet loss runs near 9% annually, and a container that never comes back costs far more than the freight it saved.
Growth runs at 6.4% and value is moving from selling steel toward managing fleets. Tracked and pooled container services grow fastest at 9.6%, exactly 1.50 times the market rate, because the buyer's real problem is loss and utilisation rather than container price. East Asia holds the largest share at 30%, where automotive and electronics supply chains run the highest returnable container density anywhere.
Concentration reaches 34% across the top five measured on annual container units shipped, spread across steel fabricators, returnable packaging specialists, and pooling operators. Automotive platform sourcing decisions rather than any packaging specification determine most fleet purchases, which means the buying cycle follows vehicle programme launches on a five to seven year rhythm. Plastic returnable specialists keep taking the lighter applications where handling weight matters more than load rating. Battery logistics runs the other way entirely.
Market Definition
This market covers collapsible and foldable steel transport containers used for returnable industrial logistics, spanning welded mesh collapsible containers, sheet steel folding containers and stillages, steel-framed hybrid containers with alternative panel materials, custom dunnage-fitted containers for specific components, and tracked or pooled container fleet services. Fixed non-folding steel containers, plastic returnable containers, timber and cardboard packaging, intermodal shipping containers, and warehouse racking fall outside scope.
Base Year Value
$2.9B in 2025 (MMA Primary Research Dataset, August 2026)
Forecast Period
2026 to 2036, eleven discrete annual values
CAGR
6.4% base case. Bull 7.6%. Bear 5.2%.
Fastest Growth Segment
Tracked and Pooled Container Fleet Services: 9.6% CAGR
Fastest Growth Country
India: 8.8% CAGR
Fastest Growth Region
South Asia and Pacific: 8.4% CAGR
Largest Region
East Asia: 30% of 2025 global value
Market Leaders
SSI Schaefer, Gebhardt Logistic Solutions, Nefab, Cabka, Bito Lagertechnik. Source: MMA Analysis based on company annual reports.
Primary Survey
n=3,800 procurement and R&D decision-makers, Q4 2025, six countries
Methodology
Demand-side build-up, cross-validated against public data, 47 expert interviews

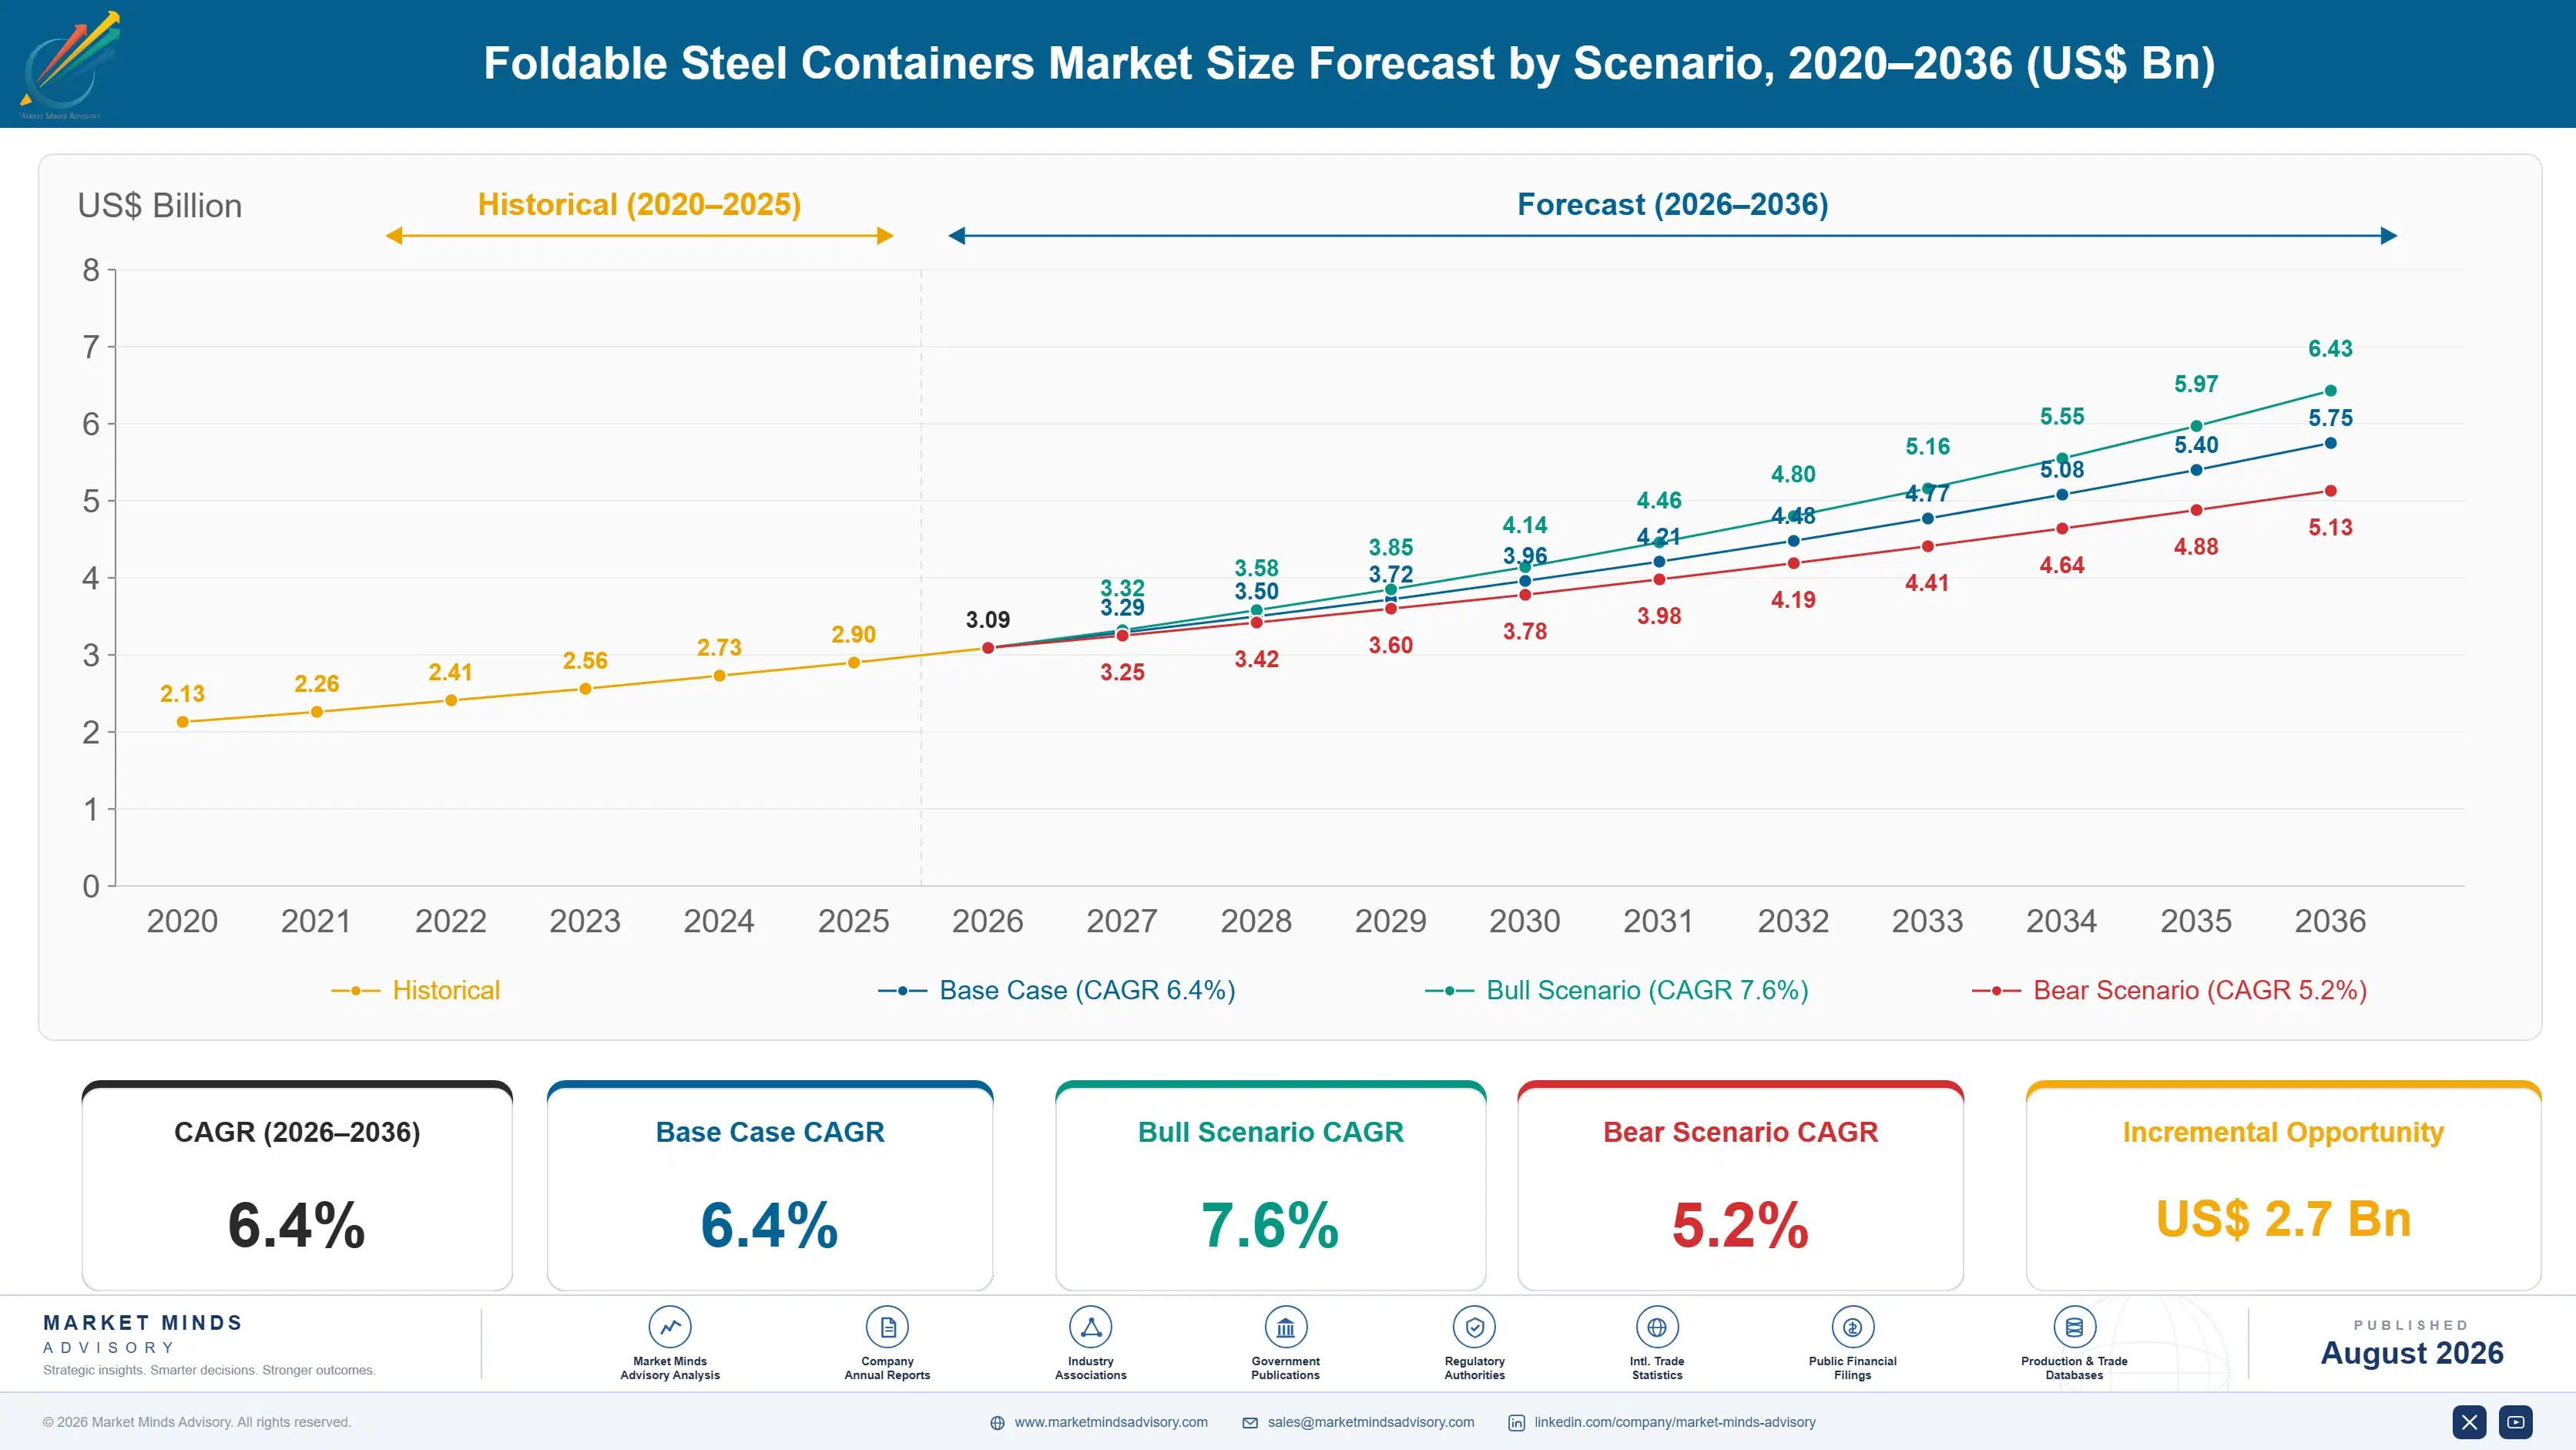
Foldable Steel Containers Market Forecast Scenarios

foldable-steel-containers-market-size-forecast-scenario-1787300393276
The 2020 to 2025 period grew at 5.4% and steel price movement dominated the revenue picture far more than unit volume did. Automotive production disruption cut new container programmes sharply through 2021 and 2022, and fleets that were already deployed simply ran longer. Recovery arrived with vehicle platform launches rather than with any change in packaging thinking. Loss rates worsened as supply chains lengthened and container ownership blurred.
Three mechanisms carry the 6.4% base case. Automotive platform launches are the largest, since new vehicle programmes specify container fleets years ahead and volume follows those decisions directly. Fleet loss and utilisation management is the second, because tracking a container is now cheaper than replacing 9% of a fleet annually. And electric vehicle battery logistics is the third, where component weight and fire containment requirements rule out lighter alternatives entirely.
The 7.6% bull case rests on battery module logistics scaling faster than expected, since those components require steel containment that plastic returnables cannot substitute for at any price. The 5.2% bear case is sustained steel price weakness combined with plastic returnable substitution in lighter applications, which would compress both revenue per unit and the volume base underneath it simultaneously.

Nobody Owns the Empty Going Back

The engineering case for a foldable steel container is simple and it is real. Folded flat, the container takes roughly a fifth of the space it occupies erected, so the empty return leg costs a fraction of what a fixed container would. Every specification document leads with that ratio. What the specification rarely addresses is what happens to a container once it leaves the plant that owns it.
ANNUAL FLEET LOSS RATE9%Of deployed containers unaccounted for at each annual count
FOLDED VOLUME RATIO5 to 1Erected against folded, which drives the return freight case
STEEL SHARE OF COGS47%Making revenue track steel pricing more than volume
TYPICAL SERVICE LIFE12 yearsWell beyond the vehicle programme most fleets were specified for
TOP FIVE CONCENTRATION34%Moderate, across fabricators, packaging specialists, and pooling operators
AVERAGE FLEET UTILISATION58%Of containers actively in circulation rather than sitting idle
Loss runs around 9% of fleet each year. Containers stack up at tier two suppliers, get repurposed as workshop storage, travel to a plant nobody expected and stay, or vanish into a scrap stream when steel prices reward it. At a twelve-year service life, a 9% annual loss rate means the fleet effectively turns over roughly twice before it wears out even once, and replacement cost dwarfs the freight saving.
Utilisation compounds the problem. Around 58% of a typical fleet is actively circulating, with the rest idle at plants, in yards, or held as buffer nobody audits. Fleets are consequently specified 40% larger than throughput requires, which inflates the purchase and inflates the loss. That is why the fastest growth sits in tracking and pooling rather than in the containers themselves.
"We counted a customer's fleet properly for the first time in eight years. They found 3,100 containers they had already written off, most of them stacked behind a supplier's building. Nobody had stolen anything. Nobody had been asked to send them back either."
Director, Returnable Transport Packaging Practice · MMA Industrial Packaging and

Market Trends

Fleet Services Displace Container Sales As Revenue

Buyers are shifting from purchasing containers outright toward pooled and tracked fleet arrangements, where a provider owns the assets, manages circulation, and charges per trip or per month. Tracked and pooled services grow at 9.6% against 6.4% for the market, because loss near 9% annually and utilisation around 58% are the buyer's actual problems rather than container unit price. Fabricators without a service position are being pushed toward supplying assets into somebody else's pool at commodity margins. Switching cost across a pooled fleet is also considerably higher than any container supply relationship carries.
Market Impact: Cycles run 5 to 7 years
Battery Logistics Rules Out Lighter Alternatives Entirely

Electric vehicle battery modules combine weight, fire containment requirements, and transport regulations that plastic returnable containers cannot satisfy at any specification. Steel containers with fire-resistant dunnage and defined venting have become the default, and the fleets involved are large because battery plants run high volume with long supply routes. This is the clearest area where substitution pressure runs backward, and it is pulling steel container demand into a segment that barely existed a decade ago. Cell plant construction across China, Korea, and the southern United States is adding fleet demand quickly. Fire-resistant dunnage carries premium pricing alongside.
Market Impact: Tracking beats 9% annual loss

Market Opportunities and Growth Drivers

Vehicle Platform Launches Specify Fleets Years Ahead

Automotive manufacturers specify returnable container fleets during platform development, typically three years before start of production, and those decisions determine container type, quantity, and supplier for the whole programme life. Platform cycles run five to seven years, which makes demand lumpy and predictable at the same time. A supplier missing a platform specification waits years for the next opportunity, so commercial effort concentrates entirely around programme development windows rather than around any annual purchasing cycle. Engaging with packaging engineering rather than with purchasing is what actually decides these awards. Programme calendars are entirely knowable to anyone maintaining them.
Market Impact: Steel is 47% of COGS

Tracking Now Costs Less Than Replacing Lost Fleet

Container-level tracking hardware has fallen to a price where instrumenting a fleet costs a fraction of replacing the roughly 9% lost each year, which reverses an economic argument that held for two decades. Bluetooth and passive identification tags survive industrial handling well enough for the duty cycle involved. That change moves the commercial conversation away from steel gauge and welding quality toward circulation data, and it favours providers who can operate a fleet rather than merely build one. Circulation data also makes the pooling conversation concrete rather than theoretical for a buyer.
Market Impact: Utilisation sits near 58%

Market Restraints and Challenges

Steel Pricing Drives Revenue More Than Volume Does

Steel carries roughly 47% of cost of goods sold, so revenue in this market tracks hot rolled coil pricing far more closely than it tracks unit demand. The root cause is a product where material dominates a relatively simple fabrication process. Commercial impact is margin compression whenever steel rises inside a fixed-price supply agreement, which platform contracts routinely are. Mitigation runs through indexed pricing clauses, hedged material purchasing, and shifting revenue toward service contracts insulated from material cost. Indexation has spread across platform contracts since the coil movement of 2021 and 2022.
Market Impact: Services growing at 9.6%

Nobody Holds Responsibility For The Empty Container

Container loss near 9% annually and utilisation around 58% both trace to the same root cause, which is that the return leg sits between organisations and belongs to none of them. The shipper has despatched, the receiver has unloaded, and neither is measured on returning anything. Commercial impact is fleets specified 40% oversized to compensate. Mitigation runs through deposit schemes, contractual return obligations with supplier scorecards, and pooled arrangements where a third party is paid specifically to care. Deposit schemes work where the receiving organisation is small enough to notice the money.
Market Impact: Loss rates near 9% annually
3 additional market trends, 4 additional growth drivers, and 2 additional restraints and challenges are covered in the full report. Contact sales@marketmindsadvisory.com to access the complete intelligence.

Segment CAGR and Growth Architecture

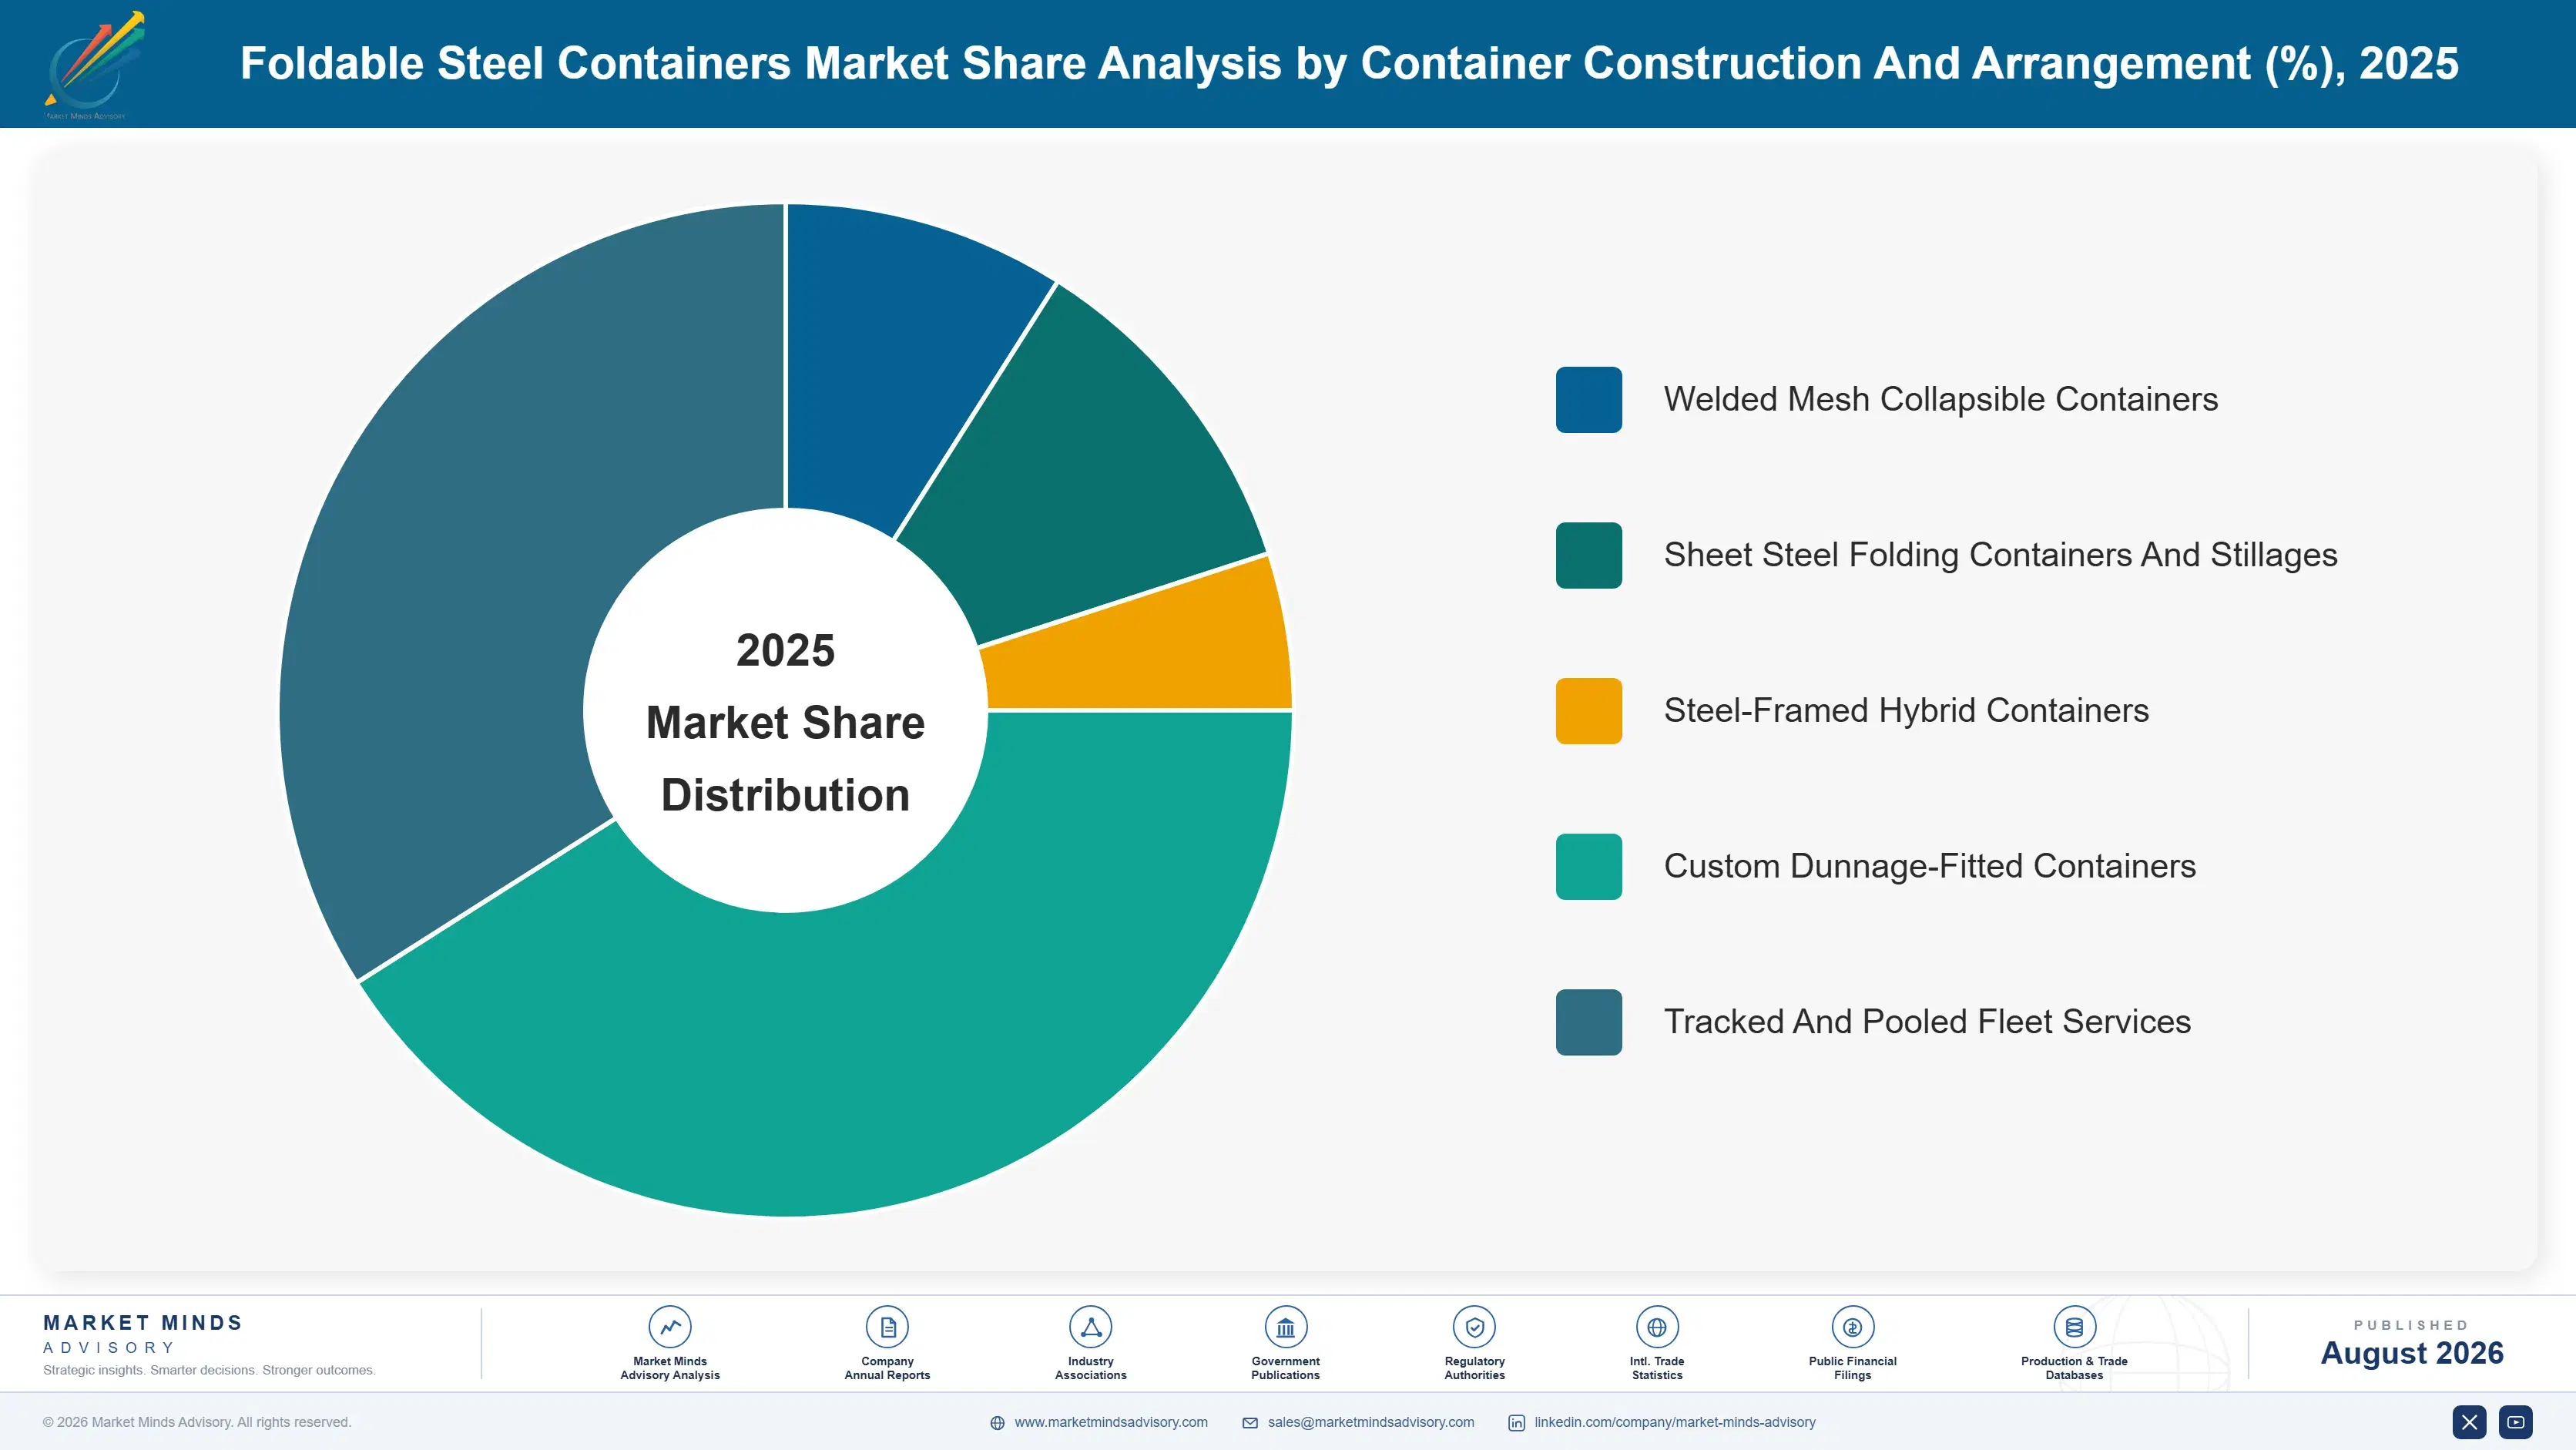
Segmentation follows container construction and the commercial arrangement attached to it, because those two things together determine unit economics, replacement cycle, and above all who ends up carrying the loss risk. Ownership of that loss risk is the axis that matters commercially here, which makes end-use industry and folding mechanism considerably weaker primary dimensions.
foldable-steel-containers-market-market-share-analysis-1787300393803

Tracked And Pooled Container Fleet Services

The fastest route at 9.6%, exactly 1.50 times the market rate, and the only one addressing what buyers actually lose money on. A pooling operator owns the assets, tracks circulation, and charges per trip or per month, which converts a capital purchase and an unmanaged 9% annual loss into a predictable operating cost. Utilisation improves because somebody is finally paid to chase empties. Margins are considerably better than container fabrication, and the position is defensible because switching pools means physically recovering and replacing an entire deployed fleet. Fabricators without a service position increasingly supply assets into pools somebody else operates. Margins there sit at commodity fabrication levels. Fleet scale is what makes pooling economics work.
CAGR 9.6%

Steel-Framed Hybrid Containers

Second fastest at 8.2%, combining a steel frame carrying the structure and folding mechanism with plastic or composite panels reducing weight. The combination cuts tare weight meaningfully against all-steel construction while retaining the load rating and folding reliability that plastic-only containers struggle to match over a twelve-year life. Automotive component logistics is the main application, particularly where handling is manual and weight matters to the operator. Panel replacement also extends service life economically, since damaged panels swap out without touching the frame. Steel-framed construction also retains the fire performance that all-plastic containers cannot offer at any specification. Battery module logistics is pulling hybrid designs toward heavier gauge frames. Load rating remains the deciding specification.
CAGR 8.2%
Full segment breakdown across 5 segments available in the complete report.

Regional Architecture and Country Demand Map

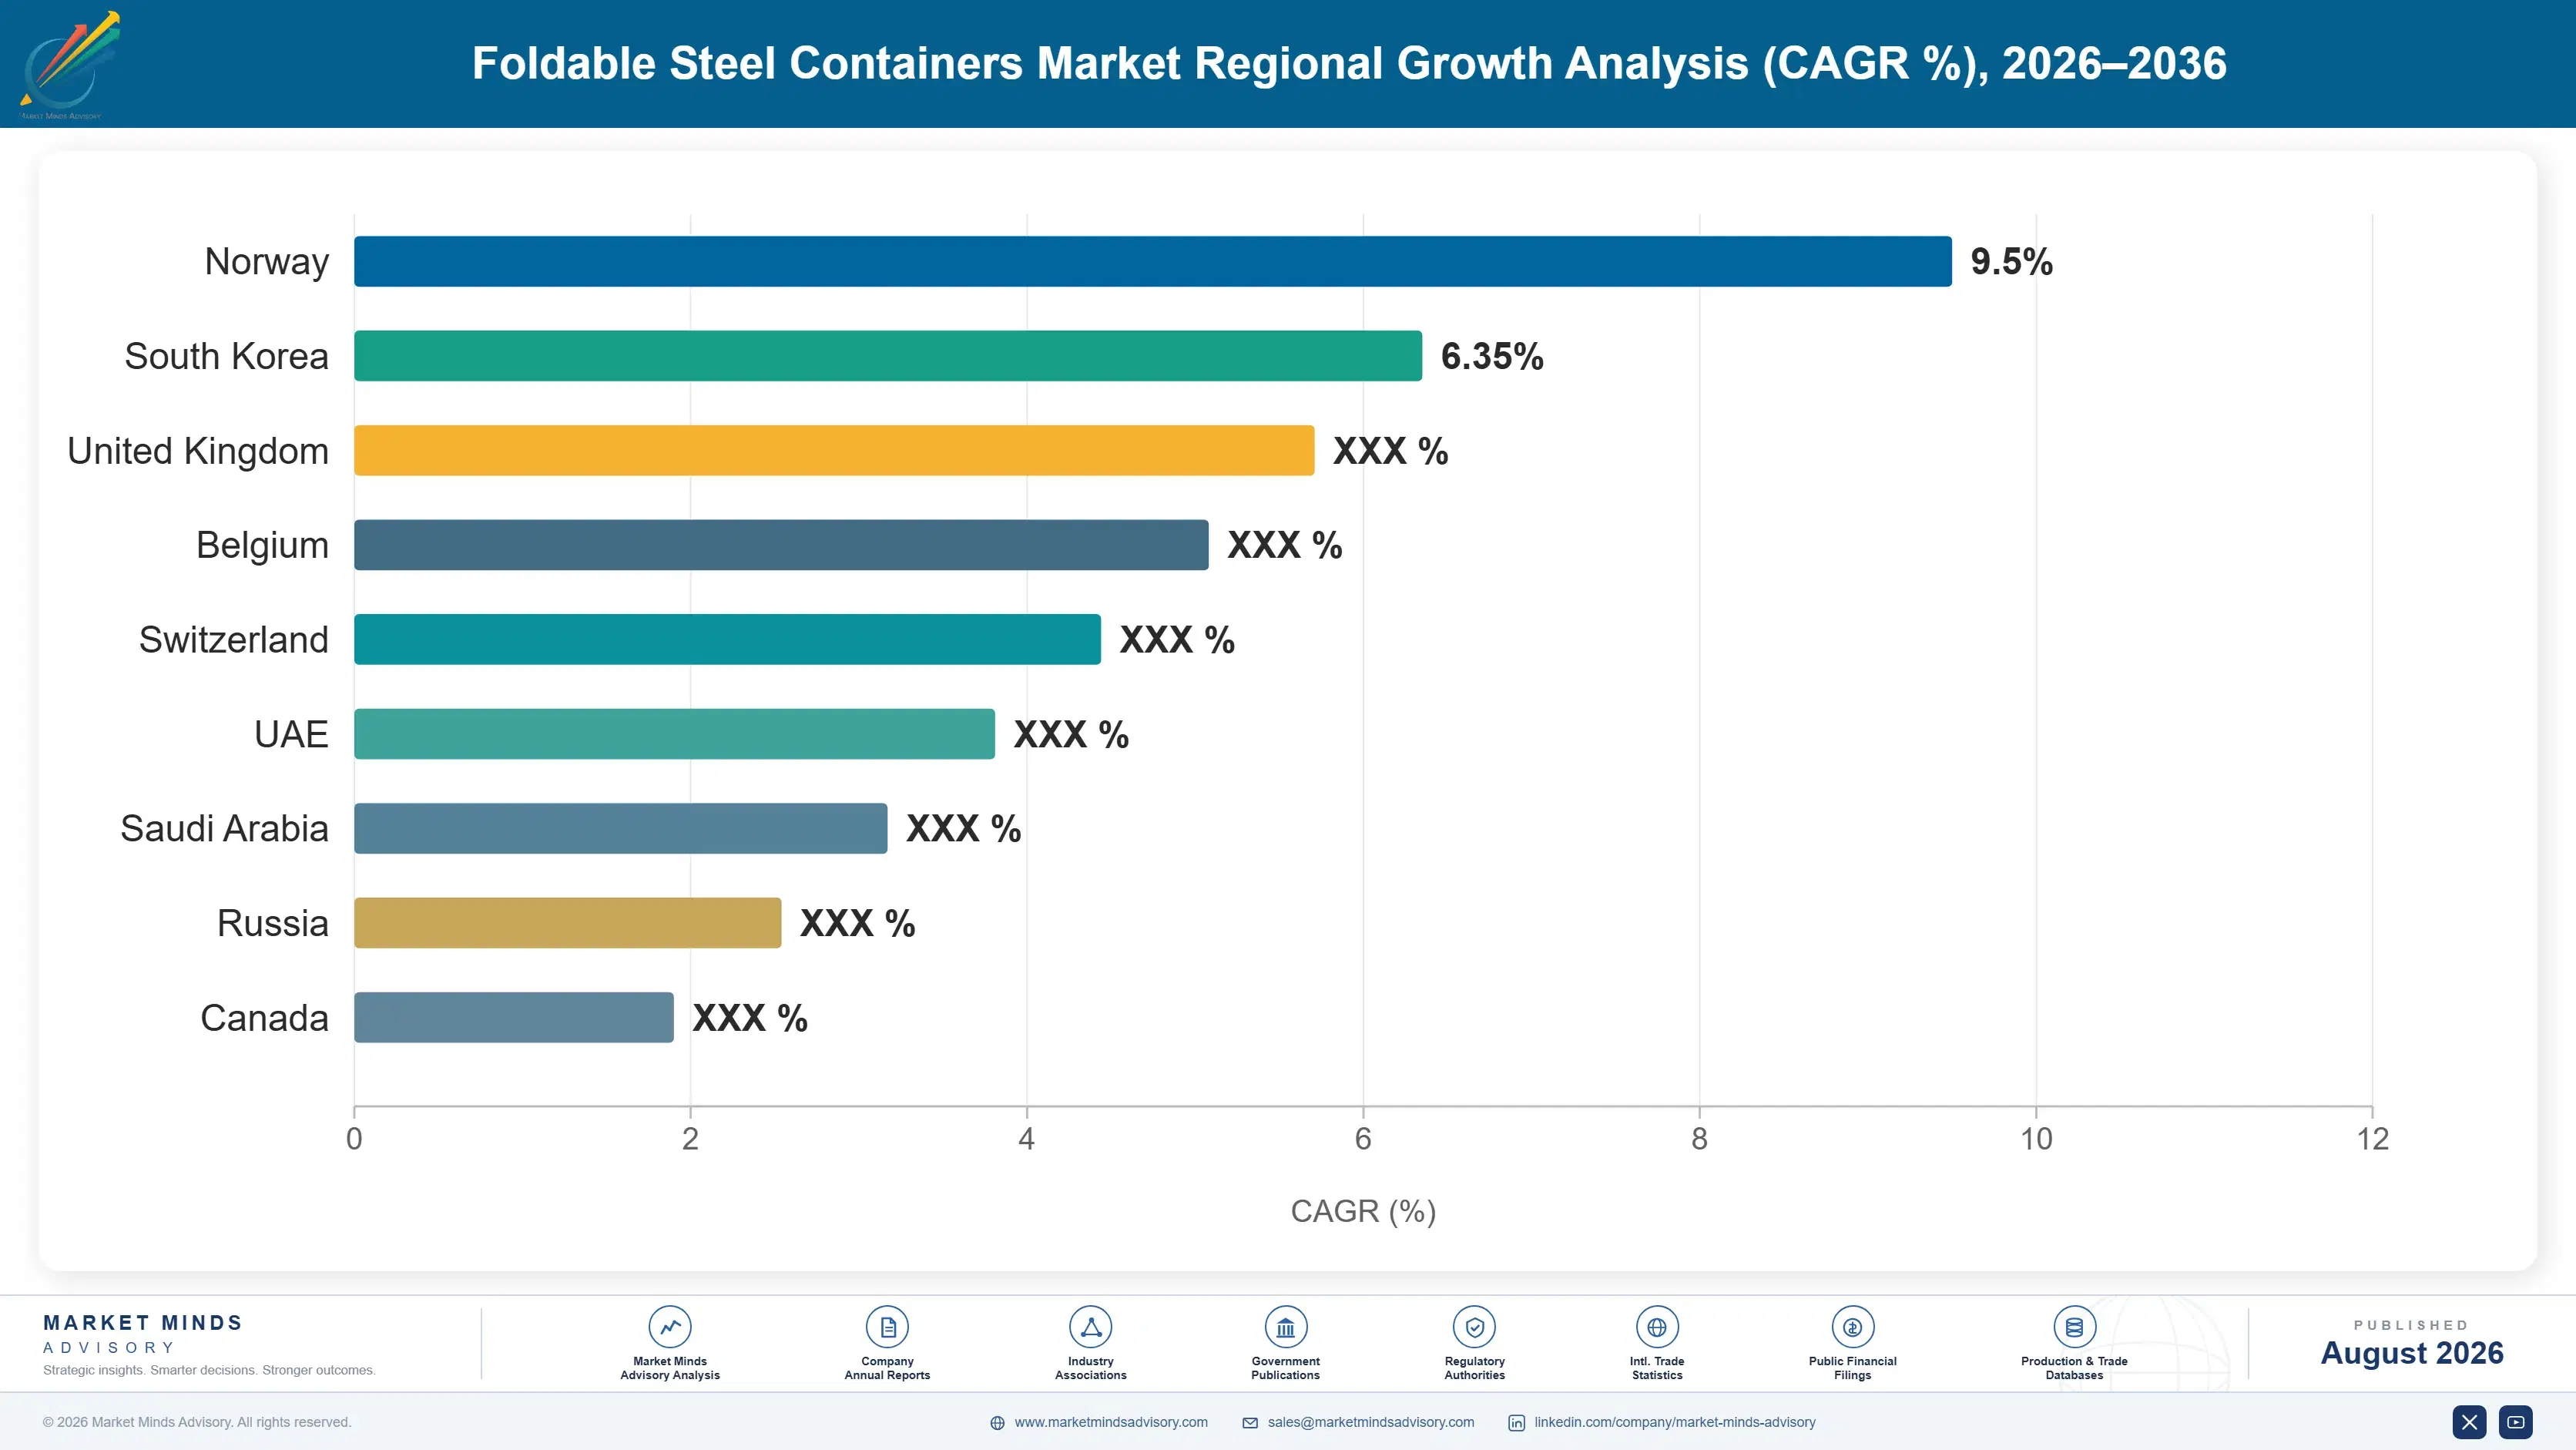
East Asia leads at 30% on the highest returnable container density anywhere, driven by automotive and electronics manufacturing scale. Western Europe follows on established pooling infrastructure, ahead of North America. South Asia and Pacific grows fastest as automotive supply chains localise. Automotive platform sourcing decides most regional fleet volume.

East Asia

Thirty percent, the largest share, and the reason is manufacturing density rather than any packaging preference. Chinese, Japanese, and Korean automotive and electronics plants run returnable container fleets at a scale nothing elsewhere approaches, with supplier parks close enough that return legs are short and loss rates lower than Western equivalents. Battery module logistics is expanding fastest, driven by cell plant construction across China and Korea where fire containment requirements rule out plastic entirely. Growth at 7.2% runs above the market rate, supported by continued battery capacity investment across the region. Supplier park proximity keeps return legs short and recovery rates well above Western equivalents. Fleet management is correspondingly less developed because loss has been a smaller problem here.
Share: 30% | CAGR: 7.2% (2026 to 2036)

Western Europe

Established pooling infrastructure rather than manufacturing volume explains this 24%. German, French, and Italian automotive supply chains have operated third-party container pools for decades, which means loss and utilisation are already managed in a way most other regions have not attempted. That maturity caps growth: the easy improvement was captured years ago. Steel-framed hybrid containers sell well here because manual handling regulations put a genuine premium on tare weight. Growth at 4.8% is the slowest of any region, reflecting replacement demand rather than fleet expansion. Third-party pool operators here hold customer relationships that fabricators elsewhere still do not. Fleet expansion is limited because container populations already match production volume closely. Replacement demand carries most of the region.
Share: 24% | CAGR: 4.8% (2026 to 2036)
Regional intelligence for 5 additional markets available in the complete report: North America, South Asia and Pacific, Latin America, Middle East and Africa, Eastern Europe. Contact sales@marketmindsadvisory.com.
foldable-steel-containers-market-country-cagr-analysis-1787300394321

Selling Circulation Rather Than Steel

Loss runs near 9% of fleet annually, utilisation sits around 58%, steel carries 47% of cost of goods sold, and platform cycles run five to seven years. Value comes from selling fleet management rather than containers, from timing effort to platform windows, and from indexing steel exposure out of contracts. Ownership of the empty leg decides where margin actually lands.

Charge For Circulation Not For Containers

A customer losing roughly 9% of fleet annually and running 58% utilisation is not primarily buying steel, they are buying a logistics problem they have not solved. Pooled arrangements charging per trip or per month convert that capital purchase and unmanaged loss into predictable operating cost, and they carry margins well above fabrication. Switching cost is also considerable, since leaving a pool means physically recovering and replacing an entire deployed fleet across dozens of supplier sites. Pooled service gross margins run well above the 16% to 22% typical of volume fabrication.
Market Impact: Fleet loss runs near 9% of units yearly

Concentrate Commercial Effort On Platform Windows

Automotive container fleets are specified roughly three years before start of production, and platform cycles run five to seven years, so a supplier missing that window waits most of a decade for the next chance. Commercial resource spread evenly across the year is largely wasted. Tracking platform development calendars and engaging during packaging engineering rather than during purchasing produces vastly better conversion, and it is entirely knowable information for anyone prepared to maintain the calendar. Platform fleets are typically specified about 3 years ahead of start of production. Missing that window costs most of a decade.
Market Impact: Platform windows recur every 5 to 7 years

Index Steel Exposure Out Of Supply Agreements

Steel carries around 47% of cost of goods sold, and platform contracts running several years at fixed prices convert every hot rolled coil increase directly into margin loss. Indexed pricing clauses tied to a published benchmark move that exposure to the customer, who is generally better placed to absorb it and frequently already indexes their own component contracts. Customers resist the clause initially and accept it when the alternative is a supplier pricing several years of risk into the opening quote. Hot rolled coil movement through 2021 and 2022 demonstrated the exposure clearly enough.
Market Impact: Steel carries about 47% of cost of goods

Sell Fleet Audits Before Selling Any Replacement

Customers routinely order replacement containers against a fleet count nobody has verified, and audits regularly find a substantial share of a written-off fleet stacked at supplier sites. An audit service that recovers containers costs the customer far less than the replacement order they were about to place, which loses a sale and wins the account. It also produces circulation data that makes the pooling conversation concrete rather than theoretical, which is where the durable revenue actually sits. Audits routinely recover a meaningful share of the 9% written off each year. Circulation data is what makes a pooling proposal concrete.
Market Impact: Audits recover part of the 9% lost annually

Who Controls the Margin Pool

Concentration reaches 34% across the top five measured on annual container units shipped, and the moderate figure reflects a market where three quite different business models coexist. Steel fabricators compete on price and delivery, returnable packaging specialists compete on engineering and dunnage design, and pooling operators compete on fleet management rather than on any product attribute. The gap between leader and challenger is narrow, and a single automotive platform award can move sever
Competitive activity runs on three fronts. Platform specification access is the first and most decisive, since being present during packaging engineering three years before production determines the whole programme. Dunnage and component fit engineering is the second, because a container designed around a specific part is far harder to displace than a generic one. And fleet management capability is the third, which increasingly qualifies a supplier rather than differentiating one.

Pressure arrives from two directions. Plastic returnable specialists keep taking lighter applications where weight and handling matter more than load rating. And logistics service providers are entering pooling from the operations side, holding customer relationships that fabricators do not.

Rankings move on platform awards rather than on gradual share gain.
foldable-steel-containers-market-company-positioning-matrix-1787300394844

Competitive Moat and Risk Dimensions

SSI SCHAEFER

Moat: Breadth across returnable packaging systems

Supplying steel, plastic, and hybrid returnable containers alongside the handling systems that move them lets one supplier answer a whole packaging specification rather than a single line of it. Automotive packaging engineers value that during platform development, when the specification covers dozens of component families at once. Competitors holding only steel fabrication cannot participate on equal terms.
SSI SCHAEFER

Risk: Breadth invites internal substitution

A supplier offering both plastic and steel returnables will cannibalise its own steel volume whenever an application tolerates a lighter alternative, and plastic carries different margins entirely. Sales incentives rarely resolve that cleanly in practice. The breadth advantage during specification therefore comes with a persistent mix risk that single-material competitors simply do not carry.
NEFAB

Moat: Application engineering and global footprint

Designing packaging around specific components rather than selling standard containers creates positions that are difficult to displace, because a replacement supplier must re-engineer dunnage and requalify the part protection. Manufacturing and service presence across the regions a customer ships between also matters enormously, since a fleet crossing borders needs support at both ends. Neither capability assembles quickly.
NEFAB

Risk: Custom engineering limits scale economics

Application-specific containers carry engineering cost against every programme and produce limited reuse across customers, which caps the operating margin improvement volume would normally bring. Pooling operators running standardised fleets achieve utilisation that custom designs by their nature cannot. That trade-off becomes sharper as buyers shift toward services priced on circulation rather than on engineering quality.

Key Players

SSI Schaefer
Gebhardt Logistic Solutions
Nefab
Cabka
Bito Lagertechnik

Others

Georg Utz Holding
Brambles
Schoeller Allibert
Myers Industries
DS Smith
Rehrig Pacific
Craemer Group
Werner Weitner
K. Hartwall
Steel King Industries
Buckhorn
Sanko
Wanzl
Kyoraku
Tri-Pack Plastics

Recent Developments

MARCH 2025

Automotive manufacturer moves container fleet to pooled service

A vehicle manufacturer transferred an owned returnable container fleet to a third-party pooling operator under a multi-year service agreement covering circulation management, recovery, and repair. The arrangement was a service contract rather than any asset sale, joint venture, or acquisition involving the pooling operator itself.
Signal: Ownership is moving to whoever is actually paid to chase the empty container back to the plant.
JUNE 2025

Container maker adds tracking across new fleet deliveries

A returnable packaging manufacturer began fitting passive identification tags across new steel container deliveries as standard rather than as a chargeable option, following customer losses. The change was an internal product decision rather than any partnership, joint venture, or acquisition of a tracking technology supplier.
Signal: Tracking has become cheap enough to include rather than sell, which changes competitive baselines across the market.
SEPTEMBER 2025

Battery plant specifies steel containment for module logistics

A cell manufacturer specified steel containers with fire-resistant dunnage and defined venting for module transport, ruling out plastic returnable alternatives on containment grounds. The specification was a technical requirement within a supply agreement rather than any joint venture, acquisition, or equity arrangement between the parties.
Signal: Battery logistics is the one application where substitution pressure currently runs toward steel rather than away from it.

Coil, Welding and Freight

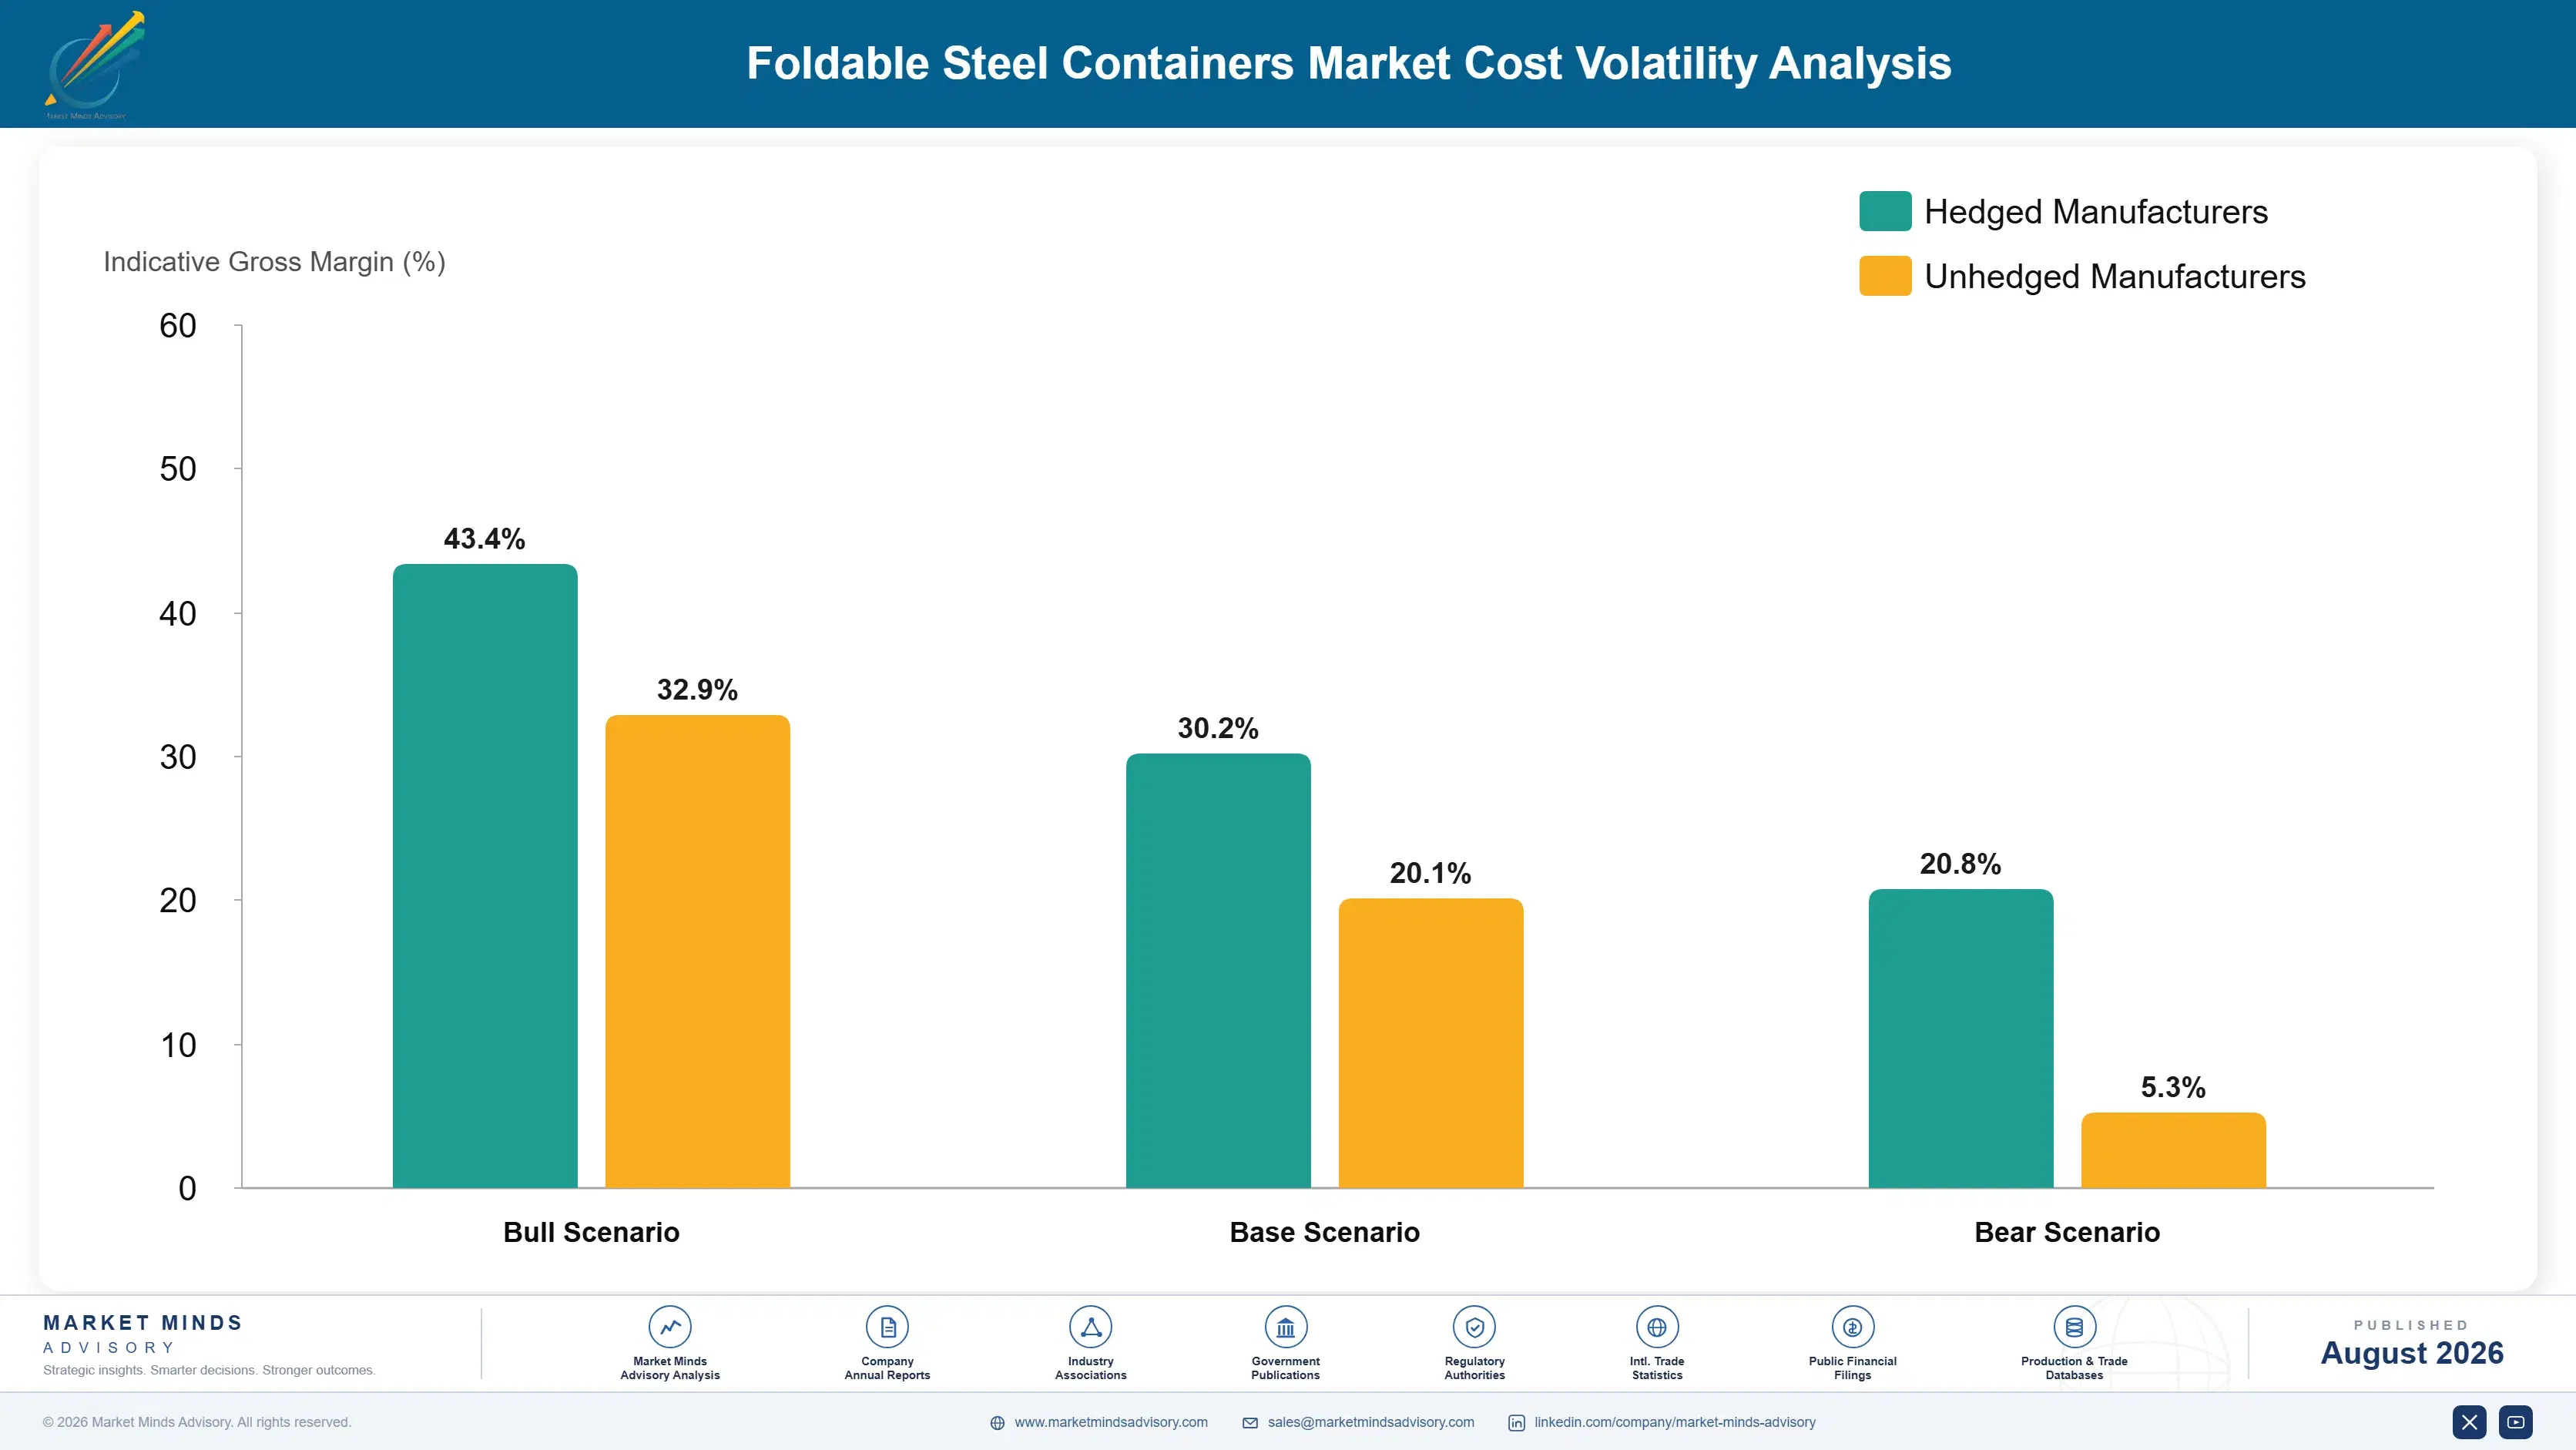
Steel carries roughly 47% of cost of goods sold, sourced predominantly from regional mills rather than traded internationally, since freight on coil makes distant sourcing uneconomic for a product this material-heavy. Fabrication labour and welding consumables add about 19%, hinge and latch hardware around 11%, surface treatment and coating near 8%, and outbound freight the remainder. Material dominance means revenue tracks coil pricing more closely than unit volume.
Hot rolled coil pricing moved violently through 2021 and 2022 across both North American and European markets, and container fabricators holding multi-year fixed-price automotive platform agreements absorbed the increase directly into margin. Several reported the compression explicitly in annual filings for those years. Recovery required renegotiation that customers resisted, and the episode is why indexed pricing clauses have since become considerably more common across platform contracts.

The competitive disadvantage mechanism runs through contract structure rather than through purchasing scale. A fabricator on fixed multi-year pricing carries full material exposure regardless of how well it buys steel, while one on indexed terms passes it through automatically. Regional exposure also differs, since European and North American coil markets move independently and a supplier serving both carries offsetting positions a single-region competitor does not.
foldable-steel-containers-market-cost-volatility-analysis-1787300395040

Index platform contracts to a published coil benchmark

Multi-year automotive agreements at fixed prices convert every coil increase directly into lost margin, and steel carries roughly 47% of cost of goods sold across this product. Indexation against a published benchmark moves that exposure onto a customer who generally indexes their own component contracts already. Buyers resist and then accept once the alternative is priced in.

Shift revenue mix toward fleet service contracts

Pooling and fleet management revenue is priced on circulation and service rather than on material content, which insulates it almost entirely from coil movement. A supplier deriving a meaningful share of revenue from services carries far less earnings volatility through a steel cycle. Building that capability takes years and it changes the whole risk profile of the business permanently.

Design hardware for repair rather than for replacement

Hinge and latch hardware carries around 11% of cost and is where most in-service failures occur across a twelve-year container life in the field. Designing those components for field replacement without cutting or rewelding extends fleet life considerably and creates an aftermarket revenue stream priced well above the original component. Customers value the deferred capital.

Portfolio Architecture for Margin Defence

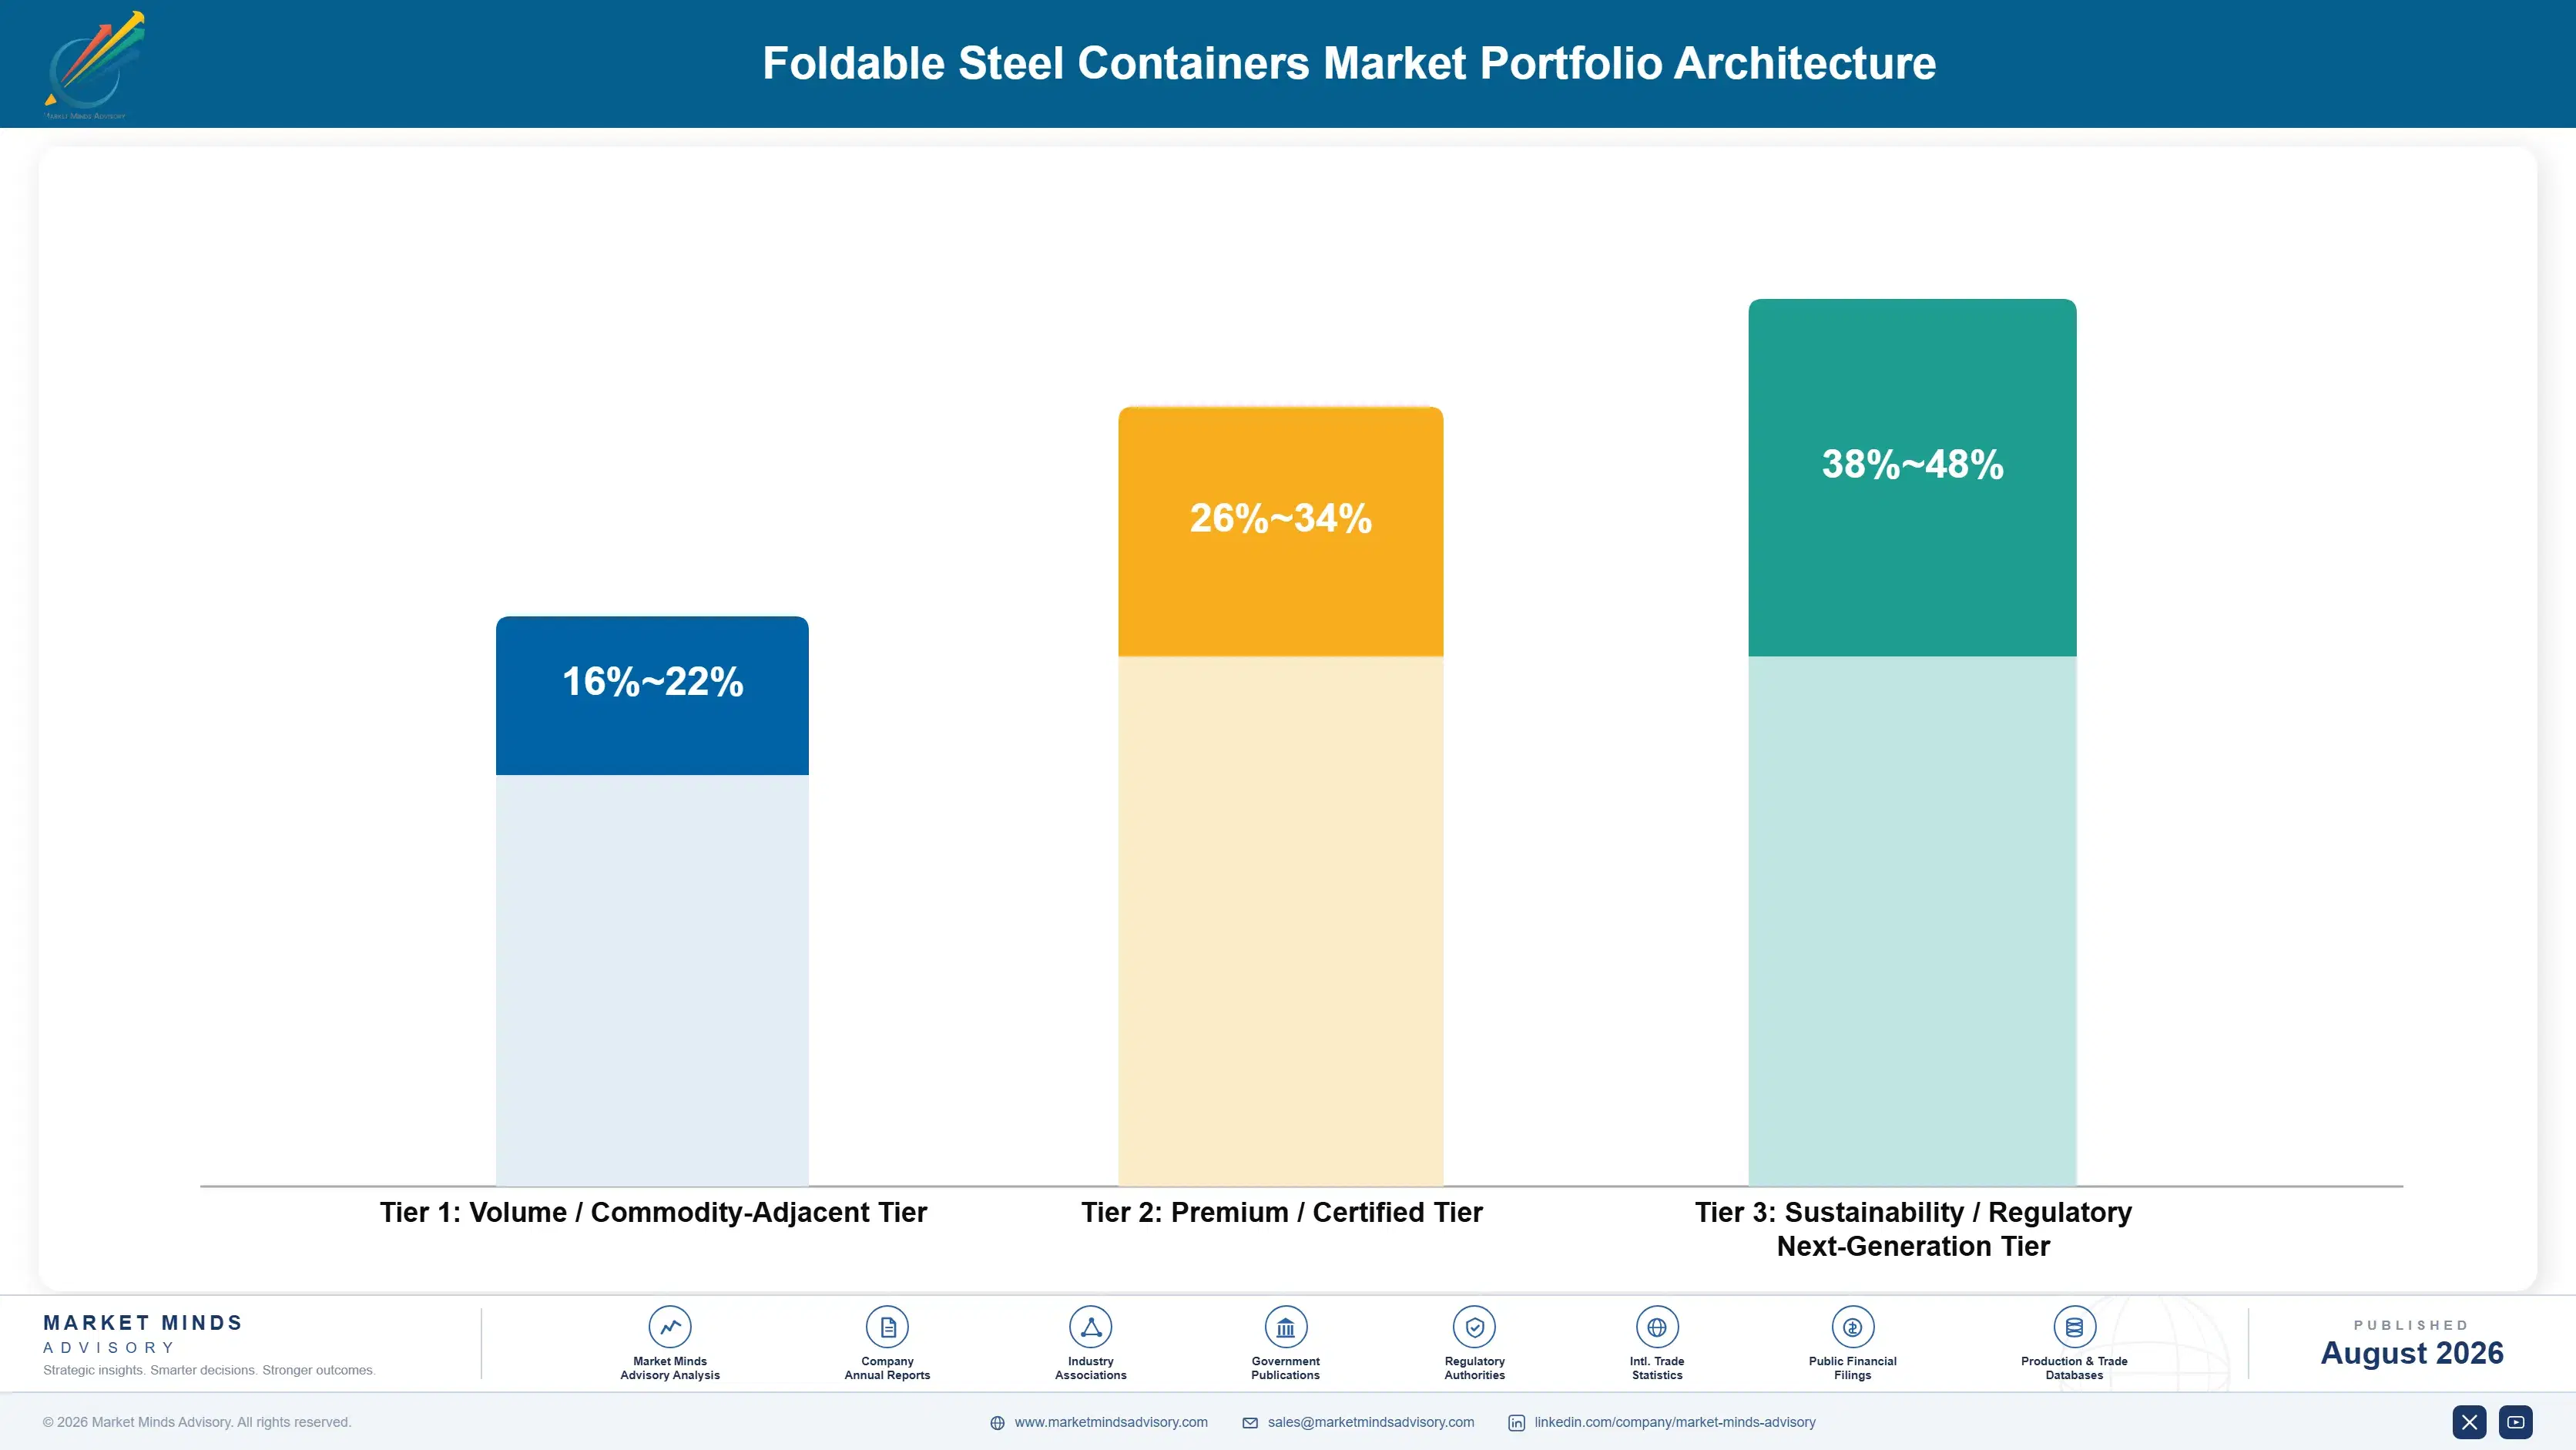
Three tiers describe this business and the margin spread between them is wider than the product similarity suggests. Standard welded mesh collapsible containers sit at the bottom, competing on price against regional fabricators with modest engineering content. Custom dunnage-fitted and hybrid containers occupy the middle, where application engineering supports better pricing. Fleet services sit at the top, priced on circulation rather than on any material content at all.
The tension is that volume containers build the installed base that makes a service offer credible, while service revenue is what actually carries the margin. Fabricators who pursued volume without a service position ended up supplying assets into other operators' pools at commodity pricing. Those who led with services struggled to reach the fleet scale that makes pooling economics work. Almost every durable position combines both.

High-value pools concentrate where the component being carried is expensive or hazardous enough that container specification is not a cost decision. Battery module logistics is the clearest example, since fire containment requirements remove alternatives entirely. Custom dunnage-fitted containers pool value similarly, because displacing one means re-engineering protection and requalifying against damage testing. Both pools sit well above volume fabrication margins.

Volume / Commodity-Adjacent Tier

Standard welded mesh collapsible containers and general stillages, competing on price and delivery against regional fabricators. Engineering content is modest and steel at roughly 47% of cost of goods sold leaves limited room between coil price and customer price.
Gross Margin: 16-22%

Premium / Certified Tier

Custom dunnage-fitted containers and steel-framed hybrids engineered around specific components. Application engineering supports considerably better pricing and creates positions competitors must re-engineer to displace, though it caps the scale economics volume would normally deliver.
Gross Margin: 26-34%

Sustainability / Regulatory / Next-Generation Tier

Tracked and pooled fleet services plus battery logistics containers with fire containment. Best margin by a clear distance, priced on circulation and regulatory necessity rather than on material content, and insulated from coil price movement entirely.
Gross Margin: 38-48%
foldable-steel-containers-market-portfolio-architecture-1787300395529

High-value Sub-segments and Strategic Watch-out

Tracked And Pooled Fleet Services

Fastest growth at 9.6%, exactly 1.50 times the market rate, addressing loss near 9% annually and utilisation around 58%. Switching cost is considerable, since leaving a pool means physically recovering and replacing an entire deployed fleet across many supplier sites. Margins run well above container fabrication.
Gross Margin: 38-48%

Battery Module Logistics Containers

High value and growing quickly, because fire containment and transport regulation rule out plastic returnable alternatives at any specification. Cell plant construction across China, Korea, and the southern United States is adding fleet demand faster than any other single application. Fire-resistant dunnage carries premium pricing alongside.
Gross Margin: 38-48%

Standard Mesh Collapsible Volume

The volume core, competing on price and delivery against regional fabricators with limited engineering differentiation available. Still builds the installed base a service offer depends on, and increasingly supplies assets into pools operated by somebody else entirely. Steel at 47% of cost leaves limited room to price against.
Gross Margin: 16-22%

Fixed Price Platform Agreements

The strategic watch-out, since multi-year automotive contracts at fixed prices convert every coil increase into lost margin across roughly 47% of cost of goods sold. Indexation is spreading and a substantial portion of the installed contract base remains unindexed. Renegotiation happens only at programme renewal points.
Gross Margin: 16-22%

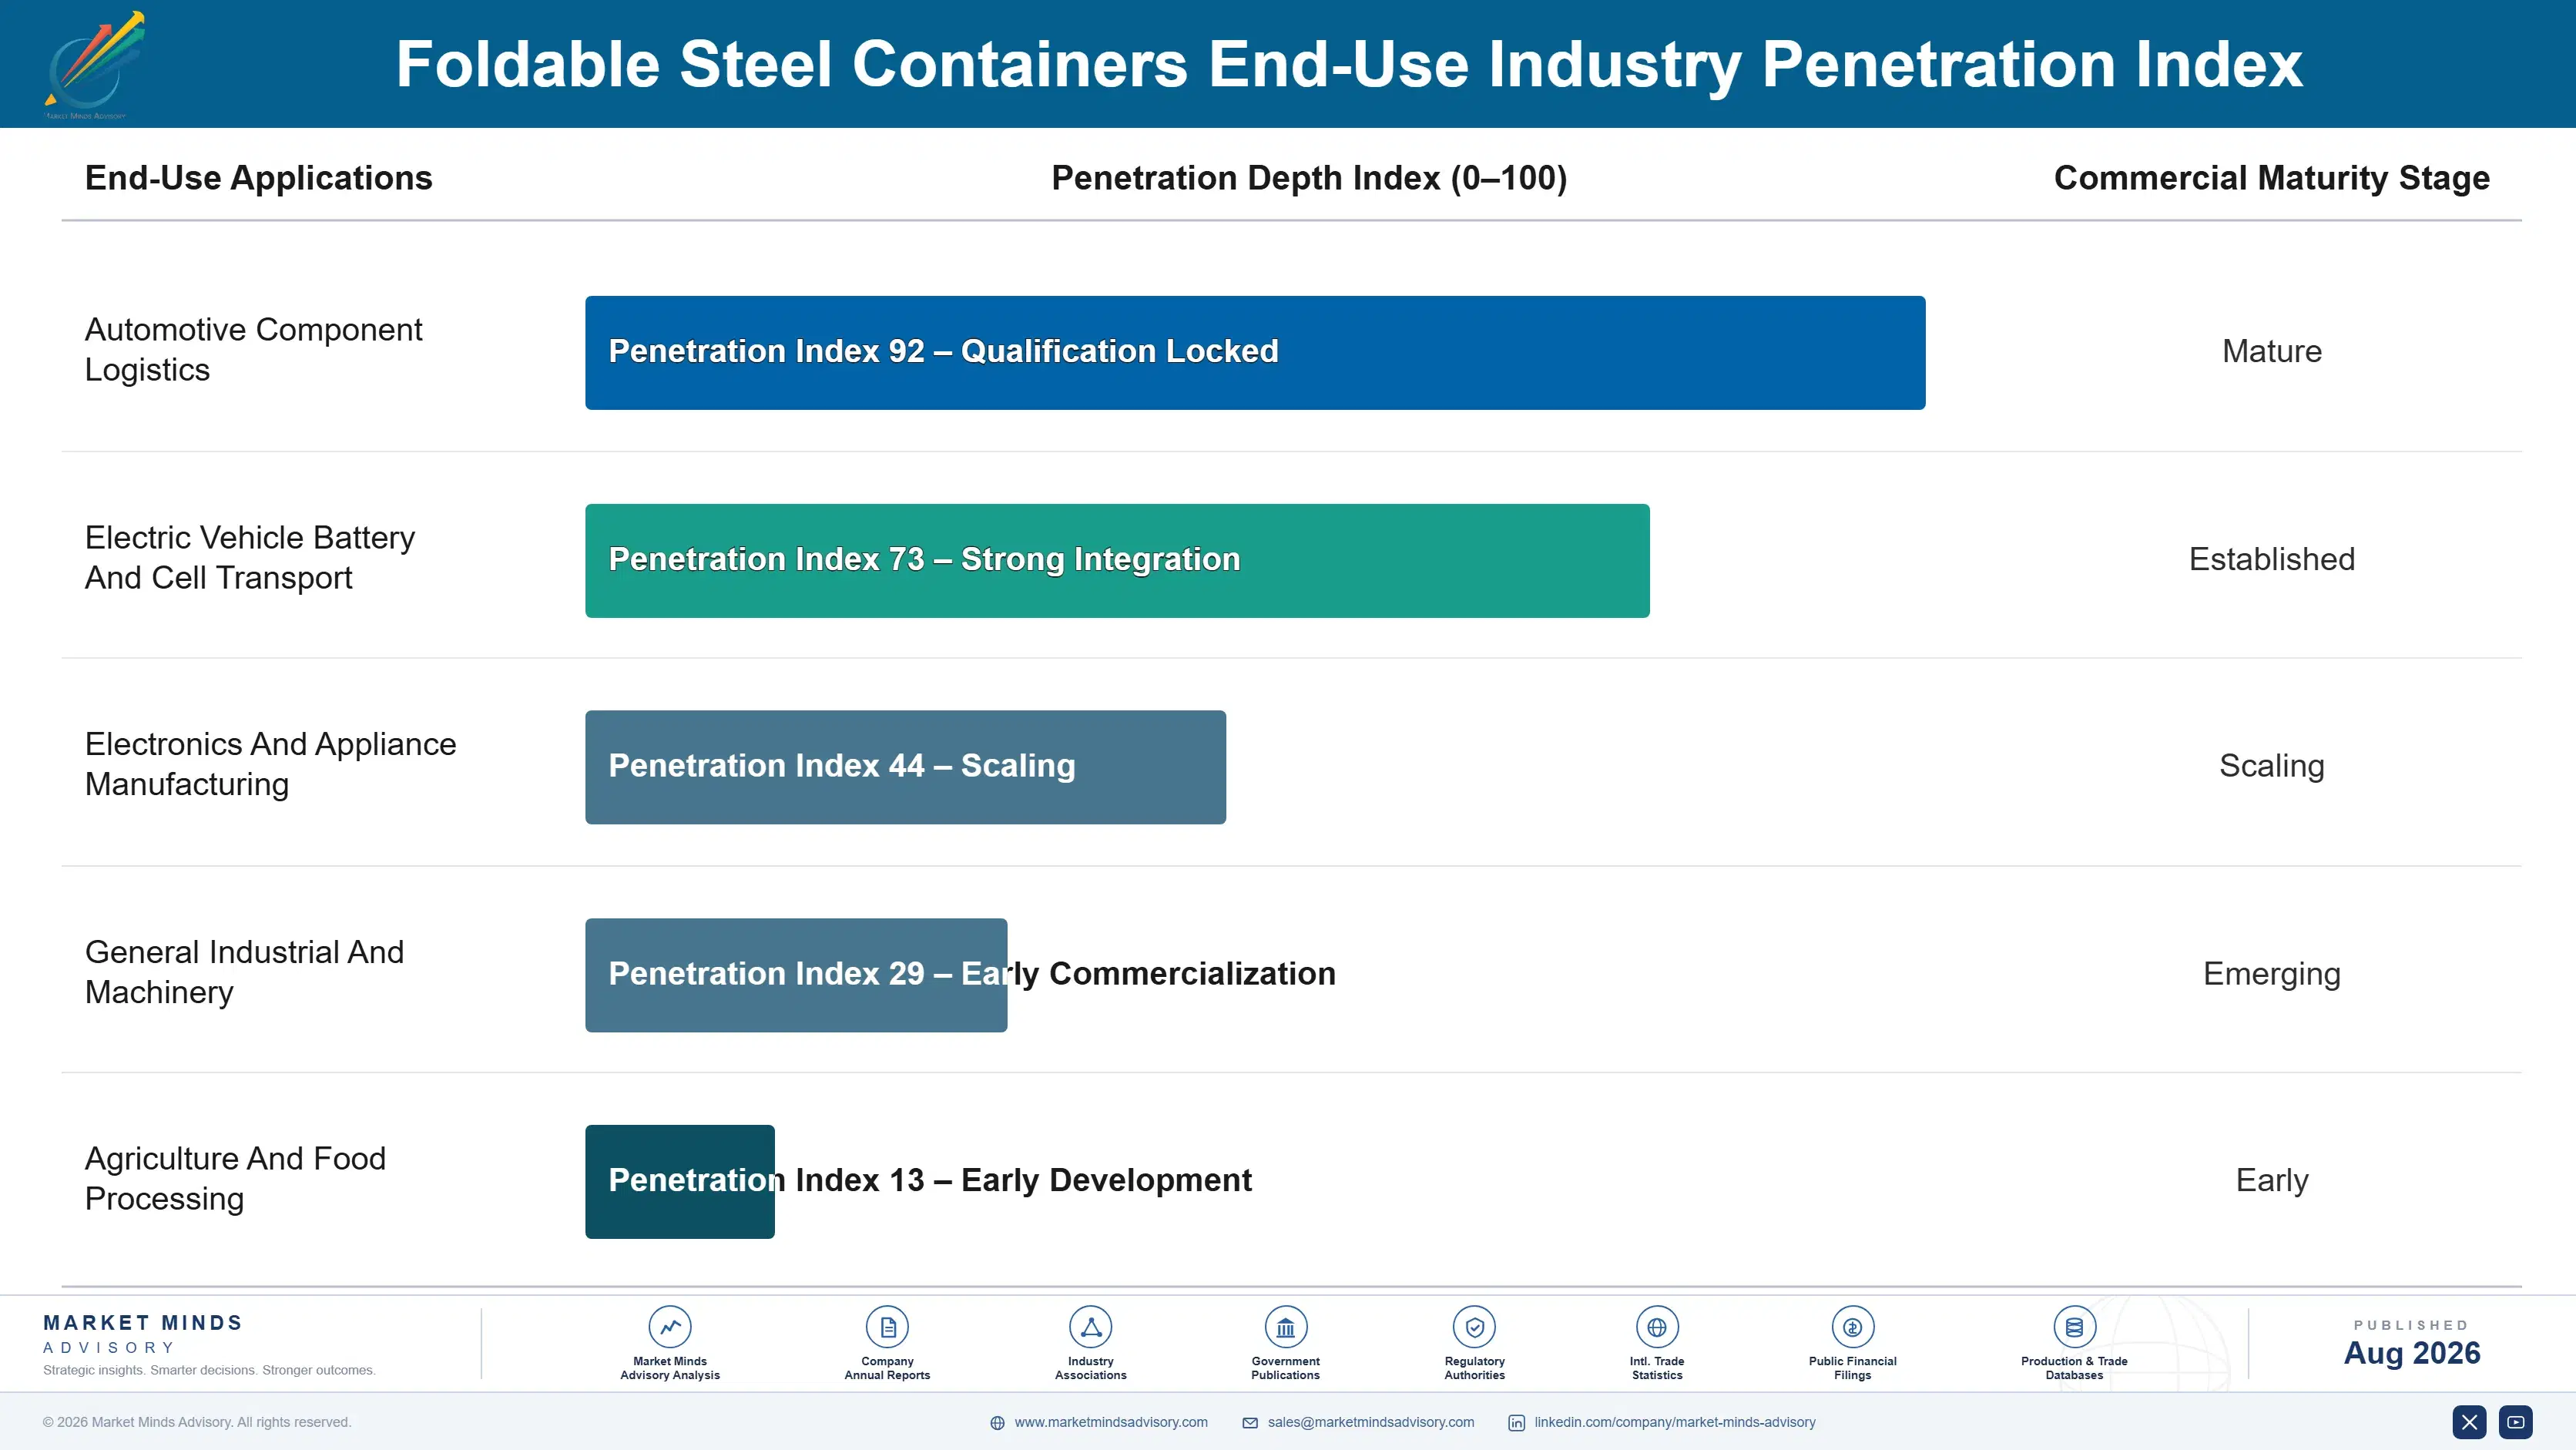
Programme Cycles and Replacement

Revenue arrives in two quite different rhythms. Platform fleet orders are lumpy, large, and specified roughly three years before production starts, then largely absent for the five to seven years a platform runs. Replacement and loss-driven reordering is the annuity underneath, running steadily at close to the 9% annual loss rate, and it is considerably more valuable per unit because it arrives without a competitive tender attached.
Stickiness depends almost entirely on how specific the container is to the component. A container engineered with dunnage around a particular part is very difficult to displace, since a replacement supplier must re-engineer protection and requalify against damage testing. Generic mesh containers stick hardly at all and are retendered routinely. Pooled fleet arrangements are the stickiest of all, because leaving one means physically recovering thousands of containers first.

Buyer profiles moved as packaging decisions shifted from plant logistics managers toward central packaging engineering functions inside vehicle manufacturers. The earlier buyer bought containers. The current one specifies systems, evaluates total cost across a programme life, and increasingly asks who will be responsible for recovering the empties. Total cost of ownership models now include projected loss rather than treating it as an unavoidable overhead.
foldable-steel-containers-market-end-use-penetration-index-1787300396018

What We Would Tell a Board

These are among the four positions where our research anticipates prominent divergence between winners and laggards over the coming forecast period. Each is grounded in the demand model, the regulatory perimeter, and the announced capacity pipeline.
01 / SERVICE REVENUE TRANSITION

Sell circulation, because steel alone will not carry margin

A customer losing roughly 9% of fleet each year and running utilisation near 58% is buying a logistics problem rather than steel, and container unit price is not what they are actually failing at. Pooled arrangements priced per trip or per month carry margins well above fabrication and convert an unmanaged capital loss into a predictable operating cost. Switching cost is also considerable, because leaving a pool means physically recovering and then replacing a whole deployed fleet across dozens of separate supplier sites.
02 / PLATFORM WINDOW TIMING

Miss the specification window and wait most of a decade

Automotive container fleets are specified around three years ahead of start of production, and platform cycles then run five to seven years before the next genuine opportunity arrives at that same customer. Commercial resource spread evenly across the calendar year is largely wasted against a demand pattern that lumpy and that predictable. Tracking platform development schedules and engaging with packaging engineering rather than with purchasing converts at rates that ordinary account coverage never approaches, and the calendars are entirely knowable.
03 / MATERIAL COST INDEXATION

Fixed multi-year pricing hands you every coil increase

Steel carries roughly 47% of cost of goods sold here, so a platform agreement fixed across several years converts each hot rolled coil increase directly into margin loss with no recovery mechanism available anywhere in the contract. Indexation against a published coil benchmark moves that exposure onto a customer who generally indexes their own component contracts already. Buyers resist the clause until the alternative is explained, which is several years of material price risk built into the opening quote instead.
04 / FLEET AUDIT POSITIONING

Count the fleet before quoting the replacement order

Customers routinely order replacement containers against a fleet count that nobody has physically verified in years, and physical audits regularly recover a meaningful share of what had already been written off entirely as lost. Selling an audit costs the customer far less than the replacement order they were about to place, which trades a single sale for a considerably better account position. It also produces the circulation data that turns any later pooling conversation into something concrete rather than theoretical.

Engagement Snapshot From the Field

A live engagement with an industry participant carrying material or product regulatory and market exposure ahead of a defining policy shift, showing how our research translates into a defensible multi-year portfolio strategy.
MARKET MINDS ADVISORY · CLIENT ENGAGEMENT SUMMARY
Foldable Steel Containers Producer Strategic Portfolio Review and Transition Roadmap 2026·Investment Scenario on Foldable Steel Containers Exposure Evaluation 2025-26
CLIENT PROFILE
A returnable steel packaging manufacturer with approximately 154 million dollars in annual revenue (client-reported, unverified by MMA), supplying collapsible containers and custom dunnage across automotive and general industrial customers in two regions. Revenue was almost entirely container sales, service offerings were minimal, and gross margin had declined for three consecutive years despite stable unit volume across the period.
STRATEGIC CHALLENGE
Management attributed the margin decline to competitive pricing pressure from lower-cost regional fabricators and proposed moving fabrication offshore. The board wanted an independent assessment of where margin was actually being lost before committing capital to a relocation that would take years to complete and would be difficult to reverse afterward.
MMA APPROACH
We decomposed margin movement across three years, separating steel cost pass-through from competitive price erosion and mix change. Contract terms were reviewed across the whole automotive platform book to identify fixed against indexed pricing. Customer fleet loss rates were estimated where data existed, and service revenue economics were benchmarked against comparable pooling operators in adjacent markets.
KEY FINDINGS
  1. Steel cost movement on fixed-price platform agreements explained the substantial majority of margin decline, and competitive price erosion accounted for a much smaller share.
  2. The large majority of the automotive contract book carried fixed pricing across multi-year programme lives, with no indexation or material adjustment mechanism at all.
  3. Customer fleet loss rates, where measurable, ran close to the market average, and none of the affected customers had any recovery process in place.
  4. Comparable pooling operators earned gross margins substantially above the client's fabrication business on assets the client was already capable of manufacturing. Service revenue was almost entirely absent.
CLIENT PROFILE
A returnable steel packaging manufacturer with approximately 154 million dollars in annual revenue (client-reported, unverified by MMA), supplying collapsible containers and custom dunnage across automotive and general industrial customers in two regions. Revenue was almost entirely container sales, service offerings were minimal, and gross margin had declined for three consecutive years despite stable unit volume across the period.
STRATEGIC CHALLENGE
Management attributed the margin decline to competitive pricing pressure from lower-cost regional fabricators and proposed moving fabrication offshore. The board wanted an independent assessment of where margin was actually being lost before committing capital to a relocation that would take years to complete and would be difficult to reverse afterward.
MMA APPROACH
We decomposed margin movement across three years, separating steel cost pass-through from competitive price erosion and mix change. Contract terms were reviewed across the whole automotive platform book to identify fixed against indexed pricing. Customer fleet loss rates were estimated where data existed, and service revenue economics were benchmarked against comparable pooling operators in adjacent markets.
KEY FINDINGS
  1. Steel cost movement on fixed-price platform agreements explained the substantial majority of margin decline, and competitive price erosion accounted for a much smaller share.
  2. The large majority of the automotive contract book carried fixed pricing across multi-year programme lives, with no indexation or material adjustment mechanism at all.
  3. Customer fleet loss rates, where measurable, ran close to the market average, and none of the affected customers had any recovery process in place.
  4. Comparable pooling operators earned gross margins substantially above the client's fabrication business on assets the client was already capable of manufacturing. Service revenue was almost entirely absent.
RECOMMENDED STRATEGY
Phase 1: Phase 1 (months one to nine): halt the offshoring assessment and renegotiate platform agreements onto coil-indexed pricing at every available renewal point. Phase 2: Phase 2 (months nine to twenty-four): launch fleet audit and recovery services into the existing automotive customer base as a paid offering. Phase 3: Phase 3 (months twenty-four to forty-two): build a pooled fleet offer from audited accounts, retaining container ownership rather than selling it.
OUTCOME
The offshoring programme was cancelled. Indexed pricing was agreed across a majority of the platform book within four quarters, arresting the margin decline, and the fleet audit service generated its first revenue within two quarters while producing the circulation data needed for pooling discussions (client-reported, unverified by MMA).

Frequently Asked Questions

Foundational context covering the market sizes, CAGR, scope, country, region and competition that inform every finding below. This section is provided to cover basics and most often pre-purchase conversations, answered from the MMA Primary Research Dataset.

What is the current size of the Foldable Steel Containers Market?

The market is valued at USD 2.9 billion in 2025, rising to USD 3.09 billion in 2026. Scope covers collapsible steel transport containers and the fleet services attached to them, but not fixed containers or plastic returnables.

How large will the Foldable Steel Containers Market be by 2036?

MMA forecasts USD 5.75 billion by 2036, an increase of USD 2.66 billion over the 2026 base. That represents an expansion multiple of 1.86 times across the forecast period.

What is the CAGR for the Foldable Steel Containers Market 2026 to 2036?

The base case CAGR is 6.4%, with a bull case of 7.6% and a bear case of 5.2%. The historical rate from 2020 to 2025 was 5.4%, dominated more by steel pricing than by unit volume.

Which segment is growing fastest?

Tracked and pooled container fleet services at 9.6%, exactly 1.50 times the market rate. It addresses annual fleet loss near 9% and utilisation around 58%, which is what buyers actually lose money on.

Who are the major companies in the Foldable Steel Containers Market?

SSI Schaefer, Gebhardt Logistic Solutions, Nefab, Cabka, and Bito Lagertechnik lead on annual container units shipped. The top five hold 34%, across fabricators, packaging specialists, and pooling operators.

Which country is growing fastest?

India at 8.8%, where automotive component manufacturing is being established rather than relocated. New supplier networks specify returnable packaging from the outset in a way retrofitted supply chains rarely manage.

Report Segmentation Architecture

The full report scope spans multiple orthogonal segmentation dimensions, with cross-tabulated demand data provided for each dimension pair. Coverage extends further to regional breakdowns, trend trajectories, and the competitive detail needed to support segment-level decision-making.

By Container Construction And Arrangement

  • Welded Mesh Collapsible Containers
  • Sheet Steel Folding Containers And Stillages
  • Steel-Framed Hybrid Containers
  • Custom Dunnage-Fitted Containers
  • Tracked And Pooled Fleet Services

By End-Use Industry

  • Automotive Component Logistics
  • Electric Vehicle Battery And Cell Transport
  • Electronics And Appliance Manufacturing
  • General Industrial And Machinery
  • Agriculture And Food Processing

By Commercial Model

  • Outright Purchase By End User
  • Pooled Fleet Service Per Trip
  • Long-Term Rental And Leasing
  • Customer-Owned Supplier-Managed Fleets
  • Aftermarket Repair And Refurbishment

By Region

  • East Asia
  • Western Europe
  • North America
  • South Asia and Pacific
  • Latin America
  • Middle East and Africa
  • Eastern Europe

Scope, Methodology, and Coverage

Every figure in this report is reproducible from documented input assumptions. The scope below maps the historical period, the forecast horizon, the segmentation dimensions, and the countries covered, alongside the underlying primary and qualitative methodology.
Historical Period
2020 to 2025
Forecast Period
2026 to 2036
Base Year
2025 (USD billions; MMA Primary Research Dataset, August 2026)
Market Definition
This market comprises collapsible and foldable steel transport containers used in returnable industrial logistics, measured at manufacturer and service provider revenue across container sales, rental, and pooled fleet arrangements. Coverage spans welded mesh collapsible containers, sheet steel folding containers and stillages, steel-framed hybrid containers combining steel structure with alternative panel materials, custom dunnage-fitted containers engineered around specific components, and tracked or pooled fleet services. Fixed non-folding steel containers, all-plastic returnable containers, timber and corrugated packaging, intermodal shipping containers, bulk liquid containers, and warehouse racking systems fall outside scope.
Quantitative Units
USD billions (current prices); container units shipped annually; deployed fleet size; utilisation and annual loss rates
Segmentation Dimensions
By Container Construction And Arrangement; By End-Use Industry; By Commercial Model; By Region
Regions Covered
East Asia, Western Europe, North America, South Asia and Pacific, Latin America, Middle East and Africa, Eastern Europe
Countries Covered
China, Japan, South Korea, Germany, France, Italy, Spain, United Kingdom, United States, Canada, Mexico, Brazil, India, Thailand, Australia, Poland, Czechia, Slovakia, Saudi Arabia, South Africa, and additional markets relevant to this sector
Key Companies Profiled
SSI Schaefer, Gebhardt Logistic Solutions, Nefab, Cabka, Bito Lagertechnik, Georg Utz Holding, Brambles, Schoeller Allibert, Myers Industries, DS Smith, Rehrig Pacific, Craemer Group, Werner Weitner, K. Hartwall, Steel King Industries, Buckhorn, Sanko, Wanzl, Kyoraku, Tri-Pack Plastics
Quantitative Methodology
Primary survey, n=3,800 respondents, Q4 2025, six countries; demand-side model with trade association cross-validation
Qualitative Methodology
47 expert interviews, Q4 2025; applied to validate demand model assumptions, identify emerging dynamics, and assess competitive positioning
Report Format
PDF and XLSX data workbook (Word format preview document)
Publisher
Market Minds Advisory
Report Code
MMA-2026-PAC-567
Published
August 2026
Contact
sales@marketmindsadvisory.com | www.marketmindsadvisory.com

Purchase the full Foldable Steel Containers Market Report (2026 to 2036).

The full report sizes foldable steel containers across five construction and arrangement types, five end-use industries, five commercial models, and seven regions, with fleet loss and utilisation quantified separately from unit shipment volume. Steel cost pass-through is analysed against contract structure, since fixed multi-year platform pricing explains more margin movement in this market than competitive pricing does. Automotive platform specification timing is mapped against programme cycles. Competitive profiling covers twenty companies on annual container units shipped. Pooled fleet service economics are benchmarked against container fabrication.
Fleet loss and utilisation quantified against shipment volume
Steel cost pass-through analysed by contract structure type
Platform specification timing mapped across automotive programme cycles
Pooled service economics benchmarked against container fabrication margins
Battery logistics containment requirements assessed by cell format
Hybrid construction weight savings compared against load rating

Built For The People Who Decide

From boardroom strategy to bench-side execution, this report is read cover-to-cover by leaders shaping the next decade of their industry, turning demand scenarios, market dynamics and valuation benchmarks into decisions.
CXOs/ Presidents/ VPs/ Managers
M&A and Corporate Development
Strategy Teams and R&D Heads
Procurement and Product Directors
Regulatory and Compliance Leaders
Investor Relations and Equity Analysts