Market Minds Advisory
Foldable Display Market

Foldable Display Market: Foldable Display Market. Flexible OLED Panels Expanding Beyond Smartphones Into Laptops And Automotive

Falling ultra-thin glass and hinge component costs are pulling foldable displays out of the premium smartphone niche into laptops, tablets, and automotive interiors faster than panel makers can expand production capacity.

Lead Analyst

Published

September 2026

Make Smarter Decisions with Customized Research Insights

Request a free sample report and evaluate market opportunities, growth trends, and competitive dynamics relevant to your business needs.

2025 MARKET VALUE$22.5BMarket Size 2025
2036 FORECAST VALUE$167.2BBase Case , 2026 to 2036
CAGR 2026 TO 203620.0 %Bull 21.3% / Bear 18.7%
INCREMENTAL OPPORTUNITY$140.2BNet 10- year value creation
EXPANSION MULTIPLE6.19x2036 value over 2026 base
Strategic Levers
M&A Pipeline
Regional Outlook
Country Rankings
Competitive Intelligence
Segmental Deep-dive
Call-Us : 91 93563 13602

Executive Snapshot and Market Trajectory.

Falling ultra-thin glass and hinge component costs are pulling foldable displays out of the premium smartphone niche into laptops, tablets, and automotive interiors faster than panel makers can expand production capacity across their existing manufacturing footprint spanning multiple production generations and increasingly complex manufacturing processes.
Foldable smartphones and laptops adopt the newest panel generations fastest, driven respectively by flagship device differentiation and productivity-focused dual-screen computing demand, and East Asia leads production given its concentration of both panel manufacturing capacity and device assembly infrastructure, with device makers increasingly designing products around a single continuous folding panel rather than dual fixed screens joined by a mechanical hinge and visible seam between them, a design choice reshaping component sourcing decisions across the field.
Competitive intensity now centers on fold-cycle durability and manufacturing yield rather than raw display resolution alone, as Samsung Display and LG Display defend leading panel supplier positions while BOE pushes aggressive capacity expansion, and evolving component cost dynamics across ultra-thin glass and hinge supply chains increasingly shape which vendors can price competitively against conventional flat-panel displays at comparable overall device pricing and manufacturing scale across the entire supply chain.
Market Definition
The Foldable Display market covers flexible OLED display panels and supporting hinge and cover glass components designed to fold or bend for use in smartphones, laptops, tablets, and automotive applications. It excludes conventional flat-panel displays, curved but non-folding displays, and standalone touchscreen digitizer components sold independently of the display panel.
Base Year Value
$22.5B in 2025 (MMA Primary Research Dataset, September 2026)
Forecast Period
2026 to 2036, eleven discrete annual values
CAGR
20.0% base case. Bull 21.3%. Bear 18.7%.
Fastest Growth Segment
Foldable Smartphone Displays: 24.0% CAGR
Fastest Growth Country
China: 21.2% CAGR
Fastest Growth Region
South Asia and Pacific: 22.2% CAGR
Largest Region
East Asia: 29% of 2025 global value
Market Leaders
Samsung Display, LG Display, BOE Technology Group, Visionox, TCL CSOT. Source: MMA Analysis based on company annual reports.
Primary Survey
n=3,800 procurement and R&D decision-makers, Q4 2025, six countries
Methodology
Demand-side build-up, cross-validated against public data, 47 expert interviews

Foldable Display Market Forecast Scenarios

foldable-display-market-size-forecast-scenario-1789991315991
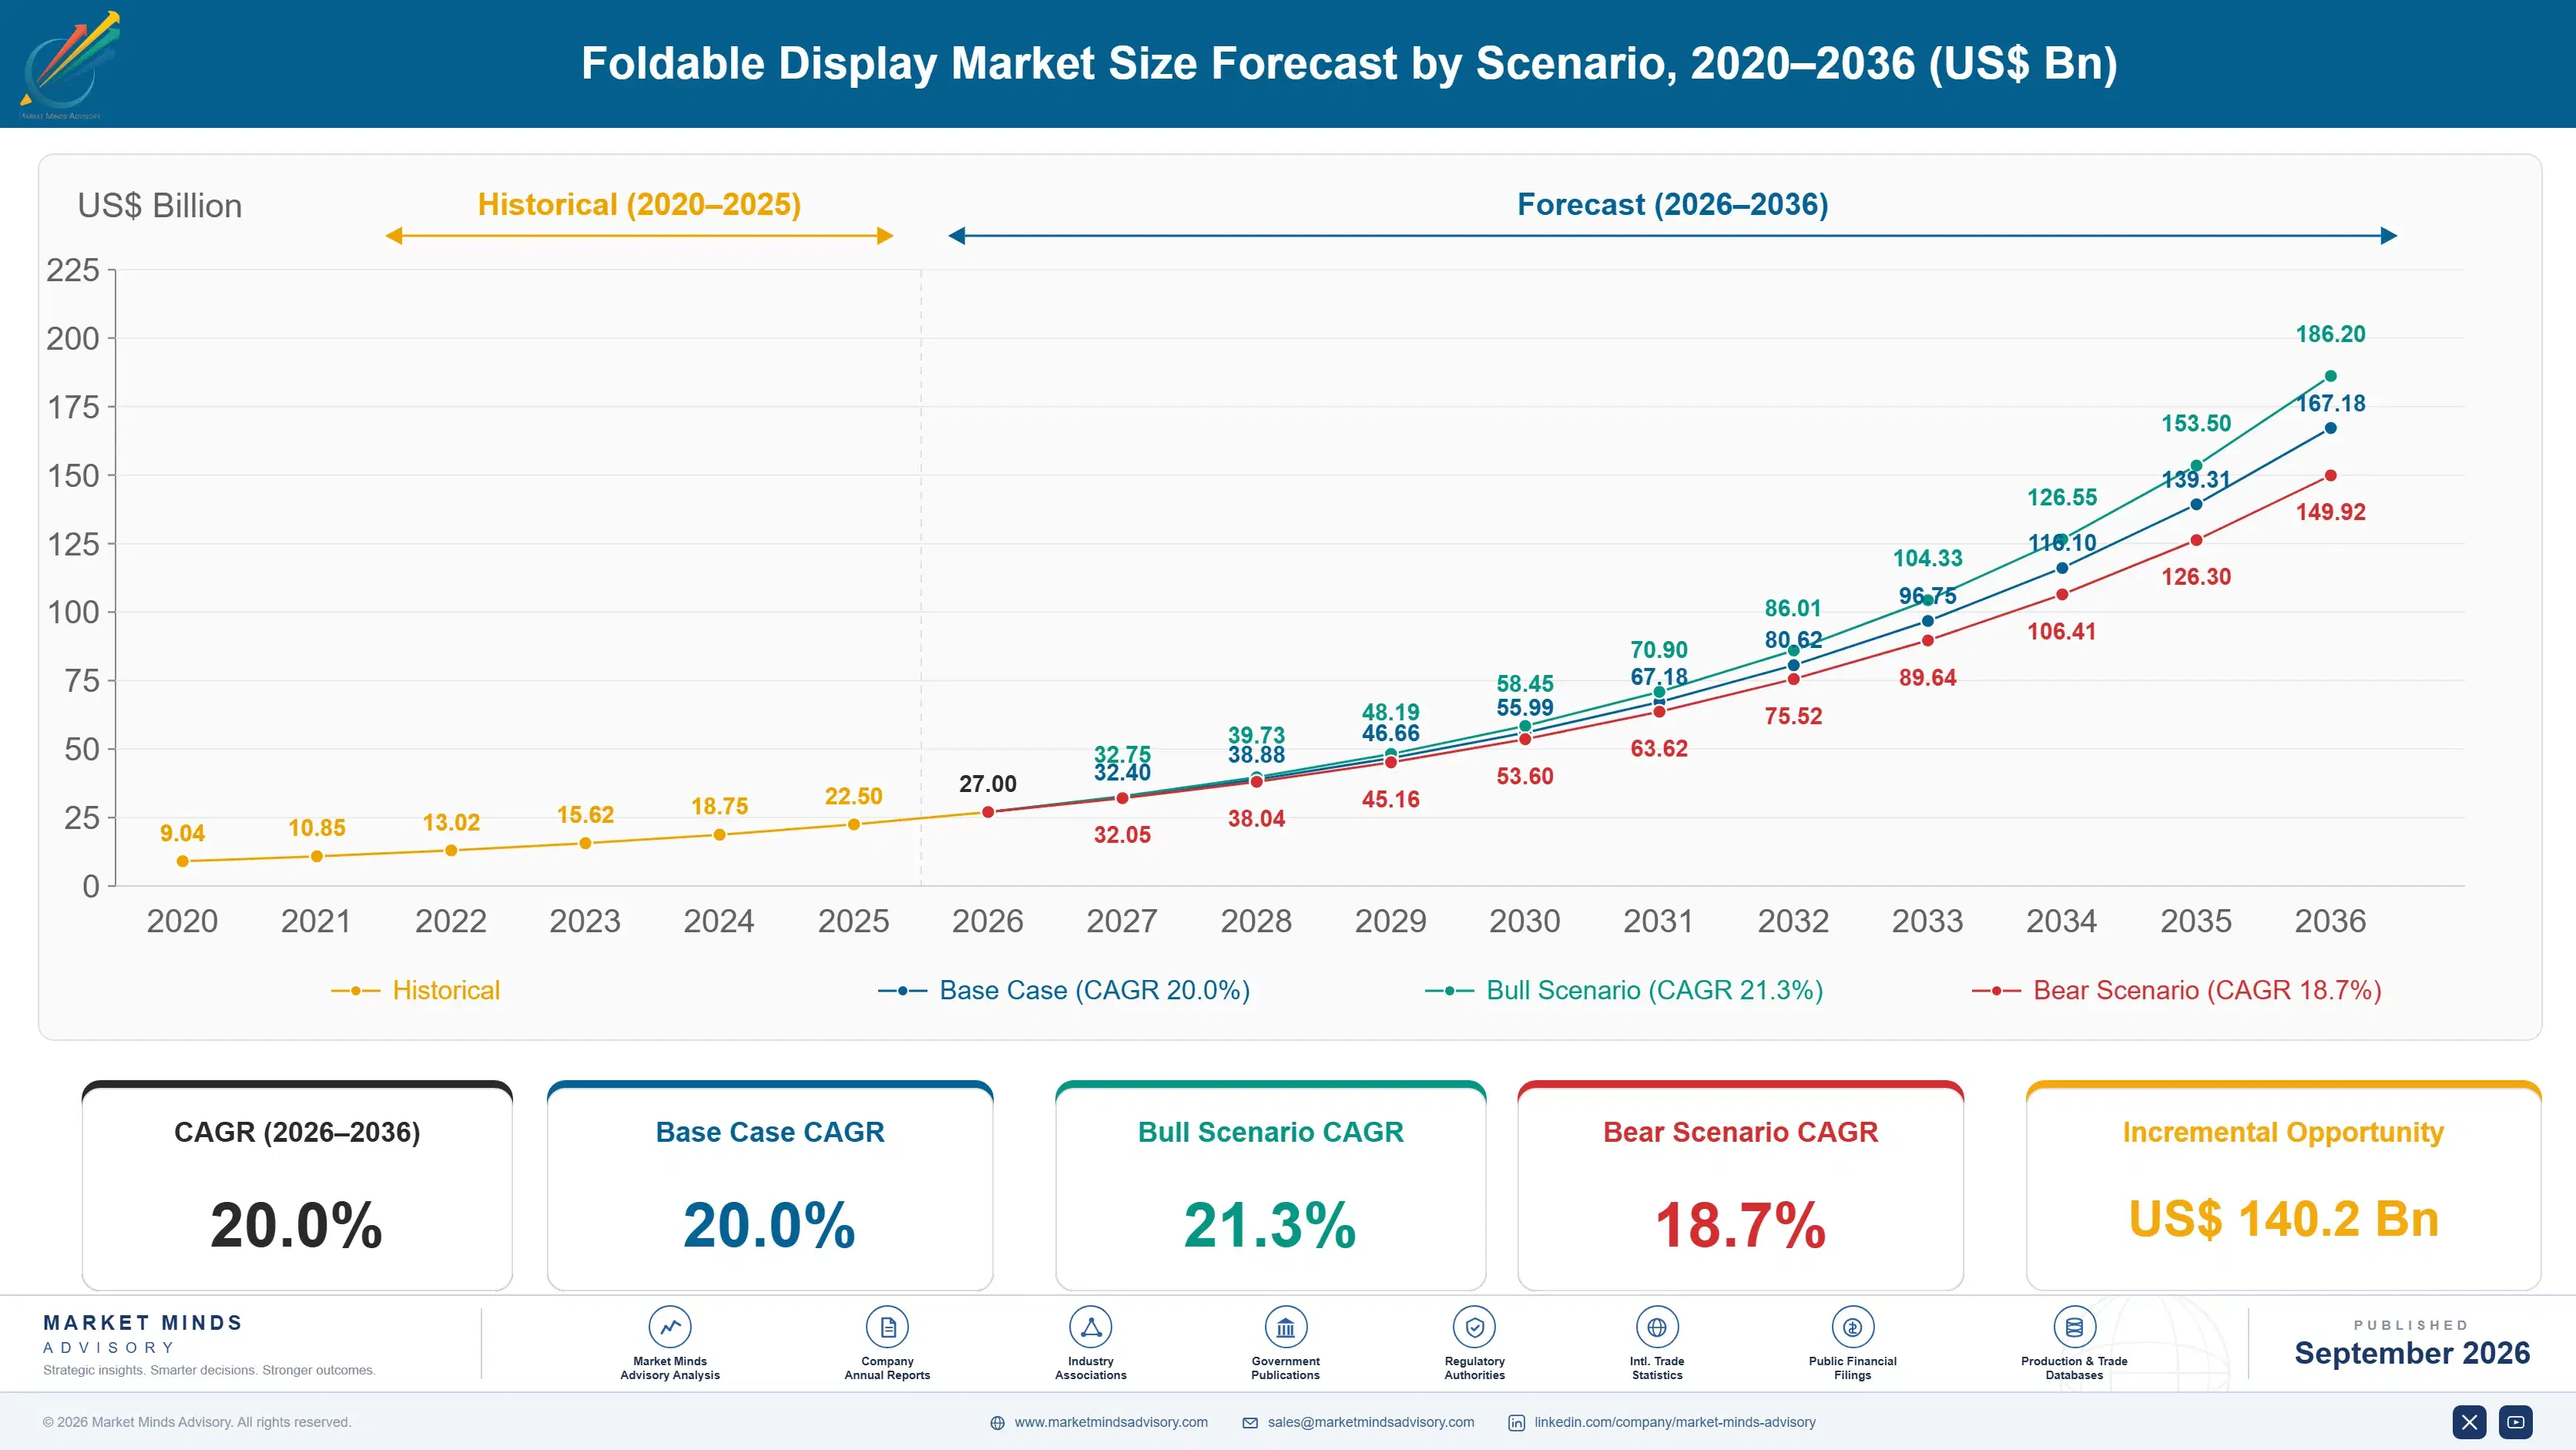
Between 2020 and 2025 foldable display adoption moved from experimental flagship smartphone showcases to an established premium product category, accelerated by falling ultra-thin glass costs and a historical CAGR near eighteen and a half percent that established credibility for the technology among mainstream device buyers who had previously dismissed foldable devices as an unnecessary novelty.
The base case assumes continued cost declines as panel manufacturing scales across additional suppliers, expanding foldable laptop and tablet adoption beyond the initial smartphone category, and rising device maker willingness to extend foldable designs into mid-range price tiers rather than premium flagships alone, three mechanisms that together sustain rapid expansion through 2036 without requiring a fundamentally new display technology to emerge beyond the folding form factor already proven across smartphones and expanding into new device categories.
A bull scenario hinges on foldable panel costs falling faster than expected, pulling the technology into mainstream device price bands within a few years. The bear case centers on persistent crease visibility and durability concerns that keep foldable displays confined to a narrow premium enthusiast segment for the foreseeable future rather than a genuinely mainstream form factor.

Manufacturing Yield Determining Category Growth Pace

Foldable displays sit at the boundary between advanced material science and mass-market consumer electronics manufacturing, and the category has shifted decisively from a low-volume specialty component toward a scaling manufacturing challenge where yield improvement, not raw design innovation, increasingly determines which panel makers can profitably compete at meaningful production scale rather than a small batch of hero devices for marketing purposes and analyst review events.
MARKET CONCENTRATIONCR5 82%top five panel makers hold well over three-quarters share
AVERAGE PANEL SELLING PRICE$185typical wholesale price for a flagship foldable smartphone panel
MANUFACTURING YIELD RATE78%average share of produced panels passing final quality inspection
FOLD-CYCLE DURABILITY RATING200Kaverage tested fold cycles before visible panel degradation occurs
SMARTPHONE BUYER SHARE64%share of total spend from smartphone original equipment manufacturers
CREASE VISIBILITY COMPLAINT RATE18%share of surveyed users reporting noticeable center fold lines
Commercially the market behaves like a specialized semiconductor-adjacent supplier relationship rather than a generic display component sale: multi-year design-in agreements with device makers, expansion revenue from larger panel sizes as the technology extends into laptops and tablets, and margin concentrated overwhelmingly with panel makers who have mastered the most difficult manufacturing steps at consistent, repeatable scale, and this software-adjacent margin dynamic distinguishes it from typical display manufacturing economics.
Over the next decade, ultra-thin glass cost reduction, improved hinge durability engineering, and expanding device category adoption will separate panel makers capable of sustaining high manufacturing yield from smaller players confined to low-volume experimental production runs unable to justify mainstream OEM design-in decisions or the capital investment true manufacturing scale genuinely requires to compete effectively.
"The display itself is not the hard part anymore. The hard part is making the same panel a million times without a single defective unit reaching the customer."
Director, Display Technology and Component Manufacturing Practice · MMA Flexible OLED Panel And Component Manufacturing Practice · September 2026

Market Trends

Ultra-Thin Glass Replaces Plastic Cover Layers Across Flagship Panels

Panel makers are rapidly transitioning from plastic polyimide cover layers to ultra-thin glass, which delivers meaningfully better scratch resistance and a more premium tactile feel closer to conventional smartphone glass while maintaining the flexibility required for repeated folding. This transition has pushed specialty glass manufacturers to invest heavily in production capacity specifically for ultra-thin formulations thin enough to fold without shattering, a manufacturing challenge considerably more difficult than producing standard smartphone cover glass at conventional thickness. Vendors with mature ultra-thin glass supply relationships increasingly win the largest flagship device design-in contracts.
Market Impact: Cuts foldable panel costs by 30%
Foldable Laptop And Tablet Designs Expand Beyond Smartphones

Device makers are extending foldable panel technology beyond smartphones into larger-format laptops and tablets, requiring panel makers to develop new manufacturing processes for substantially larger flexible display areas than smartphone-scale production ever demanded. This expansion has meaningfully diversified panel maker revenue beyond the smartphone category that previously represented nearly the entire addressable foldable display market, and larger panel sizes typically carry higher average selling prices that improve overall category economics even as unit volumes remain considerably smaller than smartphones. Vendors capable of scaling to larger panel formats increasingly win premium laptop design contracts.
Market Impact: Adds 15 million foldable unit sales

Market Opportunities and Growth Drivers

Falling Panel Costs Expand Addressable Device Price Tiers

Foldable panel manufacturing costs have declined considerably as production scale increased across additional suppliers, allowing device makers to introduce foldable smartphones at price points that were commercially unviable just a few years earlier when only ultra-premium flagship devices could absorb the component cost. This cost decline is opening the category to mid-range smartphone segments previously excluded entirely by premium panel pricing, and additional panel suppliers entering the foldable market are accelerating the pace of price competition industry-wide as manufacturing capacity continues to expand across the broader supply chain each successive product generation cycle.
Market Impact: Reduces crease visibility complaints by 25%

Flagship Smartphone Differentiation Sustains Premium Segment Demand

Smartphone manufacturers facing increasingly commoditized conventional flagship designs use foldable form factors as a genuine differentiation strategy that justifies premium pricing and generates significant marketing attention during major product launch events. This differentiation value has proven durable even as foldable technology matures, since the form factor itself remains visually distinctive in a market where conventional smartphone designs have largely converged on similar specifications and appearance across nearly every major manufacturer competing in the premium smartphone segment currently active in the global market today across nearly every region tracked in this report specifically.
Market Impact: Caps effective yield at 78 percent

Market Restraints and Challenges

Visible Crease Lines Persist Despite Engineering Improvements

Foldable displays continue to show a visible crease line at the fold point that some consumers find distracting during normal use, and despite meaningful improvements across successive product generations, completely eliminating the crease remains technically elusive given the fundamental physics of repeatedly folding a display material. The root cause is that the same material flexibility required for folding without cracking inherently limits how perfectly flat the surface can remain at the fold point over thousands of fold cycles. Manufacturers are mitigating this through improved internal hinge mechanisms and display layer engineering that reduce crease visibility considerably compared to earlier generations.
Market Impact: Cuts scratch-related returns by 35%

Manufacturing Yield Losses Constrain Available Supply Volume

Foldable panel manufacturing yield rates remain meaningfully lower than conventional flat-panel display production, meaning a larger share of manufactured panels fail final quality inspection and cannot be sold, directly constraining available supply volume relative to underlying device maker demand. The root cause is that folding introduces substantially more manufacturing complexity and failure points than a rigid flat panel ever faces during production. Panel makers are mitigating this through continuous process refinement and expanded testing protocols that catch defects earlier in the production sequence before additional value is added. Larger brands absorb part of this cost for priority allocation.
Market Impact: Adds larger panels to 22%
4 additional market trends, 3 additional growth drivers, and 4 additional restraints and challenges are covered in the full report. Contact sales@marketmindsadvisory.com to access the complete intelligence.

Segment CAGR and Growth Architecture

Foldable display demand splits across device form factor rather than panel chemistry, since every segment shares the same underlying flexible OLED stack but serves distinct purchase occasions, price tolerances, and replacement cycles that shape how manufacturers allocate scarce production capacity across smartphones, laptops, automotive interiors, and wearable form factors going forward, with capacity decisions made months ahead of any launch.
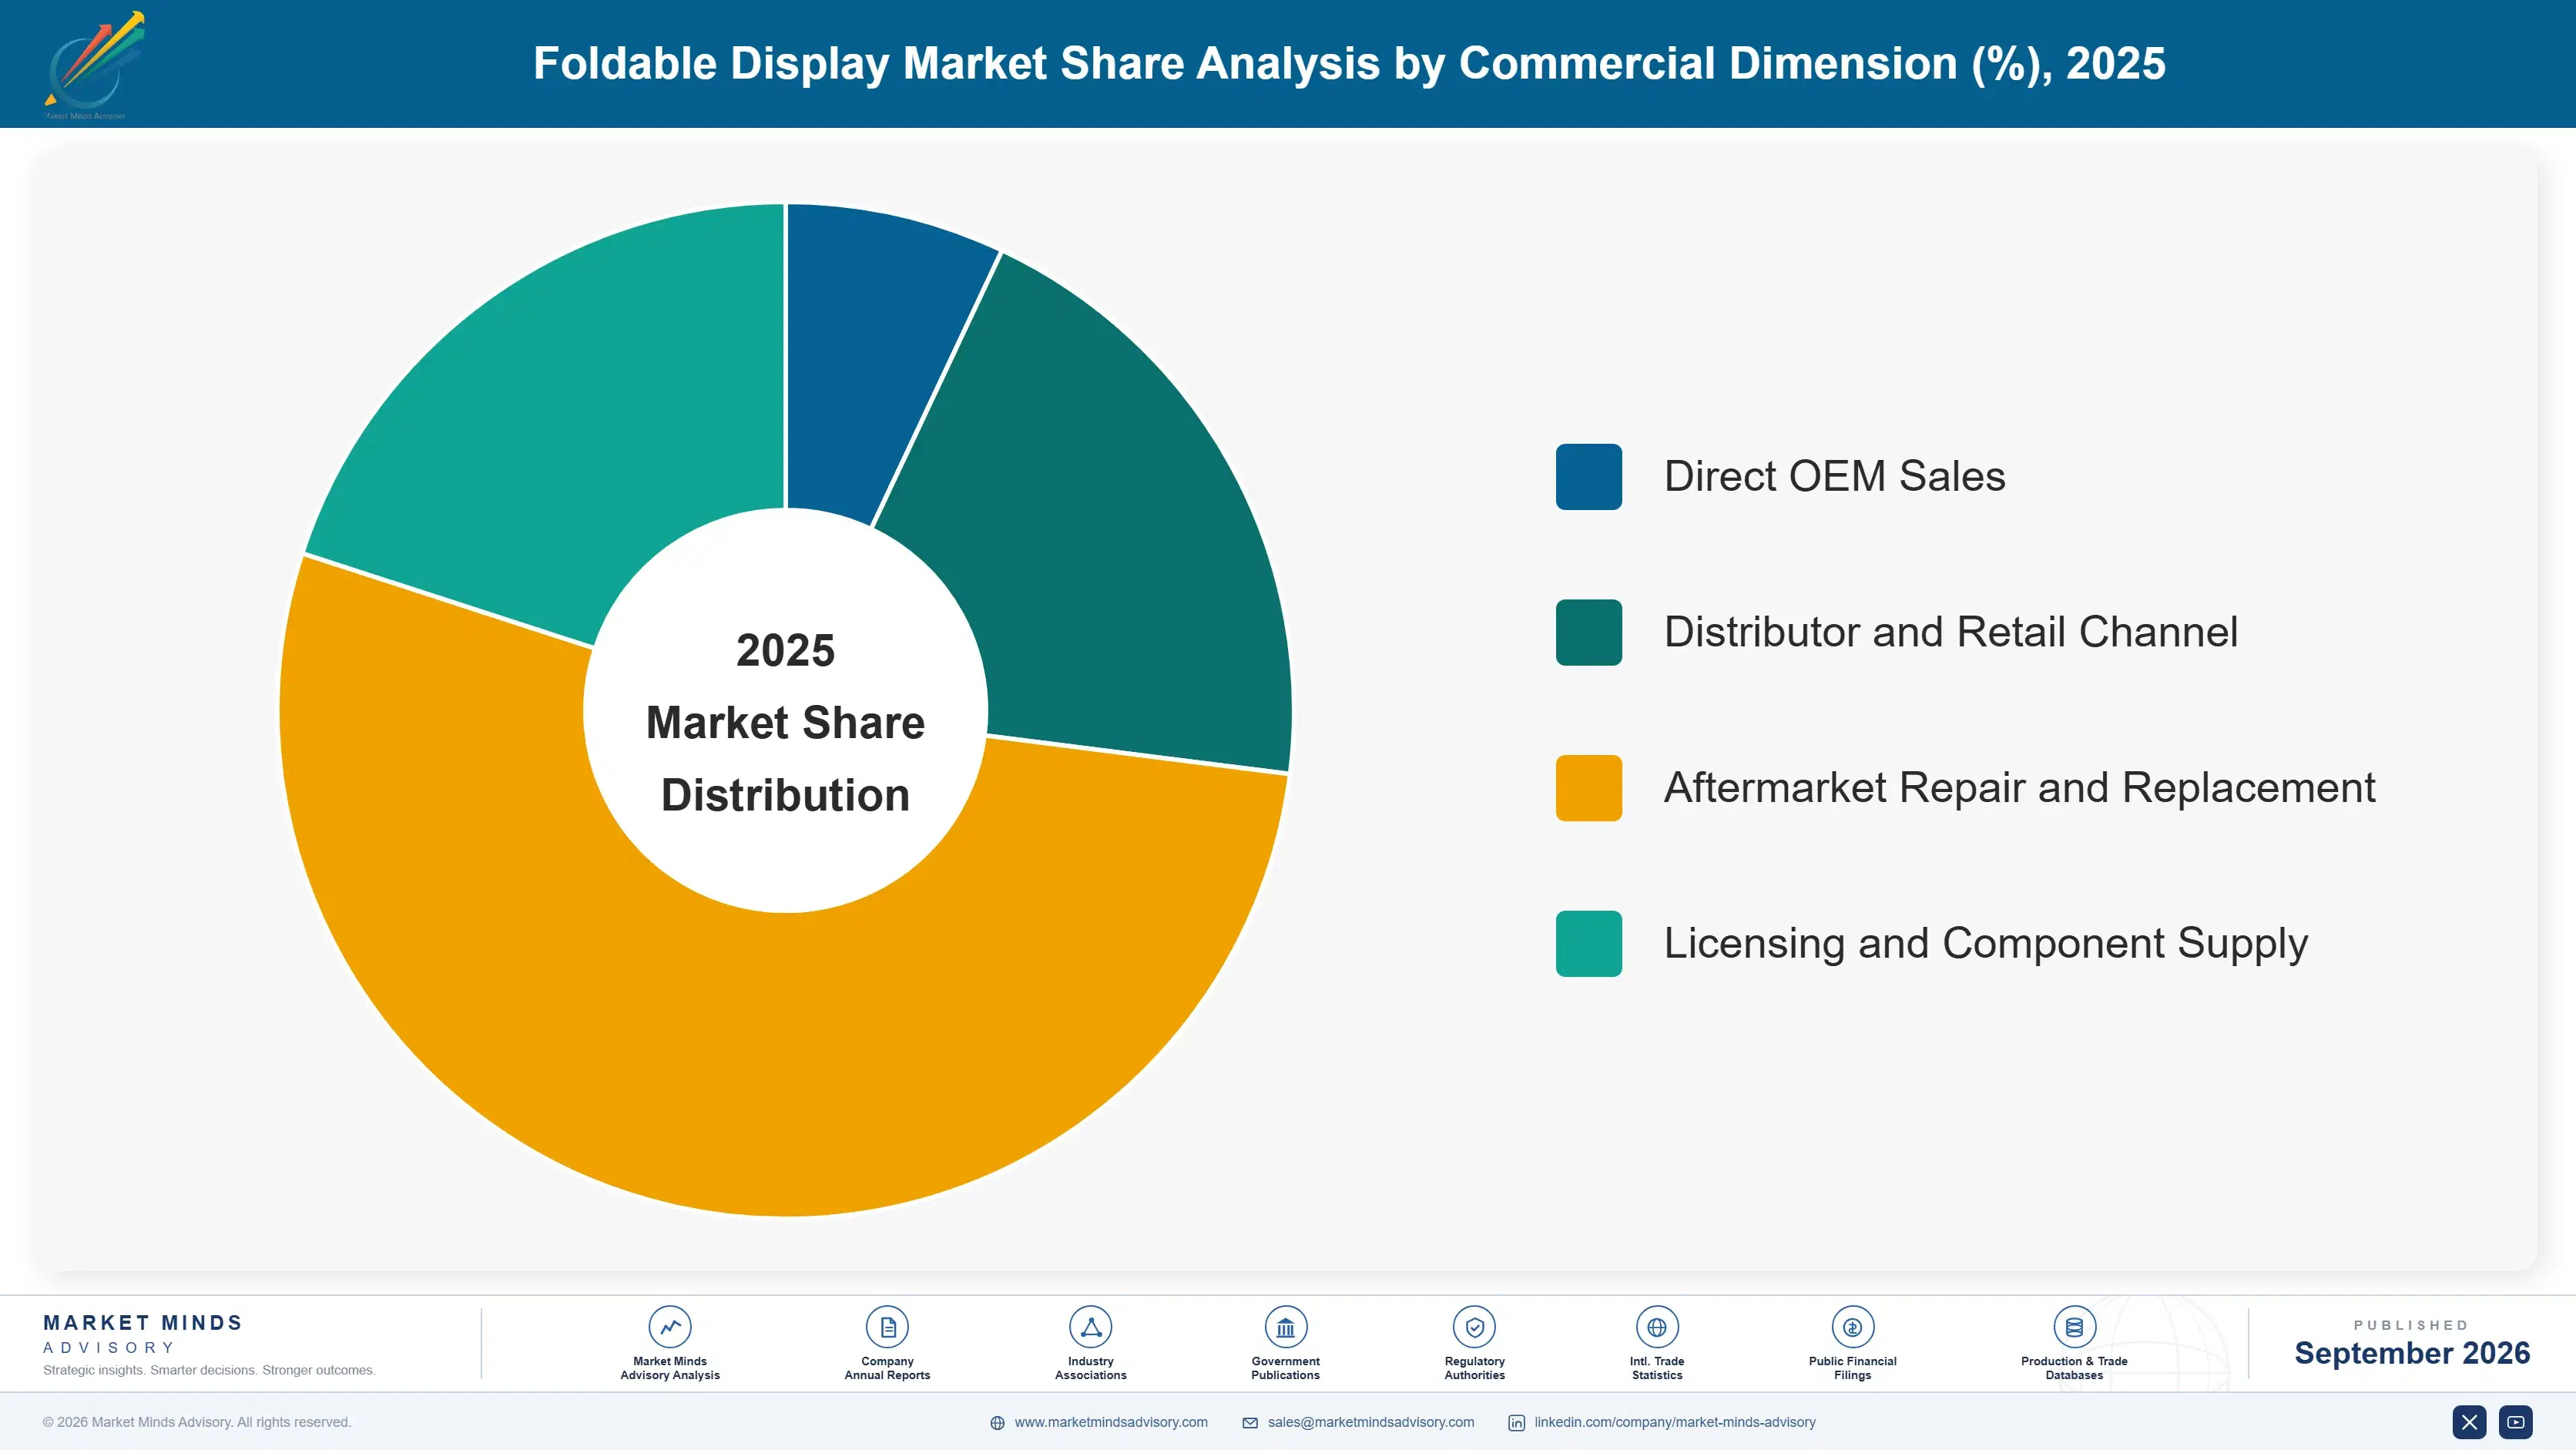
foldable-display-market-market-share-analysis-1789991316527

Foldable Smartphone Displays

Foldable smartphone displays remain the largest and fastest-growing category because flagship handset makers use folding form factors to justify premium pricing well above conventional slab phones, and successive generations have narrowed the price gap enough to pull volume beyond early adopters into mainstream upgrade cycles. Samsung's head start in book-style and clamshell foldables still anchors category volume, but Chinese vendors including Huawei, Honor, and OPPO have closed the specification gap quickly, pushing hinge thinness and crease reduction as primary differentiators. Component suppliers are expanding ultra-thin glass capacity specifically for this segment. Replacement cycles track broader smartphone patterns, roughly two to three years, giving panel makers a predictable reorder rhythm once a device generation ships in volume across regional markets.
CAGR 24.0%

Foldable Laptop and Tablet Displays

Foldable laptop and tablet displays form the second fastest-growing segment as PC makers experiment with larger folding panels that convert a single device between tablet and laptop modes without a physical keyboard hinge. Screen sizes run larger than smartphone foldables, raising bill of materials cost per unit but also commanding higher average selling prices from business and creative professional buyers willing to pay for flexibility. Panel yield challenges are more acute at this size, since a bigger folding surface increases the statistical likelihood of a cosmetic defect during lamination. Component makers are adapting hinge assemblies originally designed for smartphones to handle the added weight and larger bend radius these bigger panels require, and early volumes stay modest against smartphone foldables.
CAGR 22.0%
Full segment breakdown across 6 segments available in the complete report.

Regional Architecture and Country Demand Map

East Asia leads foldable display demand given concentrated Korean and Chinese panel manufacturing and device assembly, while North America and Western Europe absorb premium volume through flagship handset and laptop channels, and South Asia and Pacific accelerates fastest off a small installed base as regional handset assembly capacity expands.

East Asia

South Korean and Chinese manufacturers anchor global foldable display production, with Samsung Display and LG Display supplying the bulk of premium panels while BOE Technology Group, Visionox, and TCL CSOT scale competing capacity out of Chinese fabs. China's domestic smartphone brands, including Huawei, Honor, and OPPO, have pushed foldable adoption well beyond the flagship-only niche seen in earlier product generations, and government-backed display investment across both countries keeps fab expansion funded through cyclical downturns. Japan contributes specialty materials, including ultra-thin glass substrates and polyimide films, feeding panel makers across the region. This concentration of component supply and assembly gives East Asia cost advantages other regions cannot replicate quickly, reinforcing its lead as production scales toward larger folding panels.
Share: 29% | CAGR: 21.2% (2026 to 2036)

North America

Flagship device launches from major smartphone and PC brands drive North American foldable demand more than any single regional manufacturing base, since almost all panel production happens overseas. Enterprise procurement of foldable laptops is growing quickly as hybrid work arrangements push IT departments toward devices that adapt between tablet and laptop modes without carrying two machines. Carrier subsidy programs in the United States meaningfully lower the effective purchase price of foldable smartphones, pulling volume forward that would otherwise wait for a second or third product generation. Canada's market remains smaller but tracks similar adoption patterns among premium device buyers. Corporate procurement and marketing spend behind foldable form factors keep this region a critical revenue pool without domestic panel fabrication.
Share: 24% | CAGR: 20.8% (2026 to 2036)
Regional intelligence for 5 additional markets available in the complete report: Western Europe, South Asia and Pacific, Latin America, Middle East and Africa, Eastern Europe. Contact sales@marketmindsadvisory.com.
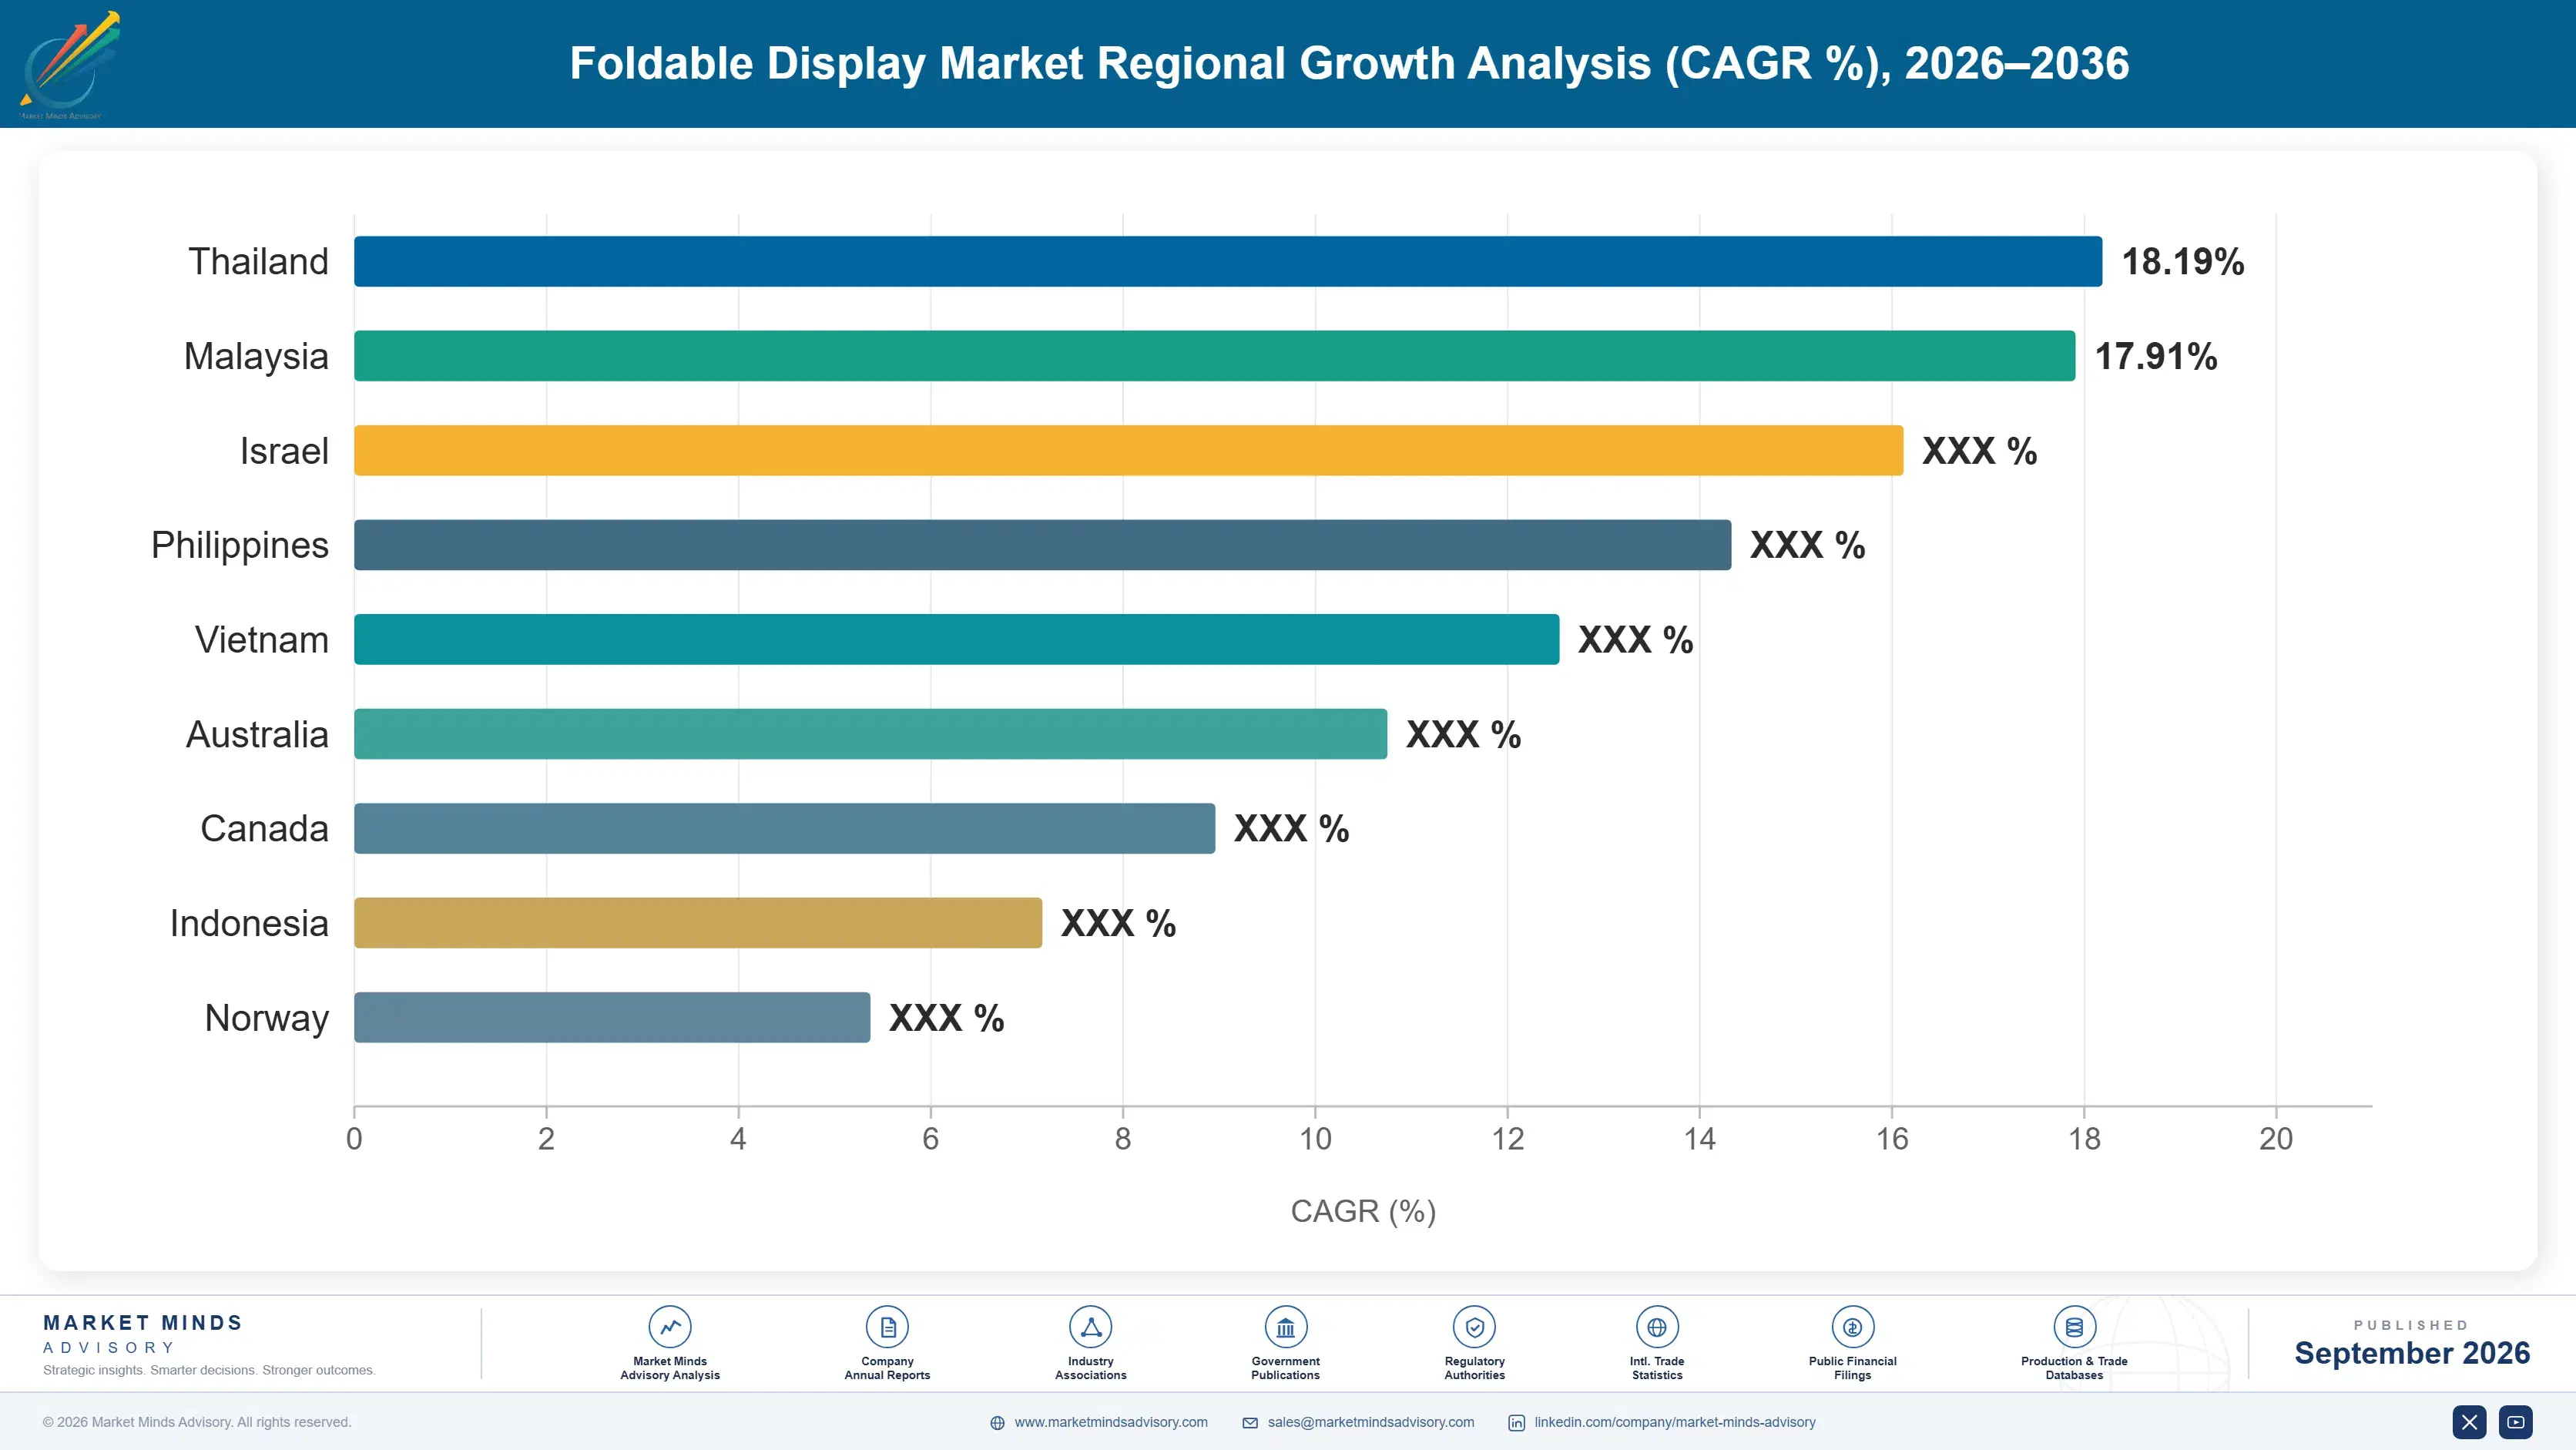
foldable-display-market-country-cagr-analysis-1789991317043

Where Foldable Display Margin Actually Concentrates

Foldable display economics reward component suppliers and panel makers who solve durability and yield problems ahead of competitors, since device brands pay a meaningful premium for panels that demonstrably survive more fold cycles with less visible crease degradation than rival offerings, and that willingness to pay concentrates margin upstream of the final device sale.

Long-Term Ultra-Thin Glass Cover Supply Contracts

Panel makers that secure long-term ultra-thin glass supply agreements lock in cost and volume certainty ahead of device brand product cycles, since suppliers capable of meeting foldable-grade thickness and flexibility specifications remain limited globally. Device brands increasingly specify cover materials directly in sourcing requirements rather than leaving the choice to assemblers, which shifts negotiating leverage toward the few suppliers who reliably hit yield targets at scale. Panel makers with dedicated glass supply relationships have reduced cover material costs by roughly 18 percent over two product generations. That saving flows partly into margin, partly into more competitive pricing.
Market Impact: Cuts cover glass input costs by 18 percent

Hinge Mechanism Licensing And Component Sales

Hinge mechanism design has become a distinct revenue stream, with specialist mechanical component makers licensing patented hinge architectures to multiple device brands rather than each brand engineering a proprietary solution from scratch. This licensing model lets smaller device brands access durability performance comparable to market leaders without the multi-year engineering investment that in-house hinge development requires. Component makers capturing this revenue stream report per-unit hinge assembly pricing power roughly 22 percent above generic mechanical component margins. This lever matters most for second-tier device brands trying to compete against Samsung and the leading Chinese manufacturers without matching their research budgets.
Market Impact: Commands a 22 percent pricing premium per unit

Extended Warranty And Screen Protection Plans

Device brands and carriers increasingly bundle extended warranty and screen protection plans specifically priced for foldable devices, reflecting genuine consumer anxiety about crease damage and hinge failure that does not exist for conventional slab phones. These plans carry materially higher attach rates than equivalent programs for standard smartphones, since buyers spending a premium on a foldable device are more willing to pay an incremental amount to protect that investment. Carriers report foldable-specific protection plan attach rates approaching 40 percent of device sales in mature markets. This extends the commercial relationship past purchase into ongoing services revenue.
Market Impact: Reaches roughly 40 percent plan attach rates industry-wide

Aftermarket Panel Replacement And Repair Services

Authorized repair networks capable of replacing a cracked or creased foldable panel without requiring full device replacement have become a meaningful revenue opportunity, since foldable panel repair costs sit well above conventional screen replacement given the complexity of the flexible display assembly. Device brands that build authorized repair capacity in-house, rather than ceding this revenue to third-party repair shops, capture both the repair margin and continued customer loyalty through the brand's own service channel. Repair-capable brands report foldable panel replacement revenue equivalent to roughly 8 percent of original device price per repair event, a substantial per-transaction value.
Market Impact: Adds 8 percent of device price per repair

Who Controls the Margin Pool

Foldable display manufacturing concentrates among a small set of Asian panel makers, with the top five suppliers controlling an estimated 82 percent of global capacity on a shipment-volume basis. Samsung Display holds a commanding lead built on manufacturing experience, while LG Display trails as the clearest challenger. BOE Technology Group has closed the gap fastest among Chinese entrants, though a yield gap separates leaders from challengers.
Current activity centers on hinge durability claims, crease visibility reduction, and expanding panel sizes beyond smartphones into laptops and automotive interiors. Samsung and LG Display both publish verified fold-cycle durability data to reassure buyers still skeptical of foldable reliability. Chinese manufacturers compete aggressively on price and specification parity, shipping panels at a fraction of the cost gap that existed two generations earlier, pressuring suppliers to defend share aggressively.

Rankings shift most where manufacturing yield improves fastest, since a modest gain translates directly into shippable volume and lower unit costs. BOE Technology Group and Visionox are investing in dedicated foldable lines rather than adapting existing flat-panel capacity, betting purpose-built lines will close the remaining quality gap with Samsung. Suppliers of ultra-thin glass and specialty polyimide films are gaining pricing power as makers compete for supply.
foldable-display-market-company-positioning-matrix-1789991317567

Competitive Moat and Risk Dimensions

SAMSUNG DISPLAY

Moat: Manufacturing Scale And Experience

Samsung Display's multi-year head start in commercial foldable production gives it manufacturing yield rates and cumulative process knowledge that competitors have not matched, allowing it to supply the majority of foldable panels used across Samsung's own device lineup plus external customers at a cost structure rivals still cannot fully replicate.
SAMSUNG DISPLAY

Risk: Chinese Capacity Catching Up

BOE Technology Group and other Chinese panel makers are closing the specification and yield gap faster than Samsung anticipated, backed by state investment and a captive domestic smartphone customer base, threatening to erode Samsung's cost advantage over the coming product generations as their output scales.
LG DISPLAY

Moat: Automotive Display Relationships

LG Display's existing automotive display supply relationships, built over years supplying conventional in-vehicle screens, position it well to extend into foldable and curved automotive interior displays as manufacturers evaluate the form factor, giving it a diversification path beyond the smartphone panel competition that Samsung dominates.
LG DISPLAY

Risk: Smartphone Segment Share Pressure

LG Display has struggled to win meaningful foldable smartphone panel business beyond its own limited internal customer base, leaving it more dependent on emerging laptop and automotive applications to justify continued foldable capacity investment while Samsung and Chinese makers split the far larger smartphone volume between them.

Players Tracked

Prominent Players

Samsung Display
LG Display
BOE Technology Group
Visionox
TCL CSOT

Other Key Players

Japan Display Inc
Sharp Corporation
AU Optronics
Innolux Corporation
Royole Corporation
EverDisplay Optronics
Tianma Microelectronics
CSOT
Truly International
Corning Incorporated
Schott AG
SK Hynix
Dowinsys
KH Vatec
Samsung Electro-Mechanics

Recent Developments

MARCH 2026

Samsung Display Expands Foldable Line Capacity

Samsung Display announced an organic expansion of its dedicated foldable panel production line in South Korea, adding capacity intended to serve both its own device brand and external customers seeking foldable panels for upcoming laptop, tablet, and automotive form factors entering the global market over the next several product cycles.
Signal: Confirms Samsung's continued capital commitment to defending its foldable manufacturing capacity and cost leadership position over the next several years
JUNE 2026

BOE Technology Group Signs Supply Agreement

BOE Technology Group entered a multi-year supply agreement with a major Chinese smartphone brand to provide foldable panels for an expanded device lineup, deepening its customer relationships beyond its traditional flat-panel display business into higher-margin foldable production at meaningfully larger volume than prior agreements. Terms were not disclosed.
Signal: Signals growing Chinese OEM confidence in domestic foldable panel quality and manufacturing yield performance levels across its supplier base
AUGUST 2026

LG Display Announces Automotive Display Partnership

LG Display announced a joint venture with a European automotive interior systems supplier to co-develop foldable and curved display modules for next-generation vehicle cockpits, combining LG's panel technology with the partner's automotive integration and qualification expertise across multiple upcoming vehicle platforms. Financial terms were not disclosed publicly.
Signal: Marks LG Display's clearest strategic pivot toward automotive diversification beyond smartphone panel market competition entirely going forward

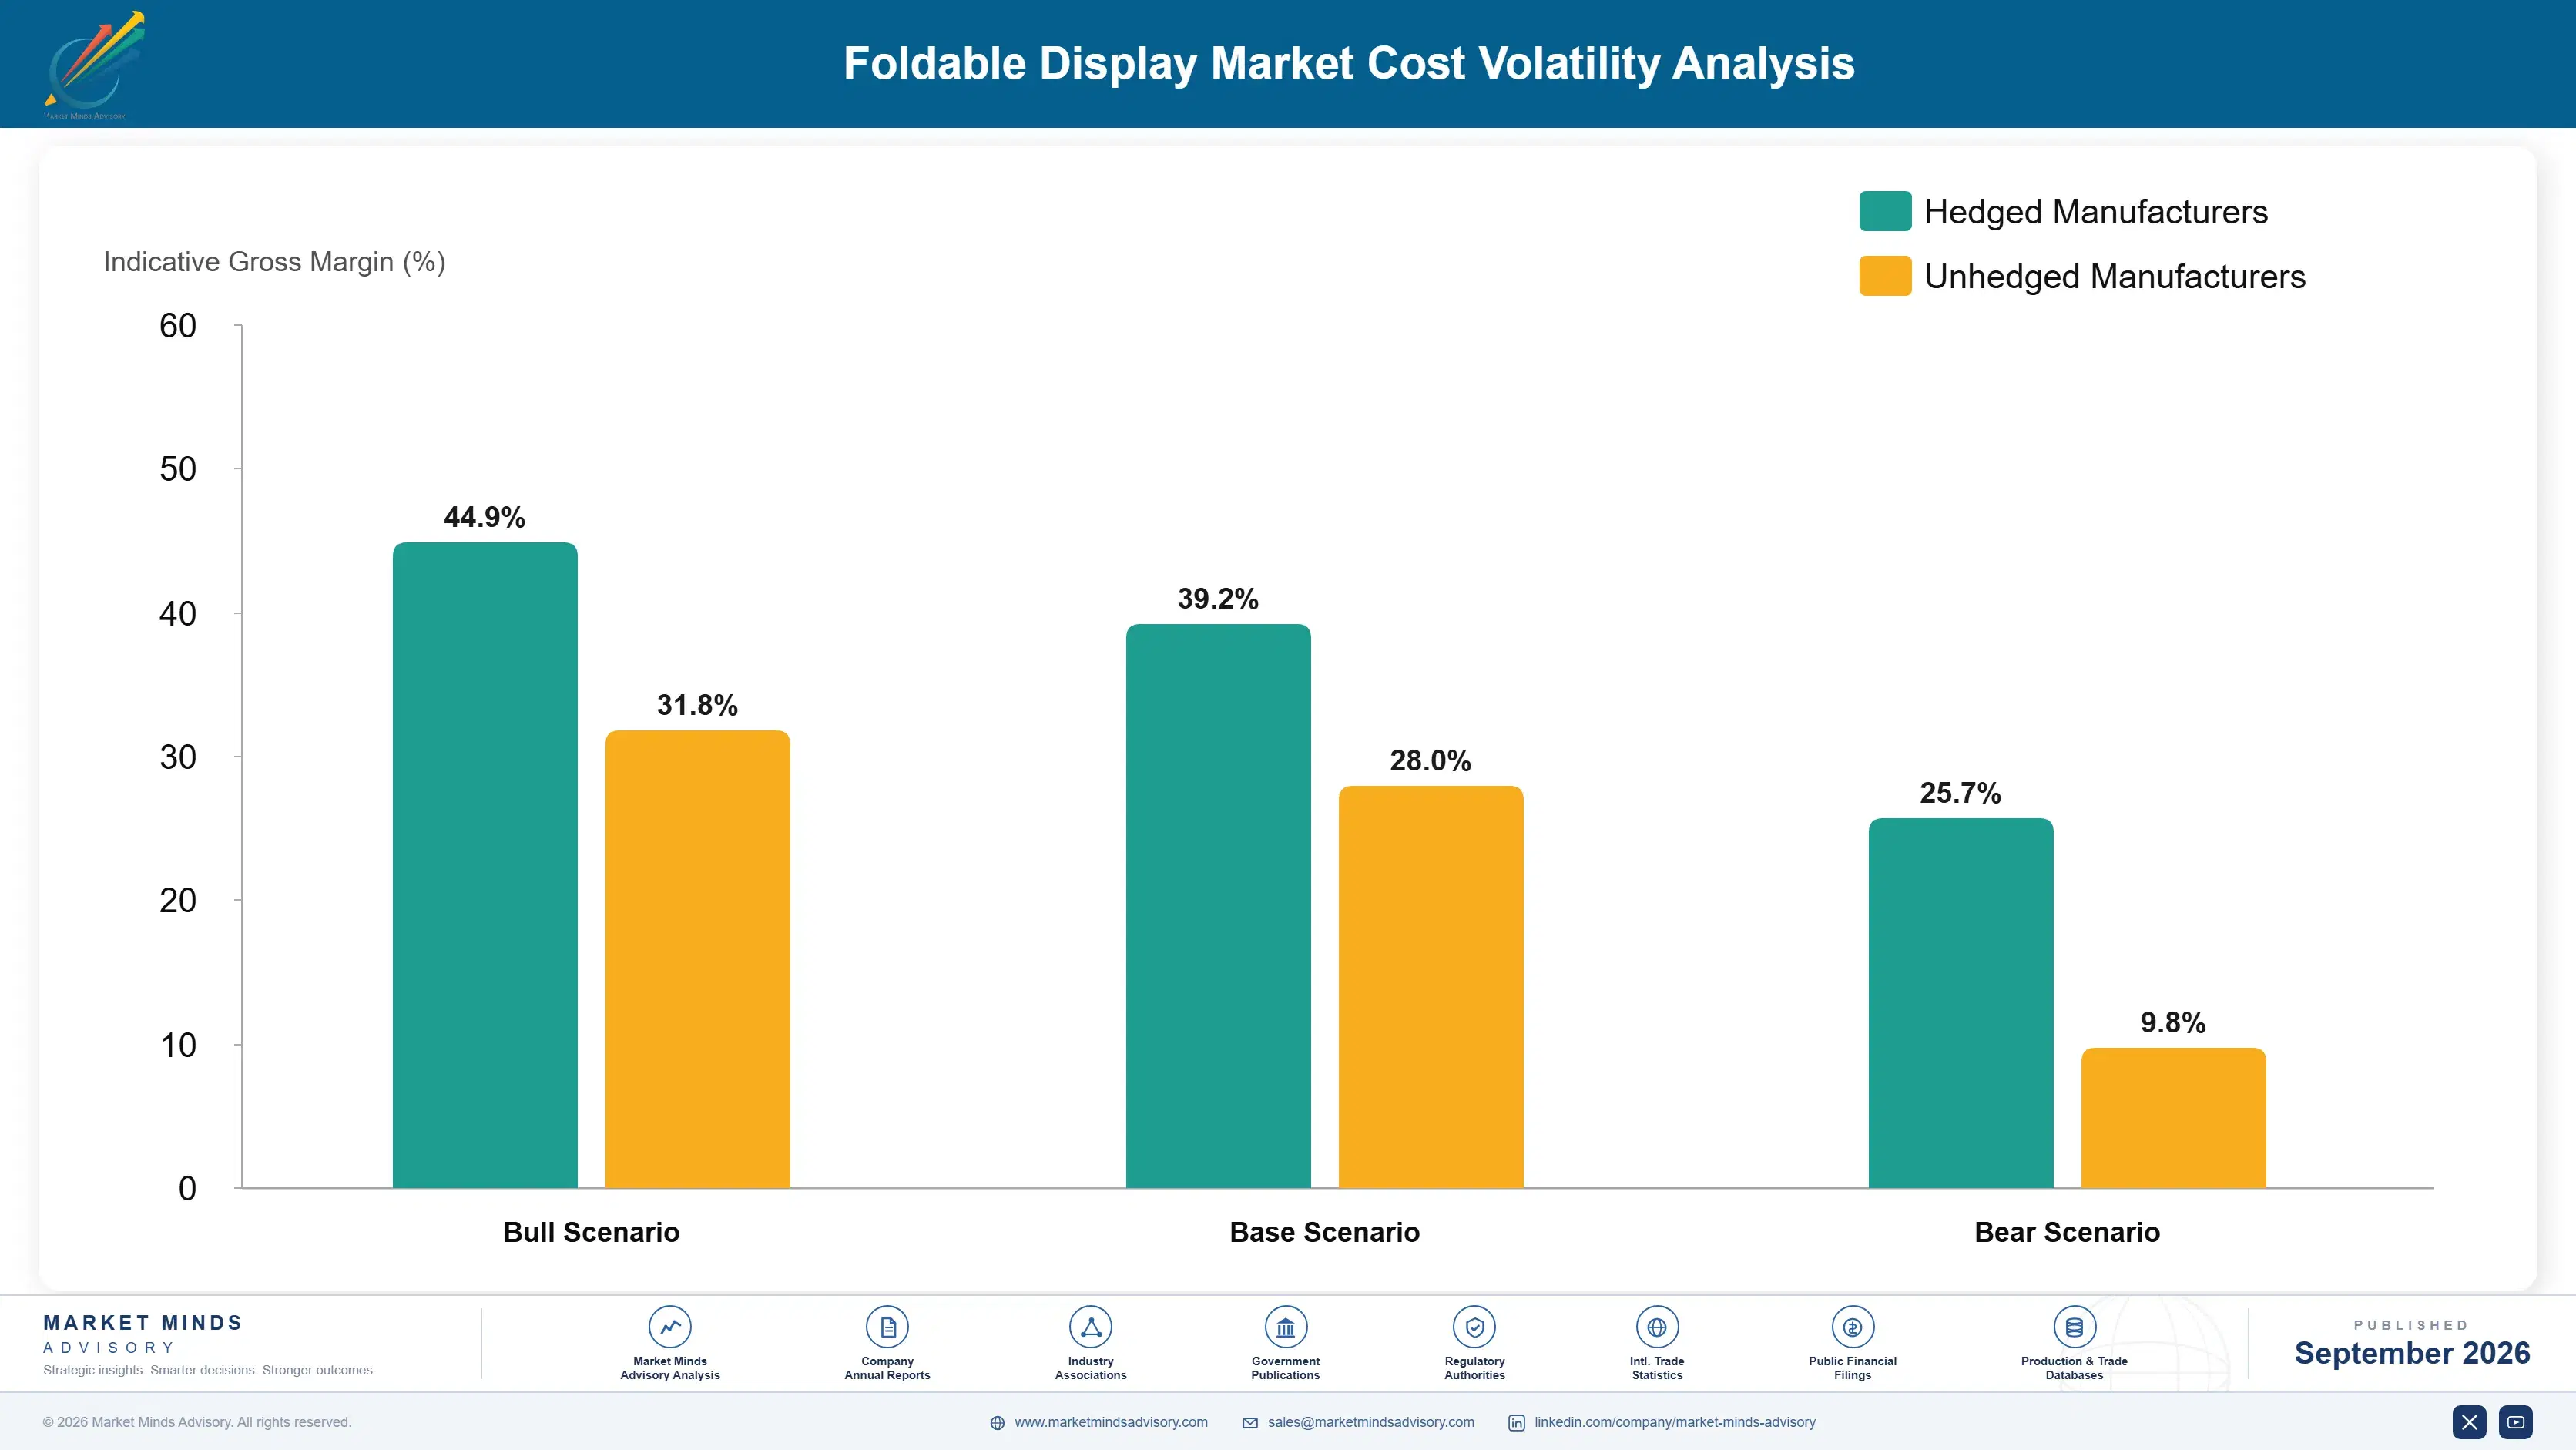
Glass, Polyimide, And Driver Chip Exposure

Ultra-thin flexible glass and specialty polyimide film together represent roughly 35 percent of foldable panel bill of materials cost, sourced predominantly from a handful of Japanese, Korean, and German specialty materials producers with limited substitute suppliers. Display driver integrated circuits add another meaningful cost share, sourced mainly from Korean and Taiwanese semiconductor foundries operating at mature process nodes rather than leading-edge capacity.
A 2025 supply disruption at a major Japanese specialty glass facility, tied to equipment maintenance downtime reported in the company's own annual report, briefly tightened ultra-thin glass availability across the industry and pushed spot pricing meaningfully above contracted rates for panel makers without long-term supply agreements. The disruption lasted several weeks before the facility returned to full production capacity, according to IEA-tracked regional manufacturing activity data for the period.

Panel makers without long-term glass supply contracts face a persistent competitive disadvantage against Samsung Display and LG Display, both of which have secured multi-year agreements that insulate them from spot market volatility. Smaller Chinese entrants sourcing on shorter-term contracts carry meaningfully higher input cost variability, which compresses their margin during any supply tightening episode and limits their ability to compete on price during those windows.
foldable-display-market-cost-volatility-analysis-1789991317765

Long-Term Supply Agreements With Materials Producers

Panel makers are converting spot glass and polyimide purchases into multi-year fixed-volume agreements with materials producers, trading some pricing flexibility for supply certainty that protects production schedules during industry-wide tightening episodes affecting smaller competitors without comparable contract coverage across their own supplier base. This approach has become standard among the top three suppliers, who together account for most contracted volume.

Dual-Sourcing Driver Chip Supply

Device brands increasingly qualify a second display driver chip supplier alongside their primary source, reducing exposure to any single semiconductor foundry's capacity constraints while accepting modest additional qualification and testing costs across the broader supply chain relationship over each product generation cycle. This dual-sourcing approach is increasingly common as device brands prioritize supply resilience over the marginal savings of single-sourcing.

Vertical Integration Into Materials Production

The largest panel makers are investing directly in glass and polyimide production capacity, either through joint ventures or minority equity stakes in materials suppliers, capturing margin that would otherwise flow entirely to independent upstream producers over time as foldable volume continues expanding. This strategy remains capital intensive and out of reach for smaller Chinese entrants still building manufacturing scale.

Portfolio Architecture for Margin Defence

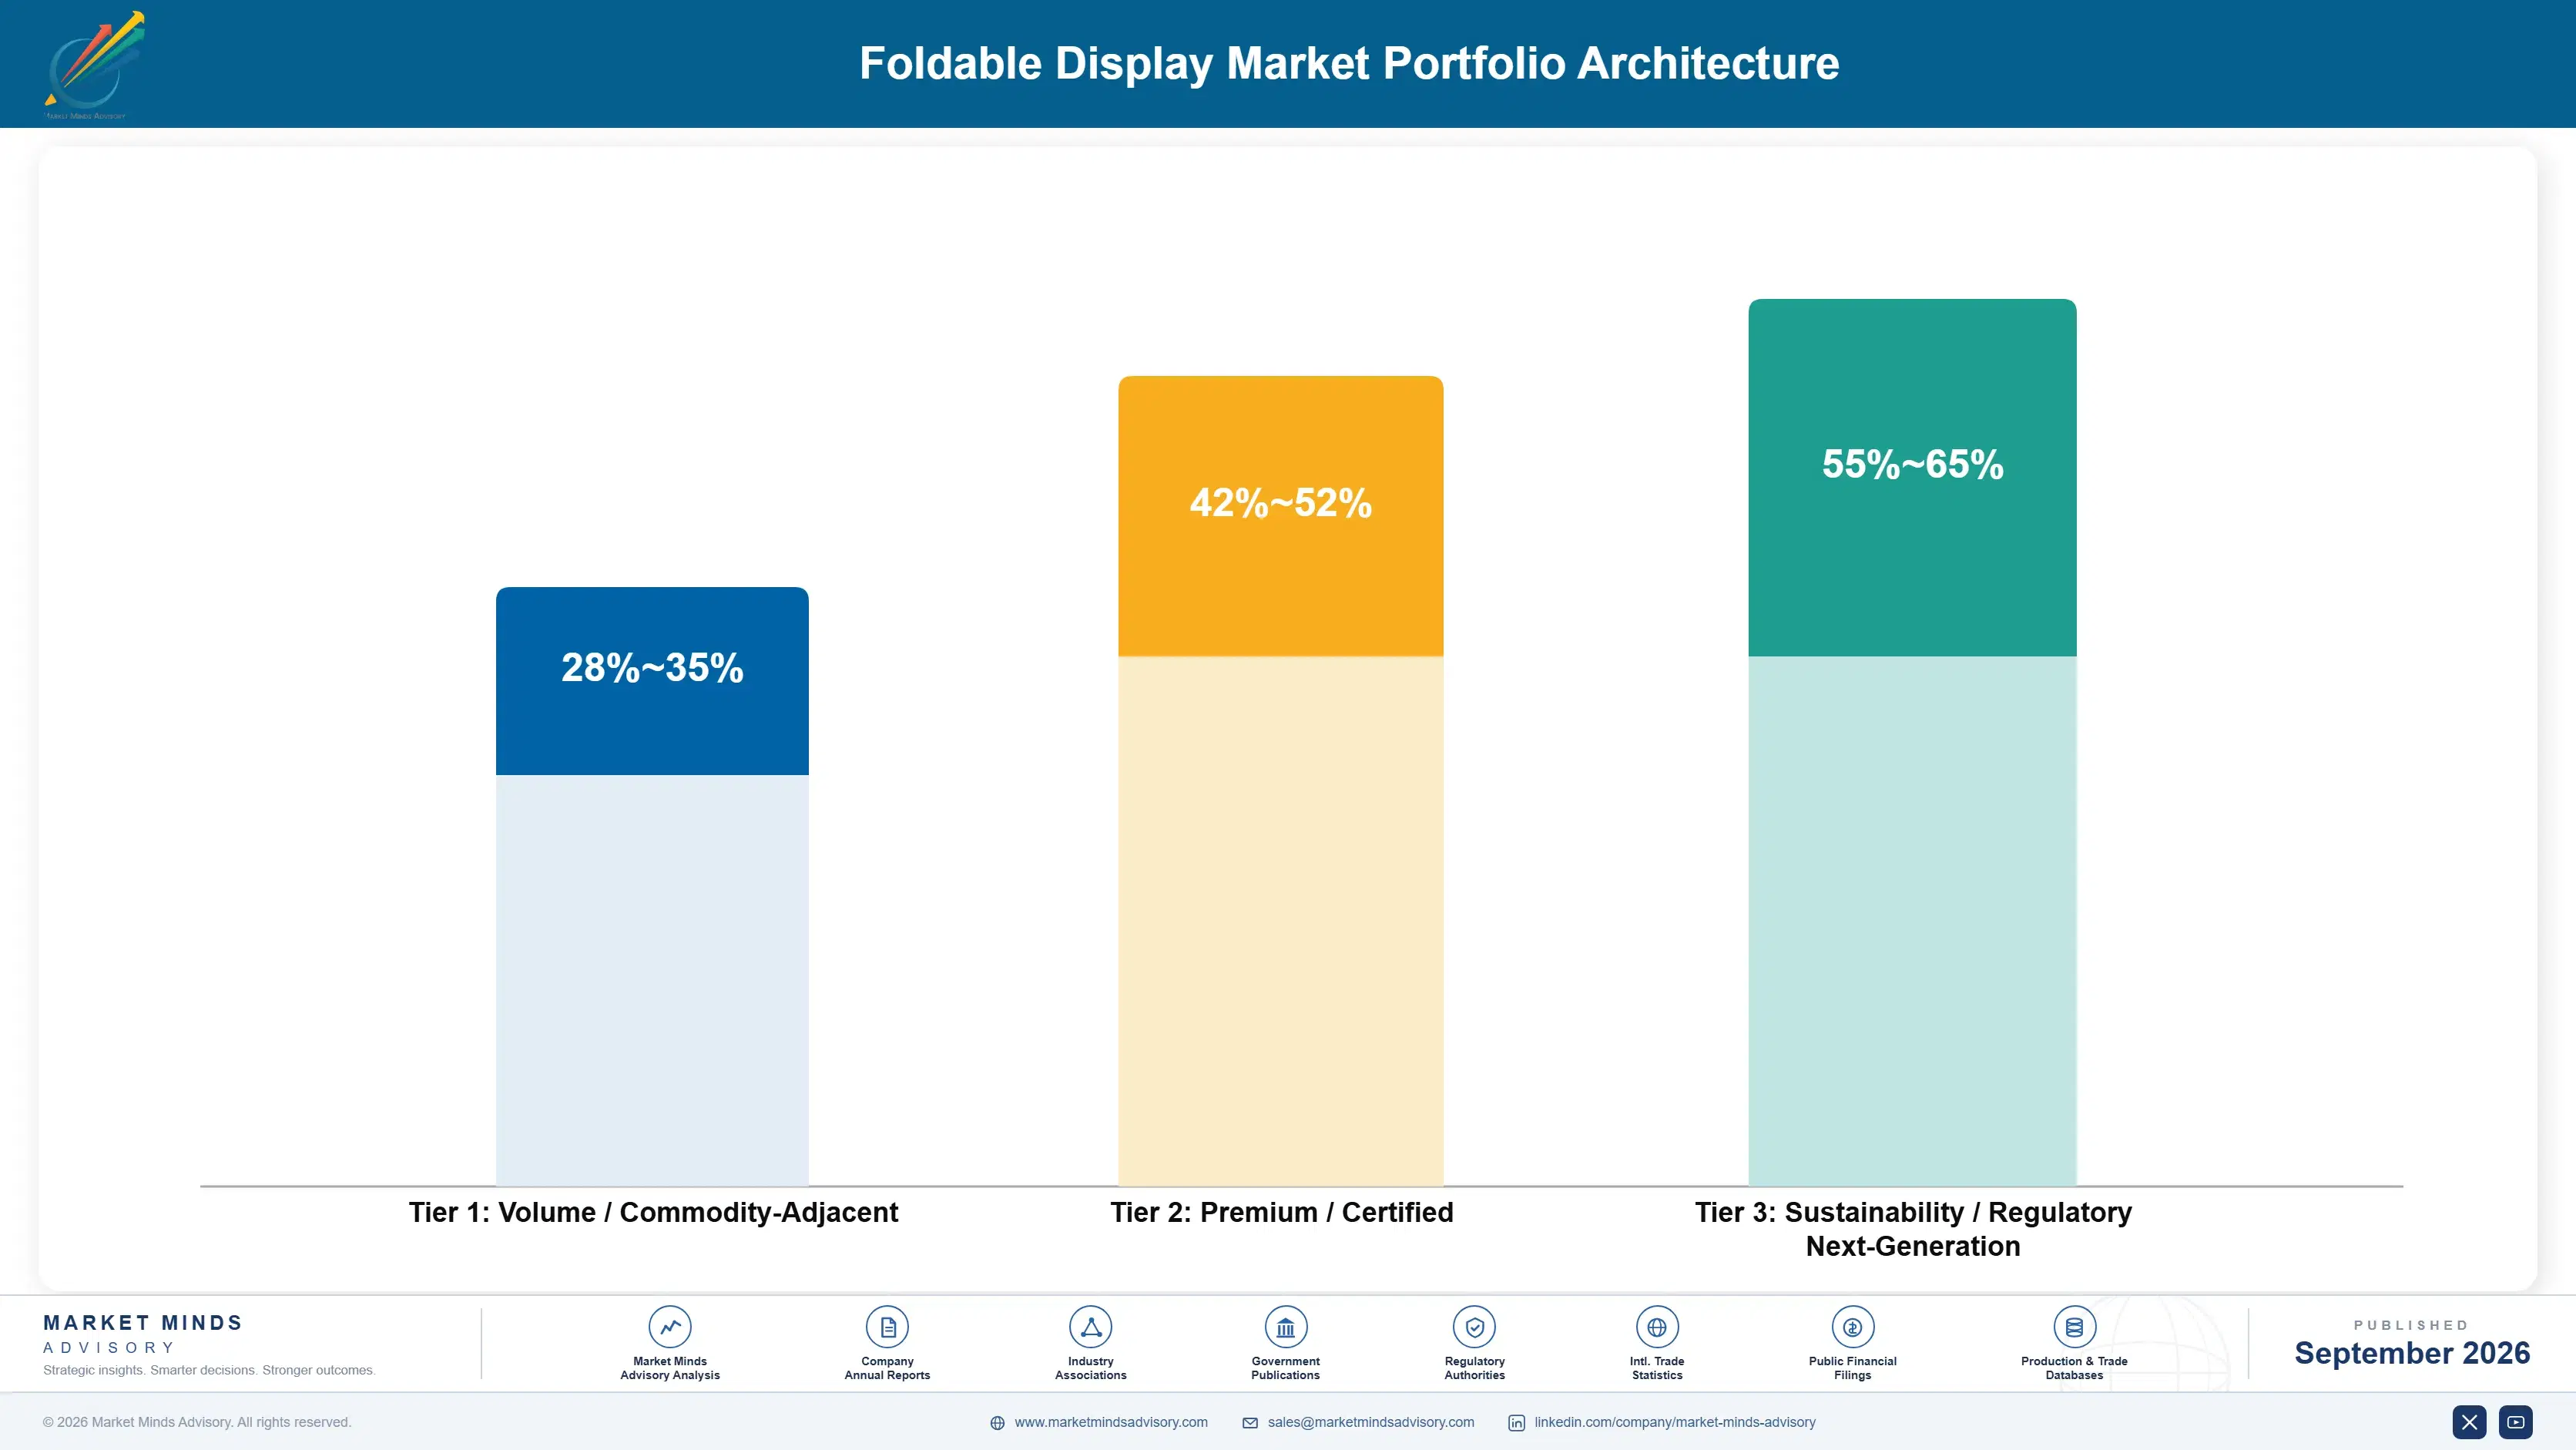
Foldable display economics split cleanly into three commercial tiers, from lower-cost clamshell panels serving mid-tier smartphones through certified premium book-style panels to next-generation rollable and automotive-grade displays still in early commercialization. Gross margins widen substantially moving up this ladder, since certification, durability testing, and component sourcing complexity all scale with panel size and application demands. Panel makers with strong balance sheets allocate capital toward the higher tiers even where near-term volume remains modest.
Volume economics still dominate unit shipments, but margin pools concentrate disproportionately in the premium tier where Samsung and LG Display compete on demonstrated durability rather than price. The tension between chasing unit volume in mid-tier clamshell devices and defending premium margin in flagship book-style panels shapes capital allocation decisions across every major panel maker's roadmap. Chinese entrants push hardest into the volume tier.

High-value pools concentrate most heavily around automotive and next-generation rollable applications, where certification barriers and lower initial volume keep competitors thin and pricing power strong. Panel makers positioning early in these categories are effectively trading near-term volume for a defensible position in segments expected to command premium economics once they reach commercial scale. Certification timelines run considerably longer than smartphone product cycles.

Volume / Commodity-Adjacent

Lower-cost clamshell panels for mid-tier smartphones, competing mainly on price and basic durability specifications against a growing field of Chinese suppliers expanding capacity quickly across multiple device categories. These devices ship in the highest unit volume of any tier.
Gross Margin: 28-35%

Premium / Certified

Certified book-style and clamshell panels for flagship smartphones and laptops, carrying verified fold-cycle durability data that commands materially higher device pricing from buyers willing to pay for demonstrated reliability. This tier drives the strongest revenue growth today.
Gross Margin: 42-52%

Sustainability / Regulatory / Next-Generation

Rollable and automotive-grade panels meeting emerging durability and safety certification standards, still early in commercialization but carrying the strongest margin ceiling of any tier once production scales meaningfully. Early volume remains limited but pricing power is strong.
Gross Margin: 55-65%
foldable-display-market-portfolio-architecture-1789991318268

High-value Sub-segments and Strategic Watch-out

Foldable Automotive Interior Displays

Automotive-grade foldable and curved displays are moving from concept demonstrations toward qualified production programs with major vehicle manufacturers, combining high per-unit value with a rapidly expanding addressable base as more automakers commit to next-generation cockpit designs. Several automotive suppliers have signed early qualification agreements with panel makers.
Gross Margin: 50-60%

Foldable Laptop and Tablet Panels

Larger-format foldable panels for laptops and tablets carry high per-unit value today but face slower volume growth than smartphones as PC brands cautiously scale production commitments amid still-emerging consumer demand for the form factor. Yield improvements at larger sizes will determine how quickly this segment scales.
Gross Margin: 40-50%

Foldable Smartphone Clamshell Panels

Clamshell smartphone panels remain the volume core of the category, generating the bulk of unit shipments even as margin per unit trails the premium book-style tier, anchoring most manufacturers' near-term revenue base. Margin pressure here intensifies as Chinese suppliers add capacity and compete increasingly on price alone.
Gross Margin: 30-38%

Rollable Display Panels

Rollable panels remain commercially unproven at meaningful scale and warrant close monitoring, since a technical breakthrough or high-profile flagship launch could rapidly reshape category economics and competitive positioning across the entire industry. No major manufacturer has yet committed to full volume production at meaningful commercial scale.
Gross Margin: 45-55%

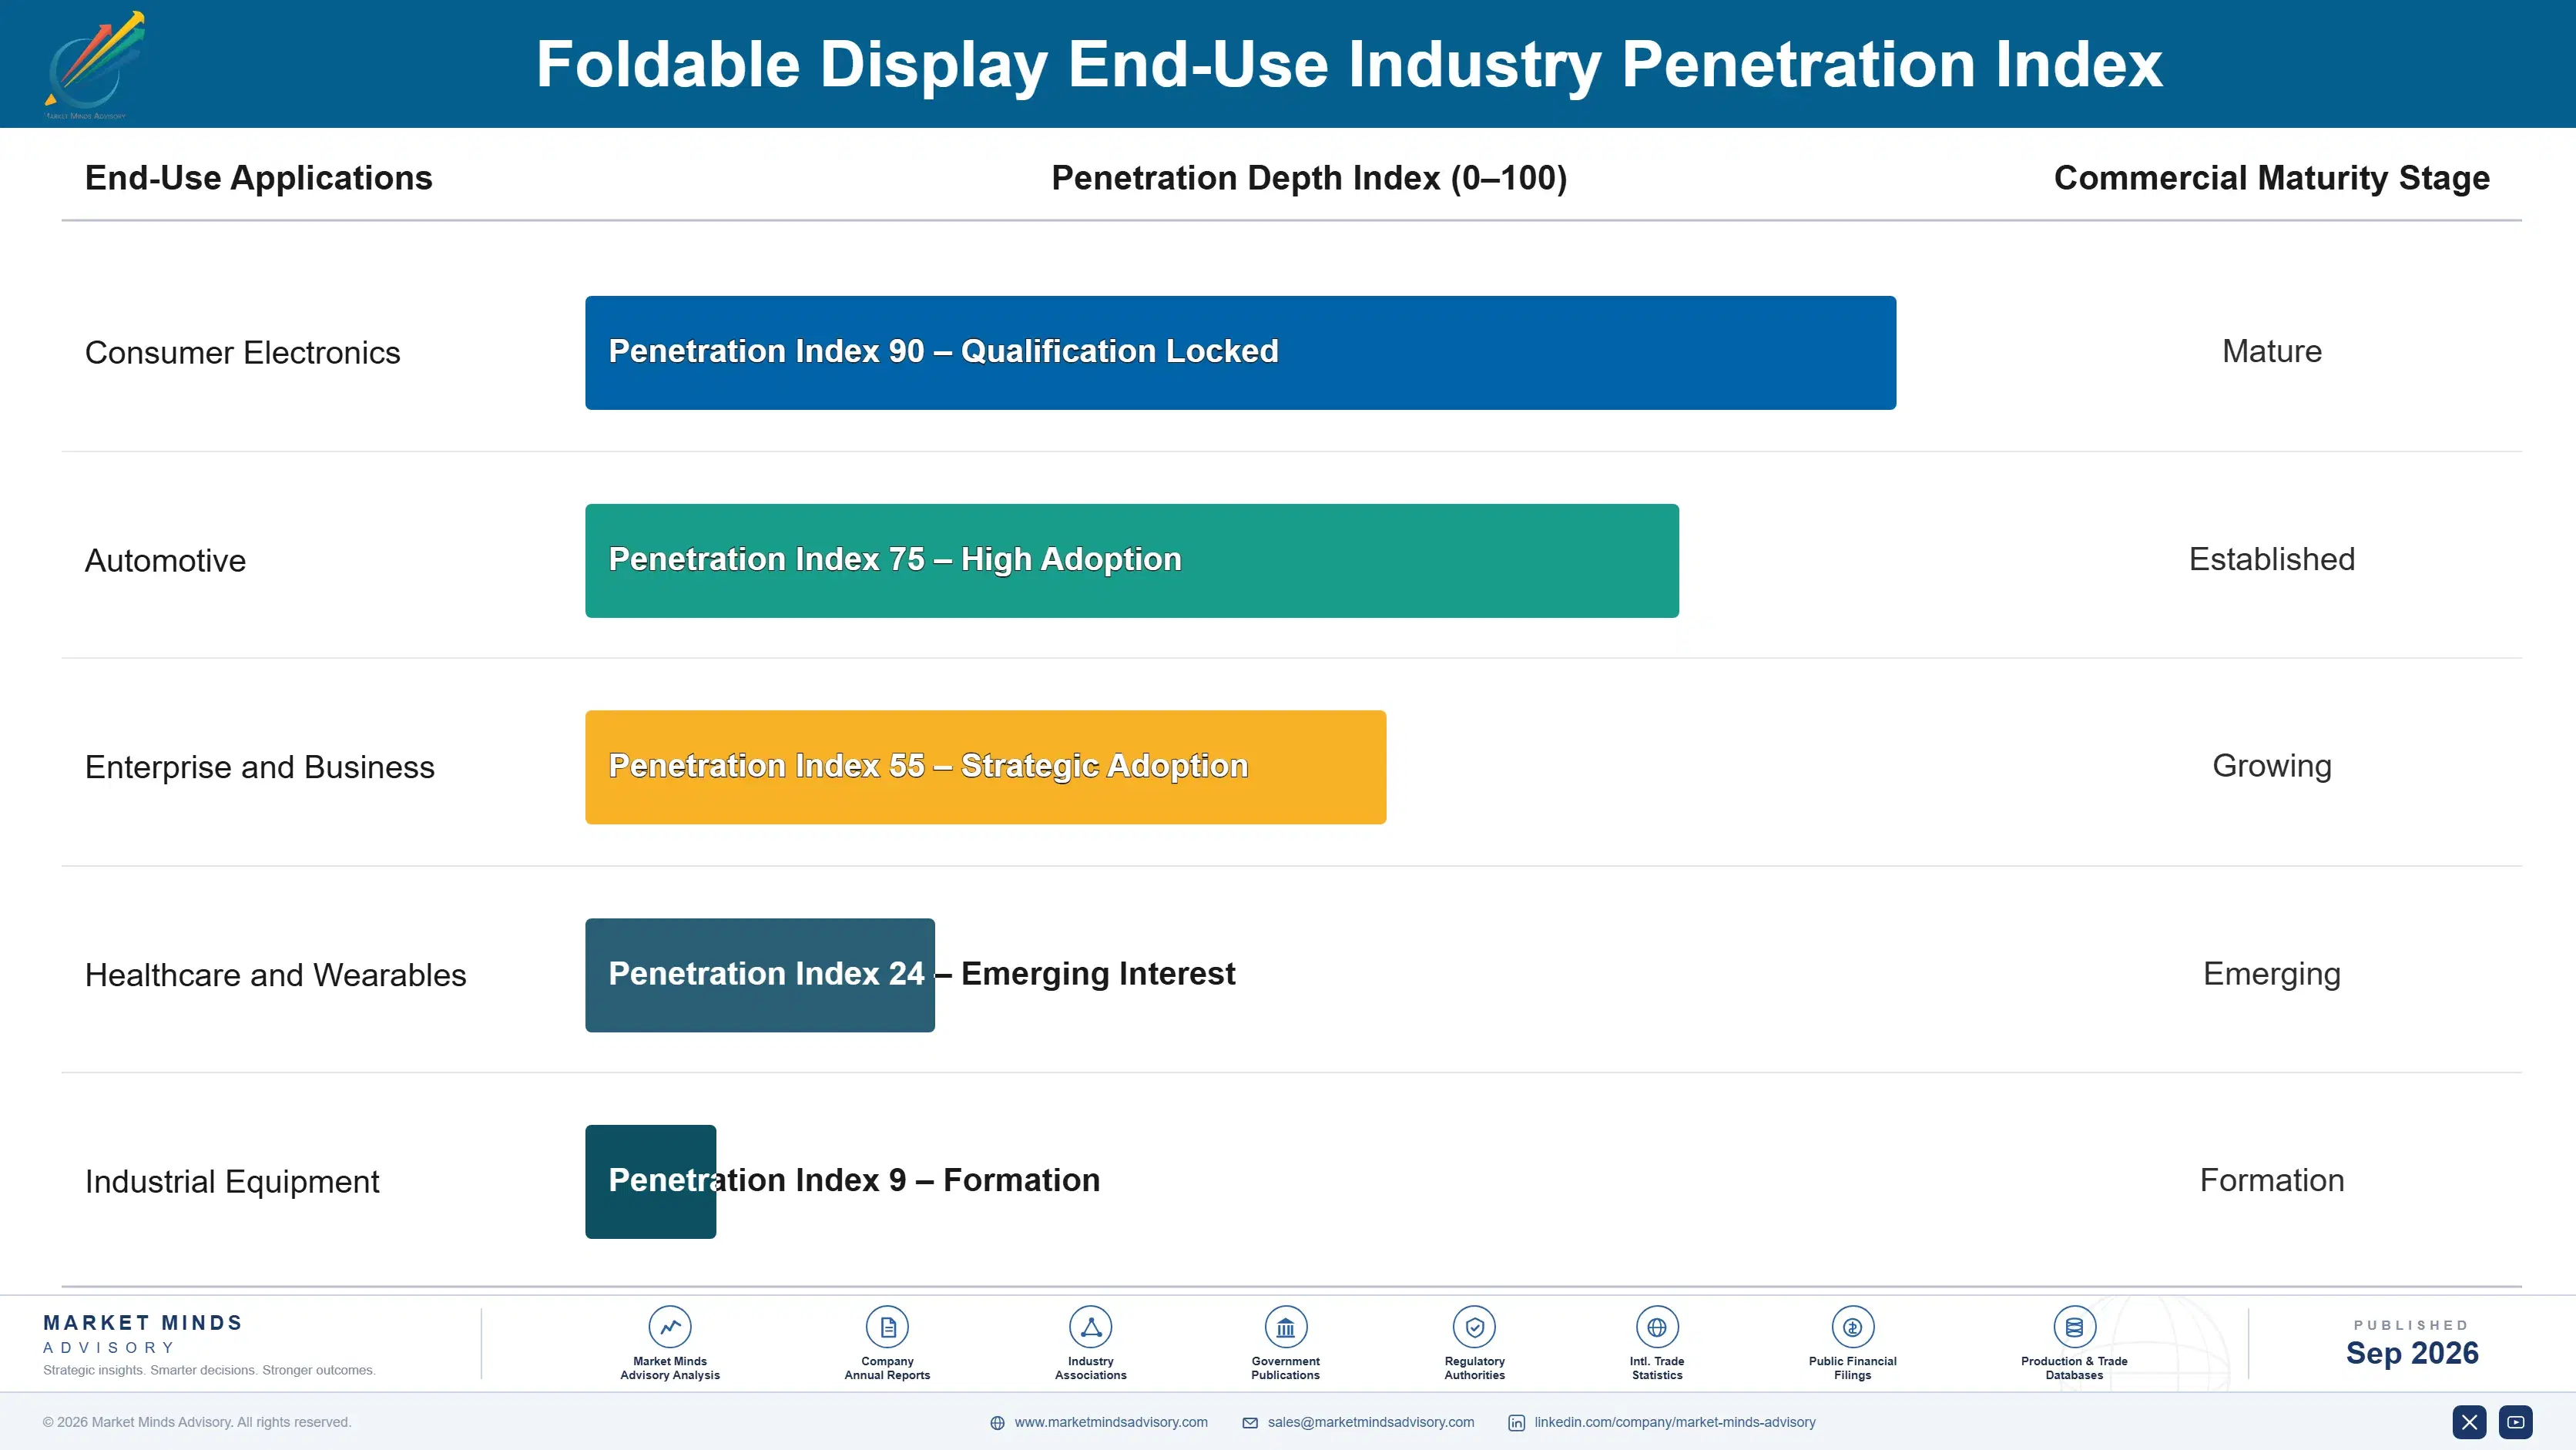
Repeat Purchase And Category Migration Patterns

Foldable device economics increasingly resemble an annuity business for panel makers holding long-term supply agreements, since a device brand committing to a foldable product line typically continues sourcing panels across multiple successive generations rather than re-tendering the relationship each cycle. Switching panel suppliers mid-lineup carries real engineering and qualification cost, which favors incumbents once a relationship is established at scale.
Adoption depth varies meaningfully by end-use vertical. Smartphone buyers show the deepest engagement, with repeat foldable purchasers reporting strong satisfaction and low intent to revert to conventional slab phones once accustomed to the larger unfolded screen. Laptop and tablet buyers remain more exploratory, testing the form factor for specific professional workflows before committing budget at scale. Automotive buyers evaluate foldable displays on multi-year platform cycles that move far more slowly than consumer electronics.

Generational buyer shifts favor foldable adoption over time, since younger buyers entering the premium smartphone segment show less attachment to the conventional slab form factor than buyers who adopted smartphones a decade earlier. Corporate procurement buyers evaluating foldable laptops increasingly weigh device flexibility against total cost of ownership rather than upfront price alone, a shift that favors panel makers who can demonstrate durability data over time.
foldable-display-market-end-use-penetration-index-1789991318766

Where Panel Makers Should Focus Next

These are among the four positions where our research anticipates prominent divergence between winners and laggards over the coming forecast period. Each is grounded in the demand model, the regulatory perimeter, and the announced capacity pipeline.
01 / CAPITAL ALLOCATION PRIORITY

Prioritize Larger-Format Lines Over Incremental Smartphone Capacity

Panel makers still allocating the bulk of new capital toward incremental smartphone panel capacity risk missing the faster-growing laptop, tablet, and automotive opportunities that carry higher per-unit value and, in automotive's case, meaningfully longer customer relationships once qualified. The smartphone segment remains the largest revenue pool today, but its growth rate trails the laptop and automotive segments by a wide margin. Capital committed now to larger-format production lines positions a manufacturer to capture disproportionate share of the higher-margin pools opening over the next several years.
02 / SUPPLY CHAIN SECURITY

Lock In Multi-Year Glass And Polyimide Contracts Now

Panel makers without secured long-term ultra-thin glass and polyimide supply agreements remain exposed to spot market volatility that can erase a meaningful share of gross margin during any industry-wide tightening episode. Competitors with multi-year contracts already in place have demonstrated materially lower input cost variability across recent supply disruptions. Securing comparable coverage now, even at a modest premium to current spot pricing, protects margin durability through the remainder of the forecast period and beyond, particularly as smaller Chinese entrants compete increasingly hard on price.
03 / DURABILITY TRUST BUILDING

Publish Independently Verified Fold-Cycle Data To Build Trust

Consumer skepticism about foldable device reliability remains a meaningful adoption barrier, particularly among buyers who have not yet purchased a first-generation device and rely on secondhand impressions of crease visibility and hinge durability. Manufacturers that publish independently verified fold-cycle durability data ahead of competitors capture a credibility advantage that translates directly into purchase consideration. This move costs relatively little to execute but compounds in value as more buyers cross-reference published durability data across competing brands before making a final purchase decision.
04 / AUTOMOTIVE MARKET POSITIONING

Establish Automotive Qualification Relationships Ahead Of Broader Competition

Automotive display qualification cycles run considerably longer than consumer electronics product cycles, meaning suppliers who begin qualification conversations with vehicle manufacturers today will not see meaningful revenue for several years but will lock in relationships before the segment attracts broader competitive attention. Vehicle manufacturers strongly prefer suppliers with proven qualification track records once a design win is awarded. Early positioning here compounds over subsequent vehicle platform generations, making current qualification investment disproportionately valuable relative to its modest near-term revenue contribution over the next few years.

Engagement Snapshot From the Field

A live engagement with an industry participant carrying material or product regulatory and market exposure ahead of a defining policy shift, showing how our research translates into a defensible multi-year portfolio strategy.
MARKET MINDS ADVISORY · CLIENT ENGAGEMENT SUMMARY
Foldable Display Producer Strategic Portfolio Review and Transition Roadmap 2026·Investment Scenario on Foldable Display Exposure Evaluation 2025-26
CLIENT PROFILE
The client is a mid-tier consumer electronics brand with an established presence in conventional smartphones across Southeast Asian and South Asian markets, evaluating whether to enter the foldable display category as a differentiation strategy against larger regional competitors already shipping foldable devices at flagship price points. The brand's roadmap included a premium smartphone tier, and leadership viewed foldable entry as a next step but lacked data to size it.
STRATEGIC CHALLENGE
The client faced pressure to justify a significant capital commitment toward foldable panel sourcing agreements without clear visibility into realistic yield rates, component cost trajectories, and consumer willingness to pay a premium given its brand's mid-tier market positioning relative to established foldable leaders. Internal teams were divided between an aggressive multi-market launch and a conservative pilot, with no shared data to resolve it.
MMA APPROACH
MMA conducted a structured assessment combining supplier capacity benchmarking, component cost modeling across three foldable panel suppliers, and a targeted consumer willingness-to-pay survey across the client's core regional markets to size realistic first-year volume and pricing scenarios before capital commitment. The engagement also benchmarked competitor pricing across core markets to identify a defensible price band given the brand's mid-tier positioning.
KEY FINDINGS
  1. Consumer willingness to pay a premium for foldable devices dropped sharply below a specific price threshold identified through the survey work. Pricing above that threshold sharply reduced conversion intent even among otherwise interested buyers.
  2. Component cost per unit from second-tier panel suppliers ran approximately 22 percent above the client's initial internal cost assumptions. This gap materially changed the client's expected margin profile for a first-generation device launch.
  3. Durability perception, more than screen size or specifications, was the strongest predictor of purchase intent among surveyed consumers. Marketing messaging emphasizing durability testing outperformed messaging centered on screen size alone.
  4. A phased regional launch reduced initial capital exposure by roughly 40 percent versus the client's original simultaneous multi-market plan. This freed capital for a stronger marketing push in the initial lead market instead.
CLIENT PROFILE
The client is a mid-tier consumer electronics brand with an established presence in conventional smartphones across Southeast Asian and South Asian markets, evaluating whether to enter the foldable display category as a differentiation strategy against larger regional competitors already shipping foldable devices at flagship price points. The brand's roadmap included a premium smartphone tier, and leadership viewed foldable entry as a next step but lacked data to size it.
STRATEGIC CHALLENGE
The client faced pressure to justify a significant capital commitment toward foldable panel sourcing agreements without clear visibility into realistic yield rates, component cost trajectories, and consumer willingness to pay a premium given its brand's mid-tier market positioning relative to established foldable leaders. Internal teams were divided between an aggressive multi-market launch and a conservative pilot, with no shared data to resolve it.
MMA APPROACH
MMA conducted a structured assessment combining supplier capacity benchmarking, component cost modeling across three foldable panel suppliers, and a targeted consumer willingness-to-pay survey across the client's core regional markets to size realistic first-year volume and pricing scenarios before capital commitment. The engagement also benchmarked competitor pricing across core markets to identify a defensible price band given the brand's mid-tier positioning.
KEY FINDINGS
  1. Consumer willingness to pay a premium for foldable devices dropped sharply below a specific price threshold identified through the survey work. Pricing above that threshold sharply reduced conversion intent even among otherwise interested buyers.
  2. Component cost per unit from second-tier panel suppliers ran approximately 22 percent above the client's initial internal cost assumptions. This gap materially changed the client's expected margin profile for a first-generation device launch.
  3. Durability perception, more than screen size or specifications, was the strongest predictor of purchase intent among surveyed consumers. Marketing messaging emphasizing durability testing outperformed messaging centered on screen size alone.
  4. A phased regional launch reduced initial capital exposure by roughly 40 percent versus the client's original simultaneous multi-market plan. This freed capital for a stronger marketing push in the initial lead market instead.
RECOMMENDED STRATEGY
Phase 1: Phase one: launch in the client's strongest existing market first to validate demand before wider regional commitment. This limits downside exposure while generating real sales data to inform expansion. Phase 2: Phase two: secure a mid-tier panel supply agreement with performance-based durability guarantees rather than fixed-volume-only terms. Performance-based terms tie a portion of pricing to demonstrated fold-cycle durability outcomes. Phase 3: Phase three: expand to additional regional markets only after first-market sell-through data confirms viable unit economics. This staged approach protects capital while still preserving competitive timing across the broader region.
OUTCOME
The client launched its first foldable device in a single lead market, achieving sell-through results that exceeded internal projections by approximately 15 percent (client-reported, unverified by MMA), and used that validated data to secure improved terms on its second-generation panel supply agreement. The phased approach also gave the marketing team time to refine messaging around durability before wider rollout.

Frequently Asked Questions

Foundational context covering the market sizes, CAGR, scope, country, region and competition that inform every finding below. This section is provided to cover basics and most often pre-purchase conversations, answered from the MMA Primary Research Dataset.

What is the current size of the Foldable Display Market?

The global foldable display market reached an estimated 22.5 billion dollars in 2025. This valuation covers foldable OLED panels and components across smartphone, laptop, tablet, and automotive form factors.

How large will the Foldable Display Market be by 2036?

The market is projected to reach approximately 167.2 billion dollars by 2036. That represents more than a sixfold expansion from the 2026 base value over the forecast period.

What is the CAGR for the Foldable Display Market 2026 to 2036?

The market is forecast to grow at a 20.0 percent compound annual growth rate between 2026 and 2036. Bull and bear scenarios range from 18.7 to 21.3 percent.

Which segment is growing fastest?

Foldable smartphone displays are growing fastest at a 24.0 percent CAGR, roughly 1.2 times the overall market rate. Laptop and tablet displays follow closely as the second-fastest segment.

Who are the major companies in the Foldable Display Market?

Samsung Display and LG Display lead the category, followed by BOE Technology Group, Visionox, and TCL CSOT. Together these five suppliers control an estimated 82 percent of global capacity.

Which country is growing fastest?

China is growing fastest at a 21.2 percent CAGR, reflecting its expanding domestic panel manufacturing and smartphone brand adoption. This closely tracks the broader East Asia regional growth rate.

Report Segmentation Architecture

The full report scope spans multiple orthogonal segmentation dimensions, with cross-tabulated demand data provided for each dimension pair. Coverage extends further to regional breakdowns, trend trajectories, and the competitive detail needed to support segment-level decision-making.

By Primary Market Dimension

  • Foldable Smartphone Displays
  • Foldable Laptop and Tablet Displays
  • Foldable Automotive Displays
  • Rollable Display Panels
  • Foldable Wearable Displays
  • Foldable Display Component Materials

By End-Use Industry

  • Consumer Electronics
  • Automotive
  • Enterprise and Business
  • Healthcare and Wearables
  • Industrial Equipment

By Commercial Dimension

  • Direct OEM Sales
  • Distributor and Retail Channel
  • Aftermarket Repair and Replacement
  • Licensing and Component Supply

By Region

  • East Asia
  • North America
  • Western Europe
  • South Asia and Pacific
  • Latin America
  • Middle East and Africa
  • Eastern Europe

Scope, Methodology, and Coverage

Every figure in this report is reproducible from documented input assumptions. The scope below maps the historical period, the forecast horizon, the segmentation dimensions, and the countries covered, alongside the underlying primary and qualitative methodology.
Historical Period
2020 to 2025
Forecast Period
2026 to 2036
Base Year
2025 (USD billions; MMA Primary Research Dataset, September 2026)
Market Definition
This report defines the foldable display market as flexible OLED panels and associated hinge, glass cover, and driver components designed for folding or rollable form factors across smartphones, laptops, tablets, automotive interiors, and wearables. It excludes conventional rigid flat-panel displays and curved but non-folding display technologies.
Quantitative Units
USD billions, unit shipments, CAGR percent
Segmentation Dimensions
Product and form factor type, end-use industry, commercial channel
Regions Covered
East Asia, North America, Western Europe, South Asia and Pacific, Latin America, Middle East and Africa, Eastern Europe
Countries Covered
United States, Canada, Germany, United Kingdom, France, China, Japan, South Korea, India, Australia, Brazil, Mexico, Saudi Arabia, United Arab Emirates, South Africa, Poland, Czech Republic, Russia
Key Companies Profiled
Samsung Display, LG Display, BOE Technology Group, Visionox, TCL CSOT, Japan Display Inc, Sharp Corporation, AU Optronics, Innolux Corporation, Royole Corporation, EverDisplay Optronics, Tianma Microelectronics, CSOT, Truly International, Corning Incorporated, Schott AG, SK Hynix, Dowinsys, KH Vatec, Samsung Electro-Mechanics
Quantitative Methodology
Primary survey, n=3,800 respondents, Q4 2025, six countries; demand-side model with trade association cross-validation
Qualitative Methodology
47 expert interviews, Q4 2025; applied to validate demand model assumptions, identify emerging dynamics, and assess competitive positioning
Report Format
PDF and XLSX data workbook (Word format preview document)
Publisher
Market Minds Advisory
Report Code
MMA-2026-TEC-437
Published
September 2026
Contact
sales@marketmindsadvisory.com | www.marketmindsadvisory.com

Purchase the full Foldable Display Market Report (2026 to 2036).

This report delivers a comprehensive analysis of the global foldable display market across all major form factors, regions, and competitive dynamics through 2036. It covers detailed segmentation by product type, end-use industry, and commercial channel, alongside regional demand architecture across all seven world regions. Competitive profiling examines the top five suppliers controlling 82 percent of global capacity, along with fifteen additional participants shaping category evolution. The report also includes a portfolio tier analysis, input cost risk assessment, and a strategic verdict section identifying priority actions for panel makers and device brands navigating this rapidly scaling category.
Seven-region demand share and CAGR breakdown analysis
Five-tier top and secondary player competitive profiling
Ten-year revenue and volume forecast model
Input cost and supply chain risk assessment
Portfolio margin tier and watch segment analysis
Anonymized client case study with strategy recommendations

Built For The People Who Decide

From boardroom strategy to bench-side execution, this report is read cover-to-cover by leaders shaping the next decade of their industry, turning demand scenarios, market dynamics and valuation benchmarks into decisions.
CXOs/ Presidents/ VPs/ Managers
M&A and Corporate Development
Strategy Teams and R&D Heads
Procurement and Product Directors
Regulatory and Compliance Leaders
Investor Relations and Equity Analysts