Market Minds Advisory
Foldable Container Market

Foldable Container Market: Trends and Forecast 2026 to 2036

Empty returnable containers cost logistics networks more in wasted truck space than the products they once carried, pushing retailers and manufacturers toward collapsible designs that cut empty-return freight volume by up to eighty percent.

Lead Analyst

Bilal Shaikh

Published

September 2026

Make Smarter Decisions with Customized Research Insights

Request a free sample report and evaluate market opportunities, growth trends, and competitive dynamics relevant to your business needs.

2025 MARKET VALUE$5.4BMarket Size 2025
2036 FORECAST VALUE$11.1BBase Case , 2026 to 2036
CAGR 2026 TO 20366.8 %Bull 8.1% / Bear 5.5%
INCREMENTAL OPPORTUNITY$5.4BNet 10- year value creation
EXPANSION MULTIPLE1.93x2036 value over 2026 base
Strategic Levers
M&A Pipeline
Regional Outlook
Country Rankings
Competitive Intelligence
Segmental Deep-dive
Call-Us : 91 93563 13602

Executive Snapshot and Market Trajectory

Foldable containers have shifted from a niche logistics accessory to a genuine supply chain cost lever, as retailers and manufacturers finally calculate the true freight savings collapsible designs deliver on empty return trips across multi-leg distribution networks and warehouse operations worldwide today across most industries, regions, and price points.
Foldable bulk containers used for pallet-level shipping are the fastest-growing category, expanding well ahead of standard foldable crates, as cold chain and agricultural logistics operators chase the return-freight savings collapsible pallet boxes deliver over rigid alternatives. China's massive e-commerce logistics infrastructure and dominant plastics manufacturing base concentrate demand heavily in East Asia. Container pooling arrangements, where a third party owns and circulates containers across multiple companies, are reshaping who actually purchases new units.
Competitive dynamics favor manufacturers with established container pooling networks and durability certifications for repeated collapsing cycles, since customers rarely switch suppliers mid-contract once a fleet standardizes on a specific design and locking mechanism across the operation. RFID and barcode tracking integration is becoming a genuine differentiator rather than a premium add-on, as more logistics operators demand real-time container location visibility across their networks.
Market Definition
The foldable container market covers collapsible plastic and corrugated containers, crates, and bulk boxes used for reusable packaging and logistics across retail, food and beverage, and industrial distribution. It excludes rigid non-collapsible containers and single-use disposable packaging.
Base Year Value
$5.4B in 2025 (MMA Primary Research Dataset, August 2026)
Forecast Period
2026 to 2036, eleven discrete annual values
CAGR
6.8% base case. Bull 8.1%. Bear 5.5%.
Fastest Growth Segment
Foldable Bulk Containers (Pallet Boxes): 9.5% CAGR
Fastest Growth Country
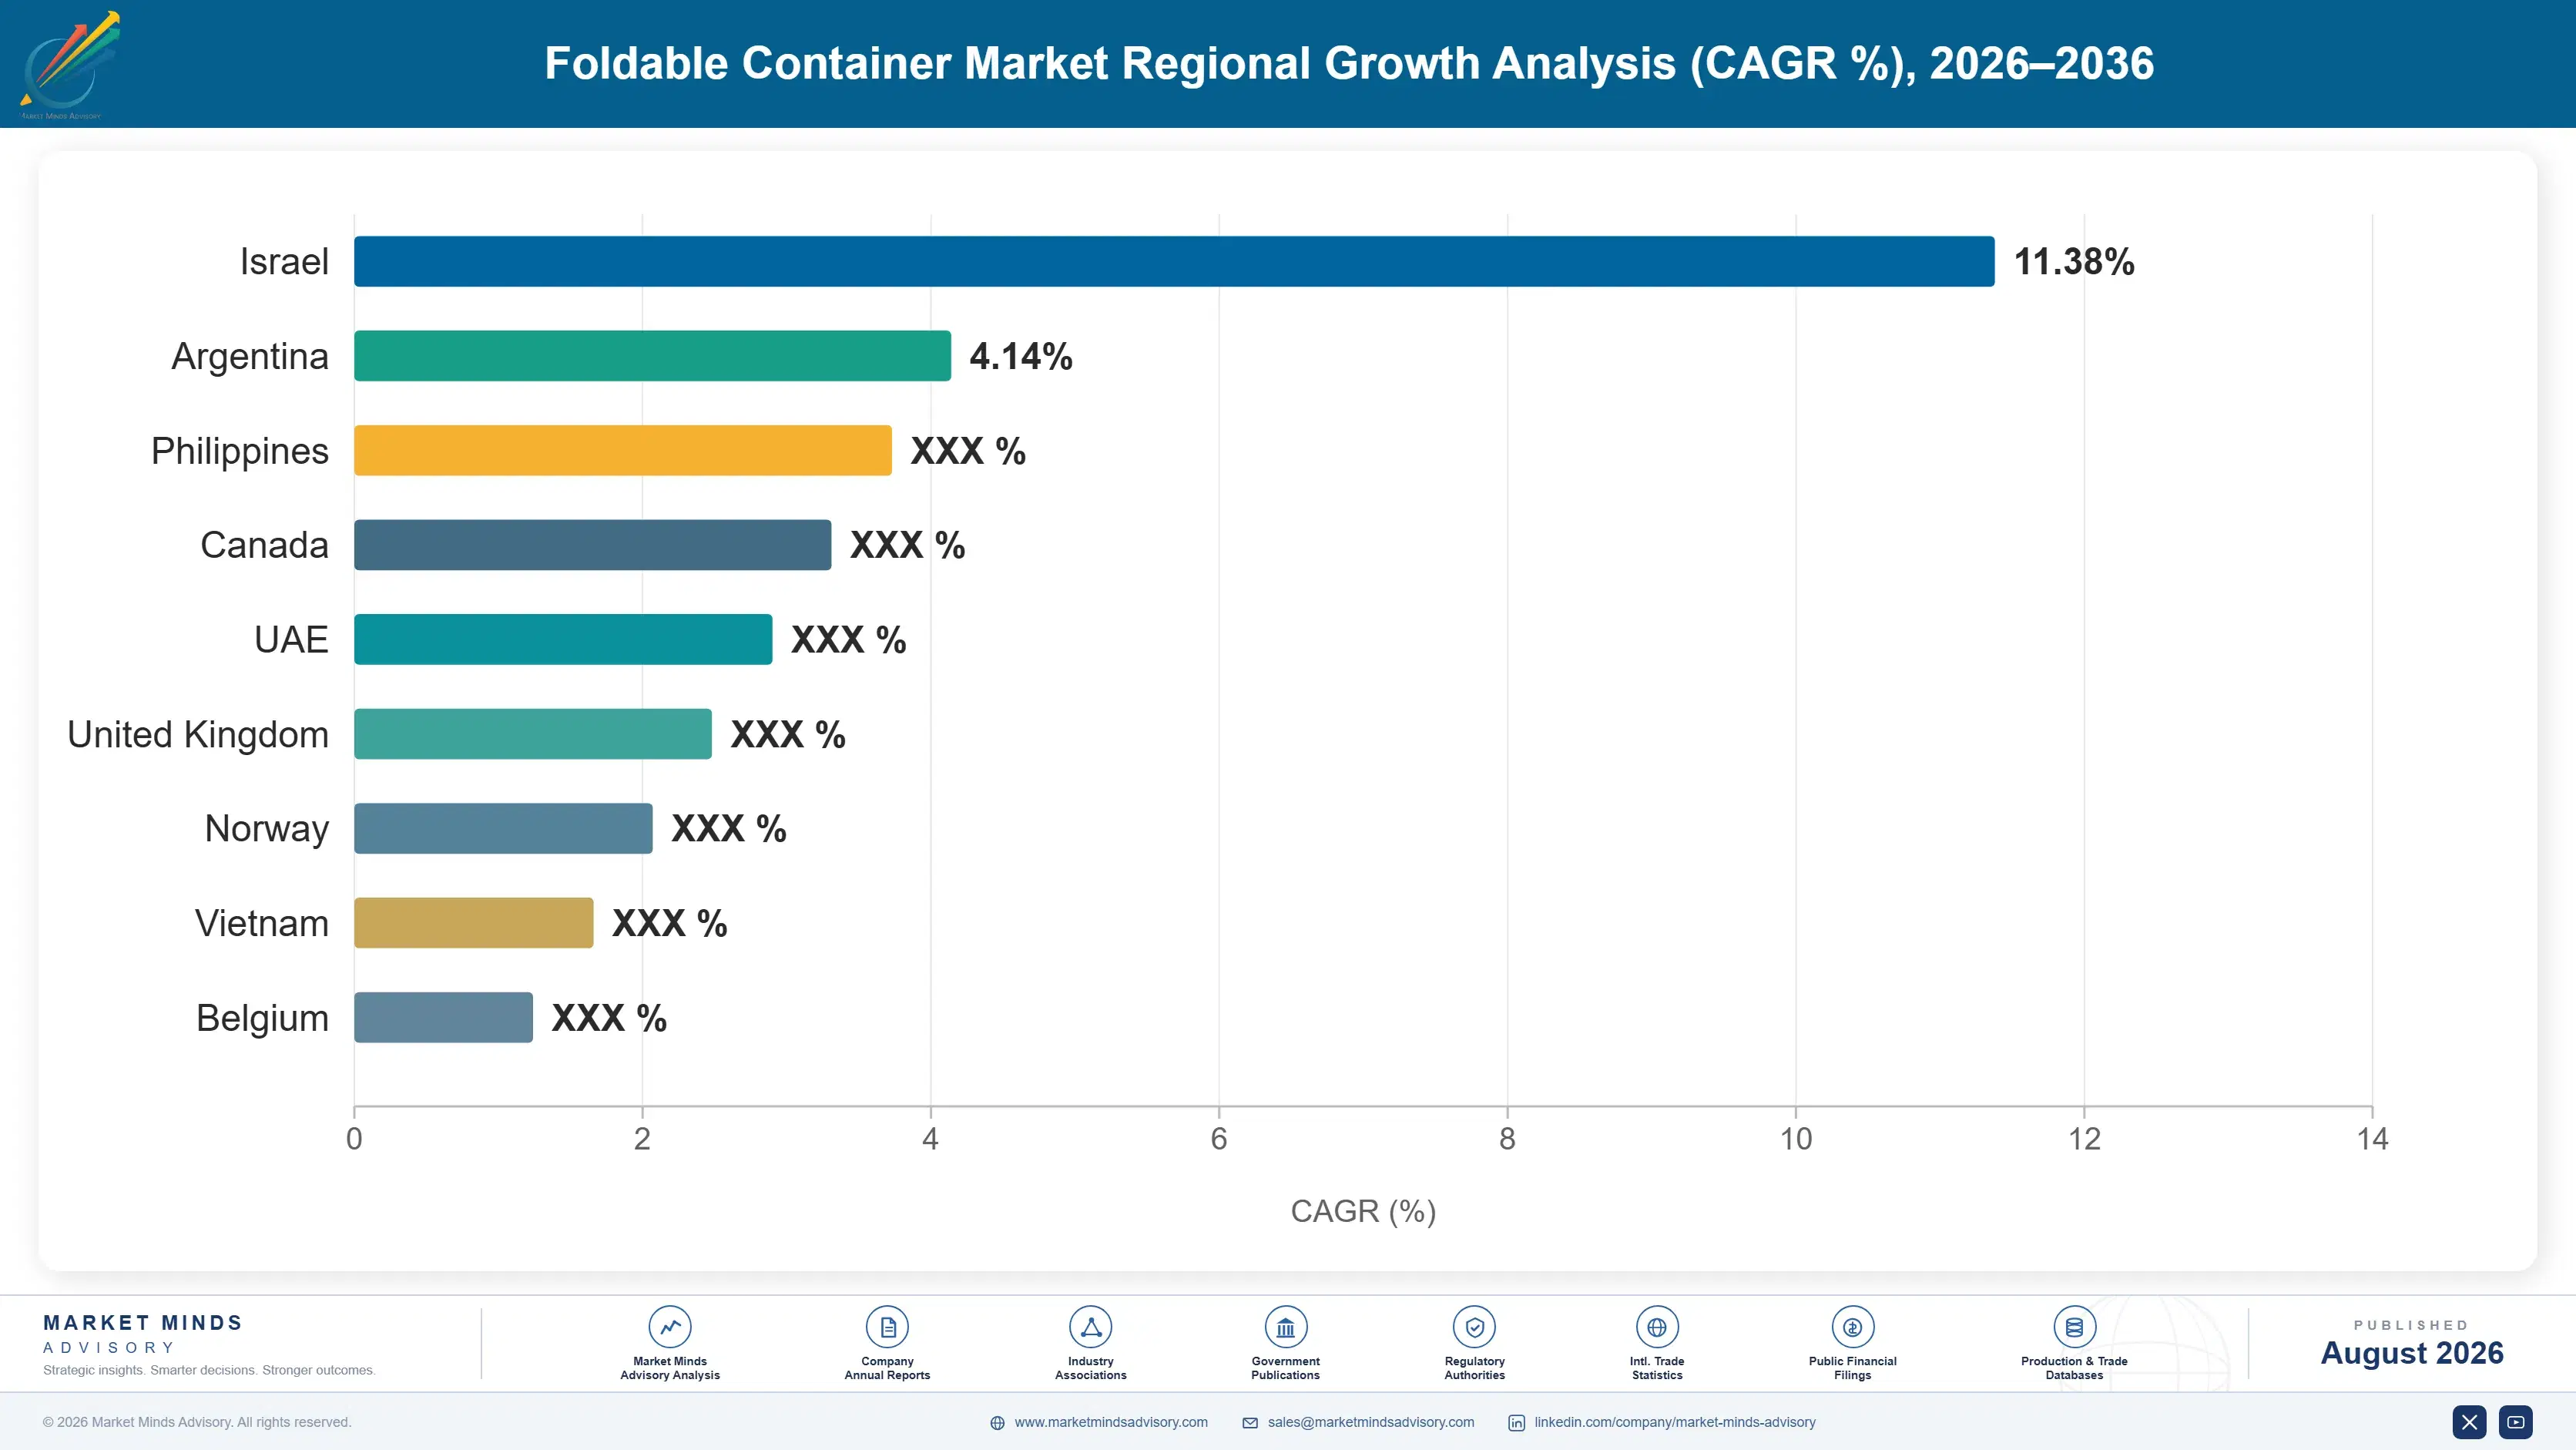
India: 8.8% CAGR
Fastest Growth Region
South Asia and Pacific: 8.8% CAGR
Largest Region
East Asia: 33% of 2025 global value
Market Leaders
Leading suppliers: ORBIS Corporation, Schoeller Allibert, CABKA Group, Georg Utz Holding, and IFCO Systems. Source: MMA Primary Research Dataset, July 2026.
Primary Survey
n=3,800 procurement and R&D decision-makers, Q4 2025, six countries
Methodology
Demand-side build-up, cross-validated against public data, 47 expert interviews

Foldable Container Market Forecast Scenarios

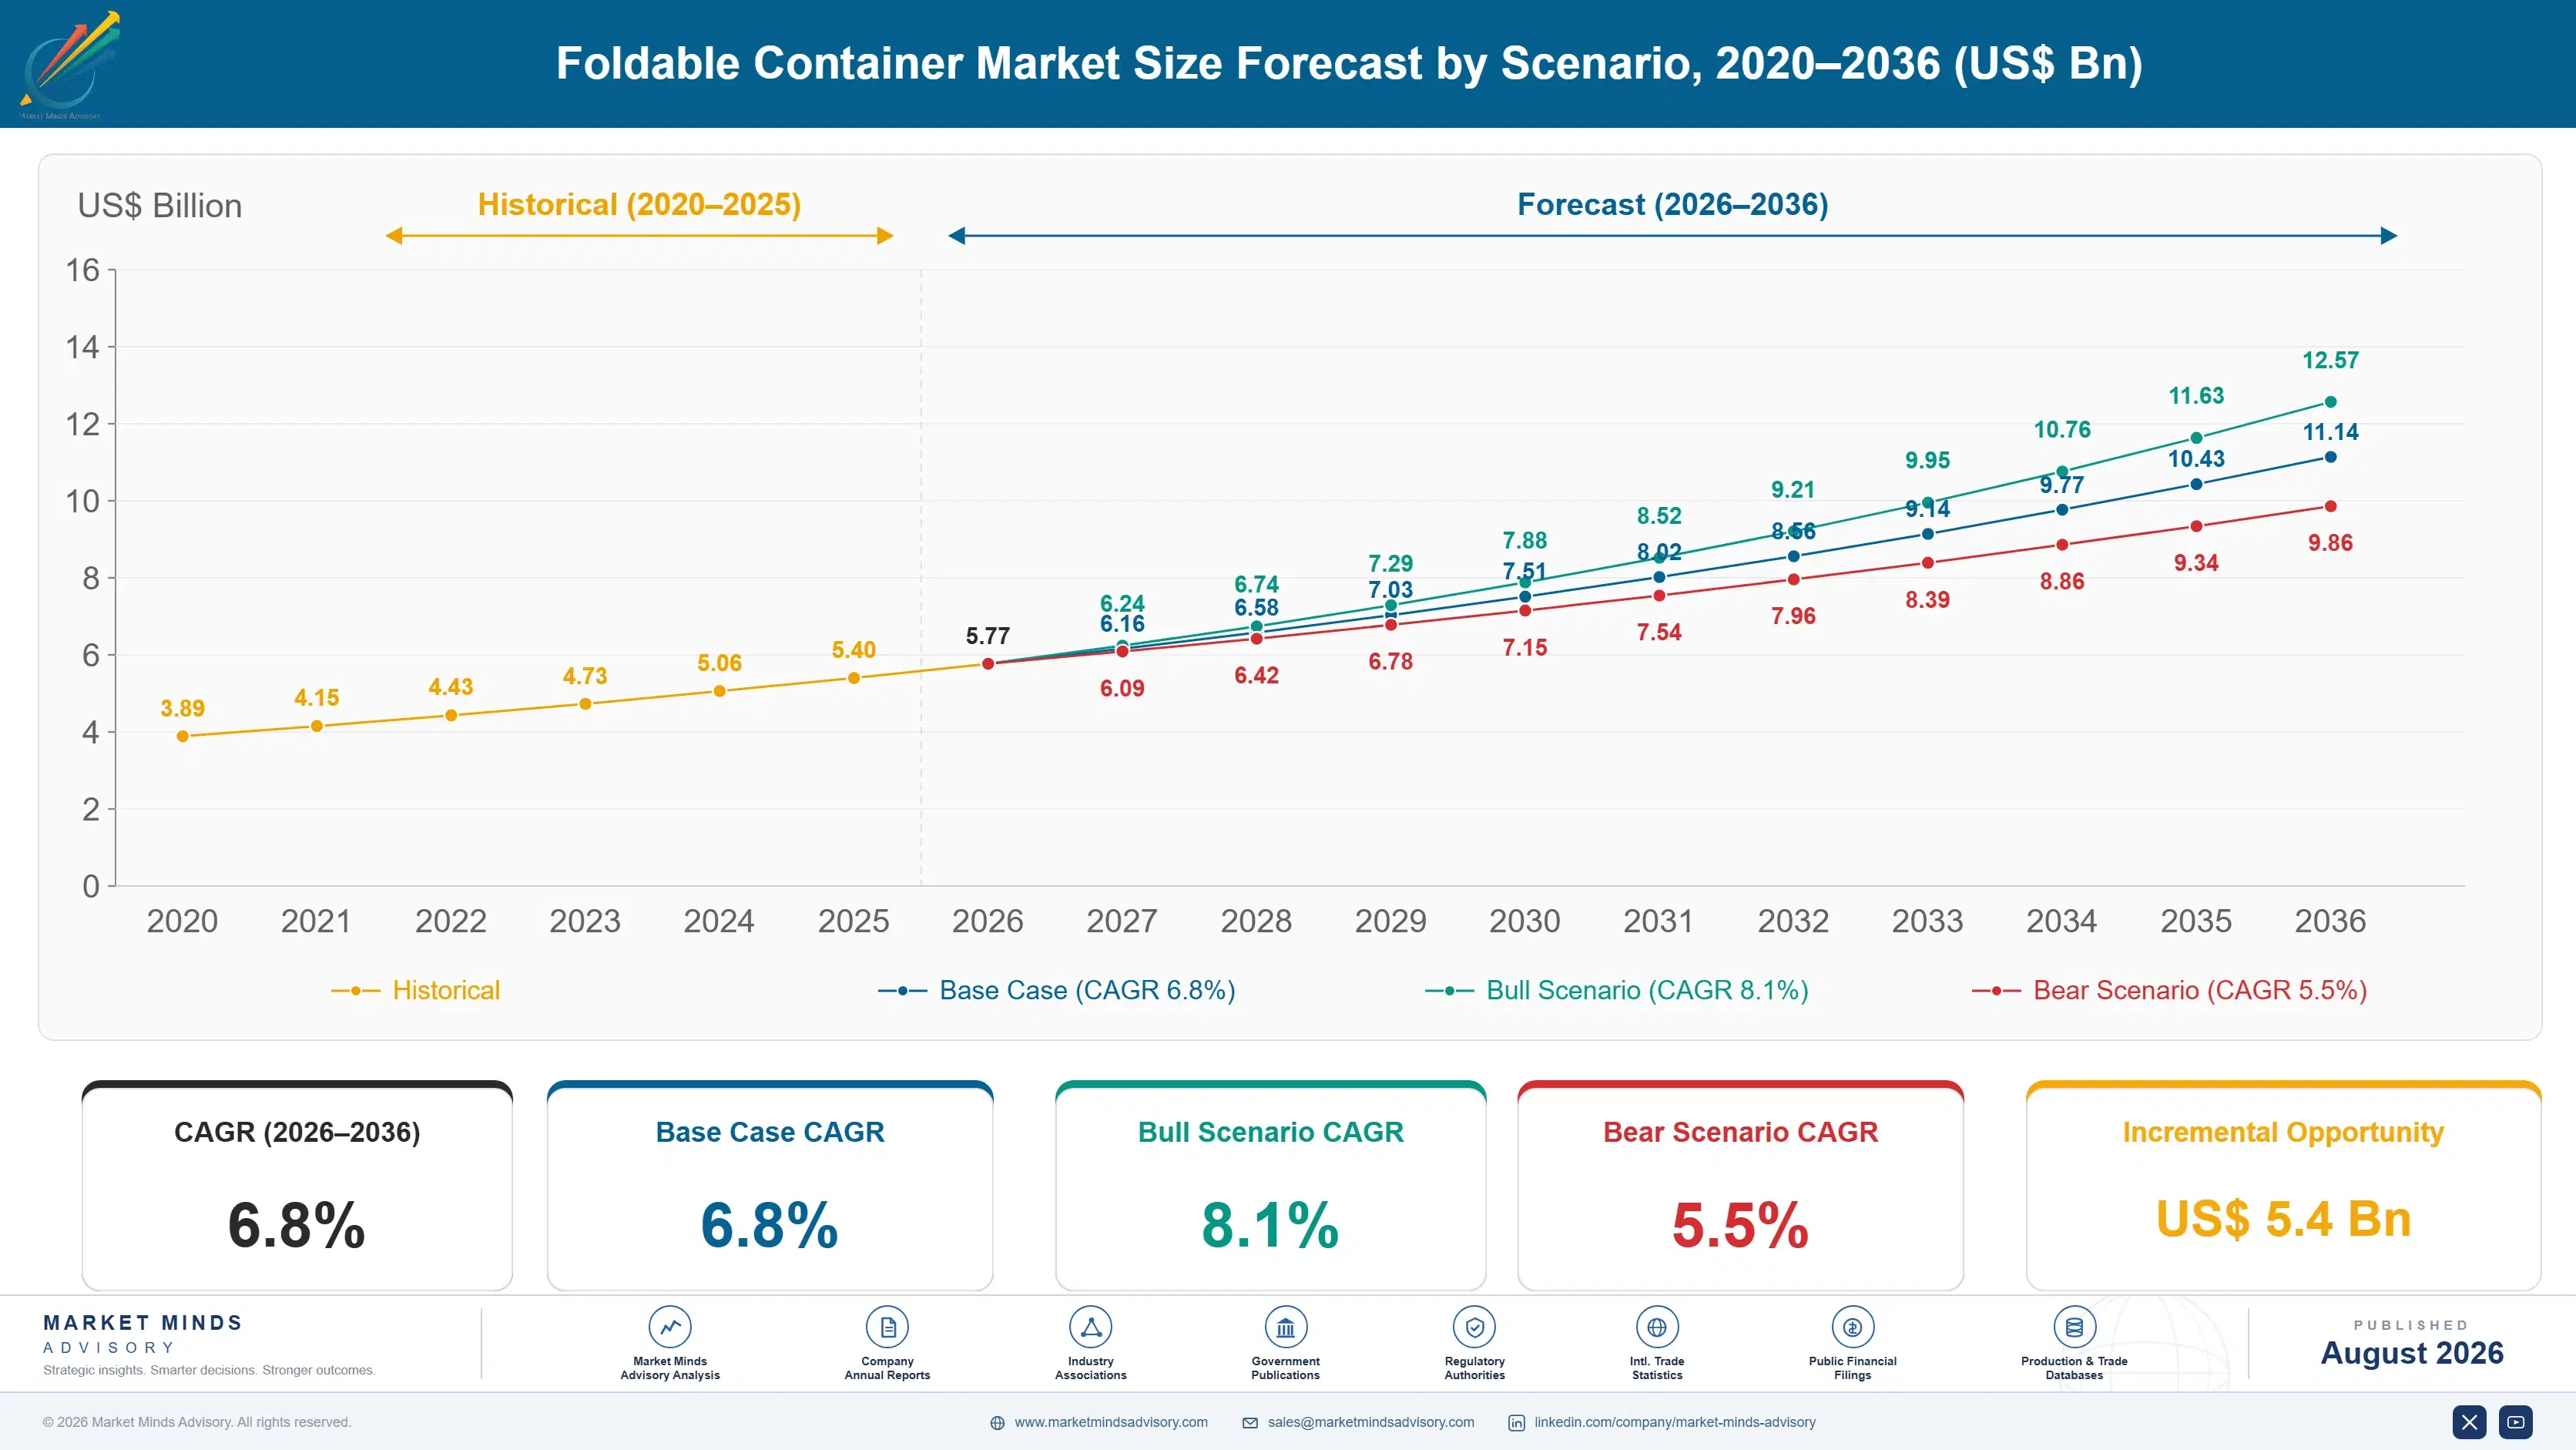
foldable-container-market-size-forecast-scenario-1787550894751
Between 2020 and 2025 the market grew at an estimated 6.0% annually as e-commerce logistics volume expanded globally and sustainability pressure pushed retailers toward reusable packaging, though early years saw many companies sticking with familiar rigid containers rather than committing to collapsible alternatives across most distribution networks and warehouse operations worldwide during that entire period.
The base case assumes 6.8% annual growth through 2036, anchored in three commercial mechanisms: continued e-commerce and cold chain logistics expansion requiring efficient empty-return packaging, China's dominant plastics manufacturing base scaling foldable container capacity, and growing container pooling arrangements that shift purchasing decisions toward third-party logistics providers across multiple industries and geographies worldwide today. Foldable bulk containers carry the base case forward fastest, reflecting where return-freight savings concentrate most heavily.
The bull case, 8.1%, assumes faster global e-commerce and cold chain logistics growth than currently projected, pulling forward both new adoption and replacement demand across multiple container categories simultaneously. The bear case, 5.5%, reflects a scenario where broader logistics capital expenditure growth slows relative to current projections, dampening both new facility construction and the pace of collapsible container conversion industry-wide.

Pooling Models Reshape Who Actually Buys Containers

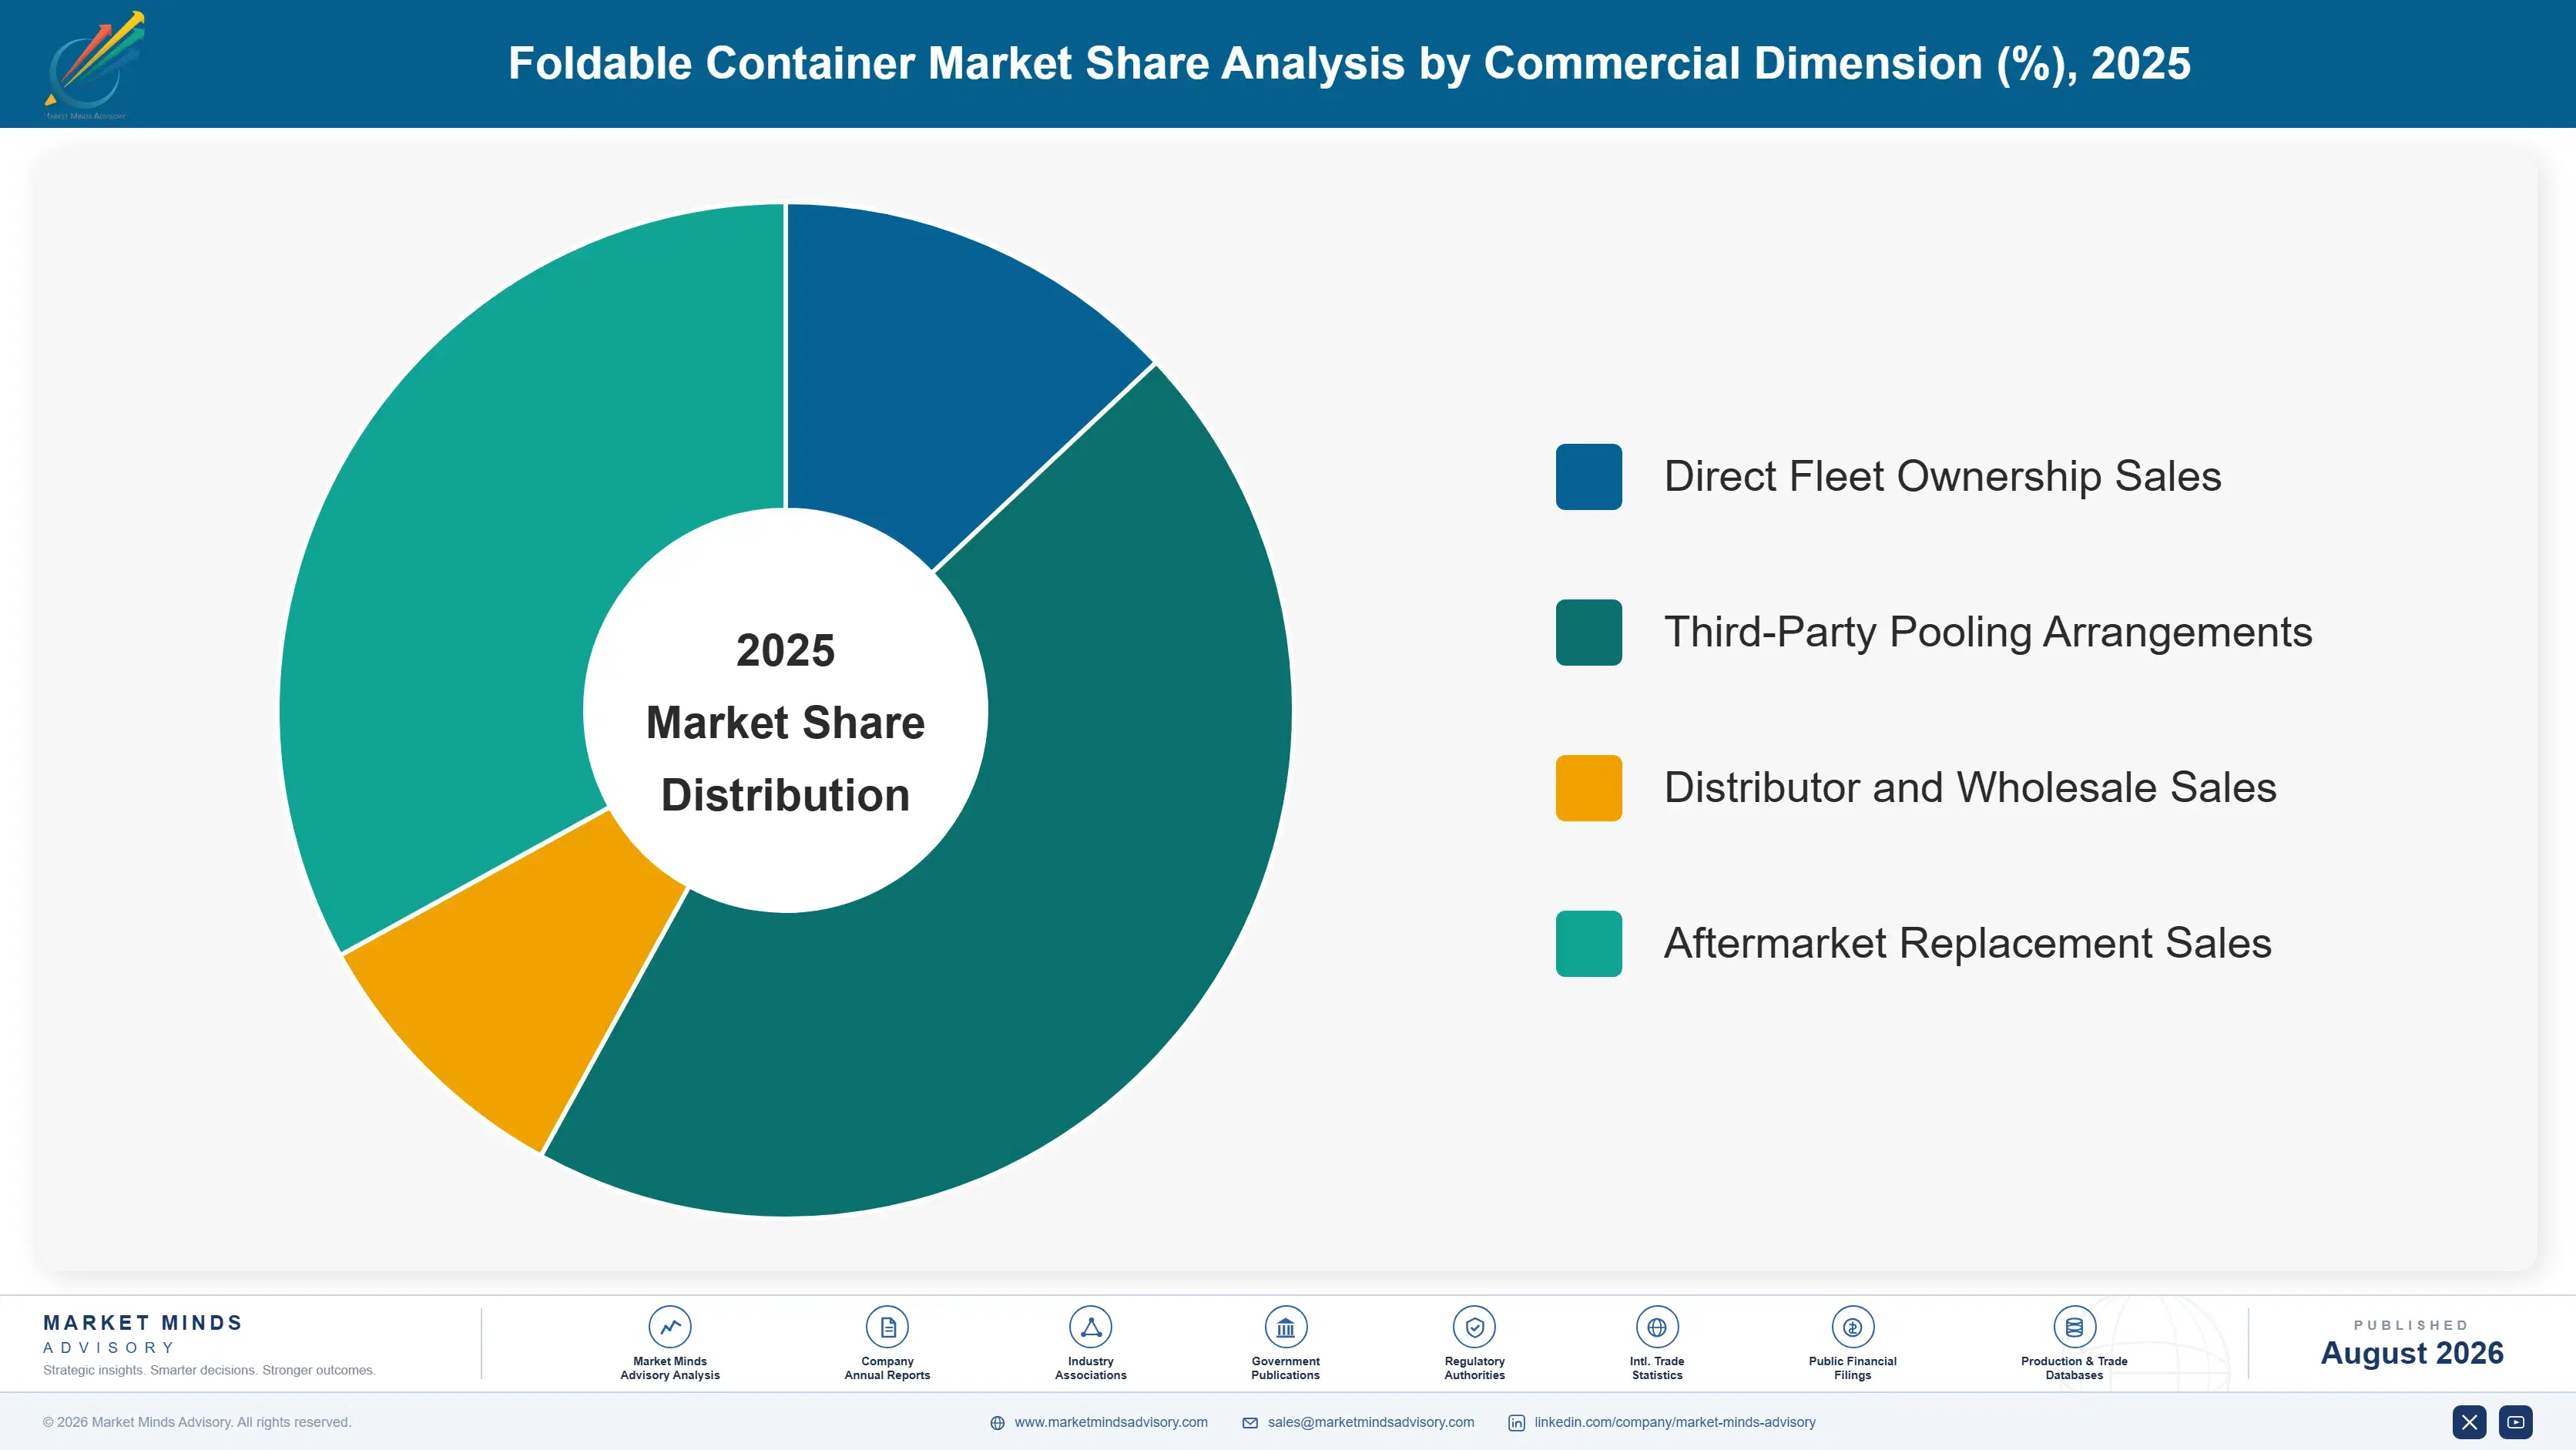
Pooling arrangements now account for 40% to 50% of total container volume, a meaningfully higher share than a decade ago, since third-party logistics providers increasingly own and circulate fleets across multiple retail and manufacturing customers rather than each company purchasing and maintaining its own container inventory. This shift concentrates purchasing power among a smaller number of pooling operators rather than thousands of individual end users.
TOP-5 MANUFACTURER CONCENTRATION42%Reflects a market split among global reusable packaging specialists
AVERAGE CONTAINER ASP$45 per unitTracks typical pricing for a standard collapsible logistics container
CHINA PRODUCTION SHARE34%Shows how concentrated global manufacturing capacity has become domestically
POOLING SHARE OF VOLUME40% to 50%Captures how much volume moves through third-party pooling arrangements
RESIN SHARE OF COGS45% to 55%Indicates how exposed margins are to upstream polymer feedstock pricing
FOLD CYCLE DURABILITY RATING500 to 1000 cyclesMarks how many collapse and expand cycles a container withstands
Average selling prices sit around 45 dollars per unit, though full fleet contracts covering thousands of containers generate meaningful aggregate contract value per logistics customer relationship. Fold cycle durability ratings of 500 to 1000 cycles have become a genuine specification buyers evaluate closely, since containers that fail early in a pooling fleet's operating life erode the economics pooling operators depend on.
Polymer resin inputs represent 45% to 55% of cost of goods sold, exposing manufacturer margins directly to petrochemical feedstock pricing cycles that vary considerably by region depending on resin grade and container durability requirements. Manufacturers with in-house resin compounding capability carry a meaningful cost advantage over those purchasing finished resin on the open market, particularly during periods of feedstock volatility.
"Everyone focuses on the container itself, but the real business model shift is who owns it. Once a pooling operator controls the fleet, the manufacturer's customer isn't the retailer anymore, it's the pool."
Principal Analyst, Packaging and Logistics Practice · MMA Packaging Practice · August 2026

Market Trends

Container Pooling Models Reshape Purchasing Decisions

Pooling arrangements have grown from roughly 25% of total container volume a decade ago to an estimated 40% to 50% today, as third-party logistics providers increasingly own and circulate fleets across multiple retail and manufacturing customers rather than each company maintaining its own inventory. This shift concentrates purchasing decisions among a smaller number of large pooling operators, changing who manufacturers actually need to court for volume contracts. Suppliers with established pooling operator relationships are capturing the bulk of large fleet orders ahead of competitors still selling primarily to individual end-user companies directly.
Market Impact: Parcels exceed 300 billion by 2027
RFID and IoT Tracking Integration Becomes Standard

RFID and IoT-enabled tracking adoption in foldable containers has grown from roughly 10% of new units in 2021 to an estimated 25% to 30% today, as logistics operators demand real-time visibility into container location and utilization across sprawling distribution networks and warehouse facilities worldwide today. This shift is creating a genuine premium category beyond basic collapsible design, since tracking-enabled containers command meaningfully higher pricing than untracked alternatives. Suppliers with validated tracking integration are winning large pooling operator contracts faster than competitors still offering only basic collapsible designs without embedded electronics.
Market Impact: Targets 40% reusable packaging by 2030

Market Opportunities and Growth Drivers

Global E-Commerce Parcel Growth Sustains Container Demand

Global e-commerce parcel volume is projected to exceed 300 billion shipments annually by 2027, directly driving demand for reusable packaging that survives repeated fulfillment center cycling far more efficiently than single-use alternatives ever truly could. This sustained volume growth keeps logistics operators investing in collapsible container fleets even as individual retailer e-commerce growth rates vary considerably by market and product category. Suppliers with established fulfillment center relationships and pooling operator contracts are capturing the bulk of this demand ahead of smaller regional competitors still building comparable scale and distribution reach.
Market Impact: Resin prices swung over 20%

EU Packaging Regulation Mandates Reusable Packaging Targets

The EU Packaging and Packaging Waste Regulation sets binding reusable packaging targets requiring 40% of transport packaging to be reusable by 2030, directly pulling demand toward foldable containers over single-use alternatives across the entire European logistics sector and broader supply chain. Roughly 27 member states must implement this requirement uniformly, creating a consistent continent-wide incentive for retailers and manufacturers to invest in collapsible packaging fleets rather than varying compliance approaches by individual country. Suppliers with established European pooling networks are winning contracts faster than competitors still building regional distribution infrastructure.
Market Impact: Failures occur before 500 fold cycles

Market Restraints and Challenges

Resin Price Volatility Compresses Manufacturer Margins

Polymer resin prices swung by more than 20% between 2023 and 2025, driven by upstream petrochemical feedstock volatility rather than container-specific demand shifts affecting the wider industry. The root cause is that most container manufacturers still purchase resin on the open market rather than under long-term contracts, leaving margins exposed every time petrochemical pricing spikes unexpectedly. The commercial impact falls hardest on smaller manufacturers without pricing power to pass costs through to fleet contracts mid-cycle. Some larger manufacturers are exploring backward integration into resin compounding to dampen this exposure going forward.
Market Impact: 40% to 50% now pooled

Fold Mechanism Failure Undermines Pooling Fleet Economics

Foldable containers that fail before reaching their rated 500 to 1000 fold cycle durability threshold erode the return-on-investment calculation pooling operators depend on to justify fleet-wide adoption over disposable alternatives entirely and permanently. The root cause is that fold mechanism hinges and locking points experience concentrated mechanical stress that rigid containers never encounter, making them the most common failure point across the entire product design. Some manufacturers are mitigating this by offering extended warranty programs and predictive replacement scheduling that reduce unplanned fleet downtime for pooling operators managing thousands of units.
Market Impact: 25% to 30% now tracking-enabled
3 additional market trends, 4 additional growth drivers, and 2 additional restraints and challenges are covered in the full report. Contact sales@marketmindsadvisory.com to access the complete intelligence.

Segment CAGR and Growth Architecture

Segmentation follows container product type, the classification logistics operators use when specifying fleet equipment, since each product addresses a distinct load capacity and handling requirement through fundamentally different structural engineering rather than a shared design or manufacturing pathway, and each typically involves a separate qualification process and pooling contract structure across all six categories.
foldable-container-market-market-share-analysis-1787550895281

Foldable Bulk Containers (Pallet Boxes)

Foldable bulk containers used for pallet-level shipping are the fastest-growing segment, expanding at 9.5% annually as cold chain and agricultural logistics operators chase the return-freight savings collapsible pallet boxes deliver over rigid alternatives across long-haul distribution networks and multi-country supply chains worldwide today and quite consistently overall across most regions and countries. These containers fold flat to roughly one-fifth their expanded height, dramatically reducing empty-return truck space compared to rigid pallet boxes that must be shipped fully assembled regardless of contents. Demand concentrates heavily in cold chain and fresh produce logistics, where pooling operators circulate large fleets across growers, distributors, and retailers on tight seasonal schedules requiring rapid container availability.
CAGR 9.5%

RFID and IoT-Enabled Foldable Containers

RFID and IoT-enabled foldable containers, the second-fastest segment at 8.2% annually, embed tracking electronics that let pooling operators monitor container location, utilization, and fold-cycle wear across sprawling distribution networks in real time and across multiple facilities, countries, and continents simultaneously, continuously, and quite reliably at every single operating stage today and reliably. This segment commands meaningfully higher pricing than untracked alternatives, reflecting the added electronics and software integration cost embedded in every unit sold across the fleet. Growth concentrates among large pooling operators managing fleets across multiple countries, where visibility into container location prevents costly losses and idle inventory that untracked fleets struggle to manage efficiently at scale and cost.
CAGR 8.2%
Full segment breakdown across 6 segments available in the complete report.

Regional Architecture and Country Demand Map

Demand concentrates heavily around China's massive e-commerce logistics infrastructure and dominant plastics manufacturing base, with East Asia broadly commanding the largest regional share worldwide today by a wide margin, while North America holds a strong secondary position tied to cold chain and retail distribution growth.

East Asia

China anchors East Asian demand through the sheer scale of its e-commerce logistics infrastructure, the largest parcel volume in the world by a wide margin, combined with a dominant domestic plastics manufacturing base scaling foldable container capacity fastest to serve both local logistics operators and export markets simultaneously and consistently, and this dominance pushes the region's share meaningfully above MMA's standard band, a deliberate house-rule deviation reflecting China's genuinely outsized position in both e-commerce logistics demand and container production capacity relative to any other region on earth. Japan and South Korea contribute technically sophisticated demand from established cold chain and retail operators across the region. Regional growth remains steady as e-commerce volume keeps expanding.
Share: 33% | CAGR: 7.8% (2026 to 2036)

North America

Cold chain and grocery distribution expansion, alongside continued e-commerce fulfillment center construction, drives most North American demand as retailers and logistics operators invest in reusable packaging fleets to reduce single-use plastic waste and freight costs simultaneously across most product categories, regions, and distribution channels nationwide today and consistently. Domestic and international manufacturers with US pooling networks compete closely for large fleet contracts, since operators increasingly favor suppliers who can guarantee rapid container replenishment during peak seasonal demand periods. Pooling adoption runs ahead of most other regions here, reflecting the maturity of third-party logistics relationships across major American retailers and food distributors. Canadian cold chain operators add a smaller, complementary regional contribution.
Share: 25% | CAGR: 6.3% (2026 to 2036)
Regional intelligence for 5 additional markets available in the complete report: Western Europe, South Asia and Pacific, Latin America, Middle East and Africa, Eastern Europe. Contact sales@marketmindsadvisory.com.
foldable-container-market-country-cagr-analysis-1787550895790

Where Container Makers Can Capture Margin

Four commercial levers determine which container manufacturers capture disproportionate margin as the market shifts toward pooling-driven, technology-enabled demand: expanding into RFID-enabled production, building direct pooling operator relationships, localizing manufacturing inside China's rapidly expanding e-commerce hub, and pursuing EU reusable packaging compliance contracts ahead of the binding 2030 regulatory deadline across most member states now.

Expand Into RFID-Enabled Container Production Lines

RFID and IoT-enabled tracking adoption has grown from roughly 10% of new units in 2021 to an estimated 25% to 30% today, and that share is expanding as pooling operators demand real-time visibility into fleet location and utilization. Suppliers already qualified on standard collapsible container lines hold a natural advantage entering this adjacent category, since pooling operators prefer consolidating fleet sourcing with fewer, already-trusted suppliers rather than adding new qualification relationships. Entry requires meaningful investment in electronics integration and software compatibility testing, but the margin premium justifies that investment for suppliers with existing pooling relationships.
Market Impact: Captures share of the 25% to 30% tracking segment

Build Direct Relationships With Pooling Operators

Pooling arrangements now represent 40% to 50% of total container volume, concentrating purchasing decisions among a smaller number of large pooling operators rather than thousands of individual end-user companies purchasing independently across the market. Suppliers building dedicated pooling operator sales and account management capability capture disproportionate volume compared to competitors still selling primarily to individual retailers and manufacturers directly. This approach requires shifting sales strategy and contract structure toward large-fleet framework agreements, but the volume concentration makes each successful pooling relationship meaningfully more valuable than a comparable individual customer account.
Market Impact: Captures share of the 40% to 50% pooled market

Localize Manufacturing Inside China's E-Commerce Hub

East Asia holds 33% of global foldable container demand and China's e-commerce logistics infrastructure keeps expanding as domestic parcel volume grows, meaning suppliers without local production face rising tariff exposure and longer lead times relative to domestic Chinese competitors already firmly established there across the entire country. Establishing or expanding manufacturing footprint inside China captures a larger share of the world's largest e-commerce logistics market directly, though this lever carries meaningful capital commitment and intellectual property considerations that suppliers must weigh carefully before proceeding with local joint ventures or wholly owned facilities.
Market Impact: Captures share of China's 33% regional demand base

Pursue EU Reusable Packaging Compliance Contracts

The EU Packaging and Packaging Waste Regulation requires 40% of transport packaging to be reusable by 2030, directly pulling European retailer and manufacturer demand toward collapsible container fleets ahead of the binding compliance deadline across the region. Suppliers with established European pooling networks and compliance documentation capability are capturing the bulk of this demand ahead of competitors still building regional distribution infrastructure and certification credentials. Building certification and distribution partnerships now, well ahead of the 2030 deadline, positions suppliers to capture share as compliance pressure intensifies across the entire European logistics sector.
Market Impact: Targets EU's 40% reusable packaging mandate by 2030

Who Controls the Margin Pool

Concentration is moderate, with a CR5 near 42% on an annual revenue basis and a meaningful gap separating the five established leaders from a substantial tail of regional and specialty manufacturers still building comparable pooling networks, RFID integration capability, and durability engineering depth across most global markets.
Current competitive activity centers on three fronts: expanding RFID-enabled production to serve pooling operator automation demand, building direct pooling operator relationships that concentrate large-fleet purchasing decisions, and localizing manufacturing inside China to serve the world's largest e-commerce logistics market directly and efficiently across most product categories. Several manufacturers are also pursuing EU reusable packaging compliance contracts ahead of the 2030 regulatory deadline across the entire continent.

Emerging pressure comes from Chinese domestic manufacturers scaling production and pooling capability fast enough to challenge established Western suppliers on both cost and delivery speed, particularly within China's own e-commerce and cold chain logistics markets. Rankings could shift meaningfully over the next several years if Chinese suppliers close the technical gap on RFID integration and fold-cycle durability the way they have already done in overall production scale, a transition several established suppliers are watching closely.
foldable-container-market-company-positioning-matrix-1787550896309

Competitive Moat and Risk Dimensions

ORBIS CORPORATION

Moat: Established North American Pooling Network

ORBIS Corporation operates one of the largest pooling networks in North America, giving it existing fleet relationships and logistics infrastructure that smaller regional competitors cannot replicate without comparable capital investment and years of accumulated customer trust. This scale lets ORBIS win large multi-facility fleet contracts that narrower competitors struggle to service.
ORBIS CORPORATION

Risk: Slower on Chinese Domestic Accounts

ORBIS's manufacturing and pooling infrastructure is weighted more heavily toward North America than toward China specifically, leaving it comparatively slower to pursue the domestic Chinese e-commerce accounts now driving much of global container demand growth. Nimbler Chinese domestic suppliers focused specifically on these accounts are winning share ORBIS's broader global sales teams sometimes overlook.
SCHOELLER ALLIBERT

Moat: Deep European Pooling Relationship Depth

Schoeller Allibert has built pooling relationships with European retailers and food distributors over many decades of continuous engagement, giving it existing qualification standing that newer entrants lack entirely. This history lets Schoeller Allibert get invited into fleet design conversations earlier than competitors without comparable existing trust and regulatory track record.
SCHOELLER ALLIBERT

Risk: Limited Direct Presence in India

Schoeller Allibert has a comparatively limited direct manufacturing and distribution presence in India relative to domestic producers, leaving it more dependent on export shipments to capture the country's rapidly expanding cold chain and agricultural logistics demand. This gap in local presence could cost Schoeller Allibert meaningful share as Indian domestic capacity continues scaling.

Players Tracked

Prominent Players

ORBIS Corporation
Schoeller Allibert
CABKA Group
Georg Utz Holding
IFCO Systems

Other Key Players

Nefab Group
DS Smith
Loscam
Rehrig Pacific
Buckhorn Inc
Craemer Group
Bekuplast
SSI Schaefer
Polymer Logistics
Rotom
Menasha Corporation
Container Centralen
Wanpack
Shuang Yun Plastic
Zhejiang Jiaenbao Group

Recent Developments

FEBRUARY 2025

ORBIS Expands RFID-Enabled Container Production Capacity

ORBIS Corporation announced an expansion of its RFID-enabled container production line in the United States, adding capacity specifically to serve growing pooling operator demand for fully automated fleet tracking systems nationwide today. The expansion was an organic capacity addition, not a joint venture or acquisition.
Signal: Confirms established suppliers are now actively prioritizing dedicated RFID capacity to meet accelerating pooling automation demand.
JULY 2025

Chinese Manufacturer Signs Major E-Commerce Supply Agreement

A leading Chinese container manufacturer signed a multi-year supply agreement with a major domestic e-commerce logistics operator to provide foldable bulk containers for its continued fulfillment center expansion nationwide and across multiple regions. The agreement was a direct commercial supply contract, not an equity stake or acquisition.
Signal: Shows domestic Chinese suppliers are securing long-term e-commerce contracts ahead of international competitors entering the market.
NOVEMBER 2025

Schoeller Allibert Acquires RFID Integration Technology Producer

Schoeller Allibert acquired a smaller specialty RFID integration technology producer to add validated tracking capability to its existing container portfolio without building that entire technical capability fully internally from scratch first. The acquisition closed after a shortened regulatory review given the target's modest revenue scale.
Signal: Confirms acquisition is becoming a faster path into RFID integration than internal development for established suppliers.

Polymer Resin and Compound Cost Exposure

Polymer resin inputs represent 45% to 55% of cost of goods sold for foldable container manufacturers, sourced from polypropylene and high-density polyethylene producers concentrated in China, the Gulf Coast, and increasingly the Middle East. RFID chip and electronic components add a secondary but growing input cost as tracking-enabled containers represent a larger share of total product mix.
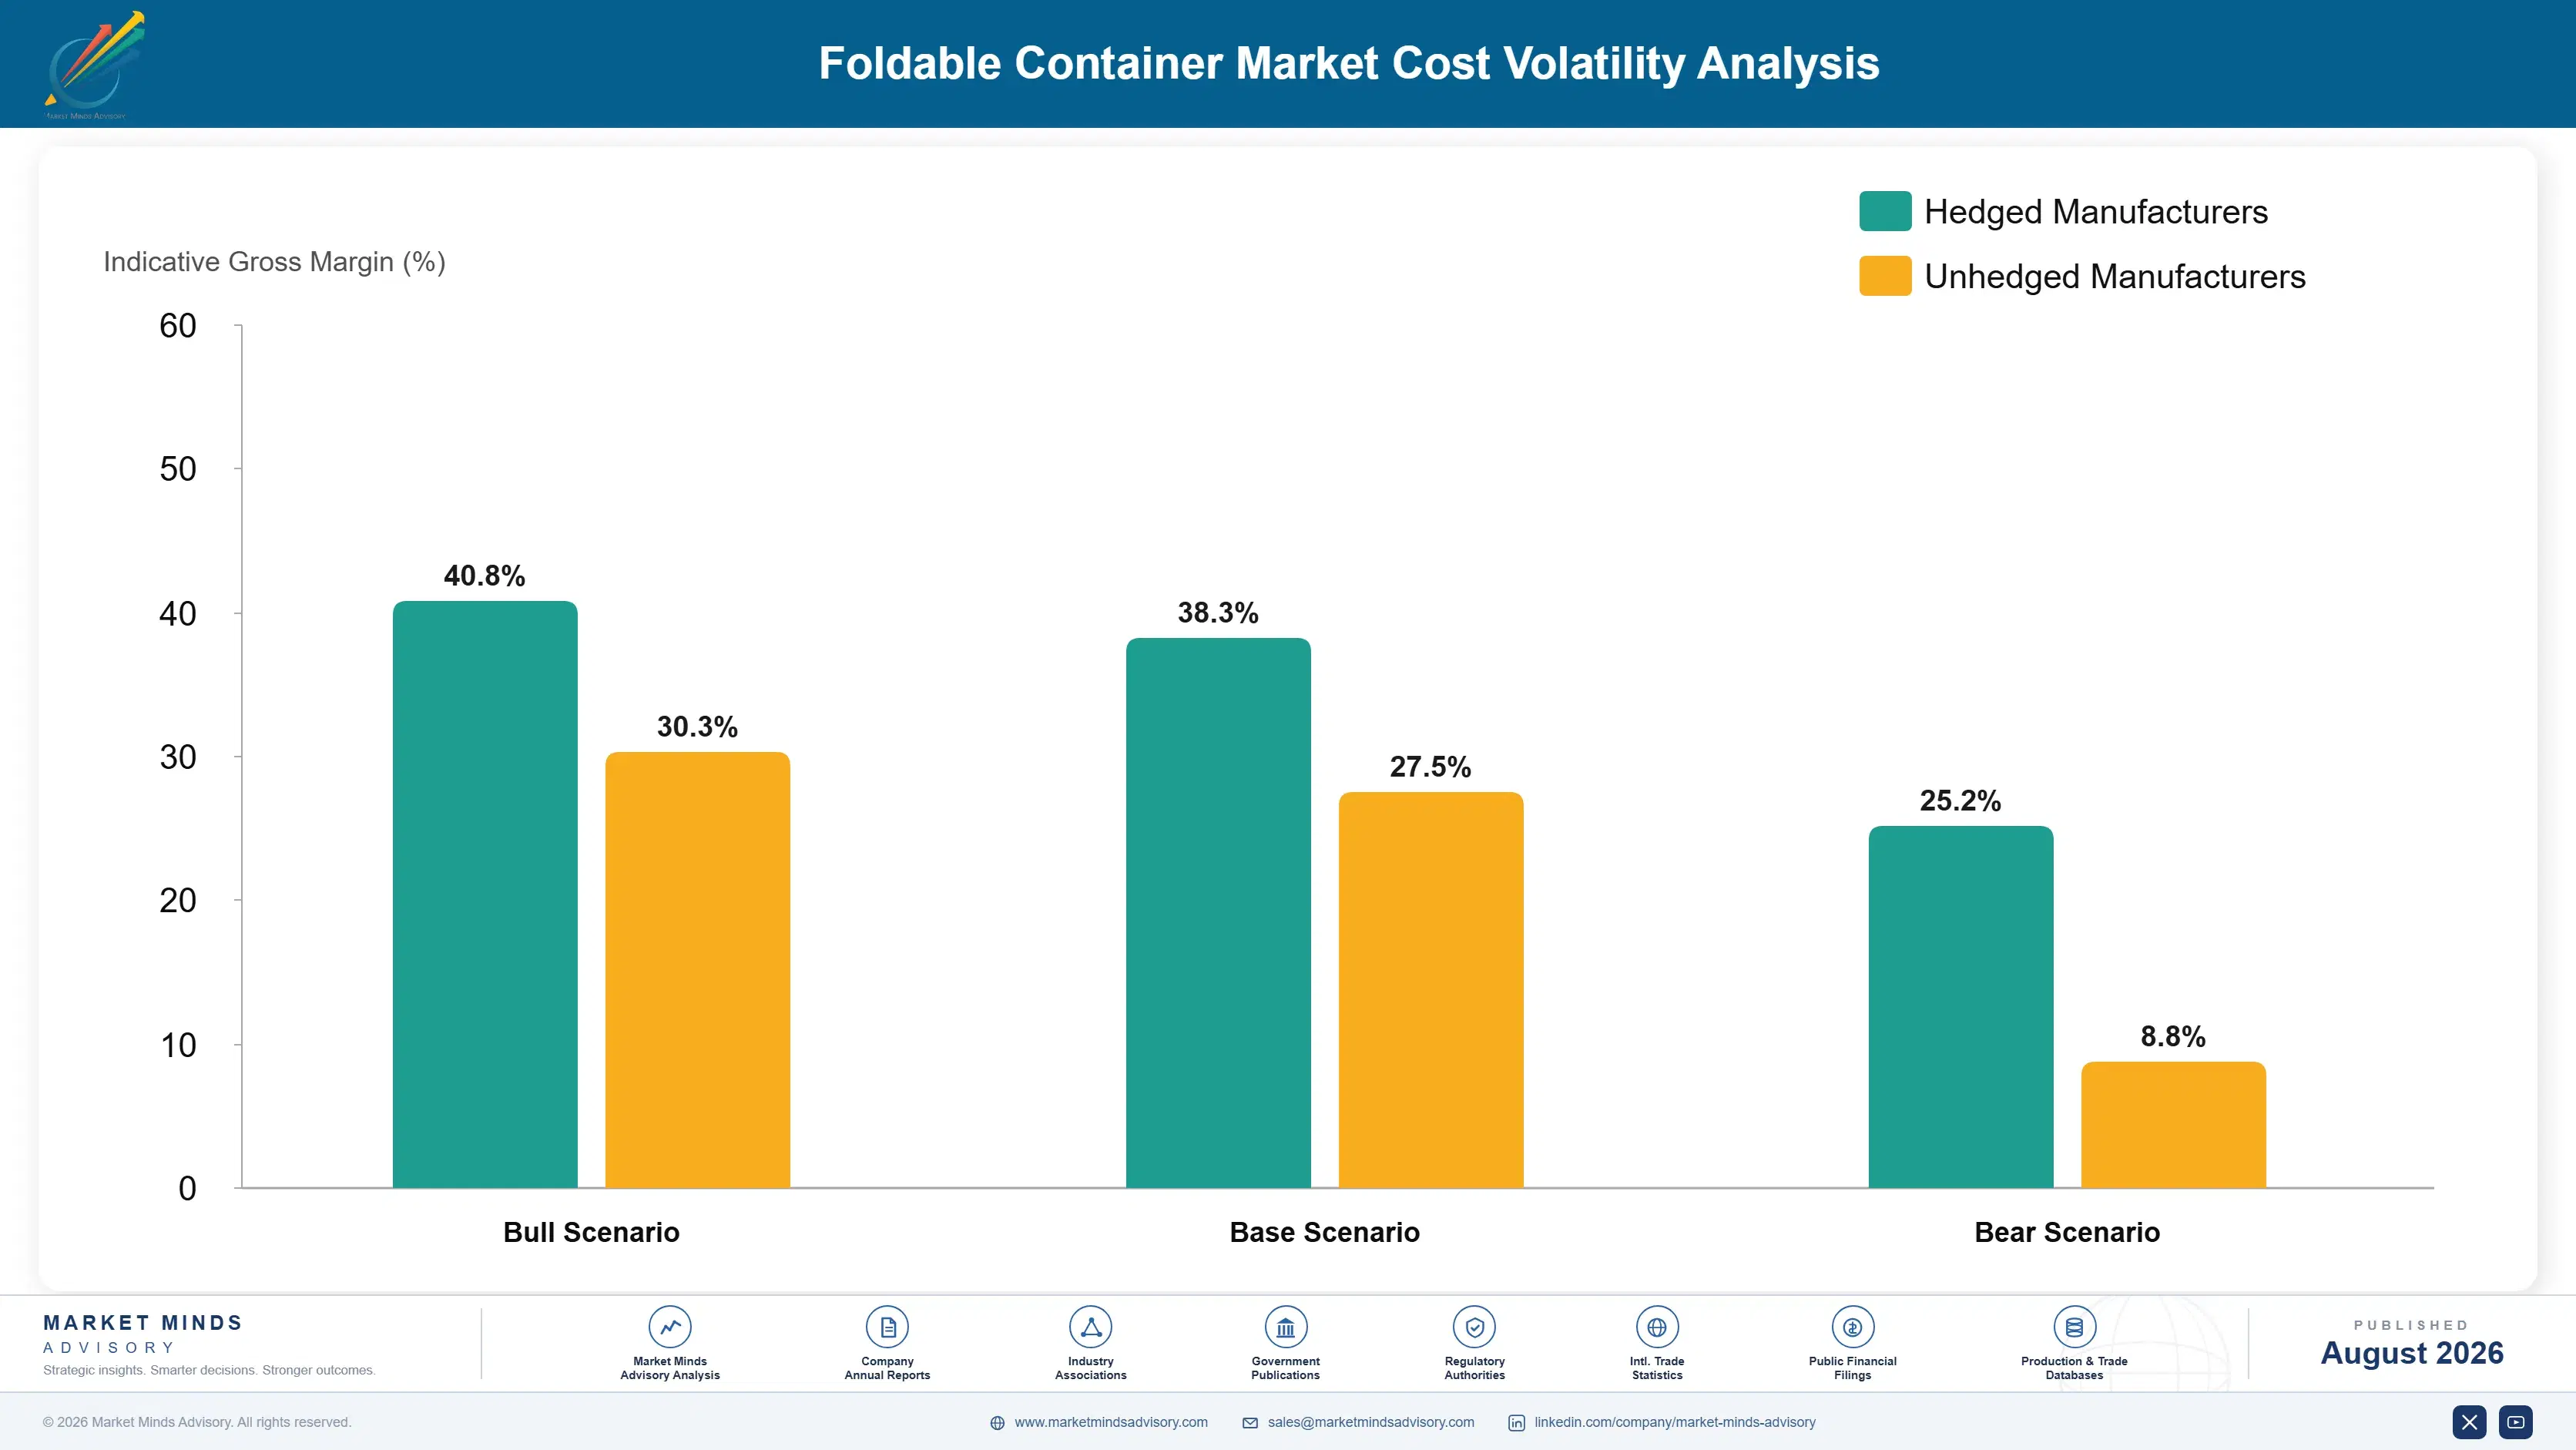
Polymer resin prices swung by more than 20% between 2023 and 2025 as upstream petrochemical feedstock volatility moved with broader crude oil and natural gas pricing cycles largely unrelated to container-specific demand shifts. Manufacturers without long-term resin supply contracts absorbed most of this swing directly, compressing gross margins meaningfully during the peak of the disruption before pricing gradually stabilized as feedstock markets settled into 2025.

Exposure varies meaningfully by player type: manufacturers integrated backward into resin compounding or holding long-term supply contracts absorb price swings far better than converters purchasing finished resin on the open market, and this gap becomes a genuine competitive disadvantage during volatile pricing periods. Geographic exposure differs too, since Chinese manufacturers sit closer to domestic resin production than European or North American competitors reliant on longer supply chains.
foldable-container-market-cost-volatility-analysis-1787550896503

Secure Multi-Year Resin Supply Contracts

Negotiating multi-year fixed-price or banded-price resin supply agreements protects margin against the kind of feedstock volatility that hit prices hard through 2024, giving container manufacturers genuinely predictable input costs to plan production scheduling and pooling contract pricing around well in advance, rather than absorbing spot-market swings directly into gross margin unpredictably every single cycle.

Pursue Backward Integration Into Resin Compounding

Larger container manufacturers with sufficient balance sheet capacity can integrate backward into resin compounding production directly, capturing the margin that would otherwise flow entirely to third-party resin suppliers while also gaining much more predictable and genuinely reliable feedstock access during periods of much broader and sustained petrochemical market tightness across the wider industry supply chain.

Diversify Resin Sourcing Across Multiple Geographic Regions

Sourcing resin from multiple geographic regions, rather than relying on a single supply corridor, reduces exposure to any one region's disruption, whether from trade policy, plant outages, or logistics delays affecting delivery timelines and schedules. Manufacturers already doing this reported smoother cost pass-through during the 2024 volatility spike than peers dependent on a single feedstock source.

Portfolio Architecture for Margin Defence

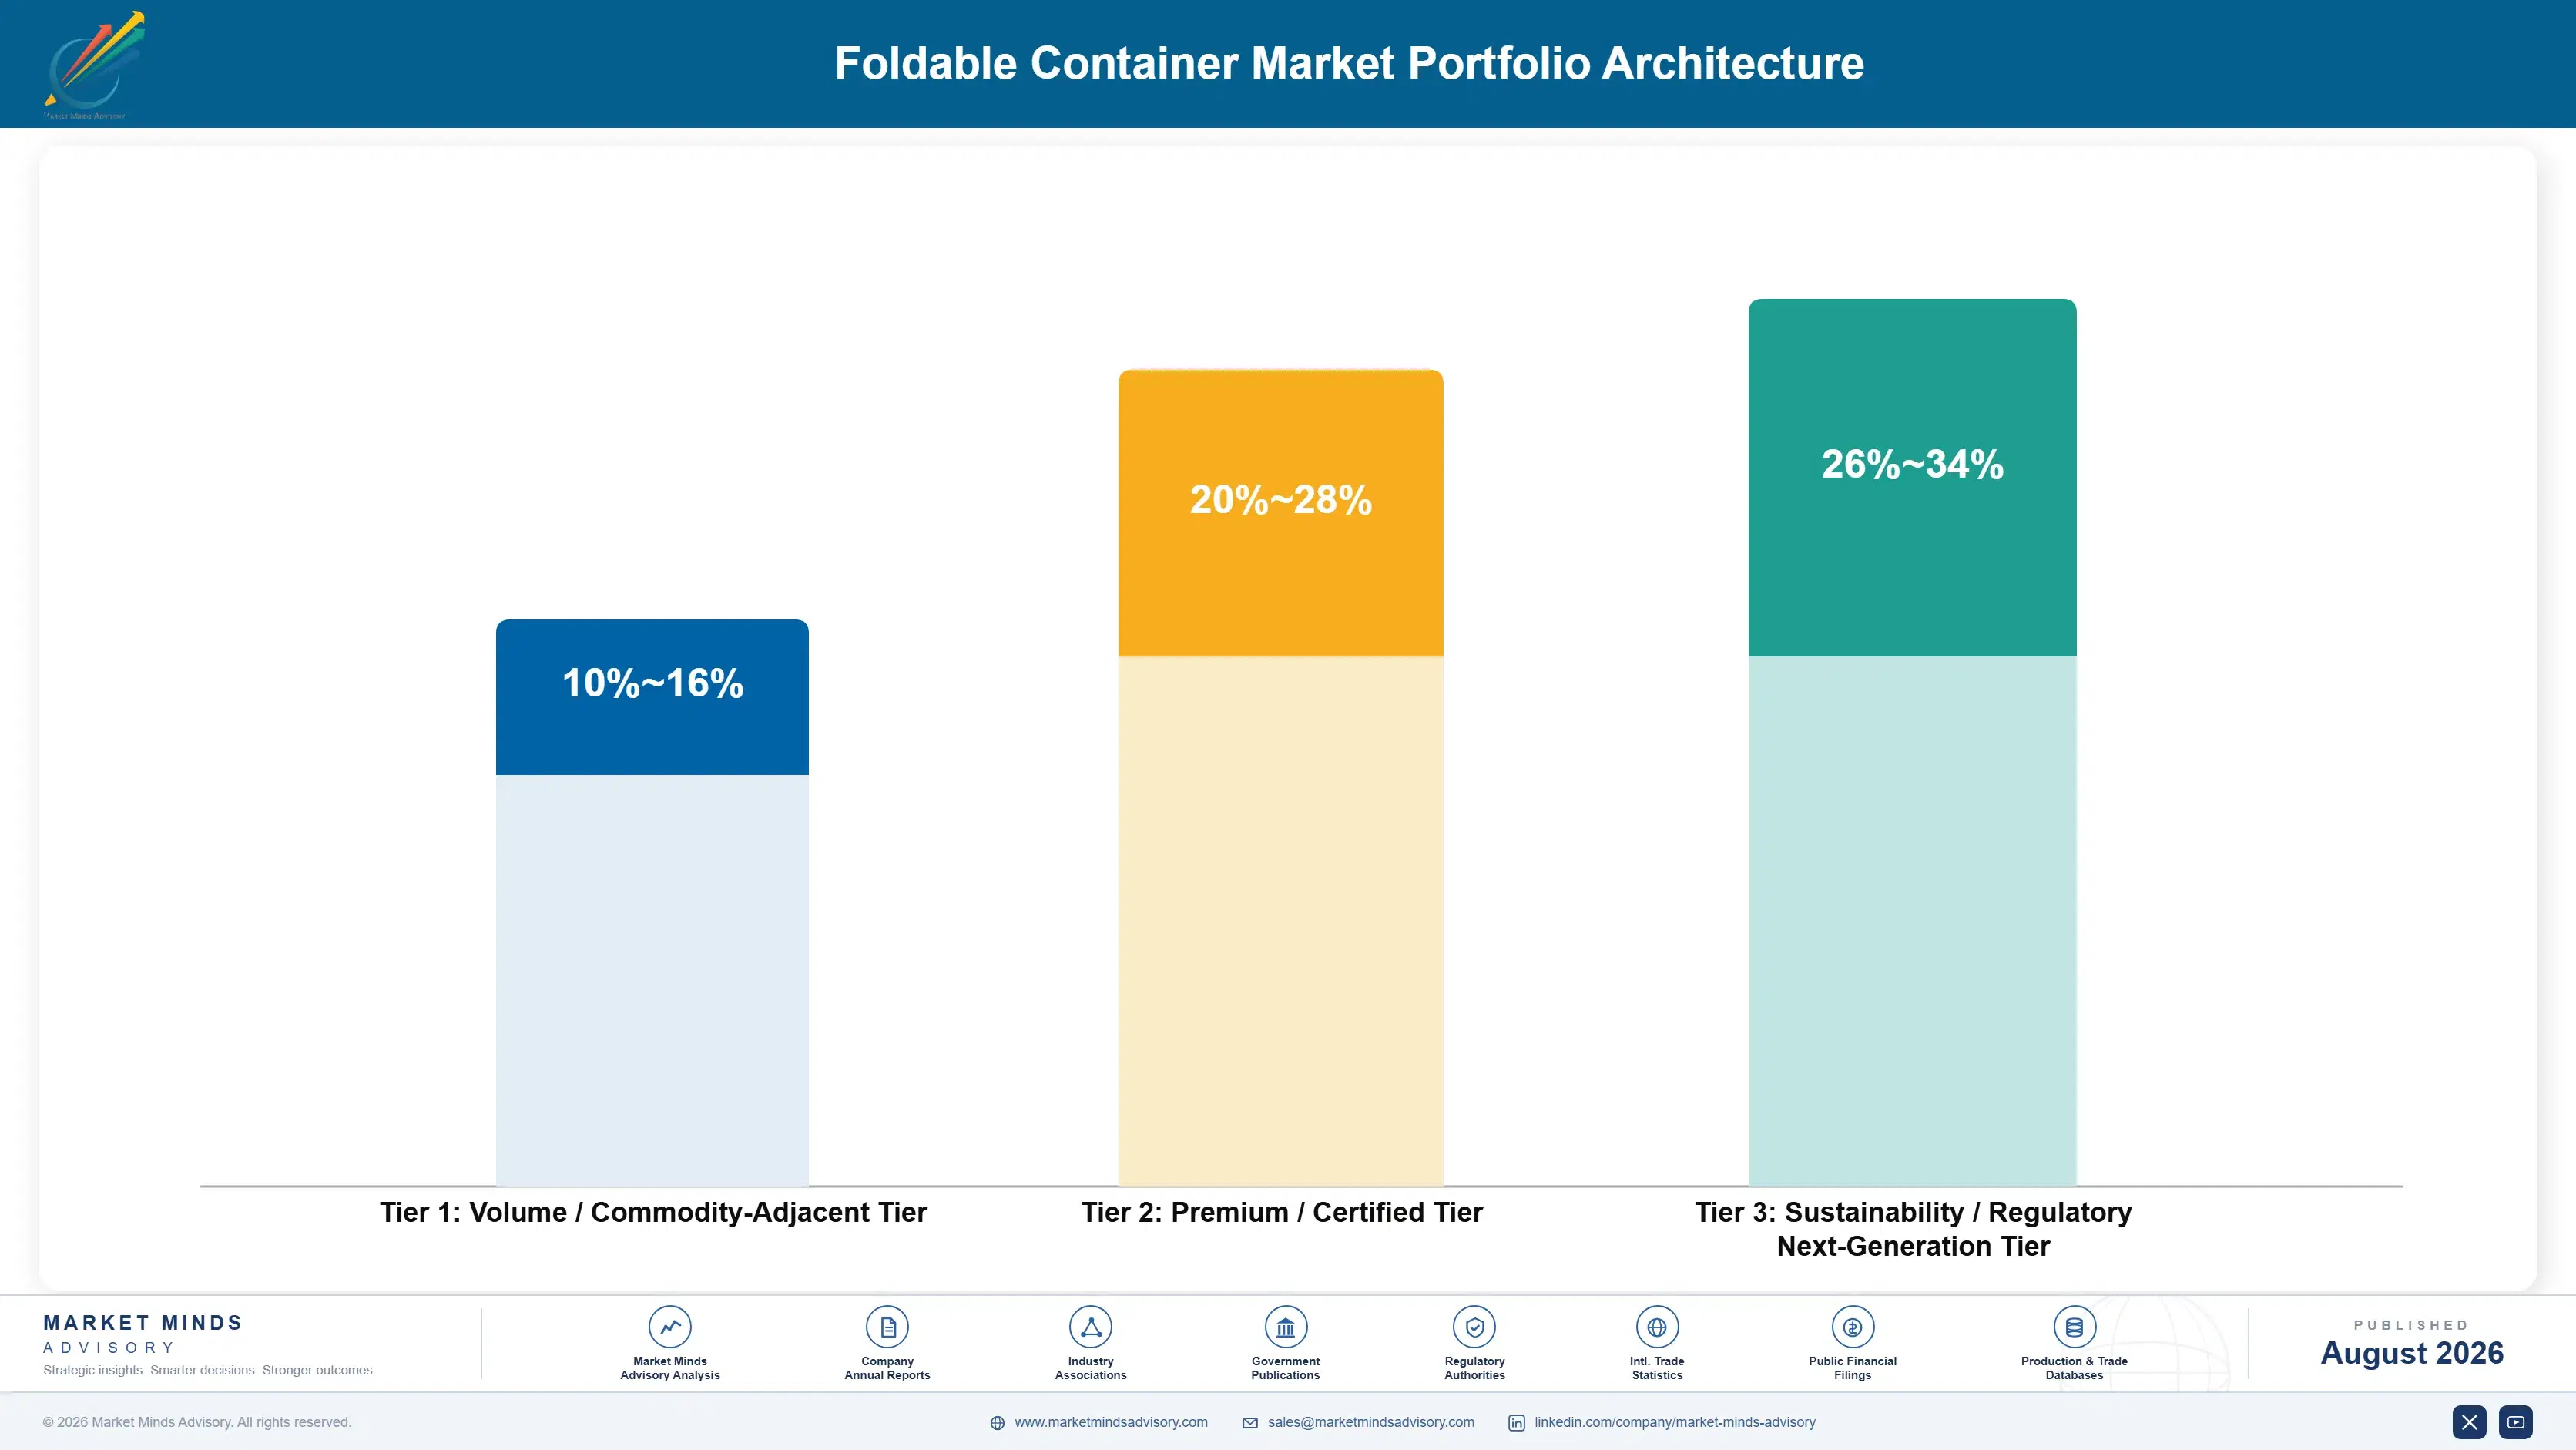
The portfolio splits into three tiers with meaningful margin separation tied to durability and tracking complexity rather than raw container cost alone. Standard foldable crates compete mainly on price and delivery reliability, while foldable bulk containers and RFID-enabled units command durable premiums tied to certified fold-cycle durability and real-time visibility guarantees.
The tension between volume hardware and technology premium is sharpening as pooling operator automation and cold chain logistics expand demand for premium and next-generation containers faster than standard crate demand grows, pulling manufacturer investment toward these higher-margin tiers even though standard crates remain a meaningful and stable volume base globally. Manufacturers maintaining a foothold across all three tiers preserve optionality, while those chasing only premium contracts risk losing the steady replacement cash flow that standard crates still reliably generate.

High-value margin pools concentrate specifically in foldable bulk containers and RFID-enabled tracking units meeting the newest pooling operator specifications, both requiring genuine engineering and electronics investment that conventional manufacturers must build or acquire rather than simply extend from existing crate production capability. Standard foldable crates, by contrast, remain a large but slower-growing volume base offering thinner, more commoditized margins for most participants going forward.

Volume / Commodity-Adjacent Tier

Standard foldable crates sold primarily on price and delivery reliability into mainstream global retail and warehouse installations without bulk-load or RFID tracking requirements yet, particularly across cost-sensitive markets worldwide today.
Gross Margin: 10%-16%

Premium / Certified Tier

Foldable bulk containers integrated into certified pallet-level shipping programs commanding durable premiums tied to fold-cycle durability validation and a proven multi-year track record with cold chain and logistics buyers worldwide.
Gross Margin: 20%-28%

Sustainability / Regulatory / Next-Generation Tier

RFID and IoT-enabled foldable containers built specifically for real-time pooling fleet visibility and evolving automation requirements, representing the newest and most technically demanding corner of the entire product portfolio sold globally.
Gross Margin: 26%-34%
foldable-container-market-portfolio-architecture-1787550897005

High-value Sub-segments and Strategic Watch-out

Foldable Bulk Containers (Pallet Boxes)

High value with strong growth, tied directly to cold chain and agricultural logistics demand scaling independent of broader mainstream replacement cycles across most industrial segments and price points worldwide today. Fold-cycle durability validation increasingly decides which supplier wins long-term pooling fleet contracts across most major operators and regions worldwide.
Gross Margin: 24%-30%

RFID and IoT-Enabled Foldable Containers

High value with moderate growth, anchored in RFID and IoT tracking platforms where pooling operators value proven real-time visibility over the fastest possible technical iteration across most industrial segments and production regions today. Suppliers here compete on reliability and installed-base track record more than on the newest performance metrics alone.
Gross Margin: 22%-28%

Foldable Crates

The volume core, serving mainstream retail and warehouse installations across most global markets regardless of bulk-load or RFID adoption pace currently underway across the broader industry today. Steady growth tracks logistics facility count and replacement cycles rather than any specific technology transition emerging across the wider category today.
Gross Margin: 11%-15%

Foldable Intermediate Bulk Containers (IBC Totes)

The strategic watch-out, facing accelerating price competition as Chinese domestic manufacturers scale production for cost-sensitive logistics segments worldwide across nearly every price tier and geography today. Remaining international supplier volume concentrates in accounts still requiring proven validation history and established track records built over many years.
Gross Margin: 9%-13%

The Pooling Economics of Reusable Packaging

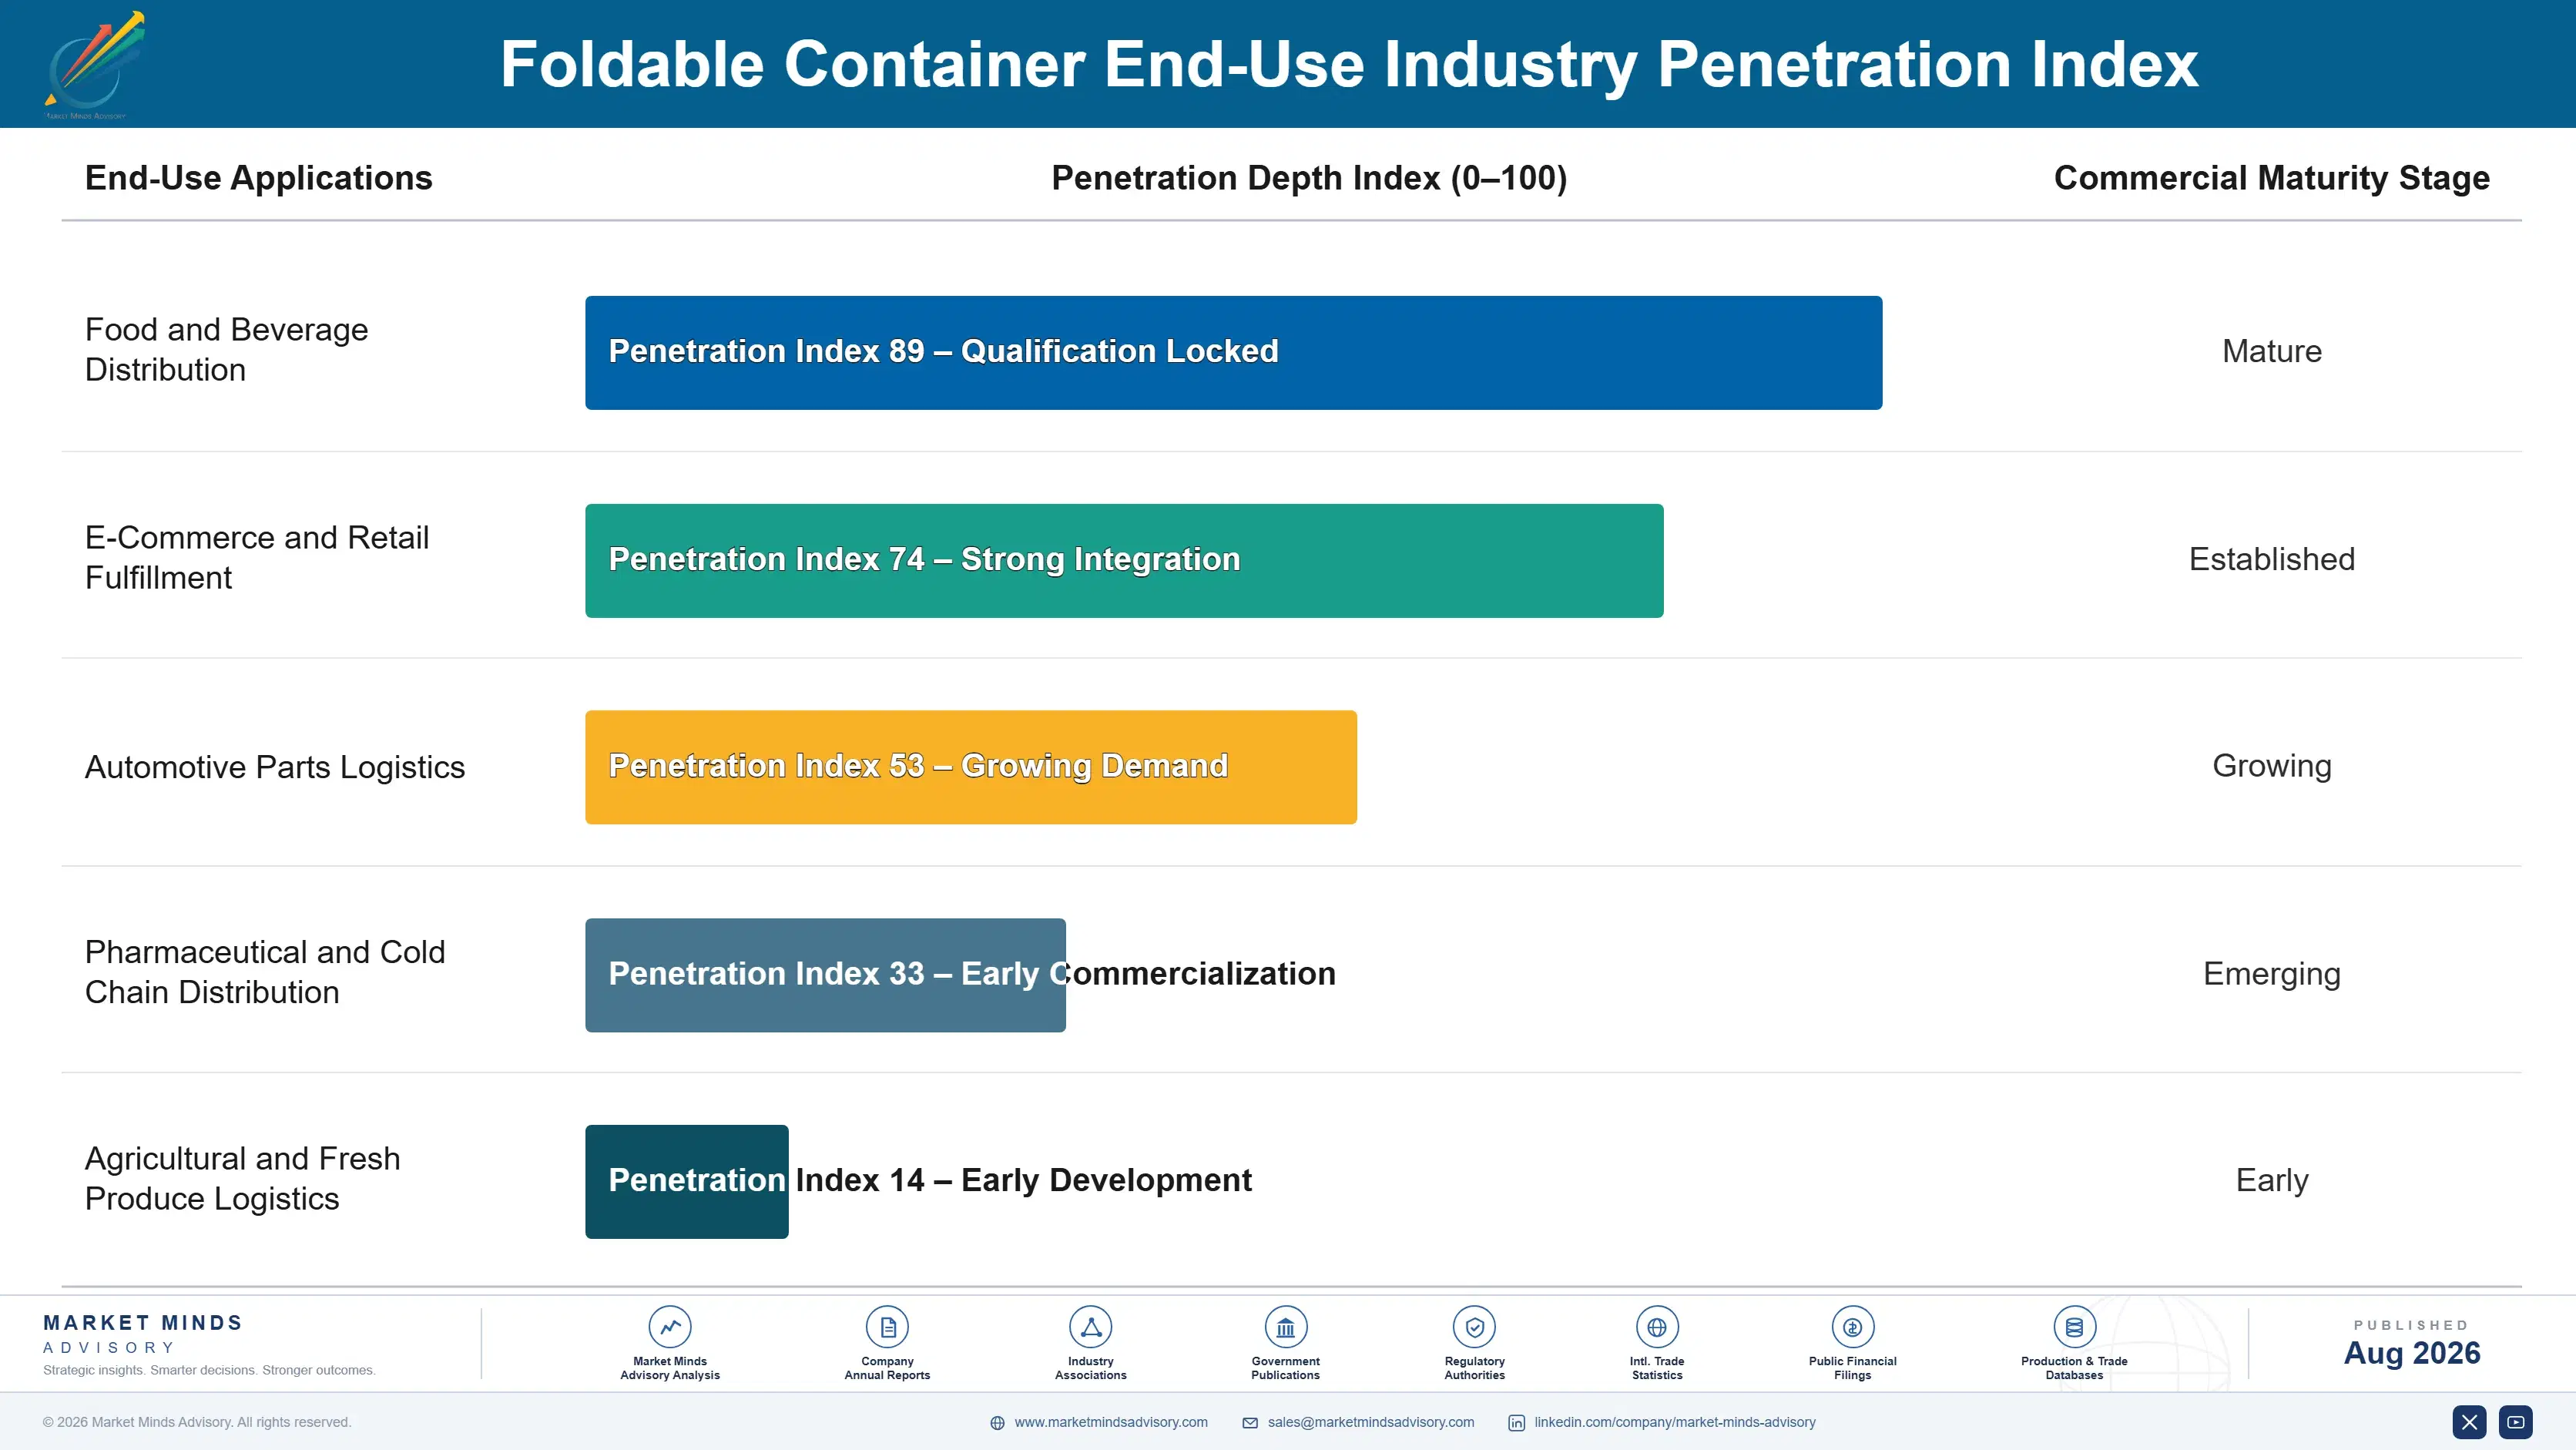
Foldable container revenue behaves like an annuity tied to fleet operating life rather than a one-time purchase, since pooling operators cycle containers continuously across a fleet's multi-year operating life as retail and manufacturing customers rotate through their circulation network far more often than any single container ever changes actual ownership or hands.
Adoption depth varies by end-use vertical: cold chain and grocery distribution adopted foldable bulk containers earliest given the tightest freight cost scrutiny, while smaller retail and industrial operations still often rely on rigid containers without the added return-freight optimization investment built into their logistics planning. E-commerce fulfillment adoption remains an earlier-stage vertical, constrained by fulfillment center handling requirements that current foldable designs have not yet fully satisfied at meaningful scale.

Buyer profiles are shifting generationally as supply chain sustainability and cost optimization officers, rather than purely warehouse operations staff, now approve container sourcing decisions inside major retail and manufacturing operators across most facility types today. This younger buyer cohort weighs total freight lifecycle cost and pooling contract flexibility alongside conventional durability metrics, reshaping which suppliers get invited to next-generation fleet bids and long-term development partnerships.
foldable-container-market-end-use-penetration-index-1787550897490

Priorities for Foldable Container Suppliers

These are among the four positions where our research anticipates prominent divergence between winners and laggards over the coming forecast period. Each is grounded in the demand model, the regulatory perimeter, and the announced capacity pipeline.
01 / PRODUCT PORTFOLIO STRATEGY

Prioritize foldable bulk containers over legacy standard crate volume

Foldable bulk containers are growing at 9.5% annually, roughly 1.4 times the overall market's 6.8% pace, and that gap will widen further as cold chain and agricultural logistics operators chase return-freight savings through the entire forecast period through 2036. Suppliers still weighted toward legacy standard crate designs risk ceding the highest-margin pooling contracts to competitors who invested early in bulk-load engineering and durability testing. The near-term priority is securing at least one large pooling operator win before the next major fleet-generation sourcing cycle closes.
02 / REGIONAL MANUFACTURING FOOTPRINT

Expand East Asian production capacity ahead of demand acceleration

East Asia already commands 33% of global foldable container demand and is growing at 7.8% annually, faster than the 6.8% global average, driven by China's e-commerce logistics infrastructure and dominant plastics manufacturing base across the entire region. Suppliers without meaningful East Asian production capacity face longer lead times and tariff exposure that domestic competitors do not carry into contract negotiations. Expanding regional footprint now, rather than after demand fully materializes, preserves negotiating leverage on platform contracts signed over the next several years.
03 / POOLING OPERATOR RELATIONSHIP STRATEGY

Build direct pooling operator accounts ahead of purchasing consolidation

Pooling arrangements already represent 40% to 50% of total container volume, concentrating purchasing decisions among a smaller number of large pooling operators rather than thousands of individual end-user companies buying independently across most markets and geographies worldwide. Suppliers still organized purely around individual retailer sales risk losing volume to competitors who invested early in dedicated pooling operator account management and framework agreements. Building direct pooling relationships now positions suppliers ahead of continued purchasing power consolidation industry-wide across most product categories.
04 / TECHNOLOGY INTEGRATION INVESTMENT

Build RFID tracking capability ahead of automation-driven demand

RFID and IoT-enabled tracking adoption has grown from roughly 10% of new units in 2021 to an estimated 25% to 30% today, as pooling operators demand real-time visibility into fleet location and utilization across sprawling distribution networks and warehouse facilities. Suppliers still organized purely around untracked collapsible designs risk losing contracts to competitors whose tracking-enabled products command meaningfully higher pricing and stickier pooling relationships. Building or acquiring RFID integration capability now positions suppliers ahead of continued tracking segment expansion across the industry.

Engagement Snapshot From the Field

A live engagement with an industry participant carrying material or product regulatory and market exposure ahead of a defining policy shift, showing how our research translates into a defensible multi-year portfolio strategy.
MARKET MINDS ADVISORY · CLIENT ENGAGEMENT SUMMARY
Foldable Container Producer Strategic Portfolio Review and Transition Roadmap 2026·Investment Scenario on Foldable Container Exposure Evaluation 2025-26
CLIENT PROFILE
The client is a mid-size cold chain produce distributor with annual logistics spend of approximately 165 million dollars (client-reported, unverified by MMA), operating a fleet of rigid pallet boxes across six regional distribution centers. The company had not yet transitioned to foldable bulk containers and was evaluating whether to purchase its own fleet or join an existing pooling arrangement.
STRATEGIC CHALLENGE
Leadership needed to reduce empty-return freight costs across all six distribution centers, but internal logistics teams lacked meaningful hands-on experience evaluating pooling arrangements against fleet ownership options carefully enough, and management debated at length whether the loss of direct fleet control justified the freight savings pooling participation genuinely offered overall.
MMA APPROACH
MMA combined primary interviews with pooling operators and a detailed total-cost-of-ownership analysis comparing fleet ownership against pooling participation across freight savings, container replacement costs, and overall long-term operational flexibility metrics, then carefully modeled which approach delivered better returns given the client's specific seasonal produce distribution volume patterns and operational needs.
KEY FINDINGS
  1. Pooling participation delivered comparable freight savings to fleet ownership while entirely eliminating the client's exposure to container replacement costs entirely and permanently.
  2. Fleet ownership would have required financing 45% more capital upfront than pooling participation phased across all six distribution centers instead of at once.
  3. Client-reported internal freight data (client-reported, unverified by MMA) showed empty-return trips accounted for a significant share of total logistics spend across the fleet.
  4. Two competing pooling operators offered comparable coverage across the client's distribution footprint, making contract flexibility the deciding selection factor for the client.
CLIENT PROFILE
The client is a mid-size cold chain produce distributor with annual logistics spend of approximately 165 million dollars (client-reported, unverified by MMA), operating a fleet of rigid pallet boxes across six regional distribution centers. The company had not yet transitioned to foldable bulk containers and was evaluating whether to purchase its own fleet or join an existing pooling arrangement.
STRATEGIC CHALLENGE
Leadership needed to reduce empty-return freight costs across all six distribution centers, but internal logistics teams lacked meaningful hands-on experience evaluating pooling arrangements against fleet ownership options carefully enough, and management debated at length whether the loss of direct fleet control justified the freight savings pooling participation genuinely offered overall.
MMA APPROACH
MMA combined primary interviews with pooling operators and a detailed total-cost-of-ownership analysis comparing fleet ownership against pooling participation across freight savings, container replacement costs, and overall long-term operational flexibility metrics, then carefully modeled which approach delivered better returns given the client's specific seasonal produce distribution volume patterns and operational needs.
KEY FINDINGS
  1. Pooling participation delivered comparable freight savings to fleet ownership while entirely eliminating the client's exposure to container replacement costs entirely and permanently.
  2. Fleet ownership would have required financing 45% more capital upfront than pooling participation phased across all six distribution centers instead of at once.
  3. Client-reported internal freight data (client-reported, unverified by MMA) showed empty-return trips accounted for a significant share of total logistics spend across the fleet.
  4. Two competing pooling operators offered comparable coverage across the client's distribution footprint, making contract flexibility the deciding selection factor for the client.
RECOMMENDED STRATEGY
Phase 1: Phase 1 (Months 1 to 2): Join a pooling arrangement at the two distribution centers with the highest empty-return freight costs. Phase 2: Phase 2 (Months 3 to 6): Extend pooling participation to the remaining four distribution centers using lessons learned during the pilot. Phase 3: Phase 3 (Months 7 to 8): Consolidate all fleet management under the pooling arrangement and formally retire remaining owned containers.
OUTCOME
The client completed the transition to full pooling participation within eight months, reducing freight costs by an estimated 22% across converted routes and reporting approximately 950 thousand dollars in annual operational savings (client-reported, unverified by MMA). Leadership credited the total-cost-of-ownership analysis MMA delivered early in the engagement.

Frequently Asked Questions

Foundational context covering the market sizes, CAGR, scope, country, region and competition that inform every finding below. This section is provided to cover basics and most often pre-purchase conversations, answered from the MMA Primary Research Dataset.

What is the current size of the Foldable Container Market?

The global foldable container market reached an estimated 5.4 billion dollars in 2025. Growth is driven by expanding e-commerce logistics and container pooling arrangements worldwide.

How large will the Foldable Container Market be by 2036?

MMA projects the market will reach approximately 11.1 billion dollars by 2036. That represents roughly 1.93 times the 2026 market size over the forecast decade.

What is the CAGR for the Foldable Container Market 2026 to 2036?

The base case CAGR is 6.8% annually across the 2026 to 2036 forecast period. Bull and bear scenarios range from 8.1% to 5.5% depending on logistics growth pace.

Which segment is growing fastest?

Foldable Bulk Containers used for pallet-level shipping are the fastest-growing segment, expanding at 9.5% annually, roughly 1.4 times the overall market rate. This reflects accelerating cold chain logistics demand worldwide.

Who are the major companies in the Foldable Container Market?

Leading suppliers include ORBIS Corporation, Schoeller Allibert, CABKA Group, Georg Utz Holding, and IFCO Systems, evaluated on an annual revenue basis. Together these five suppliers hold an estimated 42% combined share.

Which country is growing fastest?

India leads country-level growth at 8.8% annually, outpacing the broader South Asia and Pacific regional average. Expanding cold chain and agricultural logistics investment drive this acceleration.

Report Segmentation Architecture

The full report scope spans multiple orthogonal segmentation dimensions, with cross-tabulated demand data provided for each dimension pair. Coverage extends further to regional breakdowns, trend trajectories, and the competitive detail needed to support segment-level decision-making.

By Product Type

  • Foldable Crates
  • Foldable Bulk Containers (Pallet Boxes)
  • Foldable Intermediate Bulk Containers (IBC Totes)
  • Foldable Storage and Distribution Bins
  • Foldable Pallets
  • RFID and IoT-Enabled Foldable Containers

By End-Use Industry

  • Food and Beverage Distribution
  • E-Commerce and Retail Fulfillment
  • Automotive Parts Logistics
  • Pharmaceutical and Cold Chain Distribution
  • Agricultural and Fresh Produce Logistics

By Commercial Dimension

  • Direct Fleet Ownership Sales
  • Third-Party Pooling Arrangements
  • Distributor and Wholesale Sales
  • Aftermarket Replacement Sales

By Region

  • East Asia
  • North America
  • Western Europe
  • South Asia and Pacific
  • Latin America
  • Middle East and Africa
  • Eastern Europe

Scope, Methodology, and Coverage

Every figure in this report is reproducible from documented input assumptions. The scope below maps the historical period, the forecast horizon, the segmentation dimensions, and the countries covered, alongside the underlying primary and qualitative methodology.
Historical Period
2020 to 2025
Forecast Period
2026 to 2036
Base Year
2025 (USD billions; MMA Primary Research Dataset, August 2026)
Market Definition
The foldable container market covers collapsible plastic and corrugated containers, crates, and bulk boxes used for reusable packaging and logistics across retail, food and beverage, and industrial distribution. It excludes rigid non-collapsible containers and single-use disposable packaging.
Quantitative Units
USD billions (current prices); unit shipment volume in millions where applicable
Segmentation Dimensions
By Product Type; By End-Use Industry; By Commercial Dimension; By Region
Regions Covered
East Asia, North America, Western Europe, South Asia and Pacific, Latin America, Middle East and Africa, Eastern Europe
Countries Covered
USA, China, Germany, France, UK, Japan, South Korea, India, Australia, Canada, Brazil, Mexico, Indonesia, Vietnam, Thailand, Malaysia, UAE, Saudi Arabia, South Africa, Nigeria, Turkey, Poland, Netherlands, Italy, Spain, Sweden, Switzerland, Argentina, Colombia, Singapore, and additional markets relevant to this sector
Key Companies Profiled
ORBIS Corporation, Schoeller Allibert, CABKA Group, Georg Utz Holding, IFCO Systems, Nefab Group, DS Smith, Loscam, Rehrig Pacific, Buckhorn Inc, Craemer Group, Bekuplast, SSI Schaefer, Polymer Logistics, Rotom, Menasha Corporation, Container Centralen, Wanpack, Shuang Yun Plastic, Zhejiang Jiaenbao Group
Quantitative Methodology
Primary survey, n=3,800 respondents, Q4 2025, six countries; demand-side model with trade association cross-validation
Qualitative Methodology
47 expert interviews, Q4 2025; applied to validate demand model assumptions, identify emerging dynamics, and assess competitive positioning
Report Format
PDF and XLSX data workbook (Word format preview document)
Publisher
Market Minds Advisory
Report Code
MMA-2026-PAC-212
Published
August 2026
Contact
sales@marketmindsadvisory.com | www.marketmindsadvisory.com

Purchase the full Foldable Container Market Report (2026 to 2036).

This report provides a complete assessment of the global foldable container market across the 2026 to 2036 forecast period, covering sizing, segmentation, and regional demand patterns. It profiles the five leading suppliers and fifteen additional participants on a consistent annual revenue basis, detailing competitive positioning, recent corporate developments, and moat and risk analysis for the top two players. The report also examines input cost exposure, portfolio margin architecture, and revenue lever opportunities tied to container pooling. A dedicated regional chapter breaks down demand across all seven MMA-tracked regions.
Ten-year global market sizing and CAGR forecast model
Six-segment MECE product type breakdown analysis
Seven-region demand share and growth rate analysis
Twenty-company competitive benchmarking and positioning dataset
Input cost exposure and portfolio margin modeling detail
Anonymized client engagement case study with outcomes

Built For The People Who Decide

From boardroom strategy to bench-side execution, this report is read cover-to-cover by leaders shaping the next decade of their industry, turning demand scenarios, market dynamics and valuation benchmarks into decisions.
CXOs/ Presidents/ VPs/ Managers
M&A and Corporate Development
Strategy Teams and R&D Heads
Procurement and Product Directors
Regulatory and Compliance Leaders
Investor Relations and Equity Analysts