Market Minds Advisory
Foam Insulation Market

Foam Insulation Market: Rigid, Spray and Flexible Systems Across Construction and Industrial Applications, 2026 to 2036

Fire performance rules rewritten after the cladding failures and blowing agent phase-downs are reshaping this market at the same time, and the chemistry answering one requirement frequently fails the other one.

Lead Analyst

Bilal Shaikh

Published

September 2026

Make Smarter Decisions with Customized Research Insights

Request a free sample report and evaluate market opportunities, growth trends, and competitive dynamics relevant to your business needs.

2025 MARKET VALUE$29.6BMarket Size 2025
2036 FORECAST VALUE$56.2BBase Case , 2026 to 2036
CAGR 2026 TO 20366.0 %Bull 7.2% / Bear 4.8%
INCREMENTAL OPPORTUNITY$24.8BNet 10- year value creation
EXPANSION MULTIPLE1.79x2036 value over 2026 base
Strategic Levers
M&A Pipeline
Regional Outlook
Country Rankings
Competitive Intelligence
Segmental Deep-dive
Call-Us : 91 93563 13602

Executive Snapshot and Market Trajectory

Two regulatory forces are rewriting this market simultaneously and they pull in different directions entirely. Fire performance rules tightened sharply following the cladding failures, while blowing agent phase-downs now require global warming potential under 1, and the chemistries answering one requirement frequently struggle badly with the other.
Growth concentrates in phenolic foam boards, expanding at 9.0%, which combine thermal conductivity near 0.022 watts per metre kelvin with the fire behaviour that polyisocyanurate simply cannot match in facade applications. East Asia holds 30% of value, the largest regional share, because Chinese construction volume sits alongside the appliance and cold chain manufacture that consumes rigid foam at a scale no other region comes close to approaching.
The producer base is genuinely fragmented, with the top five holding just 31% of foam volume shipped, because low-density board is expensive to transport and every consuming region therefore supports a set of local converters of its own. Competition runs on thermal performance per millimetre, fire classification and delivered cost rather than on brand or relationship. Isocyanate pricing, rather than competitive tendering, is what determines whether a converter makes money in any given year.
Market Definition
The market comprises cellular polymeric insulation products manufactured for thermal insulation duty, spanning phenolic foam boards, polyisocyanurate rigid boards, spray polyurethane foam, extruded polystyrene, expanded polystyrene, and elastomeric and flexible insulation foams. Sizing captures product revenue at realised delivered price across residential and commercial construction, industrial and process insulation, cold chain and appliance manufacture, and transport applications. Mineral wool, glass wool, cellulose and natural fibre insulation, vacuum insulated panels, aerogels, insulated metal panel assemblies and installation labour fall outside scope.
Base Year Value
$29.6B in 2025 (MMA Primary Research Dataset, August 2026)
Forecast Period
2026 to 2036, eleven discrete annual values
CAGR
6.0% base case. Bull 7.2%. Bear 4.8%.
Fastest Growth Segment
Phenolic Foam Boards: 9.0% CAGR
Fastest Growth Country
India: 8.6% CAGR
Fastest Growth Region
South Asia and Pacific: 8.1% CAGR
Largest Region
East Asia: 30% of 2025 global value
Market Leaders
Kingspan Group, BASF, Owens Corning, Recticel, Dow. Source: MMA Analysis based on company annual reports.
Primary Survey
n=3,800 procurement and R&D decision-makers, Q4 2025, six countries
Methodology
Demand-side build-up, cross-validated against public data, 47 expert interviews

Foam Insulation Market Forecast Scenarios

foam-insulation-market-size-forecast-scenario-1787310487247
Growth of 4.9% across 2020 to 2025 combined a construction boom and a construction slump inside one window. Residential building surged through 2021 on low interest rates, then interest rate rises stopped new starts across most Western markets from 2023 onward, while renovation demand held up because energy costs made retrofit economics obvious to homeowners. Isocyanate disruption in 2021 meanwhile pushed rigid foam pricing to levels nobody had seen.
The base case at 6.0% rests on three mechanisms. Building energy performance standards keep tightening across Europe, North America and increasingly Asia, and every revision raises required insulation thickness or performance. Renovation of existing building stock accounts for a growing share of demand and behaves quite differently, being less cyclical and more policy driven. And cold chain expansion across food and pharmaceutical logistics consumes rigid foam in volumes construction cycles do not touch.
The bull case at 7.2% turns on renovation subsidy programmes across Europe reaching the deployment rates their targets imply, which would add substantial retrofit volume. The bear case at 4.8% turns on construction. A sustained downturn in new residential building removes the volume base that converter economics depend on, and renovation alone cannot fill low-density lines.

What Determines Foam Insulation Value

Two numbers explain the shape of this industry. Isocyanate and polyol take 46% of rigid foam production cost, which ties converter margins to petrochemical pricing they cannot influence, and freight takes another 19% because a truck carrying insulation board fills by volume long before it fills by weight. Together they mean this business is regional whatever the scale of the participants, and that a converter without indexed raw material contracts is running an unhedged chemical position.
TOP FIVE SHARE31%Concentration of insulation foam volume across the largest producers
BOARD THERMAL CONDUCTIVITY0.022 W/mKDeclared conductivity achieved by high-performance rigid board insulation
ISOCYANATE COST SHARE46%Isocyanate and polyol share of rigid foam production cost
FREIGHT COST SHARE19%Transport share of delivered cost for low-density board product
RENOVATION DEMAND SHARE42%Building retrofit share of total insulation foam consumption
BLOWING AGENT POTENTIALunder 1 GWPGlobal warming potential ceiling now required across regulated markets
Performance per millimetre is the commercial currency. Space in a wall cavity or a roof build-up is finite, and a board achieving 0.022 watts per metre kelvin delivers the required thermal resistance in noticeably less thickness than cheaper alternatives. Architects and developers who cost the floor area recovered buy on conductivity; those who cost the board buy on price.
Fire classification now decides which products can be used where, and it has reordered specification across facade applications entirely. Post-Grenfell rules across the United Kingdom and increasingly the wider European market restrict combustible insulation on tall buildings, which has pushed phenolic and mineral alternatives into applications that polyisocyanurate previously dominated without contest.
"The industry spent thirty years optimising for thermal conductivity and is now being judged on how its products behave in a fire, which is a completely different problem requiring different chemistry. The converters who saw that coming reformulated early. The ones who argued about test methods are now watching specifiers walk past them."
Director, Building Materials and Construction Systems Practice · MMA Constructio

Market Trends

Fire Classification Requirements Reorder Facade Specification

Regulatory response to cladding fires restricted combustible insulation on tall buildings across the United Kingdom and progressively across other European markets, and specification practice moved faster than regulation in many cases because insurers and developers grew unwilling to carry the risk. Roughly 38% of European facade insulation specification now requires non-combustible or limited-combustibility classification. Phenolic foam and mineral alternatives have taken volume that polyisocyanurate previously held without challenge, and the reformulation work required to respond is genuinely difficult rather than incremental. Insurers moved ahead of regulation in several markets, which caught producers by surprise.
Market Impact: Covers 2.4 billion square metres

Blowing Agent Transition Forces Formulation Redevelopment

Hydrofluoroolefin blowing agents with global warming potential under 1 have replaced the hydrofluorocarbons that phase-down schedules removed, and the transition is more disruptive than a simple substitution suggests. Thermal performance, dimensional stability, flow behaviour and cost all change together, requiring formulation and process redevelopment across every product line. Roughly 71% of rigid foam production in regulated markets has completed the transition. Producers who moved early hold formulations that are properly optimised, while late movers are still recovering the thermal performance that the substitution initially cost them. Cost has risen across every affected product line.
Market Impact: Retrofit reaches 42% of consumption

Market Opportunities and Growth Drivers

Building Energy Standards Tighten Across Major Markets

Energy performance requirements for new buildings and major renovations keep ratcheting across the European Union, North America and increasingly across Asian markets, and each revision raises either the required insulation thickness or the performance a material must deliver within a fixed build-up. Roughly 2.4 billion square metres of floor area annually now falls under tightened performance standards. This demand is compliance driven rather than discretionary, which makes it considerably less sensitive to construction cost pressure than the underlying building activity is. Each revision also favours higher-performing products over cheaper alternatives.
Market Impact: Isocyanate is 46% of cost

Renovation Demand Grows Independently Of New Construction

Retrofit now accounts for 42% of all insulation foam consumption and behaves quite differently from new build work, being driven by energy costs, subsidy programmes and regulatory minimum performance standards for rented property rather than by interest rates or housing starts. That distinction mattered enormously through 2023 and 2024, when new residential starts fell sharply across Western markets while renovation demand held up throughout. Product requirements differ substantially too, favouring thin high-performance boards and spray systems that work within existing building geometry rather than the standard thicknesses new construction assumes.
Market Impact: Freight is 19% of cost

Market Restraints and Challenges

Isocyanate Price Volatility Compresses Converter Margin

Isocyanate and polyol account for 46% of rigid foam production cost, and the root cause of the exposure is contractual rather than chemical: distributors and builders merchants buy on price lists updated periodically while isocyanate reprices with propylene and benzene continuously. Converters absorb the entire gap themselves. Margin was destroyed across 2021 when Gulf Coast capacity froze and raw material pricing tripled within a few months. Participants are responding with indexed customer agreements, multi-supplier isocyanate contracts across regions, and formulation work reducing polymer content per unit of thermal performance actually delivered.
Market Impact: Affects 38% of facade specification

Freight Economics Confine Every Producer To A Radius

Insulation board is mostly trapped gas, so freight reaches 19% of delivered cost and a trailer fills by volume long before weight. The root cause is the product's own function, since low density is what delivers thermal performance and nothing changes that. Commercially it caps every producer inside a few hundred kilometres and prevents national positions forming in any market. Mitigation runs through regional plant networks located near demand, higher-density product mixes where freight matters less, and spray foam systems that ship as liquid and expand only once they reach the site.
Market Impact: Reaches 71% of regulated production
4 additional market trends, 3 additional growth drivers, and 2 additional restraints and challenges are covered in the full report. Contact sales@marketmindsadvisory.com to access the complete intelligence.

Segment CAGR and Growth Architecture

Segmentation follows foam chemistry and product form, which is the dimension determining thermal conductivity, fire classification, achievable application method and realised price together. End-use sector cuts across most chemistries without separating them commercially, since polyisocyanurate serves roofing and cold storage alike, so end-use application sits in demand analysis rather than in this primary hierarchy.
foam-insulation-market-market-share-analysis-1787310487777

Phenolic Foam Boards

Growing at 9.0%, exactly 1.50 times the market rate, and the clearest beneficiary of fire classification requirements that restricted combustible insulation on tall buildings. Phenolic foam delivers thermal conductivity around 0.020 watts per metre kelvin, better than any other organic foam available, alongside fire behaviour that generates far less smoke and heat than polyisocyanurate does under test. Manufacturing is more demanding and capacity is considerably narrower than for polyurethane products, which limits how quickly supply can respond to any specification change. Facade and high-rise applications drive most growth, and specification once written into a building regulation proves remarkably durable. Manufacturing capacity remains the practical constraint on how quickly the segment can grow.
CAGR 9.0%

Polyisocyanurate Rigid Boards

Expanding at 7.4% across roofing, wall and cold storage applications alike, where a combination of thermal conductivity near 0.022 watts per metre kelvin, structural rigidity and established installation practice keeps it the default specification choice everywhere outside restricted facade applications. Commercial flat roofing across North America remains an enormous and remarkably stable application for the product. The blowing agent transition to hydrofluoroolefins is now complete across most regulated production, and it cost the industry real thermal performance before formulations were properly optimised. Fire classification pressure across facade applications is now the segment's principal constraint, and reformulation work to address it continues across every major producer without a settled answer yet.
CAGR 7.4%
Full segment breakdown across 6 segments available in the complete report.

Regional Architecture and Country Demand Map

Regional value follows construction activity and energy code stringency together, and freight economics ensure that production sits close to consumption everywhere. Appliance and cold chain manufacture adds a second geography entirely, one that has nothing to do with where buildings happen to be going up.

East Asia

Thirty percent of value, the largest regional share, resting on two quite separate demand sources. Chinese construction, though slowing from its peak, still consumes insulation at enormous volume, and Chinese building energy codes have tightened steadily across climate zones that previously required very little. The second source matters more than most analysis allows: appliance manufacture and cold chain construction consume rigid polyurethane at a scale no other region approaches, since the majority of the world's refrigerators are made here. Japanese and Korean demand is smaller and runs at considerably higher specification levels. Growth of 6.9% runs above the global rate, driven by retrofit and cold chain rather than by new building activity.
Share: 30% | CAGR: 6.9% (2026 to 2036)

North America

Twenty-six percent of value with commercial flat roofing as the single largest application, where polyisocyanurate board has been standard practice for decades and roof replacement cycles generate steady, weather-driven demand that construction cycles barely disturb. Spray polyurethane foam holds a stronger position here than anywhere else, used across residential retrofit, crawl spaces and commercial roofing. Building code adoption varies considerably by state and by province, which fragments specification far more than it does in Europe. Growth of 6.4% reflects code tightening and roof replacement volume rather than new residential construction, which has been weak since interest rates rose and has not yet recovered. Code adoption is expected to tighten further across several jurisdictions.
Share: 26% | CAGR: 6.4% (2026 to 2036)
Regional intelligence for 5 additional markets available in the complete report: Western Europe, South Asia and Pacific, Latin America, Middle East and Africa, Eastern Europe. Contact sales@marketmindsadvisory.com.
foam-insulation-market-country-cagr-analysis-1787310488295

Where Foam Producers Can Earn More

Competing on price per board in a market where isocyanate sets nearly half the cost and freight another fifth leaves almost nothing to compete with. The value available sits in performance per millimetre, in fire classification, in retrofit systems designed for existing buildings, and in contract terms that pass raw material moves through properly.

Sell Thermal Performance Per Millimetre To Developers

Wall and roof build-ups are dimensionally constrained, and a board achieving 0.022 watts per metre kelvin delivers required thermal resistance in noticeably less thickness than cheaper alternatives. On a commercial development that recovers lettable floor area worth far more than the insulation premium costs. Producers who quantify recovered floor area for developers realise roughly 30% above board-price competitors on the same projects. The calculation takes an afternoon and almost nobody presents it, because insulation sales organisations habitually talk to contractors and merchants rather than to the developers who actually own the floor area economics.
Market Impact: Realises roughly 30% above board-pr

Develop Fire Classification Ahead Of Regulatory Change

Roughly 38% of European facade specification now requires non-combustible or limited-combustibility classification, and that share keeps rising as insurers and developers move ahead of the regulation rather than waiting for it. Producers holding fully classified products command roughly 45% above conventional rigid board pricing across restricted applications, because the specifier has very few alternatives available. Reformulation and third-party testing are genuinely difficult and take several years to complete properly. Producers who spent the interval arguing about test methodology rather than reformulating have watched specification move past them entirely and permanently.
Market Impact: Commands roughly 45% above conventi

Build Retrofit Systems Rather Than Selling Boards

Renovation is 42% of consumption and still growing, and it needs products that work within existing building geometry, tolerate irregular substrates and can be installed by trades working around occupants in inhabited buildings. Producers supplying complete retrofit systems with fixings, membranes, detailing and installer training realise roughly 2.2 times the value per square metre of board supply alone. It also creates the installer relationships and detailing responsibility that competitors cannot easily displace later on. Most producers still sell boards into merchants and leave somebody else to solve the application problem entirely.
Market Impact: Realises roughly 2.2 times the boar

Index Customer Agreements To Isocyanate Benchmarks

Isocyanate at 46% of production cost reprices continuously with propylene and benzene while distributor and merchant price lists update only periodically, which leaves converters absorbing the entire difference themselves. The 2021 experience, when Gulf Coast capacity froze and raw material pricing tripled inside months, made this argument for the industry far better than any commercial team ever could. Indexed agreements protect roughly 24% of realised converter margin through any comparable event. Merchants resist indexation at tender and accept it at renewal, particularly while a recent disruption is still fresh in everybody's memory.
Market Impact: Protects roughly 24% of realised co

Who Controls the Margin Pool

Concentration is low and determined by freight. The top five participants hold 31% of insulation foam volume shipped, the basis used throughout this section, and the gap between Kingspan and the rest reflects a systems and distribution position rather than any manufacturing advantage. Below the leaders sits a long tail of regional converters that exist because low-density board simply cannot travel far enough for a national producer to displace them on delivered cost.
Competition currently runs on three dimensions. Fire classification decides which products can be specified at all in a growing set of applications, and it cannot be acquired quickly. Thermal performance per millimetre decides the projects where space is constrained and value is calculated properly. Delivered cost within a freight radius decides everything else, which still accounts for most of the volume shipped.

Pressure is building from two directions. Mineral wool producers have taken facade share that fire classification opened to them. Isocyanate producers integrating forward into conversion compress independent converter margins. Rankings shift first in facade applications, where classification rather than thermal performance now decides the specification outcome before price is ever discussed.
foam-insulation-market-company-positioning-matrix-1787310488814

Competitive Moat and Risk Dimensions

KINGSPAN GROUP

Moat: Systems and specification position

Selling complete building envelope systems rather than insulation boards places the company inside architectural specification early, where product selection is decided long before any contractor buys anything. A manufacturing network positioned close to demand across many markets neutralises the freight disadvantage that constrains every producer in this industry.
KINGSPAN GROUP

Risk: Facade classification exposure

A substantial position in combustible rigid insulation faces continuing regulatory and insurer pressure in facade applications, and reputational scrutiny following cladding investigations has been sustained. Rebuilding specification confidence takes considerably longer than reformulating a product, and mineral wool competitors are using the interval to establish positions that will be difficult to reverse.
BASF

Moat: Isocyanate and polyol integration

Backward integration into isocyanate and polyol production removes the raw material exposure that determines whether independent converters earn anything in a volatile year, and it provides formulation capability at a depth that pure converters cannot approach. Presence across every major producing region supports customers who need consistent product specification internationally.
BASF

Risk: Downstream conversion competition

Competing in conversion while supplying isocyanate to independent converters creates an awkward position that customers notice, particularly during allocation. Regional converters compete effectively on freight and service in a market where product differentiation at the commodity end is limited, and integration advantage matters least precisely where volume is greatest.

Players Tracked

Prominent Players

Kingspan Group
BASF
Owens Corning
Recticel
Dow

Other Key Players

Covestro
Huntsman
Knauf Insulation
Saint-Gobain
Carlisle Companies
Johns Manville
Armacell
Soprema
IKO Group
Sika
Synthos
Ravago
Kaneka
Sekisui Chemical
Beijing New Building Materials

Recent Developments

MARCH 2025

Phenolic foam capacity commissioned for facade applications

Additional phenolic foam board manufacturing capacity entered commercial operation in Western Europe, targeting facade and high-rise applications where fire classification requirements have now restricted combustible insulation entirely, with the output committed to specification-led contractors and system integrators under multi-year supply arrangements covering several European markets.
Signal: Capacity built against fire classification
AUGUST 2025

Blowing agent transition completed across European production

A major rigid foam producer completed the conversion of its entire European manufacturing base to hydrofluoroolefin blowing agents with global warming potential below one, closing a multi-year reformulation programme that required process changes and performance requalification across every affected board product line in the portfolio.
Signal: Late completers have spent several years r
NOVEMBER 2025

Retrofit system launched for occupied building renovation

A producer introduced a complete external wall insulation system package designed for occupied residential retrofit, combining insulation boards, fixings, render carriers and full installer certification, targeting subsidised renovation programmes across several European markets where the existing residential building stock performs particularly poorly against current standards.
Signal: Selling complete systems rather than board

What Sits Inside Delivered Board Cost

Isocyanate and polyol together account for roughly 46% of rigid foam production cost, purchased from a concentrated petrochemical supply base and priced against propylene, benzene and chlorine. Blowing agents add around 11%, considerably more than before the transition. Flame retardants contribute about 6%, facing materials including foil and glass tissue roughly 10%, conversion energy 8%, and outbound freight the remaining 19% of delivered cost.
Feedstock supply proved fragile in early 2021. Winter Storm Uri froze United States Gulf Coast petrochemical capacity in February, taking isocyanate and propylene oxide production offline across multiple sites, and rigid foam raw material pricing tripled within months while allocation persisted for most of the year. BASF Annual Report 2021 and Covestro Annual Report 2021 both recorded the disruption and the resulting pricing dislocation across polyurethane raw materials globally.

The competitive disadvantage mechanism runs through contract structure rather than through purchasing scale. Converters with indexed customer agreements pass raw material moves through within a quarter, while those selling into merchant price lists absorb them for far longer. Integrated producers avoid the exposure entirely. Independent regional converters carry it in full, which is why so many disappeared during 2021 and why the survivors negotiate differently now.
foam-insulation-market-cost-volatility-analysis-1787310489012

Index customer agreements to published isocyanate benchmarks

Quarterly indexation against published polyurethane raw material series removes the single largest source of margin volatility that any independent converter faces. Merchants and distributors habitually resist it during tender and then accept it at renewal, which means the timing of the request matters considerably more than how hard anybody happens to negotiate on the day.

Contract isocyanate across multiple producers and regions

Single-supplier isocyanate arrangements offer no protection at all when a producing region freezes, as the 2021 disruption demonstrated painfully across the entire industry. Agreements spanning several producers and geographies cost slightly more in normal conditions and secure allocation when the market tightens, which is precisely the only time that it actually matters to anybody.

Reformulate to cut polymer content per unit performance

Cell structure optimisation and improved blowing agent efficiency together deliver equivalent thermal resistance using measurably less polymer, which reduces exposure to the single largest cost item permanently rather than temporarily. The formulation work involved is genuinely demanding and it then pays back on every single board produced for the life of that product line.

Portfolio Architecture for Margin Defence

Margin architecture separates by what a product is allowed to do rather than by how well it insulates. Expanded polystyrene and commodity board earn what freight position and raw material terms permit, because any converter within a delivery radius can supply an equivalent product and merchants tender accordingly. Value rises steeply where fire classification or thermal performance restricts the alternatives, which describes phenolic board and high-performance systems precisely.
The volume versus premium tension runs directly through the production line. Commodity board carries the volume that keeps foam lines loaded and distribution relationships worth maintaining, at margins that merchant tendering compresses continuously. Classified facade products and complete retrofit systems earn considerably better on smaller volumes. Converters chasing merchant volume fund a technical and specification organisation from margins that merchant procurement will never support.

High-value pools concentrate in three places. Fire-classified boards command price because the specifier's alternatives are limited and the classification took years to achieve. Complete retrofit systems earn on installation and detailing rather than on board area. And appliance and cold chain foam earns on process integration with manufacturers who cannot easily change supplier.

Volume / Commodity-Adjacent Tier

Expanded polystyrene and standard rigid board supplied through builders merchants and distribution, where any converter inside a freight radius can supply an equivalent product and price is the only meaningful criterion.
Gross Margin: 14-22%

Premium / Certified Tier

High-performance polyisocyanurate and extruded polystyrene with declared conductivity and third-party certification, specified where build-up thickness is constrained. Performance certification defends pricing. The eight-point range reflects standard against high-specification board economics.
Gross Margin: 26-34%

Sustainability / Regulatory / Next-Generation Tier

Fire-classified phenolic boards and complete retrofit systems with fixings, detailing and installer certification. Regulatory classification and system responsibility defend pricing strongly. The eleven-point range reflects classified board against full system supply economics.
Gross Margin: 38-49%
foam-insulation-market-portfolio-architecture-1787310489531

High-value Sub-segments and Strategic Watch-out

Fire-classified facade insulation boards

High value and high growth together, because roughly 38% of European facade specification now demands classification that combustible rigid foam cannot achieve, and reformulation and third-party testing take years. Specifiers have limited alternatives, and specification once written into building regulation proves remarkably durable over time.
Gross Margin: 38-49%

Complete retrofit systems for occupied buildings

Strong realised value on genuinely rapid growth, because renovation is 42% of consumption and demands products that tolerate irregular substrates and trades working around occupants throughout inhabited buildings. Installer certification and detailing responsibility together create the relationships that ordinary board suppliers cannot easily displace afterwards.
Gross Margin: 34-45%

Commodity board through merchant distribution

The volume core, keeping foam lines loaded and distribution relationships intact while earning whatever freight position and raw material terms permit once merchant tendering has finished with it. Necessary for line utilisation, but this tier will never fund classification testing or system development out of its own margin.
Gross Margin: 14-22%

Appliance and cold chain rigid foam

The strategic watch-out here, because this particular demand tracks refrigeration manufacture and food distribution investment rather than tracking construction cycles at all, and process integration with appliance manufacturers creates supply positions that survive the construction downturns which flatten the building business completely every few years.
Gross Margin: 22-32%

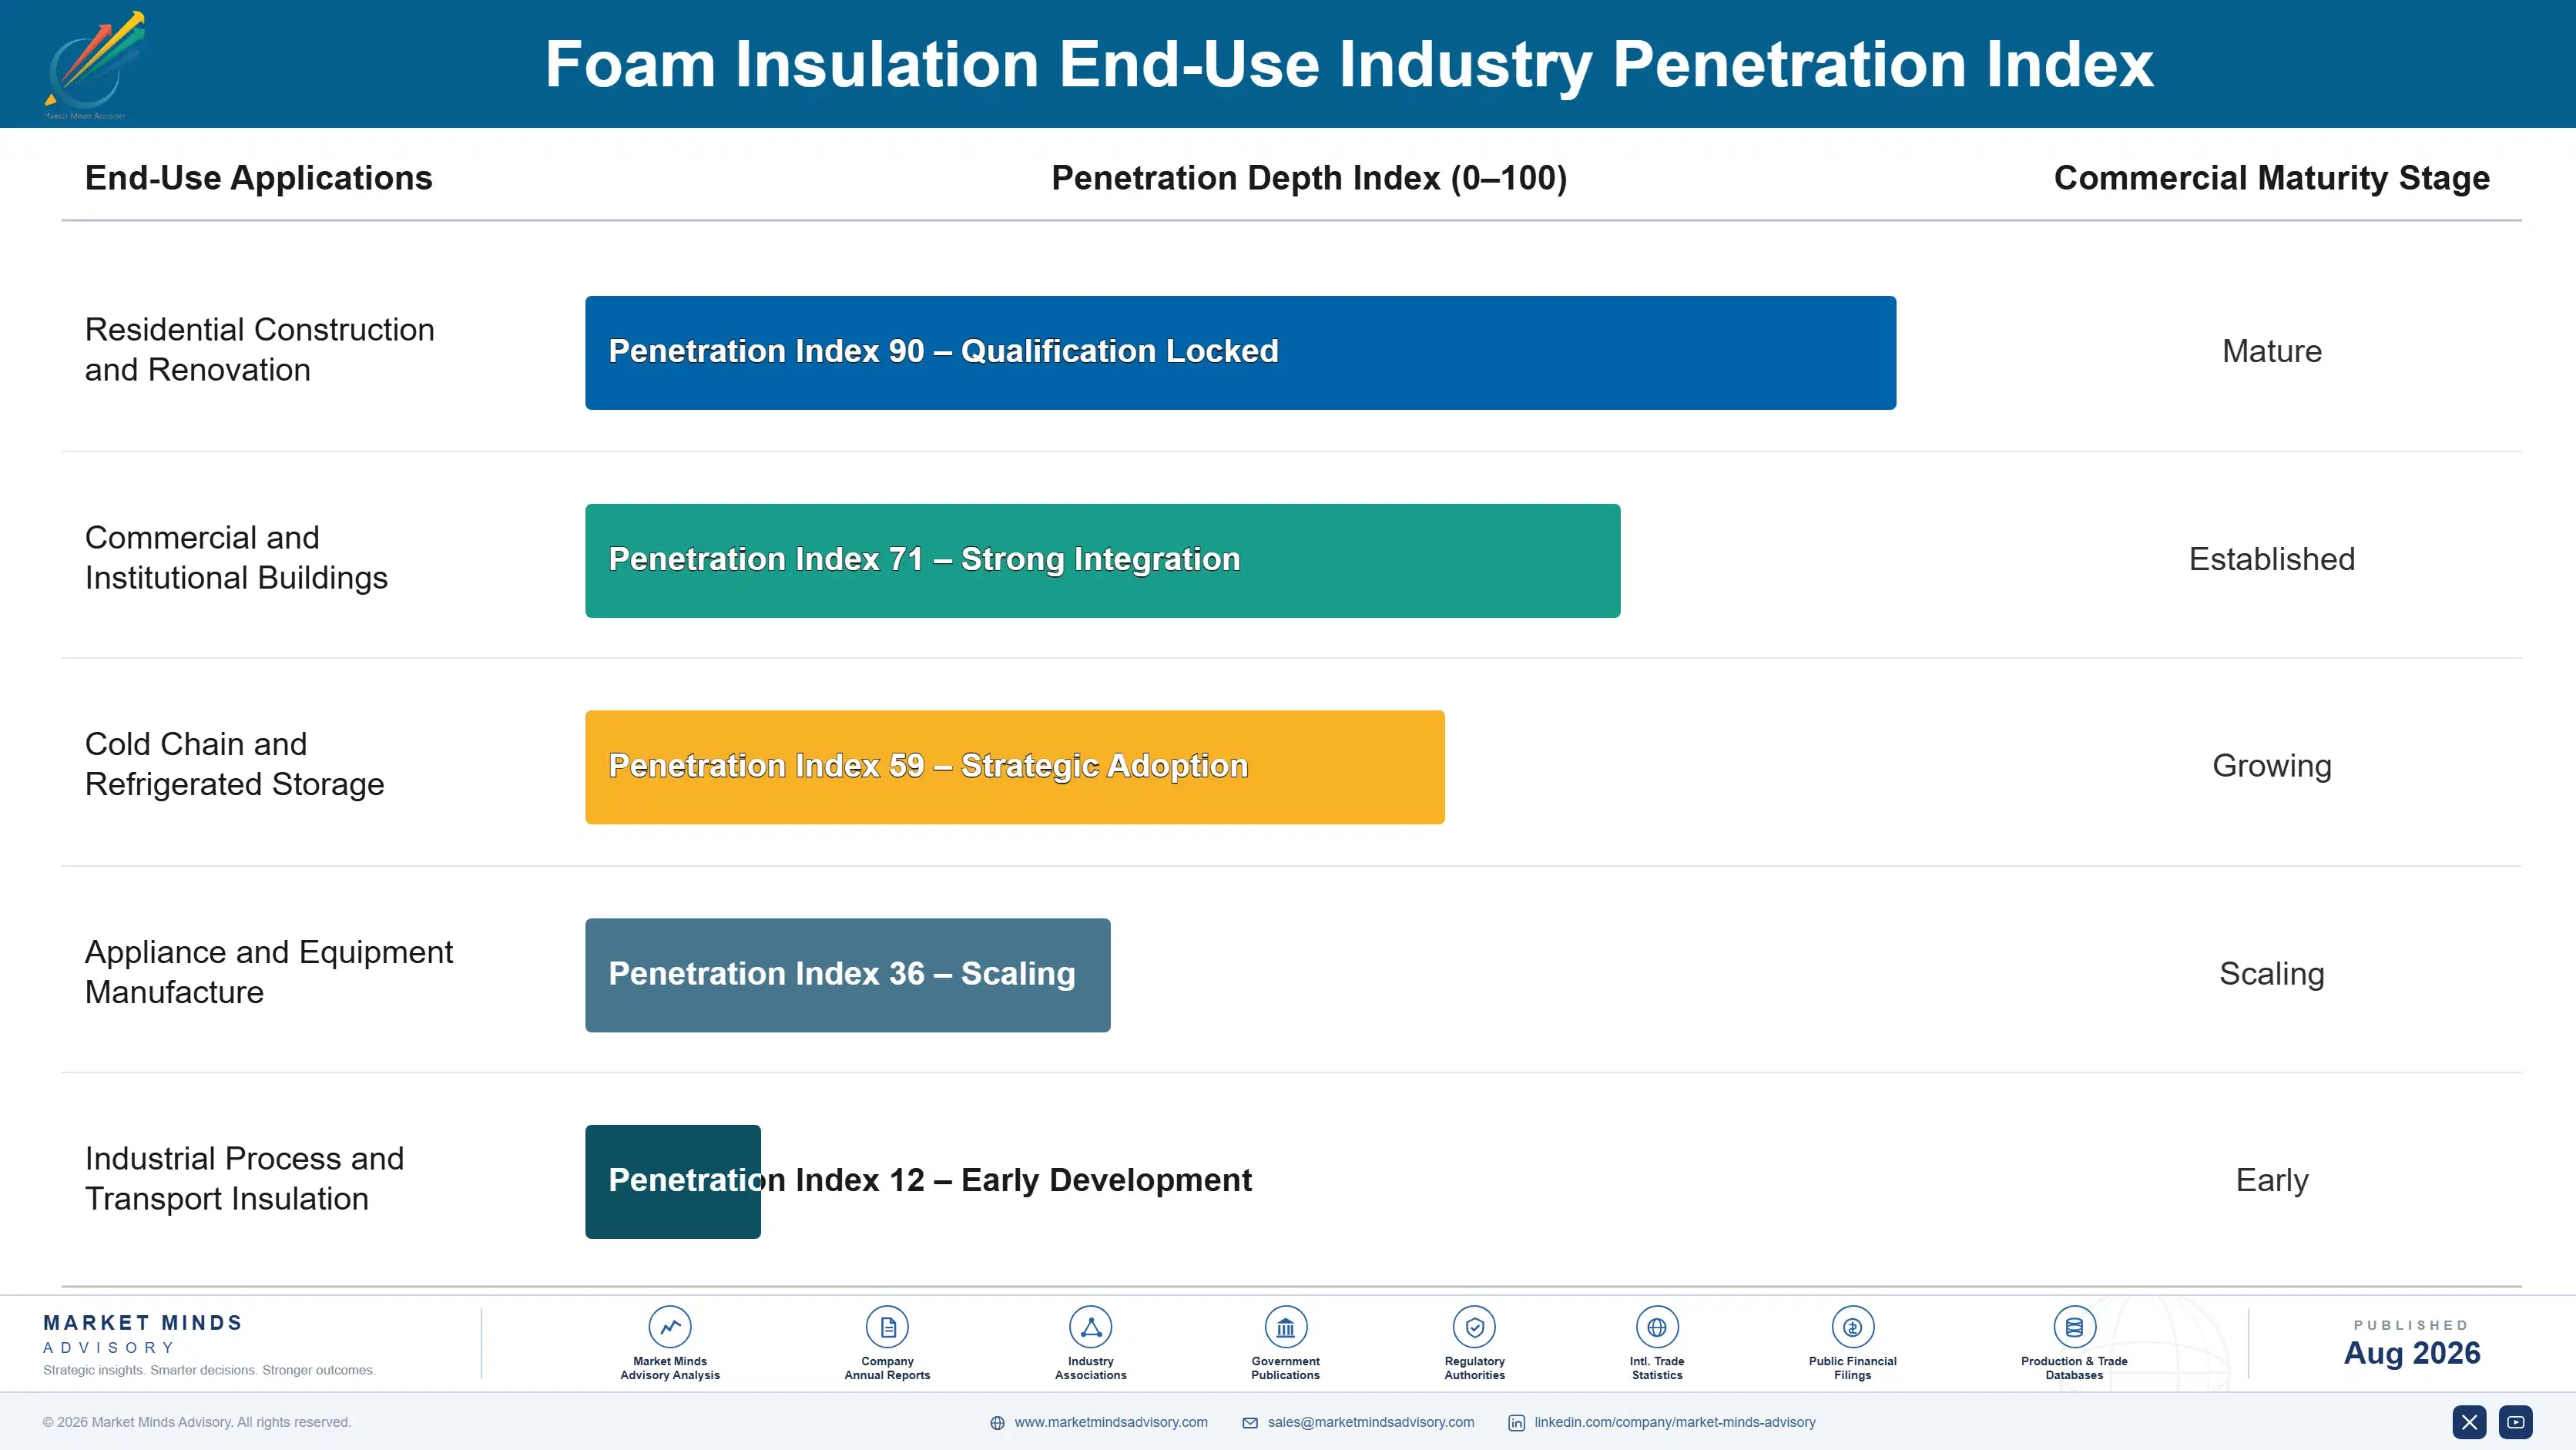
How Insulation Demand Behaves

Demand splits between project-driven construction volume and specification-locked system supply, and the two behave nothing alike. Commodity board is bought project by project from whichever merchant quotes best, with no relationship surviving beyond the delivery. Specified systems are written into architectural documentation months before construction and are difficult to substitute afterwards without redesign, which makes early specification engagement worth far more than any competitive quota
Stickiness varies sharply by application. Merchant board supply is loosest, retendered on every project with switching costing nothing at all. Cold chain and appliance foam is considerably tighter, because process integration and dimensional consistency are qualified against the manufacturer's own production line. Fire-classified facade products are stickiest of all, where classification is written into a building's regulatory approval and changing product means revisiting that approval entirely.

The buyer profile has shifted toward specifiers and insurers in a way that took the industry by surprise. A decade ago contractors and merchants effectively decided insulation selection on delivered price. Today architects working to fire classification requirements, and insurers unwilling to underwrite combustible facade construction, shape the candidate list before any commercial conversation happens at all.
foam-insulation-market-end-use-penetration-index-1787310490019

Where We Land On This

These are among the four positions where our research anticipates prominent divergence between winners and laggards over the coming forecast period. Each is grounded in the demand model, the regulatory perimeter, and the announced capacity pipeline.
01 / FLOOR AREA VALUE SELLING

Quantify recovered floor area, not board price

Wall and roof build-ups are dimensionally constrained, and a board reaching 0.022 watts per metre kelvin delivers the required thermal resistance in noticeably less thickness than any cheaper alternative can manage. On a commercial development that recovers lettable floor area worth far more than the entire insulation premium costs. Producers who actually present that calculation to developers realise roughly 30% above board-price competitors on the same projects, and the calculation itself takes an afternoon to prepare properly for any given project.
02 / FIRE CLASSIFICATION INVESTMENT

Reformulate for classification rather than contesting test methods

Roughly 38% of European facade specification now requires non-combustible or limited-combustibility classification, and insurers and developers have been moving ahead of the regulation rather than waiting for it to arrive. Classified products command roughly 45% above conventional rigid board pricing in restricted applications, because specifiers have very few compliant alternatives available to them at all. Producers who spent the interval arguing about test methodology rather than reformulating have watched specification move past them permanently, and rebuilding a lost position takes years.
03 / RETROFIT SYSTEM SUPPLY

Sell complete renovation systems, not insulation boards

Renovation accounts for 42% of total consumption and requires products that work within existing building geometry, tolerate irregular substrates and suit trades working around occupants throughout inhabited buildings. Producers supplying complete systems with fixings, detailing and installer certification realise roughly 2.2 times the value per square metre that plain board supply delivers on the same project. Most producers still sell boards into merchants and leave somebody else to solve the application problem entirely, which is exactly where the value ends up going.
04 / RAW MATERIAL INDEXATION

Index every merchant agreement to isocyanate benchmarks

Isocyanate and polyol represent 46% of production cost and reprice continuously with propylene and benzene, while merchant and distributor price lists update on a schedule that leaves converters absorbing the difference. Indexed agreements protect roughly 24% of realised margin through an event comparable to 2021, when Gulf Coast capacity froze and raw material pricing tripled inside months. Merchants refuse indexation at tender and accept it at renewal, so timing the request while memories are fresh matters more than negotiating hard.

Engagement Snapshot From the Field

A live engagement with an industry participant carrying material or product regulatory and market exposure ahead of a defining policy shift, showing how our research translates into a defensible multi-year portfolio strategy.
MARKET MINDS ADVISORY · CLIENT ENGAGEMENT SUMMARY
Foam Insulation Producer Strategic Portfolio Review and Transition Roadmap 2026·Investment Scenario on Foam Insulation Exposure Evaluation 2025-26
CLIENT PROFILE
A rigid foam converter operating five plants across Western and Eastern Europe, supplying polyisocyanurate and expanded polystyrene board through builders merchants and distribution alongside a small specification-led business. Insulation revenue approached EUR 380 million annually (client-reported, unverified by MMA), roughly three quarters of it in commodity board sold through merchant channels on published price lists.
STRATEGIC CHALLENGE
Margins had been erratic since 2021 and management attributed the volatility to raw material pricing, responding with procurement restructuring that changed nothing. Facade volume was being lost steadily to competitors and to mineral wool without anybody establishing why. A proposed capacity expansion assumed merchant board volumes would recover with construction activity.
MMA APPROACH
MMA interviewed forty-seven architects, developers, contractors, merchants and insurers across six markets, reconstructing how insulation specification decisions are actually reached and by whom. We separated raw material exposure from conversion margin across four years of results, benchmarked the client's fire classification position against competitors, and mapped specification practice at every major facade project lost.
KEY FINDINGS
  1. Margin volatility traced almost entirely to merchant price lists that updated quarterly against isocyanate repricing continuously, rather than to any change in competitive pricing pressure.
  2. Every facade project lost had been decided on fire classification before price was discussed, and in most cases the client had not been asked to quote at all.
  3. Insurers rather than architects were driving facade product exclusion at four of six developers interviewed, which nobody in the client's commercial organisation had understood.
  4. Specification-led business earned substantially better margins than merchant board on comparable volume (client-reported, unverified by MMA), while receiving under a tenth of commercial resource.
CLIENT PROFILE
A rigid foam converter operating five plants across Western and Eastern Europe, supplying polyisocyanurate and expanded polystyrene board through builders merchants and distribution alongside a small specification-led business. Insulation revenue approached EUR 380 million annually (client-reported, unverified by MMA), roughly three quarters of it in commodity board sold through merchant channels on published price lists.
STRATEGIC CHALLENGE
Margins had been erratic since 2021 and management attributed the volatility to raw material pricing, responding with procurement restructuring that changed nothing. Facade volume was being lost steadily to competitors and to mineral wool without anybody establishing why. A proposed capacity expansion assumed merchant board volumes would recover with construction activity.
MMA APPROACH
MMA interviewed forty-seven architects, developers, contractors, merchants and insurers across six markets, reconstructing how insulation specification decisions are actually reached and by whom. We separated raw material exposure from conversion margin across four years of results, benchmarked the client's fire classification position against competitors, and mapped specification practice at every major facade project lost.
KEY FINDINGS
  1. Margin volatility traced almost entirely to merchant price lists that updated quarterly against isocyanate repricing continuously, rather than to any change in competitive pricing pressure.
  2. Every facade project lost had been decided on fire classification before price was discussed, and in most cases the client had not been asked to quote at all.
  3. Insurers rather than architects were driving facade product exclusion at four of six developers interviewed, which nobody in the client's commercial organisation had understood.
  4. Specification-led business earned substantially better margins than merchant board on comparable volume (client-reported, unverified by MMA), while receiving under a tenth of commercial resource.
RECOMMENDED STRATEGY
Phase 1: Phase 1 (0 to 9 months): Halt the capacity expansion and convert merchant agreements to indexed pricing at each renewal opportunity. Phase 2: Phase 2 (9 to 24 months): Fund phenolic or classified board development and rebuild commercial coverage around architects, developers and insurers. Phase 3: Phase 3 (24 to 42 months): Develop complete retrofit systems with installer certification, targeting subsidised renovation programmes rather than merchant volume.
OUTCOME
The client deferred roughly EUR 70 million of planned capacity (client-reported, unverified by MMA) and moved most merchant agreements to indexed pricing within eighteen months. Margin volatility fell sharply, a classified board development programme entered testing, and the first specification-led facade project was won on classification rather than price.

Frequently Asked Questions

Foundational context covering the market sizes, CAGR, scope, country, region and competition that inform every finding below. This section is provided to cover basics and most often pre-purchase conversations, answered from the MMA Primary Research Dataset.

What is the current size of the Foam Insulation Market?

The market reached USD 29.6 billion in 2025, measured as product revenue at realised delivered price. Building retrofit accounts for 42% of total insulation foam consumption across all regions.

How large will the Foam Insulation Market be by 2036?

MMA forecasts USD 56.2 billion by 2036, an expansion of 1.79 times the 2026 level. Incremental value across the forecast period reaches USD 24.82 billion.

What is the CAGR for the Foam Insulation Market 2026 to 2036?

The base case compound annual growth rate is 6.0%, with a bull case of 7.2% and a bear case of 4.8%. Renovation subsidy deployment and construction activity separate those scenarios.

Which segment is growing fastest?

Phenolic foam boards grow fastest at 9.0%, exactly 1.50 times the overall market rate. Fire classification requirements on tall buildings rather than thermal performance are driving that shift.

Who are the major companies in the Foam Insulation Market?

Kingspan Group, BASF, Owens Corning, Recticel and Dow lead, holding 31% of foam volume between them. Freight economics keep regional converters competitive against every national producer.

Which country is growing fastest?

India grows fastest at 8.6%, where construction volume is enormous, cold chain infrastructure is expanding under food loss programmes and building energy codes are newly applied. Insulation intensity remains far below Western levels.

Report Segmentation Architecture

The full report scope spans multiple orthogonal segmentation dimensions, with cross-tabulated demand data provided for each dimension pair. Coverage extends further to regional breakdowns, trend trajectories, and the competitive detail needed to support segment-level decision-making.

By Foam Chemistry and Product Form

  • Phenolic Foam Boards
  • Polyisocyanurate Rigid Boards
  • Spray Polyurethane Foam
  • Elastomeric and Flexible Insulation Foams
  • Extruded Polystyrene
  • Expanded Polystyrene

By End-Use Industry

  • Residential Construction and Renovation
  • Commercial and Institutional Buildings
  • Cold Chain and Refrigerated Storage
  • Appliance and Equipment Manufacture
  • Industrial Process and Transport Insulation

By Customer Type and Channel

  • Builders Merchants and Distributors
  • Specification Architects and Developers
  • Insulation Contractors and Installers
  • Appliance and Panel Manufacturers
  • Industrial and Cold Store Operators

By Region

  • North America
  • Western Europe
  • East Asia
  • South Asia and Pacific
  • Latin America
  • Middle East and Africa
  • Eastern Europe

Scope, Methodology, and Coverage

Every figure in this report is reproducible from documented input assumptions. The scope below maps the historical period, the forecast horizon, the segmentation dimensions, and the countries covered, alongside the underlying primary and qualitative methodology.
Historical Period
2020 to 2025
Forecast Period
2026 to 2036
Base Year
2025 (USD billions; MMA Primary Research Dataset, August 2026)
Market Definition
The market comprises cellular polymeric insulation products manufactured for thermal insulation duty, spanning phenolic foam boards, polyisocyanurate rigid boards, spray polyurethane foam, elastomeric and flexible insulation foams, extruded polystyrene and expanded polystyrene. Sizing captures product revenue at realised delivered price across residential and commercial construction, building renovation, cold chain and refrigerated storage, appliance and equipment manufacture, and industrial process and transport insulation, including complete systems supplied with fixings and detailing components. Mineral wool, glass wool, cellulose and natural fibre insulation, vacuum insulated panels, aerogel products, insulated metal panel assemblies and installation labour fall outside scope.
Quantitative Units
USD billions (current prices); insulation foam volume shipped in million cubic metres annually; USD per square metre at declared thermal resistance
Segmentation Dimensions
By Foam Chemistry and Product Form; By End-Use Industry; By Customer Type and Channel; By Region
Regions Covered
North America, Western Europe, East Asia, South Asia and Pacific, Latin America, Middle East and Africa, Eastern Europe
Countries Covered
USA, Canada, Mexico, UK, Germany, France, Italy, Spain, Netherlands, Belgium, Sweden, Denmark, Ireland, Poland, Czech Republic, Romania, Hungary, Turkey, China, Japan, South Korea, India, Vietnam, Thailand, Indonesia, Australia, Brazil, Chile, Argentina, Saudi Arabia, UAE, South Africa, and additional markets relevant to this sector
Key Companies Profiled
Kingspan Group, BASF, Owens Corning, Recticel, Dow, Covestro, Huntsman, Knauf Insulation, Saint-Gobain, Carlisle Companies, Johns Manville, Armacell, Soprema, IKO Group, Sika, Synthos, Ravago, Kaneka, Sekisui Chemical, Beijing New Building Materials.
Quantitative Methodology
Primary survey, n=3,800 respondents, Q4 2025, six countries; demand-side model with trade association cross-validation
Qualitative Methodology
47 expert interviews, Q4 2025; applied to validate demand model assumptions, identify emerging dynamics, and assess competitive positioning
Report Format
PDF and XLSX data workbook (Word format preview document)
Publisher
Market Minds Advisory
Report Code
MMA-2026-CON-473
Published
August 2026
Contact
sales@marketmindsadvisory.com | www.marketmindsadvisory.com

Purchase the full Foam Insulation Market Report (2026 to 2036).

The full report sizes the foam insulation market across six foam chemistries, five end-use industries, five customer channels and seven regions, with annual forecasts to 2036 in revenue and volume shipped. It models delivered cost by plant including raw material terms and freight radius, which is the analysis that establishes where each converter can genuinely compete and where it cannot. Twenty participants are assessed on a consistent foam volume shipped basis, with fire classification positions mapped separately from manufacturing capacity. Building energy code schedules and renovation subsidy programmes are tracked market by market.
Six foam chemistries sized and forecast annually
Delivered cost modelled by plant and freight radius
Twenty participants on consistent foam volume shipped basis
Fire classification positions mapped separately from capacity
Building energy code schedules tracked market by market
Renovation subsidy programmes quantified across every region

Built For The People Who Decide

From boardroom strategy to bench-side execution, this report is read cover-to-cover by leaders shaping the next decade of their industry, turning demand scenarios, market dynamics and valuation benchmarks into decisions.
CXOs/ Presidents/ VPs/ Managers
M&A and Corporate Development
Strategy Teams and R&D Heads
Procurement and Product Directors
Regulatory and Compliance Leaders
Investor Relations and Equity Analysts