

Market Minds Advisory
FMCG Packaging Market

FMCG Packaging Market: Freight Economics, Fee Modulation, and the Fibre Substitution Ceiling

Empty packaging is mostly air, so economics collapse beyond a few hundred kilometres, which is why this market stays regionally fragmented while regulation quietly rewrites what every pack must be made of.

Lead Analyst

Bilal Shaikh

Published

September 2026

Make Smarter Decisions with Customized Research Insights

Request a free sample report and evaluate market opportunities, growth trends, and competitive dynamics relevant to your business needs.

2025 MARKET VALUE$462.0BMarket Size 2025
2036 FORECAST VALUE$741.9BBase Case , 2026 to 2036
CAGR 2026 TO 20364.4 %Bull 5.6% / Bear 3.2%
INCREMENTAL OPPORTUNITY$259.5BNet 10- year value creation
EXPANSION MULTIPLE1.54x2036 value over 2026 base
Strategic Levers
M&A Pipeline
Regional Outlook
Country Rankings
Competitive Intelligence
Segmental Deep-dive
Call-Us : 91 93563 13602

Executive Snapshot and Market Trajectory

Extended producer responsibility fees now price bad packaging directly, and brand owners are redesigning packs against fee schedules rather than against consumer preference. Regulation has become the primary design input across every developed market, ahead of cost and shelf appeal alike. Marketing lost that argument quietly and comprehensively.
Paper and paperboard compounds at 6.6%, a full 1.50x the market rate, because fibre is the compliance answer available today rather than the one arriving later, and it converts on existing lines. East Asia holds the largest share at 30%, since Chinese consumer goods manufacturing and domestic consumption together consume more packaging than any other region, and converting capacity sits alongside the filling lines it serves. Converting capacity locates beside filling lines by physical necessity.
Concentration is remarkably low at 17% despite genuinely global converters existing, because empty packaging is mostly air and freight economics collapse beyond roughly 400 kilometres. Amcor and Tetra Pak lead through format specialisation rather than through scale. Recycled content averages 23% against mandates that assume considerably more, and food-grade recyclate now trades above virgin resin. Mandated demand runs well ahead of sorting capacity.
Market Definition
This market covers primary, secondary and tertiary packaging supplied to fast-moving consumer goods manufacturers across food, beverage, personal care, home care and over-the-counter categories, spanning flexible plastic, rigid plastic, paper and paperboard, metal, glass and composite multi-material formats. Measurement is at converter revenue. Industrial and bulk transport packaging, pharmaceutical primary packaging, packaging machinery, labels and closures sold independently of a pack, and post-consumer waste collection or recycling services are excluded.
Base Year Value
$462.0B in 2025 (MMA Primary Research Dataset, August 2026)
Forecast Period
2026 to 2036, eleven discrete annual values
CAGR
4.4% base case. Bull 5.6%. Bear 3.2%.
Fastest Growth Segment
Paper and Paperboard Packaging: 6.6% CAGR
Fastest Growth Country
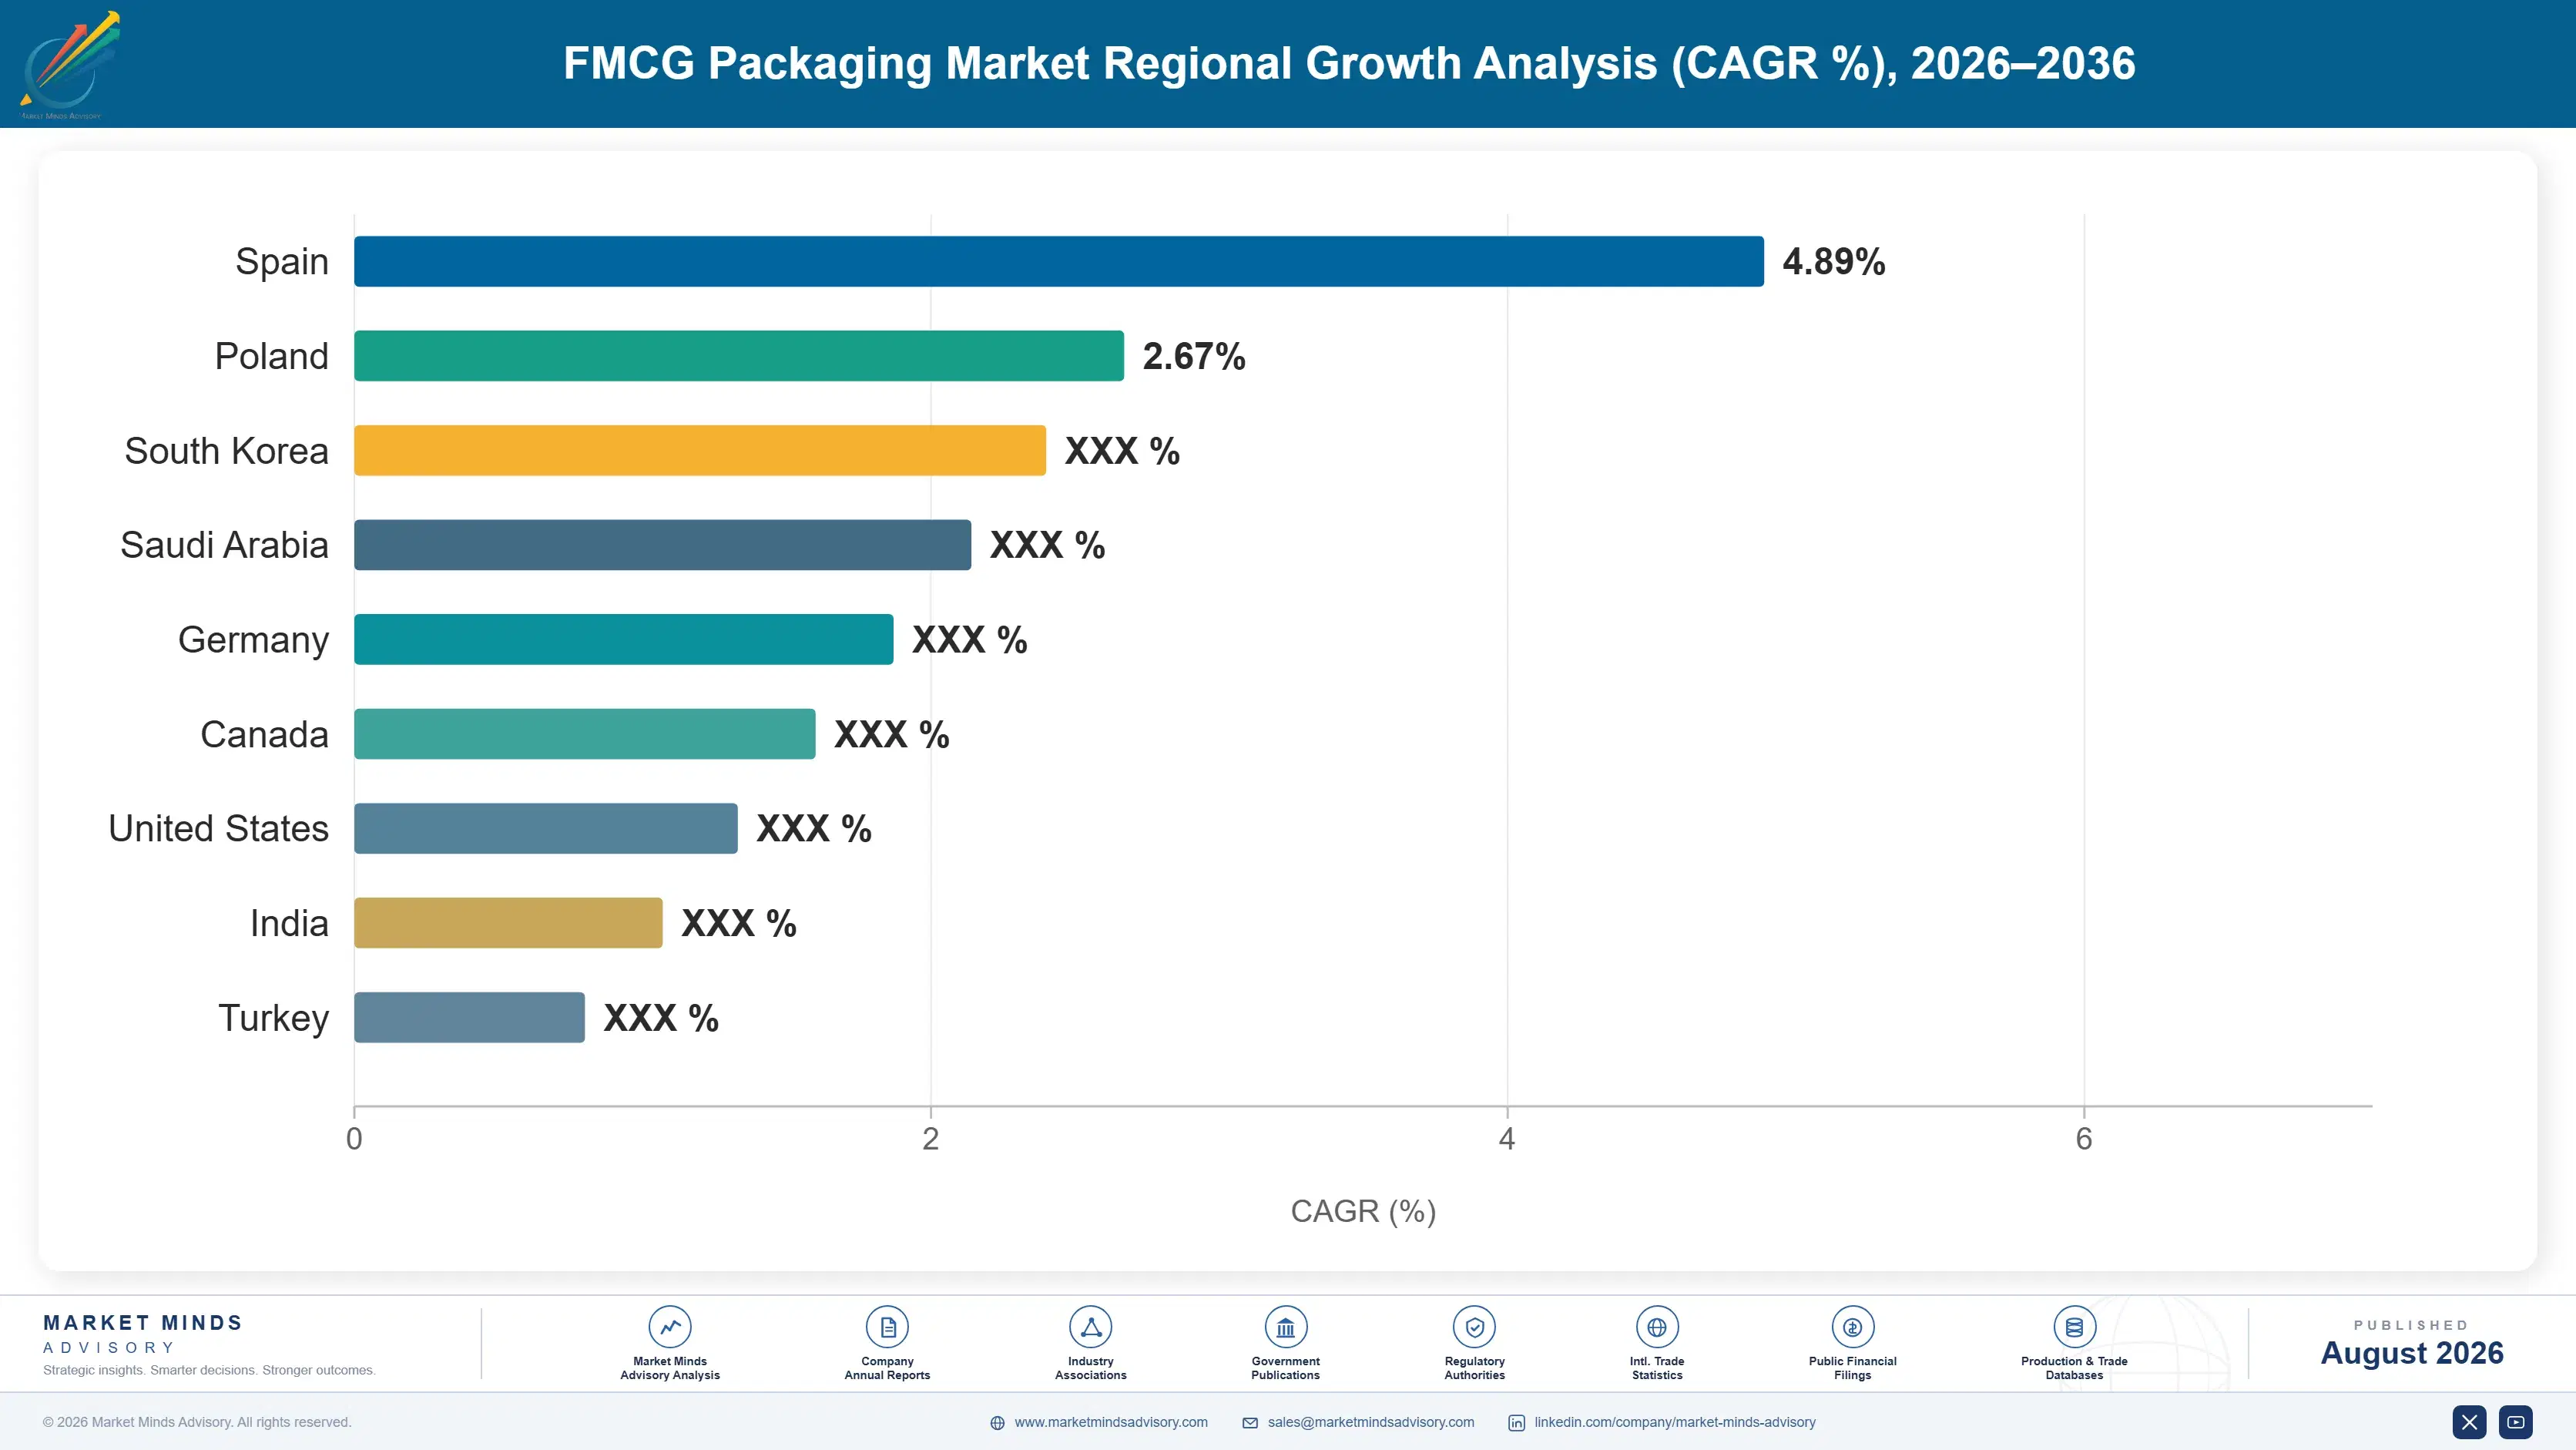
India: 8.2% CAGR
Fastest Growth Region
South Asia and Pacific: 6.6% CAGR
Largest Region
East Asia: 30% of 2025 global value
Market Leaders
Amcor, Tetra Pak, Smurfit Westrock, Ball Corporation, and Berry Global. Source: MMA Primary Research Dataset, July 2026.
Primary Survey
n=3,800 procurement and R&D decision-makers, Q4 2025, six countries
Methodology
Demand-side build-up, cross-validated against public data, 47 expert interviews

FMCG Packaging Market Forecast Scenarios

fmcg-packaging-market-size-forecast-scenario-1787304931485
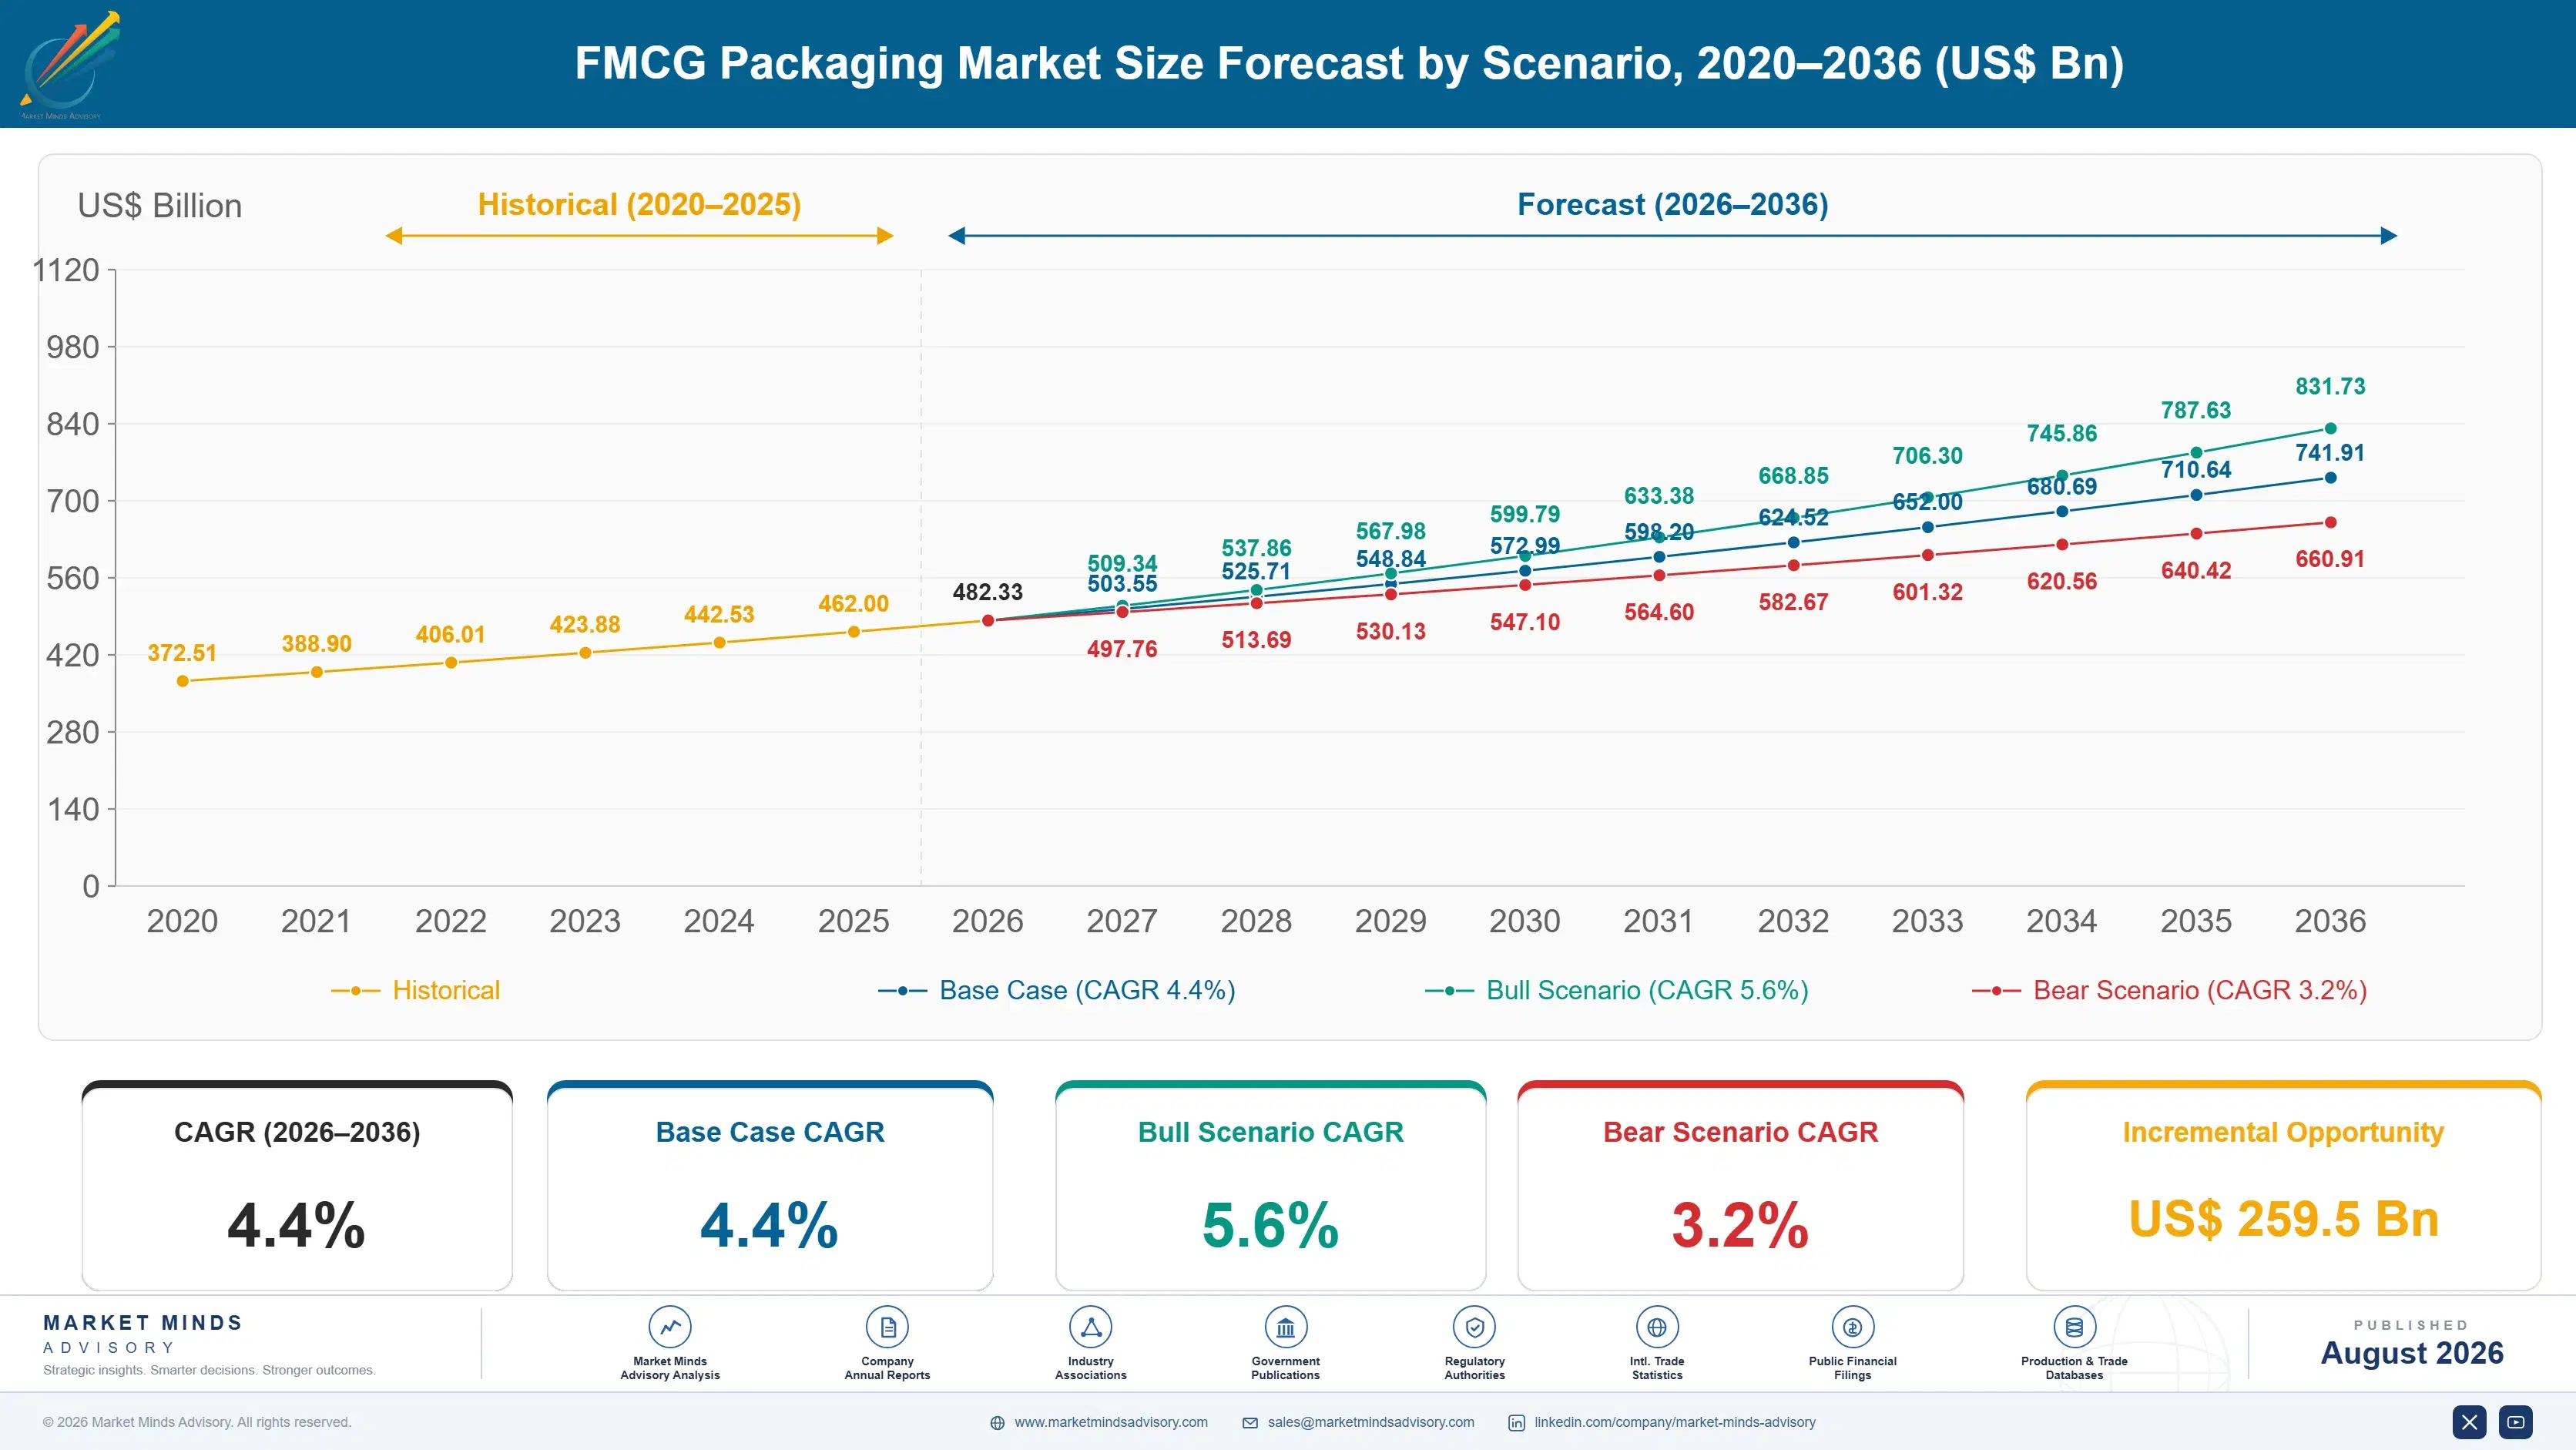
Growth ran near 3.6% from 2020 to 2025, and almost none of it was volume. Resin, aluminium and energy costs rose sharply through 2021 and 2022 and converters passed most of that through, so revenue grew while pack counts barely moved. Consumer downtrading toward smaller packs and private label eroded value per unit simultaneously, and the two effects largely cancelled out.
Base case growth of 4.4% rests on three mechanisms. Regulatory redesign forces material substitution that carries genuine cost, and substituted packs are more expensive than the ones they replace almost without exception. Emerging market consumption growth adds real unit volume where packaged goods penetration is still rising. And recycled content mandates pull converters toward inputs that trade at a premium to virgin material, which lifts revenue without lifting volume at all.
The bull case at 5.6% assumes recyclability requirements arrive on schedule across the European Union and several United States states simultaneously, forcing redesign faster than brand owners can absorb through cost engineering. The bear case at 3.2% is a demand story: private label share climbs further, retailers specify plainer packs on cost, and pack downsizing continues to remove value from every category it touches.

FMCG Packaging: Freight Radius Meets Fee Modulation

Packaging looks like a global business and behaves like a local one. A truckload of empty bottles or folding cartons is mostly air, freight cost per unit of value is punishing, and beyond roughly 400 kilometres the economics simply stop working. That is why the top five converters hold only 17% of the market, and why global players still operate as networks of regional plants serving nearby filling lines.
TOP FIVE CONCENTRATION17%Fragmented because freight economics limit how far packaging travels
RESIN SHARE OF COGS46%Polymer input cost as proportion of plastic converter goods sold
AVERAGE RECYCLED CONTENT23%Post-consumer recyclate across all consumer packaging formats supplied
PACKAGING COGS SHARE8.4%Packaging cost as a proportion of branded goods manufacturing cost
CONVERTING PLANT UTILISATION82%Average capacity use across converting sites in developed markets
ECONOMIC SUPPLY RADIUS400 kmDistance beyond which freight cost overwhelms converting margin entirely
What changed recently is who decides pack design. Extended producer responsibility schemes now modulate fees by recyclability, so a hard-to-recycle laminate costs a brand owner more per unit sold than a mono-material alternative does. European packaging regulation adds recycled content and recyclability requirements with dates attached. Design decisions that marketing departments once owned outright now pass through regulatory affairs first, and increasingly the fee schedule wins the argument.
Fibre is winning because it is the answer available now. Paper and paperboard compounds at 6.6% as brand owners convert plastic formats to fibre-based ones wherever barrier requirements permit, and converting runs on equipment that already exists. The ceiling is real: oxygen and moisture barriers remain the constraint, and many food categories cannot cross it without coatings that reintroduce the recyclability problem.
"Every brand owner tells us sustainability drives their packaging decisions, and every one of them is actually optimising against an extended producer responsibility fee schedule. That is not cynicism. It is the first time in this industry's history that environmental performance has carried a price a finance director can see."
Principal Analyst, Consumer Packaging and Materials Practice · MMA Packaging Pra

Market Trends

Fee modulation prices packaging design decisions directly

Extended producer responsibility schemes across Europe, Canada and several United States states now vary the fee a brand owner pays according to how recyclable the pack is, which turns an environmental attribute into a line-item cost. A multi-layer laminate can carry several times the fee of a mono-material equivalent per tonne placed on market. Brand owners now route design through regulatory affairs before marketing, and converters able to model fee outcomes win specification work others never see. The capability costs regulatory headcount rather than capital, which makes it quick to build and hard for a cost bidder to answer.
Market Impact: Mandates require 30% recycled conte

Fibre substitution advances until barrier requirements stop it

Paper and paperboard formats are replacing plastic across secondary packaging, dry goods, confectionery and personal care wherever product protection allows, and the segment compounds at 6.6% on exactly that substitution. Converting requires no new equipment category, which is why it moves faster than any alternative material. The limit is barrier performance: oxygen and moisture sensitive foods need coatings or laminates that reintroduce the recyclability problem, and roughly half of food categories cannot currently cross that line at all. Brand owners have split portfolios into categories where substitution is committed and categories ruled out on shelf life grounds.
Market Impact: India compounding at 8.2% annually

Market Opportunities and Growth Drivers

Recycled content mandates create demand supply cannot meet

European packaging rules require defined post-consumer recycled content in plastic packaging by dates now close enough to bind procurement decisions, and several jurisdictions have followed. Average recycled content across consumer packaging currently sits near 23%. Food-grade recyclate supply falls well short of mandated demand, with the result that food-grade rPET trades at a premium to virgin resin, inverting the price relationship that made recycling economically sensible in the first place. Converters holding recyclate supply contracts hold something genuinely scarce. Spot purchasing exposes converters to a market with very little liquidity and no effective price ceiling.
Market Impact: Supply radius capped near 400 km

Emerging market packaged goods penetration adds real volume

Unit growth in developed markets is close to flat, and essentially all volume expansion comes from countries where packaged goods penetration is still rising. India compounds at 8.2% as modern retail extends beyond metropolitan areas and as small-format packs bring branded goods within reach of lower income households. Southeast Asia, Nigeria and Brazil follow similar patterns. Sachet and small-pack formats dominate that growth, which means more packs per unit of product sold rather than fewer. Value per pack is low and volume growth substantial, so the regional revenue mix shifts more slowly than unit counts suggest.
Market Impact: Private label reaching 21% share

Market Restraints and Challenges

Freight economics cap plant scale and prevent consolidation

Empty packaging occupies volume far out of proportion to its value, and beyond roughly 400 kilometres freight cost overwhelms converting margin entirely. The root cause is physical rather than commercial, so no amount of consolidation resolves it. Commercial impact shows in a top five holding just 17% of the market and in acquisitions that deliver purchasing scale rather than plant rationalisation. Participants respond by locating inside customer sites, by densifying loads through pack redesign and by acquiring regionally rather than globally. None of those responses changes the underlying physics, which is why the market stays fragmented.
Market Impact: Fees vary by 4x across formats

Private label growth compresses specification and packaging spend

Private label now accounts for roughly 21% of packaged goods value across developed markets and continues rising as households trade down, and retailers specify packaging on delivered cost rather than on shelf differentiation. The root cause is sustained consumer price sensitivity following several years of food inflation. Commercial impact falls on premium graphics, specialty finishes and pack form development, all of which vanish from the specification entirely. Converters are responding by pursuing retailer relationships directly and by competing on regulatory compliance capability instead. Compliance capability travels across both branded and private label work, which makes it the more defensible position.
Market Impact: Compounding at 6.6% annually
4 additional market trends, 3 additional growth drivers, and 2 additional restraints and challenges are covered in the full report. Contact sales@marketmindsadvisory.com to access the complete intelligence.

Segment CAGR and Growth Architecture

Segmentation follows packaging material, because material determines the converting process, the capital base, the regulatory treatment under recyclability rules and the cost structure a converter carries. Six material classes cover consumer packaging supply without overlap between them. Product category and pack function cut across every material at once and are treated here as use attributes rather than as segments.
fmcg-packaging-market-market-share-analysis-1787304932020

Paper and Paperboard Packaging

Growing at 6.6%, a full 1.50x the market rate, fibre-based packaging is taking share from plastic across secondary packaging, dry goods, confectionery, personal care and increasingly chilled food. It converts on equipment that already exists in volume, recycles through collection infrastructure that already works, and carries lower extended producer responsibility fees almost everywhere fee modulation applies. The barrier ceiling is the honest constraint: oxygen and moisture sensitive products need coatings or laminates that compromise recyclability, and a substantial portion of food categories cannot yet cross it without reintroducing exactly the problem substitution was meant to solve. Roughly half of food categories currently sit on the wrong side of that line.
CAGR 6.6%

Metal Packaging

Metal grows at 5.2% on a second life nobody predicted a decade ago, as aluminium beverage cans take share from plastic bottles across carbonated drinks, water, energy drinks and increasingly wine and cocktails. The argument is infrastructure rather than material: aluminium has genuine collection systems, a positive scrap value and closed-loop recycling that actually functions at scale, which almost no plastic format can claim honestly. Steel food cans grow more slowly, held back by consumer preference for chilled and fresh formats. Aluminium price volatility remains the segment's principal commercial exposure throughout. Deposit return systems reinforce the collection advantage further, and beverage brand owners have noticed the format carries a recyclability story no plastic alternative can match.
CAGR 5.2%
Full segment breakdown across 6 segments available in the complete report.

Regional Architecture and Country Demand Map

Regional value tracks where consumer goods are filled rather than where brand owners are headquartered, because packaging travels badly and converting capacity locates beside the filling lines it serves. That physical constraint shapes every regional pattern below. Headquarters location says almost nothing about where value sits.

East Asia

East Asia takes the largest share at 30% because more consumer goods are filled here than anywhere else, and converting capacity sits alongside those filling lines by physical necessity. Chinese domestic consumption drives most of it, with a highly fragmented converter base of thousands of regional plants and very limited multinational penetration outside premium categories. Japanese and South Korean demand is mature, premium-weighted and unusually demanding on print quality and pack integrity. Chinese recycled content policy is tightening on a different timetable from Europe's, which fragments material specification across the region considerably. Flexible formats hold a higher share than in Western markets, reflecting both distribution patterns and price sensitivity across the mass consumer categories.
Share: 30% | CAGR: 5.4% (2026 to 2036)

North America

Twenty-four per cent of value, growing at 3.8%. Extended producer responsibility schemes arriving state by state have created a compliance patchwork that brand owners find harder to manage than a single national rule would be, and several converters now sell fee modelling as a service alongside the packaging itself. Aluminium can substitution for plastic bottles is further advanced here than anywhere, supported by deposit systems in several states. Private label growth is the most commercially significant pressure, compressing specification across categories where branded packaging once carried real premium. Freight radius constraints are felt acutely given the distances involved, and converting networks are correspondingly dense around major filling clusters in the Midwest and Southeast.
Share: 24% | CAGR: 3.8% (2026 to 2036)
Regional intelligence for 5 additional markets available in the complete report: Western Europe, South Asia and Pacific, Latin America, Middle East and Africa, Eastern Europe. Contact sales@marketmindsadvisory.com.
fmcg-packaging-market-country-cagr-analysis-1787304932536

Where Packaging Converters Defend Margin

Converting is a low-margin business constrained by freight and increasingly specified by regulation rather than by marketing. Margin accrues to converters who model compliance for a customer, hold scarce recyclate supply, and sit close enough to filling lines that freight arithmetic favours them. Everything else in converting competes on delivered cost against an identical local rival.

Sell compliance modelling alongside the packaging itself

Extended producer responsibility fees vary by as much as four times between recyclable and hard-to-recycle formats, and brand owners frequently lack the internal capability to model outcomes across a portfolio and multiple jurisdictions. Converters who can quantify fee impact for a proposed redesign win specification work that pure converting bids never reach. The capability costs regulatory affairs headcount rather than capital equipment, which makes the return unusually quick, and it survives the price comparison that commoditised converting cannot. Fee schedules can differ by more than 400 euros per tonne between formats inside one jurisdiction.
Market Impact: Fee spreads reaching 4x between the

Secure food-grade recyclate supply under long contracts

Food-grade recycled resin trades above virgin material because mandated demand exceeds available supply, an inverted price relationship that will persist while collection and sorting infrastructure lags requirements running toward 30% content. Converters holding multi-year recyclate contracts can quote compliant packs when competitors cannot quote at all. Spot purchasing exposes margin to a market with no ceiling and very little liquidity. This is procurement rather than innovation, and it is currently worth more than most innovation in the category. Contract duration matters more than price here, since availability decides whether a compliant pack can be quoted.
Market Impact: Secures supply against mandates now

Locate converting inside the customer freight radius

Beyond roughly 400 kilometres freight cost overwhelms converting margin entirely, which means plant location is a commercial decision rather than an operational one. Wall-to-wall and on-site converting arrangements remove freight from the equation completely and create switching costs no competitor can price against. Acquisitions that add plants outside customer radius add revenue without adding defensibility. Utilisation matters here too, since converting sites running below the 82% average carry fixed cost that delivered pricing cannot recover. Customers rarely move a qualified pack, and proximity removes the one variable a distant competitor could compete on.
Market Impact: Freight economics collapse beyond a

Build fibre conversion capability before customers demand it

Paper and paperboard compounds at 6.6% as brand owners substitute away from plastic wherever barrier requirements permit, and the converters capturing that work are the ones who already ran fibre lines. Retrofitting a flexible plastic business into fibre takes capital and time that a customer redesign timetable rarely allows. The barrier ceiling means substitution will not take every category, so capacity should be built against the categories that can actually cross it rather than against the total addressable claim. Acquiring regional fibre capacity inside existing customer radius is generally faster and cheaper than building it.
Market Impact: Captures a segment that is growing

Who Controls the Margin Pool

Concentration is remarkably low at 17% across the top five, measured on annual converter revenue from consumer packaging, the single basis applied throughout this analysis. Amcor and Tetra Pak lead through format specialisation rather than through scale, with Smurfit Westrock, Ball Corporation and Berry Global holding strong positions in paperboard, aluminium and rigid plastics respectively. Thousands of regional converters hold the remainder between them.
Competition runs on three dimensions that vary sharply by material. Paperboard has consolidated substantially, with Smurfit Westrock and International Paper both formed through large transactions, and competition there turns on integrated fibre supply and network density. Flexible plastics remain highly fragmented and compete on price and service responsiveness. Metal and glass compete on plant proximity and on pass-through mechanisms customers accept as standard.

Pressure builds from a direction converters did not historically face. Brand owners are consolidating packaging procurement globally while converting remains regional, which puts a global negotiation against a local cost base. Separately, regulatory compliance capability is becoming a genuine differentiator, and it favours larger converters with regulatory affairs functions. Rankings shift most in fibre substitution work, where a flexible plastics specialist can lose a category outright to a paperboard converter.
fmcg-packaging-market-company-positioning-matrix-1787304933053

Competitive Moat and Risk Dimensions

AMCOR

Moat: Global flexible format specialisation

Deep flexible packaging capability across food, personal care and healthcare formats, combined with plant networks positioned inside the freight radius of major filling operations across several continents, gives Amcor specification positions that regional converters cannot bid against on multi-country programmes. Material science capability in barrier and mono-material structures supports exactly the redesign work regulation now requires.
AMCOR

Risk: Flexible format regulatory exposure

Multi-layer flexible laminates attract the highest extended producer responsibility fees under modulated schemes and face the greatest recyclability pressure of any format, which puts a substantial portion of the portfolio on the wrong side of the regulatory direction. Fibre substitution takes share directly from flexible plastics. Resin cost pass-through lags in falling markets.
TETRA PAK

Moat: Integrated system and machine

Supplying filling machinery alongside the carton material creates a relationship no material-only converter can replicate, since the machine determines which packaging the customer can physically run. Aseptic carton capability serves ambient dairy and beverage categories where alternatives struggle on shelf life. Installed machine base functions as a durable specification lock across long equipment lives.
TETRA PAK

Risk: Composite recyclability under scrutiny

Liquid cartons combine paperboard, polymer and aluminium in a structure that requires dedicated recycling infrastructure available in relatively few markets, which places the format awkwardly under recyclability criteria written around mono-material assumptions. Fee modulation schedules increasingly reflect that. Mono-material fibre alternatives are advancing in chilled and shorter shelf-life categories.

Players Tracked

Prominent Players

Amcor
Tetra Pak
Smurfit Westrock
Ball Corporation
Berry Global

Other Key Players

Crown Holdings
Sealed Air
Sonoco Products
Mondi
International Paper
Huhtamaki
Ardagh Group
O-I Glass
Constantia Flexibles
Toyo Seikan
Graphic Packaging International
Silgan Holdings
ALPLA
SIG Group
Nampak

Recent Developments

APRIL 2025

European recyclability criteria push brand owners toward mono-material redesign

Implementing detail under European packaging regulation clarified recyclability assessment for multi-layer structures, prompting several major brand owners to accelerate mono-material redesign programmes across food and personal care portfolios ahead of the compliance dates attached. Several converters reported customers requesting fee impact modelling for the first time.
Signal: Regulatory affairs functions now set packa
SEPTEMBER 2025

Food-grade recyclate premium over virgin resin persists through the year

Food-grade recycled polyethylene terephthalate continued trading above virgin resin across European and North American markets, an organic price inversion driven by mandated demand exceeding available collection and sorting capacity rather than by any supply disruption event. Converters holding multi-year supply contracts quoted compliant packs that spot buyers could not.
Signal: Recycled content mandates are lifting conv
JANUARY 2026

Aluminium can substitution extends beyond carbonated beverage categories

Beverage brand owners extended aluminium can formats into still water, wine and ready-to-drink cocktails, an organic commercial shift driven by functioning collection infrastructure and positive scrap value rather than by any change in relative material cost. Deposit return systems in several markets reinforced the collection advantage further.
Signal: Recycling infrastructure that genuinely wo

Resin, Aluminium and Energy Exposure

Input cost dominates converting economics to an unusual degree. Polymer resin accounts for roughly 46% of cost of goods sold in plastic converting, aluminium runs higher in can making, and recovered fibre plus energy carry most of paperboard cost. Resin derives from naphtha and ethane feedstock concentrated in the Middle East, United States Gulf Coast and Northeast Asia, while primary aluminium is weighted toward China and the Gulf.
European energy costs through 2022 hit glass and aluminium converting hardest, since both are energy-intensive processes that cannot easily reduce consumption per unit. The International Energy Agency documented industrial gas price movements across that period, and several European glass furnaces were idled rather than run at a loss. Converter annual reports through 2023 recorded both pass-through achieved and volume lost where customers reformulated to cheaper materials.

Exposure varies enormously by material and by contract structure. Converters with formula-based pass-through clauses transfer commodity movement to customers, while those on fixed-price annual contracts absorb it entirely, and that difference decides profitability. Geography compounds it: European converters face energy costs several times those in the Gulf or United States, which is why energy-intensive glass and aluminium capacity has migrated steadily toward cheaper power.
fmcg-packaging-market-cost-volatility-analysis-1787304933247

Negotiate formula-based pass-through on every commodity input

Resin at 46% of cost of goods and aluminium at more still make fixed-price annual contracts a bet on commodity direction rather than a commercial agreement. Formula-based clauses indexed to published benchmarks transfer that movement to the customer, who is generally better placed to absorb it across a portfolio. Converters without such clauses are effectively trading commodities without meaning to.

Lightweight packs to reduce material intensity per unit

Material is the dominant cost in every format, so removing weight per pack cuts exposure proportionally and cuts producer responsibility fees too, since most schemes charge by tonnage. Lightweighting also densifies freight loads within the same radius. The engineering limit is pack integrity through distribution, which is reached sooner than most cost models assume.

Locate energy-intensive capacity where power costs less

Glass and aluminium converting consume energy at levels that cannot be engineered away, and European power costs several times those in the Gulf or the United States decide competitiveness outright. Capacity has migrated accordingly. Long-term power purchase agreements offer partial protection for plants that cannot relocate, but they do not close a gap of that magnitude.

Portfolio Architecture for Margin Defence

Margin architecture in packaging converting separates on switching cost rather than on material. Standard formats bid competitively against nearby converters earn very little, because freight defines the competitive set and within that radius the offer is close to identical. Formats requiring dedicated tooling, qualified barrier performance or line integration earn better, since requalification costs customers time they rarely have. Compliance-critical work earns best of all.
The volume against premium tension here is a private label story. Retailer-specified packaging is high volume, plainly specified and bid on delivered cost, and it now represents roughly 21% of packaged goods value with the share still climbing. Branded packaging carries graphics, finishes and design work that command real premium but sits in categories losing share to private label. Converters serving only one side of that split are exposed to a trend they cannot influence.

High-value pools concentrate around regulation and scarcity. Compliance modelling capability, food-grade recyclate supply contracts, mono-material barrier structures and fibre conversion capacity all command premium because customers cannot easily source them elsewhere. Standard flexible and rigid conversion competes on cost within a freight radius against converters with identical economics, which is a difficult place to build durable margin.

Volume / Commodity-Adjacent Tier

Standard flexible film, rigid containers and corrugated formats bid on delivered cost against nearby converters with essentially identical cost structures, where private label specification and freight radius together define the entire competitive set.
Gross Margin: 12-20%

Premium / Certified Tier

Formats requiring dedicated tooling, qualified barrier performance, food contact certification or customer line integration, protected by requalification costs and lead times that customers under production pressure will not readily accept.
Gross Margin: 22-34%

Sustainability / Regulatory / Next-Generation Tier

Mono-material barrier structures, high recycled content formats and compliance modelling services, commanding premium because mandated demand exceeds available supply and because customers lack the regulatory capability internally. Availability rather than price is what decides these awards today.
Gross Margin: 30-46%
fmcg-packaging-market-portfolio-architecture-1787304933742

Filling Line Annuities and Requalification

Packaging demand is about as close to an annuity as manufacturing gets. A qualified pack runs on a specific filling line for years, consumption tracks the brand owner's production volume directly, and orders arrive continuously rather than in cycles. Once a format is qualified on a line, the converter supplying it enjoys revenue that requires no repeated selling. Volume follows the brand's fortunes rather than any purchasing decision.
Stickiness varies sharply by what qualification actually required. Formats needing dedicated tooling, line trials and food contact validation hold for years because requalification costs production time a manufacturer will not surrender casually. Standard corrugated and plain film requalify in weeks and are retendered accordingly. Aseptic and machine-integrated systems are stickiest of all, since the filling equipment itself determines which packaging can physically run on it.

Buyer profiles have shifted meaningfully. Packaging technologists once specified formats and procurement executed against that specification; global procurement organisations now negotiate multi-country agreements against converters who remain regional by physical necessity. Regulatory affairs has entered the decision as a genuine third voice, and in European categories it increasingly overrules both. Retailer packaging buyers specifying private label represent a fourth profile again, buying on delivered cost alone.
fmcg-packaging-market-end-use-penetration-index-1787304934229

Where Packaging Strategy Must Land

These are among the four positions where our research anticipates prominent divergence between winners and laggards over the coming forecast period. Each is grounded in the demand model, the regulatory perimeter, and the announced capacity pipeline.
01 / COMPLIANCE CAPABILITY PREMIUM

Regulatory affairs now specifies packaging, not marketing

Extended producer responsibility fees vary by as much as four times between recyclable and hard-to-recycle formats, which turns an environmental attribute into a cost line that finance directors can see and act upon directly. Brand owners frequently lack the internal capability to model those outcomes across a portfolio spanning several jurisdictions with different schedules. Converters able to quantify fee impact for a proposed redesign reach the specification conversations that pure converting bids never get anywhere near, and they reach them considerably earlier.
02 / RECYCLATE SUPPLY SECURITY

Scarce recycled content is worth more than innovation

Food-grade recycled resin trades above virgin material because mandated demand runs well ahead of collection and sorting capacity, and that inversion will persist for as long as infrastructure lags requirements heading toward 30% content. Converters holding multi-year recyclate supply contracts can quote compliant packs at precisely the moments when their competitors cannot quote at all. This is procurement rather than technology, and at present it is worth considerably more to a converter than most of the innovation happening in the category.
03 / FREIGHT RADIUS DISCIPLINE

Acquisitions outside the radius add revenue, not defensibility

Empty packaging is mostly air and beyond roughly 400 kilometres freight cost overwhelms converting margin entirely, which is precisely why the top five converters hold only 17% of a market worth hundreds of billions of dollars. Acquisitions that add plants outside the customer freight radius deliver purchasing scale and essentially nothing else of any lasting strategic value whatsoever. On-site and wall-to-wall converting arrangements remove freight from the equation altogether and create switching costs that no competitor anywhere can realistically price against.
04 / LAMINATE EXPOSURE MANAGEMENT

Multi-layer volume is being priced out of existence

Multi-layer flexible laminates attract the very highest fee modulation charges available anywhere and face the sharpest recyclability pressure under criteria written around mono-material assumptions that these structures simply cannot satisfy. Fibre substitution is taking whole categories directly from flexible plastics at 6.6% annual growth, and it runs on converting equipment that already exists in considerable volume. Converters whose portfolios sit heavily in laminate structures are holding volume that regulation is deliberately and quite steadily making more expensive with every passing year.

Engagement Snapshot From the Field

A live engagement with an industry participant carrying material or product regulatory and market exposure ahead of a defining policy shift, showing how our research translates into a defensible multi-year portfolio strategy.
MARKET MINDS ADVISORY · CLIENT ENGAGEMENT SUMMARY
FMCG Packaging Producer Strategic Portfolio Review and Transition Roadmap 2026·Investment Scenario on FMCG Packaging Exposure Evaluation 2025-26
CLIENT PROFILE
A European flexible packaging converter operating eleven plants across five countries, supplying food, personal care and home care brand owners with printed laminates, mono-material films and lidding. Annual revenue was approximately USD 1.4 billion (client-reported, unverified by MMA), with multi-layer laminate structures representing rather more than half of volume and the great majority of contribution margin.
STRATEGIC CHALLENGE
Fee modulation under European extended producer responsibility schemes had begun charging customers materially more for the laminate structures that formed the core of the business, and several major accounts had opened fibre substitution programmes without involving the client at all. The board needed to decide whether to defend laminate volume through mono-material redesign or to invest in fibre conversion capacity outright.
MMA APPROACH
MMA conducted 47 expert interviews spanning brand owner packaging technologists, regulatory affairs directors, procurement leads, retailer private label buyers and converting plant managers across six countries. A quantitative survey of 3,800 respondents established specification decision authority, substitution intent by category and willingness to pay for compliance capability. We then modelled volume and margin outcomes by category against published fee schedules and stated substitution timetables.
KEY FINDINGS
  1. Regulatory affairs functions held effective veto authority over packaging specification in five of six European markets surveyed, a position they had not occupied three years earlier at all.
  2. Brand owners had already committed to fibre substitution in dry goods, confectionery and secondary packaging, but ruled it out entirely for oxygen-sensitive categories on shelf life grounds.
  3. Procurement leads valued fee modelling capability highly and could not source it internally, yet no converter serving them had offered it as a distinct service line.
  4. Mono-material film redesign preserved roughly two-thirds of laminate volume where barrier requirements were moderate, but failed technically in high-barrier chilled and ambient food.
CLIENT PROFILE
A European flexible packaging converter operating eleven plants across five countries, supplying food, personal care and home care brand owners with printed laminates, mono-material films and lidding. Annual revenue was approximately USD 1.4 billion (client-reported, unverified by MMA), with multi-layer laminate structures representing rather more than half of volume and the great majority of contribution margin.
STRATEGIC CHALLENGE
Fee modulation under European extended producer responsibility schemes had begun charging customers materially more for the laminate structures that formed the core of the business, and several major accounts had opened fibre substitution programmes without involving the client at all. The board needed to decide whether to defend laminate volume through mono-material redesign or to invest in fibre conversion capacity outright.
MMA APPROACH
MMA conducted 47 expert interviews spanning brand owner packaging technologists, regulatory affairs directors, procurement leads, retailer private label buyers and converting plant managers across six countries. A quantitative survey of 3,800 respondents established specification decision authority, substitution intent by category and willingness to pay for compliance capability. We then modelled volume and margin outcomes by category against published fee schedules and stated substitution timetables.
KEY FINDINGS
  1. Regulatory affairs functions held effective veto authority over packaging specification in five of six European markets surveyed, a position they had not occupied three years earlier at all.
  2. Brand owners had already committed to fibre substitution in dry goods, confectionery and secondary packaging, but ruled it out entirely for oxygen-sensitive categories on shelf life grounds.
  3. Procurement leads valued fee modelling capability highly and could not source it internally, yet no converter serving them had offered it as a distinct service line.
  4. Mono-material film redesign preserved roughly two-thirds of laminate volume where barrier requirements were moderate, but failed technically in high-barrier chilled and ambient food.
RECOMMENDED STRATEGY
Phase 1: Phase one: build a regulatory affairs service capability and offer portfolio fee modelling to major accounts, positioning it ahead of any material decision. Phase 2: Phase two: accelerate mono-material film development for moderate-barrier categories, where redesign preserves volume that fibre substitution cannot technically take from the business. Phase 3: Phase three: acquire fibre converting capacity regionally rather than build it, targeting plants already inside the freight radius of existing accounts.
OUTCOME
The client launched a fee modelling service that secured early specification involvement across seven major accounts (client-reported, unverified by MMA), redirected roughly USD 45 million into mono-material film capability, and acquired a regional folding carton converter. Laminate volume declined as expected while blended margin improved, and two accounts that had begun substituting without the client returned to joint development.

Frequently Asked Questions

Foundational context covering the market sizes, CAGR, scope, country, region and competition that inform every finding below. This section is provided to cover basics and most often pre-purchase conversations, answered from the MMA Primary Research Dataset.

What is the current size of the FMCG Packaging Market?

The global FMCG packaging market was valued at USD 462.0 billion in 2025, spanning flexible plastic, rigid plastic, paper and paperboard, metal, glass and composite formats. Packaging represents roughly 8.4% of branded consumer goods manufacturing cost.

How large will the FMCG Packaging Market be by 2036?

MMA forecasts the market at USD 741.86 billion by 2036, expanding 1.54 times from the 2026 base of USD 482.33 billion. That represents roughly USD 259.53 billion of incremental value across the forecast decade.

What is the CAGR for the FMCG Packaging Market 2026 to 2036?

The base case compound annual growth rate is 4.4%, with a bull case of 5.6% and a bear case of 3.2%. The bull case assumes recyclability requirements arrive on schedule across Europe and several United States states simultaneously.

Which segment is growing fastest?

Paper and paperboard packaging grows at 6.6%, a full 1.50x the overall market rate. Fibre substitution converts on equipment that already exists, though barrier requirements stop it entering many food categories.

Who are the major companies in the FMCG Packaging Market?

Amcor, Tetra Pak, Smurfit Westrock, Ball Corporation and Berry Global together hold just 17% of revenue. Freight economics cap how far packaging travels, which keeps the market fragmented across thousands of regional converters.

Which country is growing fastest?

India grows fastest at 8.2%, as modern retail extends beyond metropolitan areas and small-format packs bring branded goods to lower income households. East Asia is the largest region at 30% of value.

Report Segmentation Architecture

The full report scope spans multiple orthogonal segmentation dimensions, with cross-tabulated demand data provided for each dimension pair. Coverage extends further to regional breakdowns, trend trajectories, and the competitive detail needed to support segment-level decision-making.

By Packaging Material

  • Flexible Plastic Packaging
  • Rigid Plastic Packaging
  • Paper and Paperboard Packaging
  • Metal Packaging
  • Glass Packaging
  • Composite and Multi-Material Packaging

By End-Use Industry

  • Packaged Food Manufacturing
  • Beverage Production
  • Personal Care and Cosmetics
  • Home Care and Household Products
  • Over-the-Counter Consumer Health
  • Pet Food and Pet Care

By Commercial Dimension

  • Branded Manufacturer Direct Supply
  • Retailer Private Label Specification
  • Contract Packer and Co-Manufacturer Supply
  • On-Site and Wall-to-Wall Arrangements
  • Distributor and Merchant Channel
  • Compliance and Design Service Contracts

By Region

  • East Asia
  • North America
  • Western Europe
  • South Asia and Pacific
  • Latin America
  • Middle East and Africa
  • Eastern Europe

Scope, Methodology, and Coverage

Every figure in this report is reproducible from documented input assumptions. The scope below maps the historical period, the forecast horizon, the segmentation dimensions, and the countries covered, alongside the underlying primary and qualitative methodology.
Historical Period
2020 to 2025
Forecast Period
2026 to 2036
Base Year
2025 (USD billions; MMA Primary Research Dataset, August 2026)
Market Definition
This market comprises primary, secondary and tertiary packaging supplied to fast-moving consumer goods manufacturers, measured at converter revenue across branded direct supply, retailer private label specification, contract packer supply, on-site converting arrangements, distributor channels and packaging-related compliance service contracts. Coverage spans flexible plastic films and laminates, rigid plastic containers, bottles and closures supplied as part of a pack, paper and paperboard cartons, corrugated and moulded fibre, metal cans and aerosol containers, glass bottles and jars, and composite multi-material formats including liquid cartons and laminated tubes. Industrial and bulk transport packaging, pharmaceutical primary packaging, packaging and filling machinery, labels and closures sold independently of a pack, post-consumer waste collection and recycling services, and raw polymer, aluminium or fibre production fall outside scope.
Quantitative Units
USD millions (current prices); tonnage converted by material; pack units supplied; recycled content percentage; average selling price per thousand units; converting plant utilisation
Segmentation Dimensions
By Packaging Material; By End-Use Industry; By Commercial Dimension; By Region
Regions Covered
East Asia, North America, Western Europe, South Asia and Pacific, Latin America, Middle East and Africa, Eastern Europe
Countries Covered
China, Japan, South Korea, Taiwan, United States, Canada, Mexico, Germany, France, United Kingdom, Italy, Spain, Netherlands, Belgium, Sweden, India, Australia, Indonesia, Thailand, Vietnam, Philippines, Brazil, Argentina, Colombia, Chile, Saudi Arabia, United Arab Emirates, Egypt, Nigeria, South Africa, Poland, Czechia, Romania, Turkey, and additional markets relevant to consumer packaging analysis
Key Companies Profiled
Amcor, Tetra Pak, Smurfit Westrock, Ball Corporation, Berry Global, Crown Holdings, Sealed Air, Sonoco Products, Mondi, International Paper, Huhtamaki, Ardagh Group, O-I Glass, Constantia Flexibles, Toyo Seikan, Graphic Packaging International, Silgan Holdings, ALPLA, SIG Group, Nampak
Quantitative Methodology
Primary survey, n=3,800 respondents, Q4 2025, six countries; demand-side model with trade association cross-validation
Qualitative Methodology
47 expert interviews, Q4 2025; applied to validate demand model assumptions, identify emerging dynamics, and assess competitive positioning
Report Format
PDF and XLSX data workbook (Word format preview document)
Publisher
Market Minds Advisory
Report Code
MMA-2026-PAC-255
Published
August 2026
Contact
sales@marketmindsadvisory.com | www.marketmindsadvisory.com

Purchase the full FMCG Packaging Market Report (2026 to 2036).

The full MMA report treats packaging as the regionally constrained business it physically is, quantifying how freight radius, fee modulation and recyclate scarcity together determine where converting margin now sits. It sizes six material classes and seven regions to 2036, modelling tonnage, pack units, recycled content, pricing and plant utilisation separately so that regulatory-driven value can be distinguished from volume growth. Competitive assessment covers twenty converters on one consistent revenue basis. Cost exposure is traced through resin, aluminium, fibre and energy inputs. Four commercial levers and a strategic verdict close the report, grounded in 47 expert interviews and a 3,800-respondent survey.
Six material classes sized separately through 2036
Fee modulation impact modelled by format and jurisdiction
Recyclate supply scarcity quantified against mandated content requirements
Twenty converters assessed on one consistent basis
Freight radius economics mapped against plant network positioning
Anonymised client engagement with tested strategic recommendations

Built For The People Who Decide

From boardroom strategy to bench-side execution, this report is read cover-to-cover by leaders shaping the next decade of their industry, turning demand scenarios, market dynamics and valuation benchmarks into decisions.
CXOs/ Presidents/ VPs/ Managers
M&A and Corporate Development
Strategy Teams and R&D Heads
Procurement and Product Directors
Regulatory and Compliance Leaders
Investor Relations and Equity Analysts