Market Minds Advisory
Flowback Tank Market

Flowback Tank Market: Produced Water Rules Reshape Rental Fleet Economics

Rising well completion intensity across shale basins and tightening produced water disposal rules are pushing operators toward larger frac tank rental fleets, while recycling mandates create new demand for tanks built for extended on-site storage.

Lead Analyst

David Horsley

Published

September 2026

Make Smarter Decisions with Customized Research Insights

Request a free sample report and evaluate market opportunities, growth trends, and competitive dynamics relevant to your business needs.

2025 MARKET VALUE$1.9BMarket Size 2025
2036 FORECAST VALUE$3.7BBase Case , 2026 to 2036
CAGR 2026 TO 20366.4 %Bull 7.7% / Bear 5.1%
INCREMENTAL OPPORTUNITY$1.7BNet 10- year value creation
EXPANSION MULTIPLE1.86x2036 value over 2026 base
Strategic Levers
M&A Pipeline
Regional Outlook
Country Rankings
Competitive Intelligence
Segmental Deep-dive
Call-Us : 91 93563 13602

Executive Snapshot and Market Trajectory

Produced water disposal is becoming the binding constraint on completion schedules across major shale basins, forcing operators to size their flowback tank rental fleet around disposal logistics rather than around drilling pace alone, a reversal from how fleet planning worked barely five years ago across most active basins.
Modular collapsible tanks are pulling ahead of every other category as operators favor equipment that mobilises faster between pad sites and reduces trucking dependency on congested rural roads near active basins with increasingly dense pad development. North America still concentrates the bulk of commercial volume given its dense shale completion activity, while Latin America is growing fastest as Argentina's Vaca Muerta formation scales rapidly toward full-field development across an expanding share of its acreage.
Competition splits between large multi-region rental fleet operators with inventory spanning many basins simultaneously, and numerous regional specialists defending basin-specific logistics relationships built over years of accumulated trust. Tightening state-level produced water disposal and recycling requirements, combined with rising well completion intensity per pad, are raising the operational bar competitors without deep fleet scale increasingly struggle to clear at the pace regulators and operators now both expect.
Market Definition
The flowback tank market covers bolted steel, welded steel, fiberglass, polyethylene, modular collapsible, and vacuum roll-off tanks sold or rented for temporary storage of flowback and produced water during oil and gas well completion, workover, and production operations. It excludes permanent disposal well infrastructure, pipeline gathering systems, and tanks used exclusively for fresh water supply prior to completion.
Base Year Value
$1.9B in 2025 (MMA Primary Research Dataset, August 2026)
Forecast Period
2026 to 2036, eleven discrete annual values
CAGR
6.4% base case. Bull 7.7%. Bear 5.1%.
Fastest Growth Segment
Modular Collapsible Tanks: 9.8% CAGR
Fastest Growth Country
Argentina: 9.2% CAGR
Fastest Growth Region
South Asia and Pacific: 8.4% CAGR
Largest Region
North America: 30% of 2025 global value
Market Leaders
United Rentals Fluid Solutions, Newpark Resources Inc., Rain for Rent, Adler Tank Rentals, Modutank Inc. Source: MMA Analysis based on company annual reports and investor filings.
Primary Survey
n=3,800 procurement and R&D decision-makers, Q4 2025, six countries
Methodology
Demand-side build-up, cross-validated against public data, 47 expert interviews

Flowback Tank Market Forecast Scenarios

flowback-tank-market-size-forecast-scenario-1787332675522
Growth from 2020 to 2025 compounded near 5.4%, held back early by the 2020 completion activity collapse that idled much of the rental fleet across North American basins for the better part of a year, then accelerated as completion activity rebounded and produced water volume per well climbed steadily entering the back half of the five-year period tracked in this analysis.
Three mechanisms carry the base case to 6.4%. First, tightening state-level produced water disposal and recycling requirements, which extend the on-site storage window operators must plan for well ahead of each completion campaign. Second, rising well completion intensity per pad, which increases produced water volume generated at each individual site. Third, expanding unconventional development across Latin American and Middle Eastern shale and tight formations, which extends rental fleet demand well beyond its traditional North American base.
The bull case at 7.7% assumes produced water regulation tightens faster than current state rulemaking timelines suggest and Vaca Muerta development accelerates well beyond current projections and investment plans. The bear case at 5.1% assumes completion activity slows under sustained commodity price pressure and operators defer non-critical storage capacity investment across several major basins simultaneously and for an extended period.

Disposal Logistics Becomes the Fleet Sizing Constraint

Three forces converge on this market simultaneously. Produced water volume per completed well keeps climbing as lateral lengths extend and frac intensity rises across major shale basins, pushing operators to secure more on-site storage capacity per pad than they budgeted for even two years ago. State-level regulators are tightening disposal well permitting and encouraging recycling, extending the window tanks must remain on site. Latin American and Middle Eastern unconventional development is op
MARKET CONCENTRATIONCR5 32%Reflects fragmentation across regional rental fleet operators nationwide
AVERAGE RENTAL RATEUSD 550-1,800 per monthVaries substantially by tank capacity and basin location
TOP FLEET COUNTRY SHAREUnited States 38%Reflects concentrated shale completion activity and rental infrastructure base
FLEET UTILISATION RATE71%Reflects cyclical completion activity against expanding regional rental fleets
RENTAL VERSUS PURCHASE SHARE68%Share of tank capacity secured through rental rather than purchase
INPUT COST SHARE44%Steel plate, coatings, and fabrication labor combined together substantially
Commercially, the market splits between large multi-region rental fleet operators offering broad tank inventories across many basins simultaneously, and regional specialists defending basin-specific logistics and trucking relationships built over many years. Large operators capture more value through fleet utilisation optimisation across basins, while regional specialists compete primarily on local trucking cost and logistics responsiveness that outside competitors cannot easily match.
Looking ahead, tightening produced water regulation, rising completion intensity per pad, and Latin American unconventional field development will shape which operators capture the fastest-growing rental demand pools over the coming decade, rewarding those who invested early in both fleet scale and basin-specific logistics depth.
"A frac tank used to be a commodity you rented by the day. Now operators plan entire completion schedules around whether enough tanks can even reach the pad in time."
Director, Energy and Oilfield Services Practice · MMA Energy - Oilfield Water Ma

Market Trends

State Produced Water Rules Extend Required Storage Windows

Texas, New Mexico, and Oklahoma regulators have all tightened produced water disposal permitting over the past several years, citing induced seismicity concerns tied to high-volume injection near fault zones, which is pushing operators to hold flowback and produced water on site considerably longer while awaiting disposal capacity or recycling logistics to clear. Operators that previously turned tanks over within days now routinely hold capacity on site for several weeks per pad, increasing the number of tanks each crew requires. Fleet operators with the largest inventories capture premium rates during peak season as smaller rivals run short.
Market Impact: Produced water volume rose 60%
Water Recycling Mandates Reshape Tank Specification Requirements

Several major basins now see completion crews recycling a majority of produced water directly into subsequent fracturing jobs rather than trucking it to disposal wells, a shift driven partly by regulation and partly by the rising cost of long-haul disposal trucking itself. This recycling-first approach requires tanks engineered for longer dwell times and compatible with on-site treatment equipment, favoring corrosion-resistant polyethylene and fiberglass construction over standard bolted steel in treatment-adjacent applications. Manufacturers offering tanks validated for direct treatment train integration are winning fleet contracts that standard storage-only tank suppliers increasingly cannot match on specification.
Market Impact: Vaca Muerta rig count grew 40%

Market Opportunities and Growth Drivers

Rising Completion Intensity Increases Produced Water Volume

Average lateral lengths and proppant loading per well have both climbed steadily across major shale basins as operators pursue more productive wells from fewer surface locations, and that same intensity increase drives proportionally higher produced water volume per completed well that must be stored, treated, or trucked away before drilling can proceed at the next pad. Basins running the longest laterals now generate volumes requiring roughly twice the tank fleet a decade ago for a comparable well count. Fleet operators sizing inventory around current intensity rather than historical averages capture better utilisation and avoid costly shortfalls.
Market Impact: Steel plate costs rose 25%

Latin American Shale Development Opens New Regional Demand

Argentina's Vaca Muerta formation is scaling toward full-field development with pipeline and export infrastructure now largely in place, pulling in rental fleet operators who previously served only North American basins to establish dedicated regional operations. Local produced water regulation across Argentine provinces increasingly mirrors the disposal and recycling requirements already standard in Texas and New Mexico, creating comparable tank specification requirements across both regions simultaneously. Fleet operators establishing Argentine logistics and trucking relationships early are winning multi-year operator contracts before competitors relying on imported equipment can match local response times.
Market Impact: Utilisation swings 25 points across

Market Restraints and Challenges

Steel Plate Cost Inflation Squeezes Fleet Replacement Margin

Steel plate pricing has risen considerably faster than general industrial inflation across recent years, squeezing margin on fleet replacement and expansion programmes that operators budgeted years in advance under different cost assumptions. The root cause is direct exposure to global steel markets that regional tank fabricators cannot meaningfully influence through their own purchasing scale alone. The commercial impact falls hardest on smaller regional fleet operators lacking volume to negotiate favorable long-term supply terms. Several operators now extend fleet service life through refurbishment rather than new purchase and shift new capacity toward lighter alternatives.
Market Impact: Extends on-site duration by 3 weeks

Completion Activity Cyclicality Strains Fleet Utilisation Planning

Frac tank rental demand swings sharply with commodity price cycles, leaving fleet operators managing significant idle capacity during downturns after expanding inventory to meet peak season demand just months earlier. The root cause traces to completion activity being the most cyclical segment of the entire upstream value chain, far more volatile than drilling activity alone across nearly every basin tracked. The commercial impact includes carrying costs on idle capacity and periodic rate compression during oversupplied periods. Leading operators now diversify fleet deployment across multiple basins and commodity types to smooth utilisation rather than concentrating exposure in one place.
Market Impact: Recycled water exceeds 45% of volum
3 additional market trends, 3 additional growth drivers, and 2 additional restraints and challenges are covered in the full report. Contact sales@marketmindsadvisory.com to access the complete intelligence.

Segment CAGR and Growth Architecture

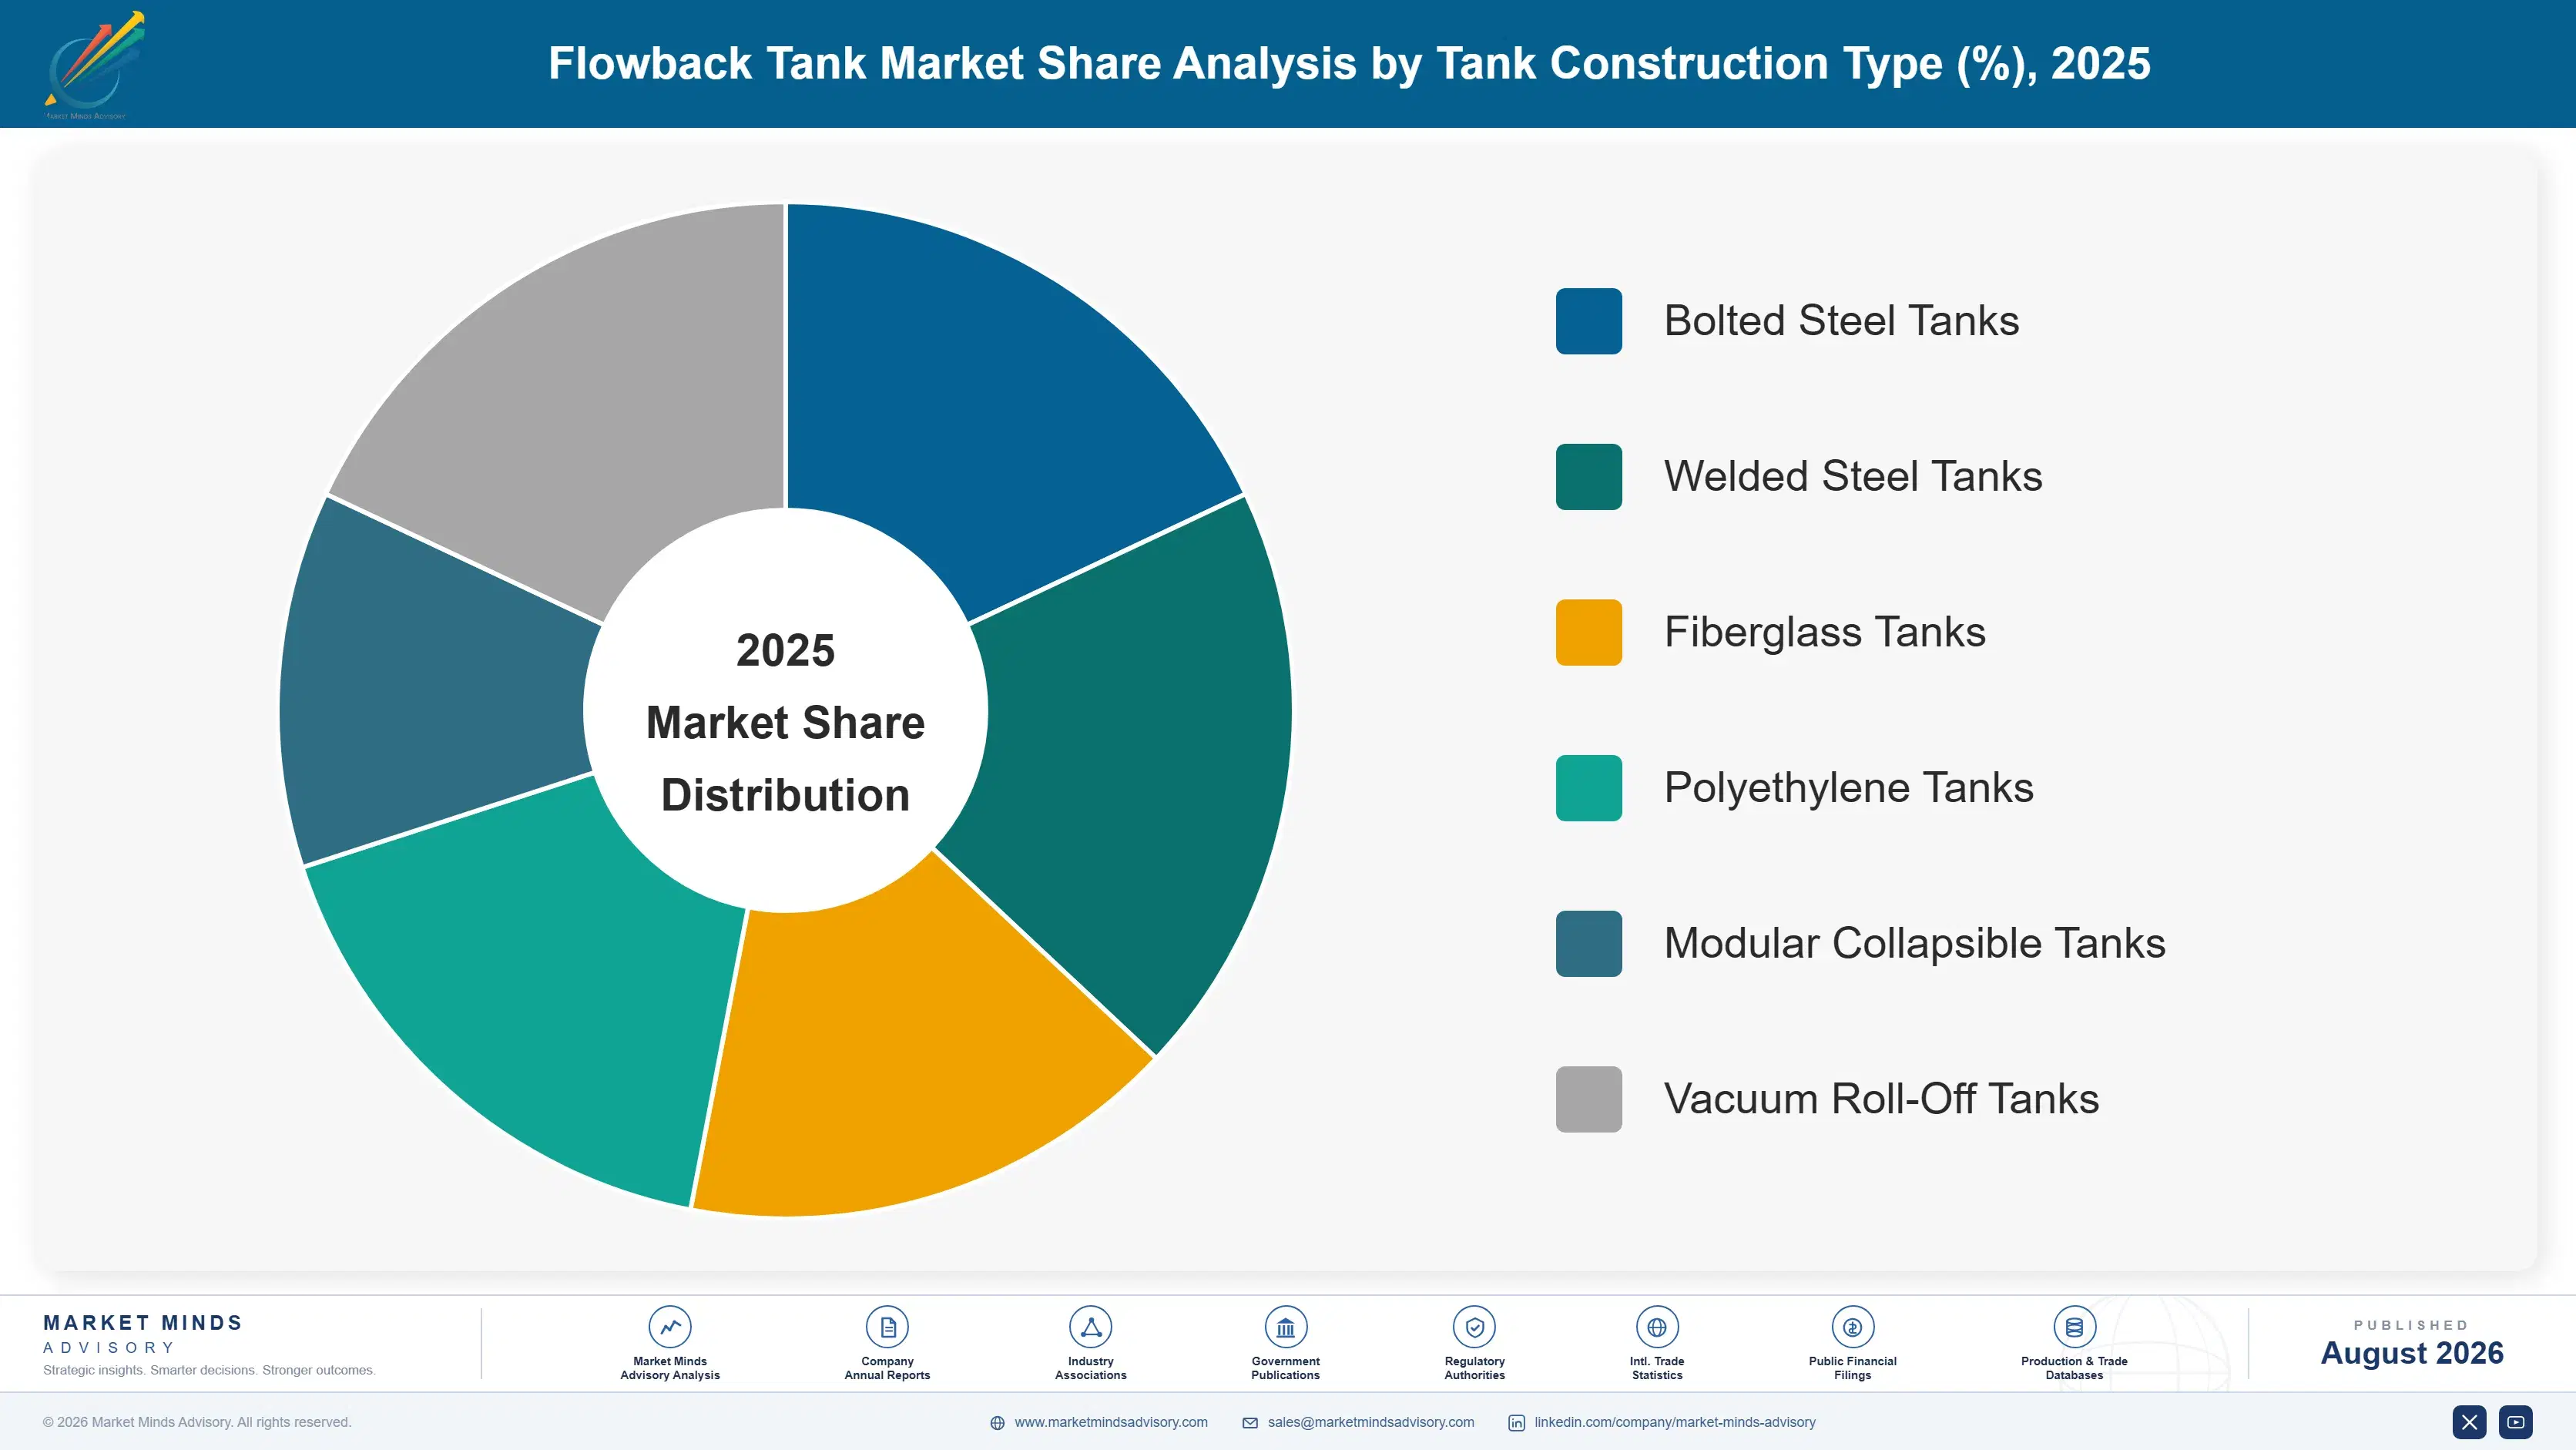
Segmentation follows tank construction and material type rather than end-use application, since a single bolted steel or modular collapsible platform commonly serves completion, workover, and production operations simultaneously across very different basins and operator requirements. This reflects how fleet operators actually organise inventory, maintenance, and rental catalog structure internally across their own regional operations.
flowback-tank-market-market-share-analysis-1787332676051

Modular Collapsible Tanks

Modular collapsible tanks fold flat for transport and assemble on site without heavy crane equipment, most valued where pad access is constrained or rig-up time must be minimised between completion stages. Growth outpaces every other category as operators favor equipment that mobilises faster between pad sites and reduces trucking dependency on congested rural roads near active basins, particularly across the Permian Basin where pad density has increased considerably. Manufacturers with validated rapid-deployment platforms are capturing fleet contracts that standard rigid steel tank suppliers increasingly cannot match on mobilisation speed. Argentina's Vaca Muerta development is adopting this format disproportionately given the region's more limited existing trucking and crane infrastructure relative to established North American basins.
CAGR 9.8%

Polyethylene Tanks

Polyethylene tanks resist corrosion from high-salinity produced water considerably better than standard bolted steel, favored increasingly where extended on-site dwell time under tightening disposal regulation makes corrosion resistance a genuine economic consideration rather than a secondary specification detail. Growth is second-fastest across the segmentation, driven by recycling-first completion strategies that require tanks compatible with on-site treatment train integration over many weeks of continuous use. Lighter weight than steel alternatives also reduces trucking cost per unit moved between pad sites, an advantage that compounds across large fleet deployments. Fleet operators increasingly stock polyethylene tanks specifically for treatment-adjacent applications rather than general storage duty across their broader inventory, a distinction that is becoming standard practice across most major North American basins.
CAGR 8.1%
Full segment breakdown across 6 segments available in the complete report.

Regional Architecture and Country Demand Map

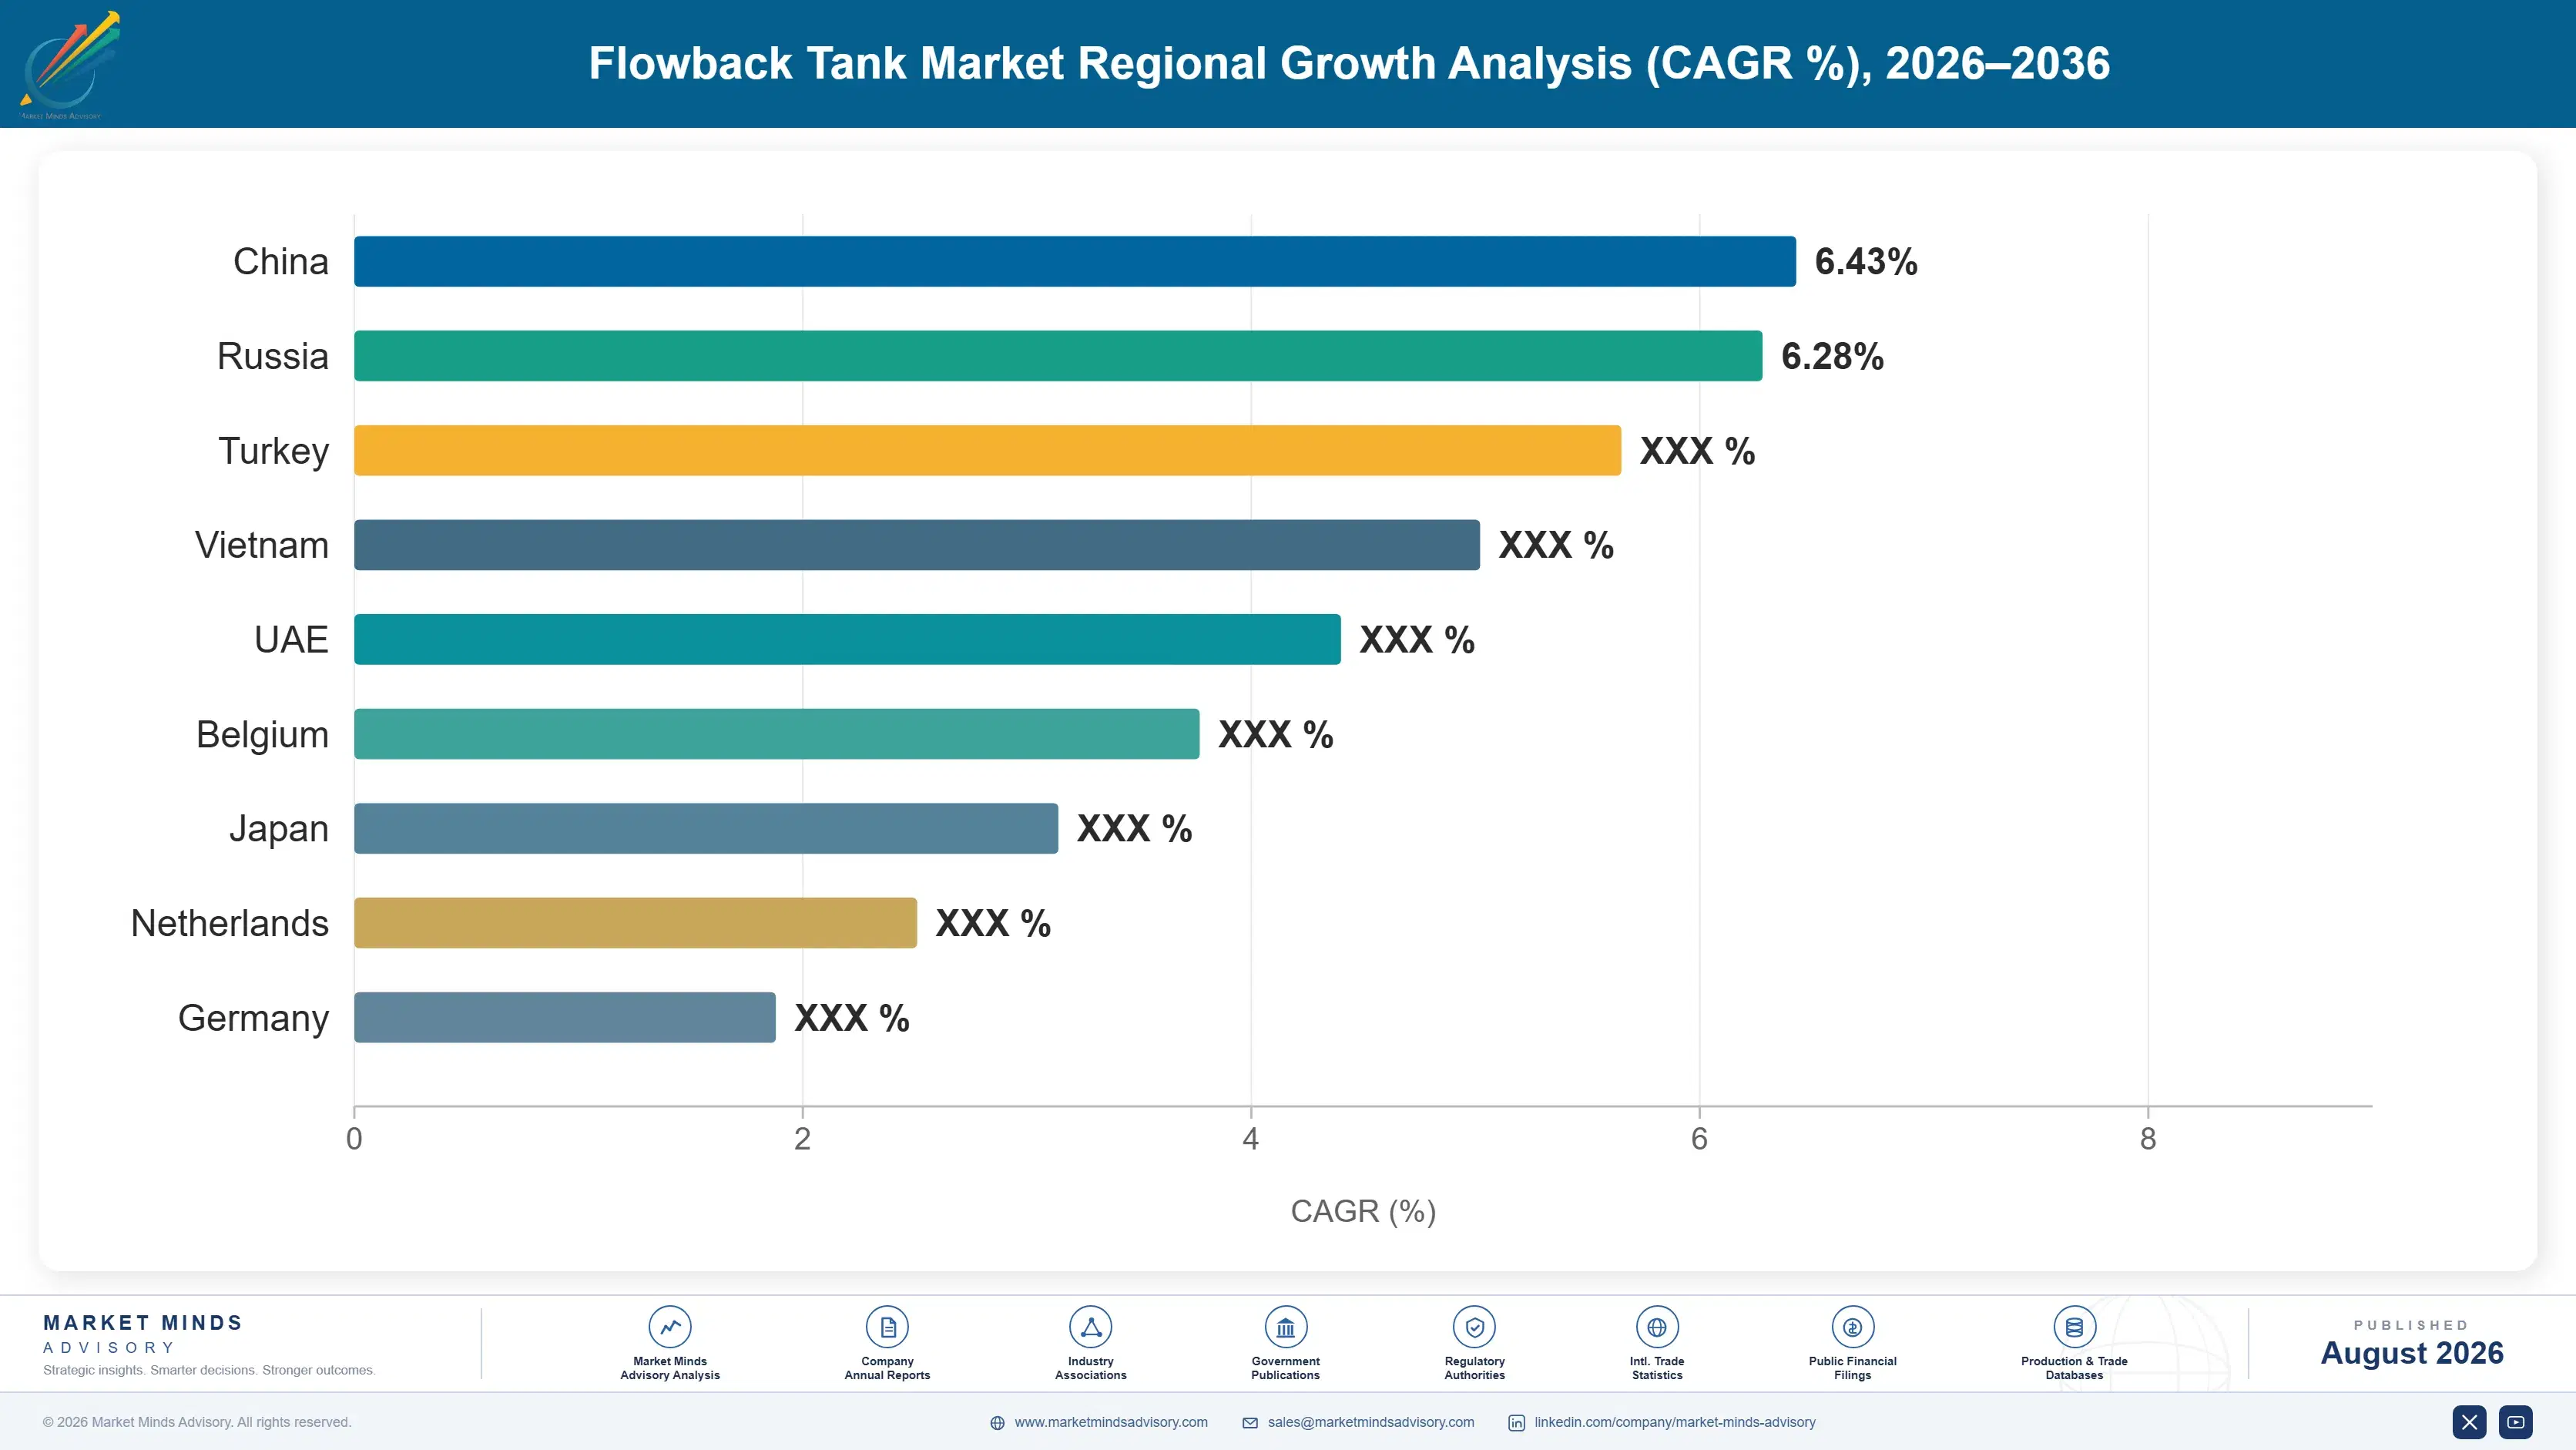
North America holds the largest share given its dense shale completion activity across the Permian, Eagle Ford, and Bakken basins, with East Asia contributing meaningful secondary volume. Latin America is growing fastest as Argentina's Vaca Muerta formation scales toward full-field development across an expanding share of its acreage.

North America

The United States drives the overwhelming majority of regional demand through the Permian Basin's exceptionally dense pad development, where completion crews routinely work multiple wells simultaneously and require correspondingly large on-site tank inventories per location. Texas and New Mexico regulators have both tightened produced water disposal well permitting in recent years, extending the on-site storage window operators must plan fleet capacity around considerably. The Eagle Ford and Bakken basins contribute meaningful secondary volume, though pad density and completion intensity both run below Permian levels. Canada's Montney and Duvernay plays add a modest but steady demand base tied to natural gas-focused completion activity that has picked up alongside rising export infrastructure investment.
Share: 30% | CAGR: 7.4% (2026 to 2036)

Western Europe

Western Europe's demand remains limited by policy because hydraulic fracturing is banned or under extended moratorium across France, Germany, and several other major markets, leaving only conventional well servicing and limited onshore production operations to drive tank rental demand. The United Kingdom maintains a small base tied to legacy North Sea onshore support operations rather than any active unconventional completion activity. Poland briefly pursued shale gas exploration but abandoned commercial development after disappointing well results years ago, removing what had been the region's clearest unconventional demand prospect. This regulatory policy constraint, not weak underlying oilfield activity, explains why regional share sits well below what completion volume elsewhere would suggest is typical.
Share: 6% | CAGR: 4.9% (2026 to 2036)
Regional intelligence for 5 additional markets available in the complete report: East Asia, South Asia and Pacific, Latin America, Middle East and Africa, Eastern Europe. Contact sales@marketmindsadvisory.com.
flowback-tank-market-country-cagr-analysis-1787332676565

Where Fleet Operators Can Capture More Value

Fleet operators sit between cyclical completion demand and tightening produced water regulation, a position that offers several distinct paths to capture more value than a standard day-rate rental provides, particularly as basin-specific logistics depth and specification flexibility gain commercial importance among operators. The four levers below reflect where margin is genuinely shifting across the industry today.

Diversify Fleet Deployment Across Multiple Basins

Operators concentrating fleet deployment in a single basin carry significant utilisation risk when that basin's completion activity slows, while operators diversifying across multiple basins and commodity types smooth utilisation considerably across the completion cycle and capture premium rental rates whenever any single basin enters a localised activity spike. Rain for Rent and similar multi-region operators maintain fleet presence across more than 12 basins simultaneously, redeploying capacity toward whichever region is running hottest that quarter. That structure reduces idle fleet carrying cost meaningfully compared with single-basin operators who cannot redeploy capacity as demand shifts geographically.
Market Impact: Diversified fleets cut idle fleet t

Bundle Water Treatment Services With Tank Rental

Operators pursuing recycling-first completion strategies increasingly prefer fleet operators who bundle on-site water treatment services with tank rental, since that pairing reduces coordination cost considerably compared with sourcing tanks and treatment equipment separately from different vendors during time-sensitive completion operations that leave little room for coordination delays. Fleet operators offering this bundle capture meaningfully higher per-pad revenue, often 20% above tank-only rental contracts, and build stickier operator relationships that survive well beyond a single completion campaign since switching vendors mid-programme would disrupt an established treatment workflow and delay subsequent completion stages.
Market Impact: Captures roughly 20% higher per-pad

Expand Fleet Presence in Latin American Basins

Argentina's Vaca Muerta formation is scaling toward full-field development with pipeline and export infrastructure now largely in place, creating an emerging fleet demand base that established North American operators are only beginning to serve directly through dedicated regional operations. Fleet operators establishing local trucking, maintenance, and regulatory relationships early are winning multi-year operator contracts before competitors relying on imported equipment and remote management can match local response times and pricing. That early-mover position compounds considerably as Vaca Muerta completion activity, already growing near 15% yearly, keeps climbing toward its stated full-field development targets over the coming several years.
Market Impact: Vaca Muerta completion activity gro

Invest in Modular Collapsible Fleet Capacity

Modular collapsible tanks are growing faster than every other category as operators favor equipment that mobilises quickly between pad sites and reduces trucking dependency on congested rural roads near increasingly dense pad development. Fleet operators investing in collapsible capacity now, ahead of broader adoption across basins still relying primarily on rigid steel tanks, are positioning to capture premium rental rates once operators recognise the mobilisation time savings documented across early deployments. Collapsible tanks already mobilise roughly 40% faster than comparable rigid steel units across documented field trials in the Permian Basin.
Market Impact: Collapsible tanks now mobilise roug

Who Controls the Margin Pool

Concentration sits at a moderate 32% for the top five, reflecting a market split between large multi-region rental fleet operators and numerous regional specialists defending basin-specific logistics relationships. The gap between leaders and challengers comes down to fleet scale and multi-basin logistics reach rather than raw tank inventory alone. All participants here are assessed on one basis, annual rental and equipment sales revenue from flowback and produced water storage tanks, excluding
Competition runs along three lines. First, fleet scale and multi-basin logistics reach, since operators with inventory across many basins can redeploy capacity toward whichever region is running hottest. Second, specification flexibility, as recycling-first completion strategies reward operators with treatment-compatible tank options. Third, basin-specific trucking and regulatory relationships, particularly for operators expanding into Latin American and Middle Eastern markets.

Pressure is building from two directions. Regional specialists in Argentina and Saudi Arabia are scaling quickly, squeezing the first-mover advantage established North American operators expected to carry into these newer markets. Meanwhile larger operators keep acquiring regional fleet operators to fill basin-specific gaps rather than build organically, consolidating the field further. Rankings should favor operators combining scale with genuine local logistics depth.
flowback-tank-market-company-positioning-matrix-1787332677083

Competitive Moat and Risk Dimensions

UNITED RENTALS FLUID SOLUTIONS

Moat: Largest multi-basin fleet scale

United Rentals Fluid Solutions operates one of the largest tank rental fleets across North American basins, giving it durable utilisation advantages competitors with smaller regional fleets struggle to replicate quickly during peak completion season. Its parent company's broader equipment rental infrastructure provides logistics and maintenance scale new entrants would need years to build from nothing.
UNITED RENTALS FLUID SOLUTIONS

Risk: Heavy North American concentration

United Rentals Fluid Solutions remains heavily concentrated in North American basins, leaving it more exposed than diversified competitors to any prolonged downturn in United States or Canadian completion activity, since its international presence remains considerably less developed than its domestic fleet scale and logistics infrastructure built over decades.
NEWPARK RESOURCES INC.

Moat: Integrated fluid systems expertise

Newpark's broader fluid systems and water management expertise lets it bundle tank rental with treatment and engineering services that narrower tank-only competitors cannot offer, capturing higher per-pad revenue across operators pursuing recycling-first completion strategies increasingly common across major basins and their tightening regulatory environments and disposal cost pressures.
NEWPARK RESOURCES INC.

Risk: Commodity price cycle exposure

Newpark's fluid systems revenue tracks completion activity closely, leaving it exposed to the same sharp commodity price cyclicality that periodically strains utilisation across the broader rental fleet industry, with limited ability to fully offset downturns through other business lines during extended periods of sustained industry weakness.

Players Tracked

Prominent Players

United Rentals Fluid Solutions
Newpark Resources Inc.
Rain for Rent
Adler Tank Rentals
Modutank Inc.

Other Key Players

Vince Hagan Company
Advanced Containment Systems Inc.
Western Environmental Liner
Highland Tank and Manufacturing Co.
McClain Tank and Trailer
Wichita Tank Manufacturing
Basin Tank Manufacturing
PDQ Manufacturing Inc.
Snyder Industries Inc.
Tank Holding Corp.
Enviro Vault Inc.
National Tank Outlet
Rentco Trailer and Storage Containers
Frac Shack Inc.
Solaris Oilfield Infrastructure Inc.

Recent Developments

JANUARY 2025

United Rentals Fluid Solutions expands Permian Basin tank fleet capacity

United Rentals Fluid Solutions added significant new tank rental capacity across its Permian Basin operations to meet rising demand from increasingly dense pad development and longer on-site storage windows. This was an organic fleet expansion rather than an acquisition, extending existing regional inventory to meet documented demand.
Signal: Fleet operators are expanding Permian capa
AUGUST 2024

Newpark Resources acquires regional water treatment services provider

Newpark Resources acquired a regional water treatment services provider to strengthen its bundled tank rental and treatment offering for operators pursuing recycling-first completion strategies across several key basins. This was a confirmed acquisition, extending Newpark's treatment capability directly into new geographic markets and operator relationships.
Signal: Fluid systems providers are acquiring trea
APRIL 2025

Rain for Rent signs multi-year fleet agreement across Vaca Muerta basin

Rain for Rent signed a multi-year fleet supply agreement covering tank rental across several Vaca Muerta operator sites as part of the formation's continuing full-field development programme. This was a confirmed supply agreement rather than an acquisition, extending Rain for Rent's Latin American presence directly.
Signal: Fleet supply agreements are increasingly t

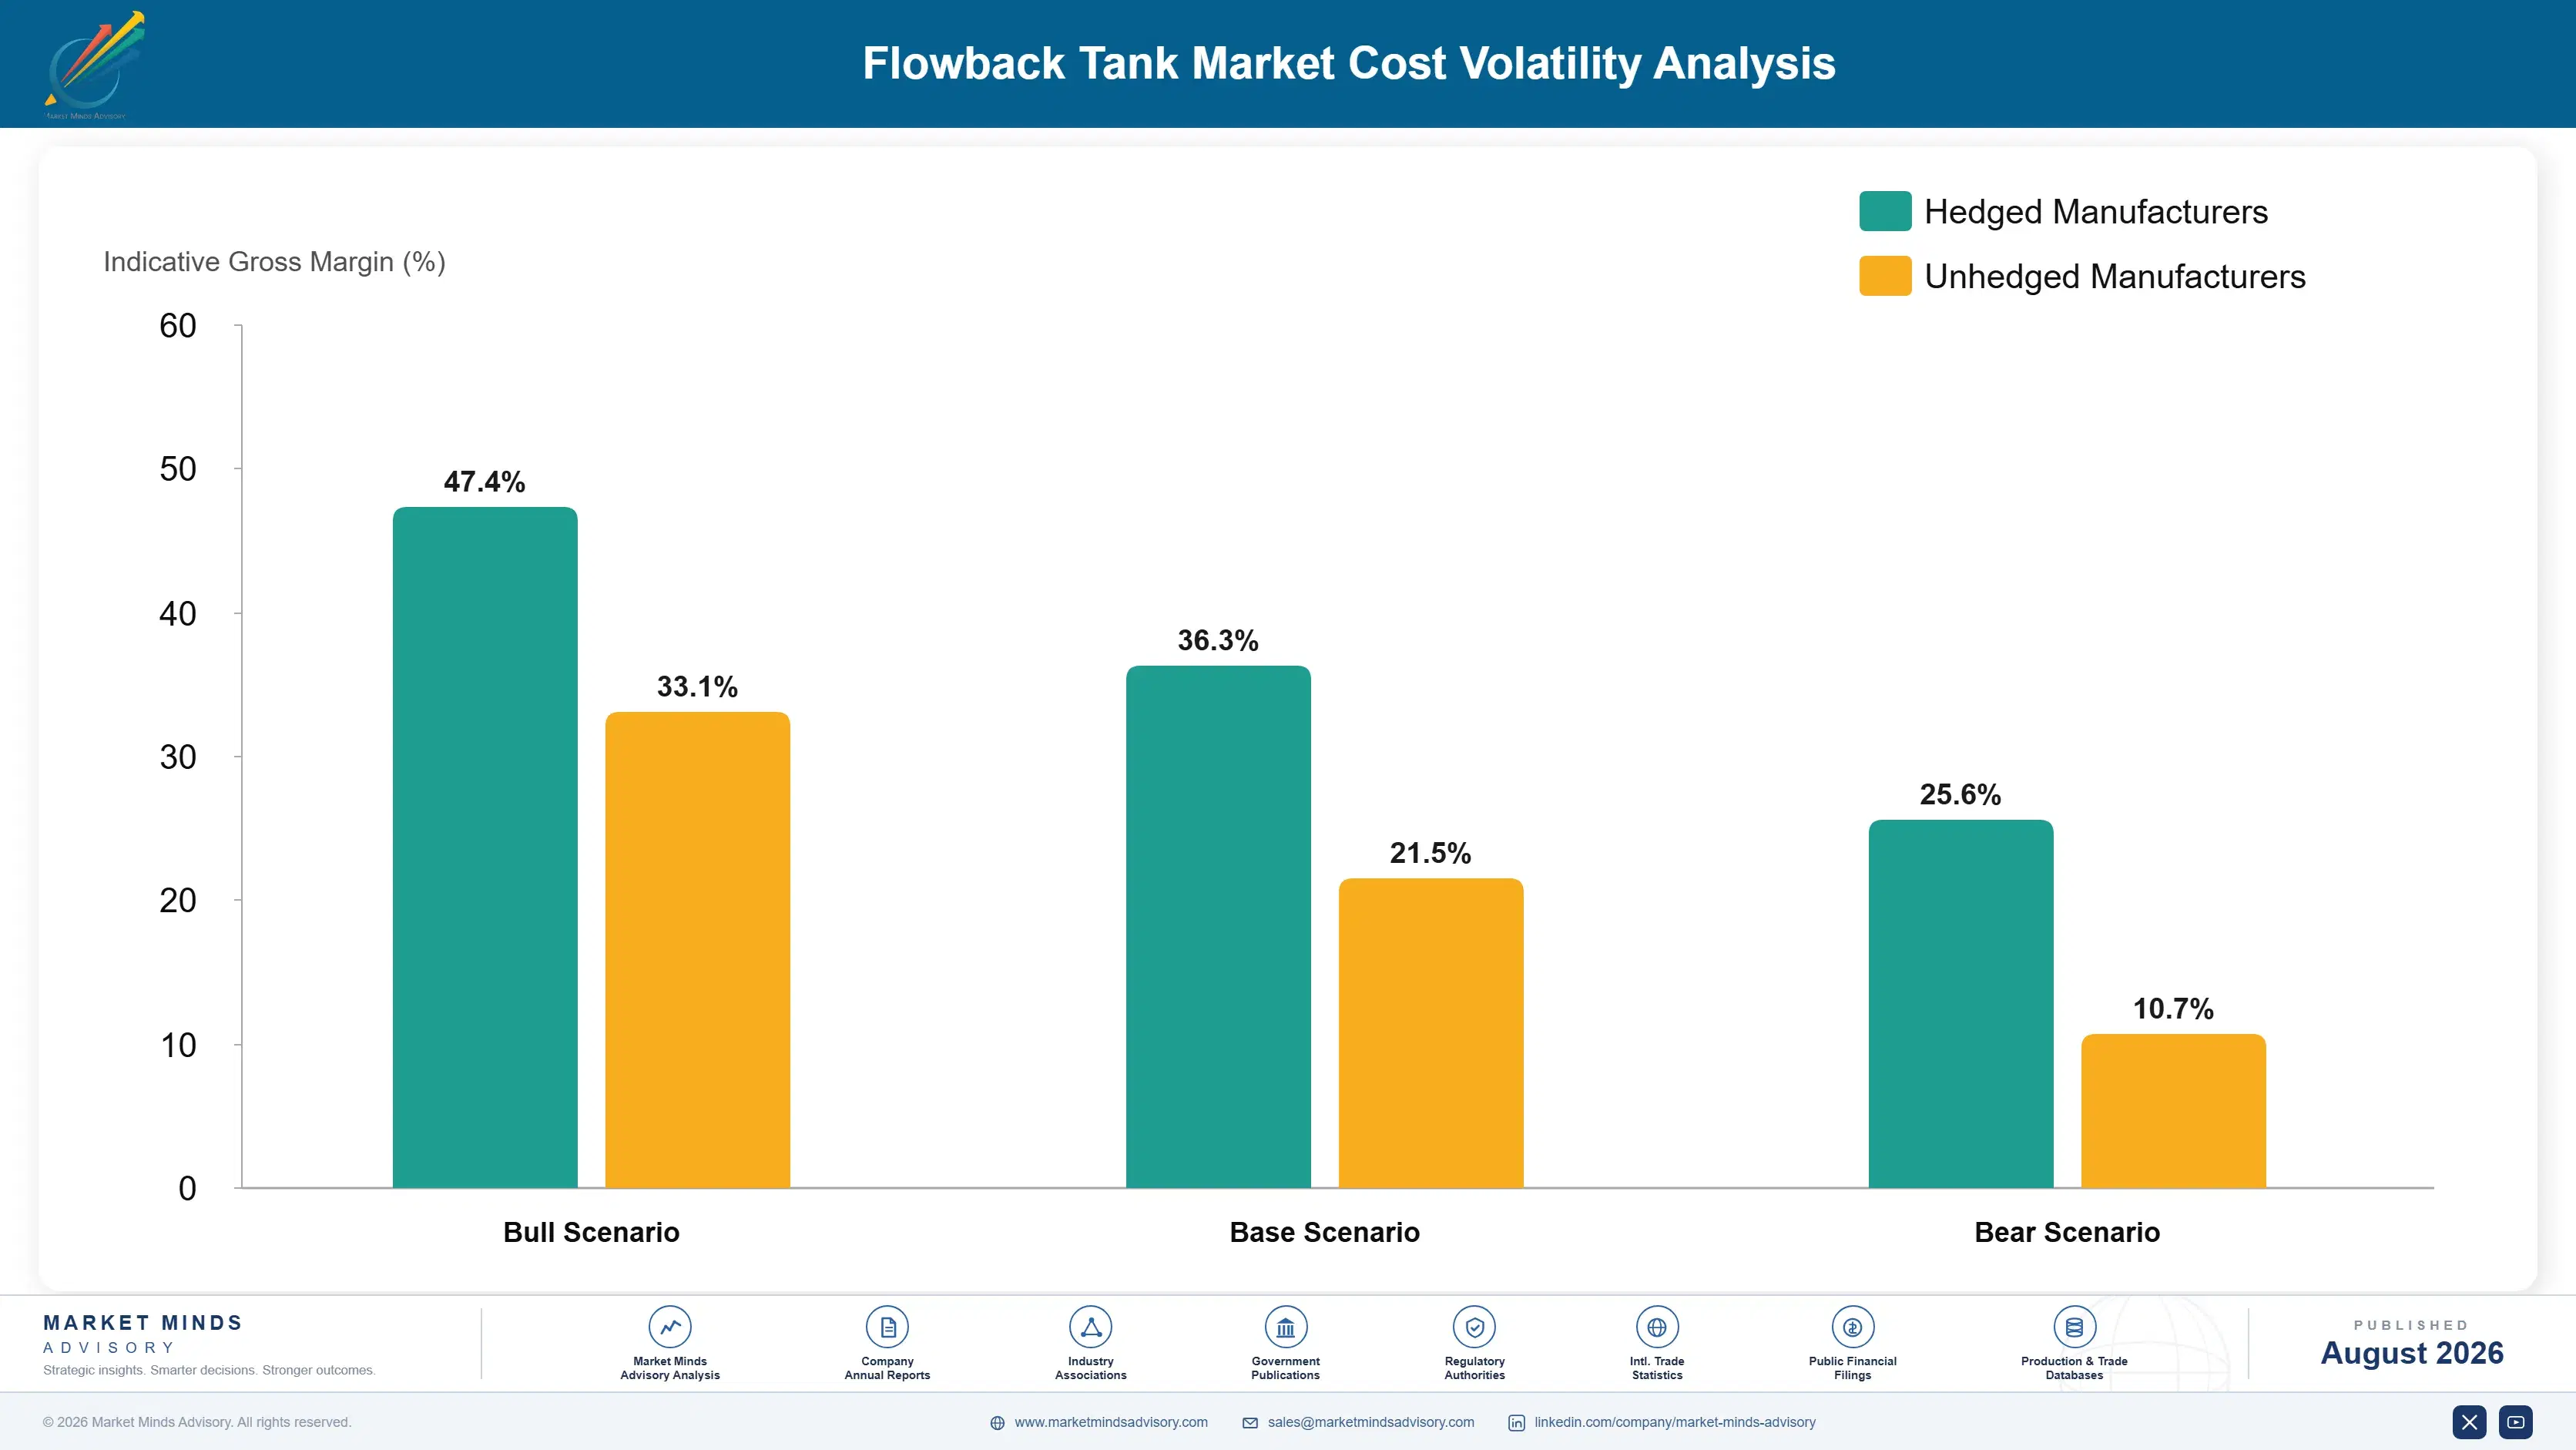
Steel Plate and Fabrication Labor Exposure

Steel plate, protective coatings, and fabrication labor together make up roughly 44% of tank cost of goods sold, with steel plate sourced through global commodity markets tank fabricators cannot meaningfully influence, and fabrication labor sourced primarily from regional welding and manufacturing trades facing their own persistent skilled worker shortages nationwide that have worsened considerably in recent years.
Steel plate prices rose considerably through 2024, with EIA and broader commodity market data showing sustained upward pressure tied to tariff policy and global infrastructure demand competing directly with tank fabricators for available plate steel supply across every major producing region. Several fleet operators absorbed a meaningful share of the cost increase rather than risk losing fixed-price fleet expansion contracts already under signed agreement before the volatility began that quarter.

Larger multi-region fleet operators with greater purchasing scale negotiate more favorable steel plate pricing than smaller regional fabricators, who typically lack comparable volume leverage with upstream steel suppliers across most commodity markets. That gap widens further for fabricators dependent on a small number of regional steel service centers, since switching suppliers requires renewed quality qualification that can take several months to complete fully.
flowback-tank-market-cost-volatility-analysis-1787332677277

Negotiate Multi-Year Steel-Indexed Supply Contracts

Operators negotiating multi-year steel supply contracts with indexed pricing formulas protect fleet expansion margin predictability better than those repricing purchases annually, a structure that requires accepting somewhat higher baseline pricing in exchange for materially reduced volatility exposure across the contract term. Larger operators negotiate these terms considerably more favorably than smaller regional rivals typically can.

Extend Fleet Service Life Through Refurbishment

Operators extending existing fleet service life through structural refurbishment and recoating rather than new tank purchase reduce steel exposure meaningfully, though refurbishment requires careful structural inspection to confirm safety and capacity standards remain fully met across the tank's extended operating life and its remaining certified service window under applicable regulatory inspection requirements and internal quality protocols.

Shift New Capacity Toward Lighter Alternative Materials

Operators shifting new fleet capacity toward fiberglass and polyethylene tanks in applications where duty cycles allow it reduce steel dependency directly, a structure that requires accepting different capacity and durability tradeoffs but insulates a growing share of the fleet from steel price volatility over time and across successive commodity price cycles going forward for years.

Portfolio Architecture for Margin Defence

The portfolio splits into three tiers with sharply different economics. Standard bolted and welded steel tanks form the volume tier, competing largely on day-rate and delivery logistics with margin set by steel cost and fleet scale. Polyethylene and fiberglass tanks earn considerably more because corrosion resistance and treatment-train compatibility both resist the commoditisation pressure hitting standard steel equipment. Modular collapsible platforms sit differently, priced against mobilisati
The tension runs between winning standard steel tank volume on price and delivery speed, and building polyethylene or collapsible fleet capability that protects margin over the long run. An operator chasing every standard rental tender available eventually gets squeezed as regional competitors undercut aggressively on day-rate, yet building specialty fleet capacity requires capital investment thin-margin standard rentals rarely fund adequately on their own.

High-value pools concentrate where specification flexibility, mobilisation speed, or basin-specific logistics depth limit competition: modular collapsible fleets serving pad-dense basins, polyethylene tanks serving recycling-first completion programmes, and bundled treatment-and-rental relationships spanning multiple completion campaigns. Standard steel tanks sit at the other end, competing almost entirely on day-rate and delivery lead time.

Volume / Commodity-Adjacent Tier

Standard bolted and welded steel tanks for mainstream completion and workover applications, competing largely on day-rate and delivery logistics with thin, scale-dependent margin across most active basins and operator tenders.
Gross Margin: 20-32%

Premium / Certified Tier

Polyethylene and fiberglass tanks with corrosion-resistant, treatment-compatible construction serving recycling-first completion programmes, priced for durability and specification flexibility built over many years of documented field validation and hard-won operator trust.
Gross Margin: 34-50%

Sustainability / Regulatory / Next-Generation Tier

Modular collapsible tanks engineered for rapid mobilisation and reduced trucking footprint across pad-dense basins, priced on logistics value that extends well beyond raw storage capacity and standard equipment economics alone entirely.
Gross Margin: 38-58%
flowback-tank-market-portfolio-architecture-1787332677771

High-value Sub-segments and Strategic Watch-out

Modular Collapsible Tanks

High value and high growth at 9.8%, the fastest category, as operators favor equipment that mobilises quickly between pad sites and reduces trucking dependency across increasingly dense pad development in most active basins today, reshaping fleet investment priorities considerably across the entire completions industry landscape.
Gross Margin: 38-58%

Polyethylene Tanks

High value with strong growth at 8.1%, driven by recycling-first completion strategies that require corrosion-resistant tanks compatible with on-site treatment train integration across extended dwell periods common in most major basins operating under tightening disposal regulation and rising recycling requirements imposed by state regulators today.
Gross Margin: 34-50%

Bolted Steel Tanks

The volume core by fleet count, growing near 5.2% as standard completion and workover applications remain the largest category even as growth concentrates in collapsible and polyethylene formats elsewhere across the broader portfolio and its steadily evolving margin mix over the coming several fiscal years.
Gross Margin: 20-32%

Vacuum Roll-Off Tanks

The strategic watch-out, growing slowest at roughly 3.9% and facing steady commoditisation as short-duration hauling applications become standardised bundled equipment rather than genuinely differentiated purchase decisions across most regional rental fleets reviewed carefully throughout this entire report and its accompanying full ten-year market forecast period.
Gross Margin: 16-26%

Recurring Revenue Through Fleet Rental Cycles

Tank fleet revenue behaves like an annuity layered on top of individual completion campaigns rather than a one-time transaction. Every new well pad, workover project, and recycling programme extends the operator relationship well beyond a single rental period, and fleet operators with validated basin logistics capture repeat business with lower friction than switching to an unproven alternative operator would require.
Adoption depth varies considerably by end-use vertical. Completion operations generate the deepest, most predictable rental demand given their tight coupling to drilling schedules, while workover and production support applications are steadier but smaller in per-event volume. Water recycling programmes sit furthest along the adoption curve in only a handful of leading basins, with broader adoption still constrained by treatment infrastructure investment that many smaller operators have not yet committed to.

A generational shift is underway in operator procurement teams across major basins. Younger completion engineering leadership increasingly treats fleet logistics data and produced water compliance documentation as baseline procurement requirements rather than differentiators, a shift that is compressing the commercial advantage early-adopting operators once held over peers still managing fleet logistics through manual, spreadsheet-driven processes.
flowback-tank-market-end-use-penetration-index-1787332678257

Where Fleet Operators Should Focus Next

These are among the four positions where our research anticipates prominent divergence between winners and laggards over the coming forecast period. Each is grounded in the demand model, the regulatory perimeter, and the announced capacity pipeline.
01 / MULTI-BASIN FLEET DIVERSIFICATION

Geographic spread beats single-basin concentration risk

Operators concentrating fleet deployment in a single basin carry significant utilisation risk when that basin's completion activity slows, while operators diversifying across multiple basins and commodity types smooth utilisation considerably across the completion cycle and capture premium rates whenever any single basin enters a localised activity spike. That structure reduces idle fleet carrying cost meaningfully compared with single-basin operators who cannot redeploy capacity as demand shifts. Operators without comparable geographic reach remain exposed to prolonged regional downturns that diversified competitors weather more comfortably.
02 / TREATMENT SERVICE BUNDLING

Bundled treatment increasingly separates leaders from challengers

Recycling-first completion strategies have made water treatment coordination meaningfully more important, and fleet operators bundling treatment services alongside tank rental now capture higher per-pad revenue than those renting tanks alone. That gap is widening rather than closing as more basins adopt recycling-first approaches under tightening disposal regulation each year. Operators offering this bundle build stickier relationships that survive well beyond a single completion campaign, since switching vendors mid-programme would disrupt an established treatment workflow entirely and delay subsequent completion stages considerably.
03 / LATIN AMERICAN MARKET ENTRY

Early Vaca Muerta presence compounds as development scales

Argentina's Vaca Muerta formation is scaling toward full-field development with pipeline and export infrastructure now largely in place, creating fleet demand that established North American operators are only beginning to serve directly. Operators establishing local trucking and regulatory relationships early are winning multi-year contracts before competitors relying on imported equipment can match local response times and pricing structures. That early position compounds considerably as completion activity keeps climbing toward stated full-field development targets over the coming several years, rewarding operators who moved before the opportunity became widely apparent.
04 / MODULAR FLEET INVESTMENT

Collapsible tank capacity warrants early expansion investment

Modular collapsible tanks are growing faster than every other category as operators favor equipment that mobilises quickly between pad sites and reduces trucking dependency on congested rural roads near increasingly dense pad development. Fleet operators investing in collapsible capacity now, ahead of broader adoption across basins still relying primarily on rigid steel tanks, are positioning to capture premium rates once mobilisation time savings become widely documented. Field trials in the Permian Basin already show collapsible units mobilising considerably faster than comparable rigid steel alternatives across most deployment scenarios tested.

Engagement Snapshot From the Field

A live engagement with an industry participant carrying material or product regulatory and market exposure ahead of a defining policy shift, showing how our research translates into a defensible multi-year portfolio strategy.
MARKET MINDS ADVISORY · CLIENT ENGAGEMENT SUMMARY
Flowback Tank Producer Strategic Portfolio Review and Transition Roadmap 2026·Investment Scenario on Flowback Tank Exposure Evaluation 2025-26
CLIENT PROFILE
A multi-basin completion operator running active programmes across the Permian and Eagle Ford basins engaged MMA while evaluating whether to expand its owned tank fleet or increase reliance on third-party rental capacity ahead of a planned activity ramp. The client reported completing roughly 140 wells annually across both basins, with owned fleet covering under half of peak-season tank demand (client-reported, unverified by MMA).
STRATEGIC CHALLENGE
Leadership needed to decide whether expanding owned fleet capacity would deliver better long-run economics than continuing to lean on third-party rental during peak completion season, while also weighing which approach better insulated the programme against produced water regulation that continued tightening across both basins simultaneously and affected planning assumptions considerably.
MMA APPROACH
MMA benchmarked four qualified fleet strategies against the client's historical completion schedule and produced water volume profile across both basins in detail. We modelled total cost of ownership for owned fleet expansion against continued rental dependency under several activity scenarios. We then assessed regulatory exposure under tightening disposal requirements specifically for each basin.
KEY FINDINGS
  1. Expanding owned fleet to cover 70% of peak demand would reduce total tank cost by roughly 18% over a five-year planning horizon compared with current rental levels.
  2. Three of four modelled scenarios showed rental dependency above 60% exposing the programme to meaningful rate spikes during regional completion surges each year.
  3. Recycling-first treatment integration would reduce produced water trucking cost by an estimated 30% once fully implemented and operational across both basins consistently.
  4. The client's current fleet mix underweighted polyethylene tanks relative to what tightening disposal regulation would likely require within the next three years.
CLIENT PROFILE
A multi-basin completion operator running active programmes across the Permian and Eagle Ford basins engaged MMA while evaluating whether to expand its owned tank fleet or increase reliance on third-party rental capacity ahead of a planned activity ramp. The client reported completing roughly 140 wells annually across both basins, with owned fleet covering under half of peak-season tank demand (client-reported, unverified by MMA).
STRATEGIC CHALLENGE
Leadership needed to decide whether expanding owned fleet capacity would deliver better long-run economics than continuing to lean on third-party rental during peak completion season, while also weighing which approach better insulated the programme against produced water regulation that continued tightening across both basins simultaneously and affected planning assumptions considerably.
MMA APPROACH
MMA benchmarked four qualified fleet strategies against the client's historical completion schedule and produced water volume profile across both basins in detail. We modelled total cost of ownership for owned fleet expansion against continued rental dependency under several activity scenarios. We then assessed regulatory exposure under tightening disposal requirements specifically for each basin.
KEY FINDINGS
  1. Expanding owned fleet to cover 70% of peak demand would reduce total tank cost by roughly 18% over a five-year planning horizon compared with current rental levels.
  2. Three of four modelled scenarios showed rental dependency above 60% exposing the programme to meaningful rate spikes during regional completion surges each year.
  3. Recycling-first treatment integration would reduce produced water trucking cost by an estimated 30% once fully implemented and operational across both basins consistently.
  4. The client's current fleet mix underweighted polyethylene tanks relative to what tightening disposal regulation would likely require within the next three years.
RECOMMENDED STRATEGY
Phase 1: Phase 1 (0 to 6 months): Finalise owned fleet expansion plan and begin phased polyethylene tank procurement across both basins. Phase 2: Phase 2 (6 to 18 months): Deploy expanded owned fleet and integrate on-site treatment capability into standard completion workflow fully. Phase 3: Phase 3 (18 to 30 months): Complete fleet transition and renegotiate remaining rental contracts under the reduced peak-season dependency achieved.
OUTCOME
The client completed owned fleet expansion within the targeted eighteen-month window and reported tank cost savings tracking close to the modelled estimate across both basins. Rental rate exposure during the most recent completion surge also declined measurably under the expanded owned fleet, though full five-year figures were not yet available at the time of reporting (client-reported, unverified by MMA).

Frequently Asked Questions

Foundational context covering the market sizes, CAGR, scope, country, region and competition that inform every finding below. This section is provided to cover basics and most often pre-purchase conversations, answered from the MMA Primary Research Dataset.

What is the current size of the Flowback Tank Market?

The global flowback tank market is valued at USD 1.85 billion in 2025, covering bolted steel, welded steel, fiberglass, polyethylene, modular collapsible, and vacuum roll-off tanks used in well completion and production operations.

How large will the Flowback Tank Market be by 2036?

The market is projected to reach USD 3.66 billion by 2036, roughly 1.86 times its 2026 value of USD 1.97 billion, driven by tightening produced water regulation and rising completion intensity.

What is the CAGR for the Flowback Tank Market 2026 to 2036?

The base case CAGR is 6.4%, with a bull case of 7.7% if produced water regulation tightens faster than expected, and a bear case of 5.1% under slower completion activity.

Which segment is growing fastest?

Modular Collapsible Tanks lead at a 9.8% CAGR, roughly 1.53 times the overall market rate, as operators favor equipment that mobilises quickly between increasingly dense pad locations.

Who are the major companies in the Flowback Tank Market?

United Rentals Fluid Solutions, Newpark Resources Inc., Rain for Rent, Adler Tank Rentals, and Modutank Inc. lead the market, together holding roughly 32% of rental and equipment sales revenue.

Which country is growing fastest?

Argentina leads at a 9.2% CAGR as the Vaca Muerta shale formation scales toward full-field development with pipeline and export infrastructure now largely in place.

Report Segmentation Architecture

The full report scope spans multiple orthogonal segmentation dimensions, with cross-tabulated demand data provided for each dimension pair. Coverage extends further to regional breakdowns, trend trajectories, and the competitive detail needed to support segment-level decision-making.

By Tank Construction Type

  • Bolted Steel Tanks
  • Welded Steel Tanks
  • Fiberglass Tanks
  • Polyethylene Tanks
  • Modular Collapsible Tanks
  • Vacuum Roll-Off Tanks

By End-Use Application

  • Well Completion Operations
  • Workover Operations
  • Production Support
  • Water Recycling and Treatment

By Commercial Dimension

  • Rental Fleet Services
  • Outright Equipment Sales
  • Bundled Treatment Services

By Region

  • North America
  • Western Europe
  • East Asia
  • South Asia and Pacific
  • Latin America
  • Middle East and Africa
  • Eastern Europe

Scope, Methodology, and Coverage

Every figure in this report is reproducible from documented input assumptions. The scope below maps the historical period, the forecast horizon, the segmentation dimensions, and the countries covered, alongside the underlying primary and qualitative methodology.
Historical Period
2020 to 2025
Forecast Period
2026 to 2036
Base Year
2025 (USD billions; MMA Primary Research Dataset, August 2026)
Market Definition
The flowback tank market covers bolted steel, welded steel, fiberglass, polyethylene, modular collapsible, and vacuum roll-off tanks sold or rented for temporary storage of flowback and produced water during oil and gas well completion, workover, and production operations. It excludes permanent disposal well infrastructure, pipeline gathering systems, and tanks used exclusively for fresh water supply prior to completion.
Quantitative Units
USD billions (current prices); tank fleet unit volume where applicable
Segmentation Dimensions
By Tank Construction Type; By End-Use Application; By Commercial Dimension; By Region
Regions Covered
North America, Western Europe, East Asia, South Asia and Pacific, Latin America, Middle East and Africa, Eastern Europe
Countries Covered
USA, China, Germany, France, UK, Japan, South Korea, India, Australia, Canada, Brazil, Mexico, Indonesia, Vietnam, Thailand, Malaysia, UAE, Saudi Arabia, South Africa, Nigeria, Turkey, Poland, Netherlands, Italy, Spain, Sweden, Switzerland, Argentina, Colombia, Singapore, and additional markets relevant to this sector
Key Companies Profiled
United Rentals Fluid Solutions, Newpark Resources Inc., Rain for Rent, Adler Tank Rentals, Modutank Inc., Vince Hagan Company, Advanced Containment Systems Inc., Western Environmental Liner, Highland Tank and Manufacturing Co., McClain Tank and Trailer, Wichita Tank Manufacturing, Basin Tank Manufacturing, PDQ Manufacturing Inc., Snyder Industries Inc., Tank Holding Corp., Enviro Vault Inc., National Tank Outlet, Rentco Trailer and Storage Containers, Frac Shack Inc., Solaris Oilfield Infrastructure Inc.
Quantitative Methodology
Primary survey, n=3,800 respondents, Q4 2025, six countries; demand-side model with trade association cross-validation
Qualitative Methodology
47 expert interviews, Q4 2025; applied to validate demand model assumptions, identify emerging dynamics, and assess competitive positioning
Report Format
PDF and XLSX data workbook (Word format preview document)
Publisher
Market Minds Advisory
Report Code
MMA-2026-ENE-123
Published
August 2026
Contact
sales@marketmindsadvisory.com | www.marketmindsadvisory.com

Purchase the full Flowback Tank Market Report (2026 to 2036).

The full report delivers granular sizing and forecasts across all six tank construction segments and seven global regions through 2036. It profiles twenty companies across multi-region fleet operators and regional specialists, benchmarking fleet scale, logistics reach, and specification flexibility in considerable detail. Analysts detail input cost exposure, portfolio margin tiers, and demand architecture by end-use vertical across major basins worldwide and their respective regulatory environments. Buyers receive both the standalone report and full access to underlying data tables supporting every figure and forecast presented throughout the complete analysis.
Six-segment tank construction sizing and full forecasts
Seven-region global market share breakdown detail
Twenty-company detailed competitive profile benchmarking analysis
Input cost exposure and supplier mitigation analysis
Portfolio margin tier benchmarking economics framework
Anonymised client engagement outcome case study included

Built For The People Who Decide

From boardroom strategy to bench-side execution, this report is read cover-to-cover by leaders shaping the next decade of their industry, turning demand scenarios, market dynamics and valuation benchmarks into decisions.
CXOs/ Presidents/ VPs/ Managers
M&A and Corporate Development
Strategy Teams and R&D Heads
Procurement and Product Directors
Regulatory and Compliance Leaders
Investor Relations and Equity Analysts