Market Minds Advisory
Flow Indicator Market

Flow Indicator Market: The Instrument Automation Keeps Failing To Replace

A technician at a pipe wants to know in one second whether something is moving. Forty years of automation has predicted this instrument would disappear, and forty years of automation has been wrong.

Lead Analyst

David Horsley

Published

September 2026

Make Smarter Decisions with Customized Research Insights

Request a free sample report and evaluate market opportunities, growth trends, and competitive dynamics relevant to your business needs.

2025 MARKET VALUE$0.7BMarket Size 2025
2036 FORECAST VALUE$1.1BBase Case , 2026 to 2036
CAGR 2026 TO 20364.3 %Bull 5.5% / Bear 3.1%
INCREMENTAL OPPORTUNITY$0.4BNet 10- year value creation
EXPANSION MULTIPLE1.52x2036 value over 2026 base
Strategic Levers
M&A Pipeline
Regional Outlook
Country Rankings
Competitive Intelligence
Segmental Deep-dive
Call-Us : 91 93563 13602

Executive Snapshot and Market Trajectory

A flow indicator answers a human question rather than a control one: is anything moving in this pipe, right now, where I am standing. That requirement survives every automation wave. The market reaches USD 0.7 billion in 2025 and grows at 4.3%. Nothing about that requirement is going away.
Digital local display indicators grow fastest at 8.6%, exactly twice the market rate, because a fouled sight glass can show no flow when flow exists and that misreading has consequences in a chemical plant. North America holds 28% of value, Western Europe 25%, and East Asia 24%, an unusually even split. Hazardous area certification now gates 37% of the market before price is discussed at all. Regional weight follows installed plant rather than output.
Concentration runs at 34%, low because a paddle in a window is a specification almost any competent machine shop meets. Competition turns on certification breadth, material compatibility, and distributor shelf position rather than on measurement performance. Distributors carry 62% of volume, which means the specifying engineer often never meets the manufacturer. That gap is where most of the commercial opportunity in this category sits unclaimed. Nobody has claimed it.
Market Definition
The flow indicator market covers devices that give local visual indication of fluid flow in a pipeline, whether presence, direction, or approximate rate, without transmitting a signal for control or custody purposes. It spans sight glass and window indicators, paddle and flapper types, rotary vane and propeller designs, local variable area indicators, and digital local display units. Transmitting flow meters, custody transfer metering, level and pressure instruments, and process control instrumentation are excluded.
Base Year Value
$0.7B in 2025 (MMA Primary Research Dataset, August 2026)
Forecast Period
2026 to 2036, eleven discrete annual values
CAGR
4.3% base case. Bull 5.5%. Bear 3.1%.
Fastest Growth Segment
Digital Local Display Indicators: 8.6% CAGR
Fastest Growth Country
India: 6.9% CAGR
Fastest Growth Region
South Asia and Pacific: 6.3% CAGR
Largest Region
North America: 28% of 2025 global value
Market Leaders
Dwyer Instruments, Kobold Messring, Bürkert, Badger Meter, Krohne. Source: MMA Primary Research Dataset, July 2026.
Primary Survey
n=3,800 procurement and R&D decision-makers, Q4 2025, six countries
Methodology
Demand-side build-up, cross-validated against public data, 47 expert interviews

Flow Indicator Market Forecast Scenarios

flow-indicator-market-size-forecast-scenario-1787333837030
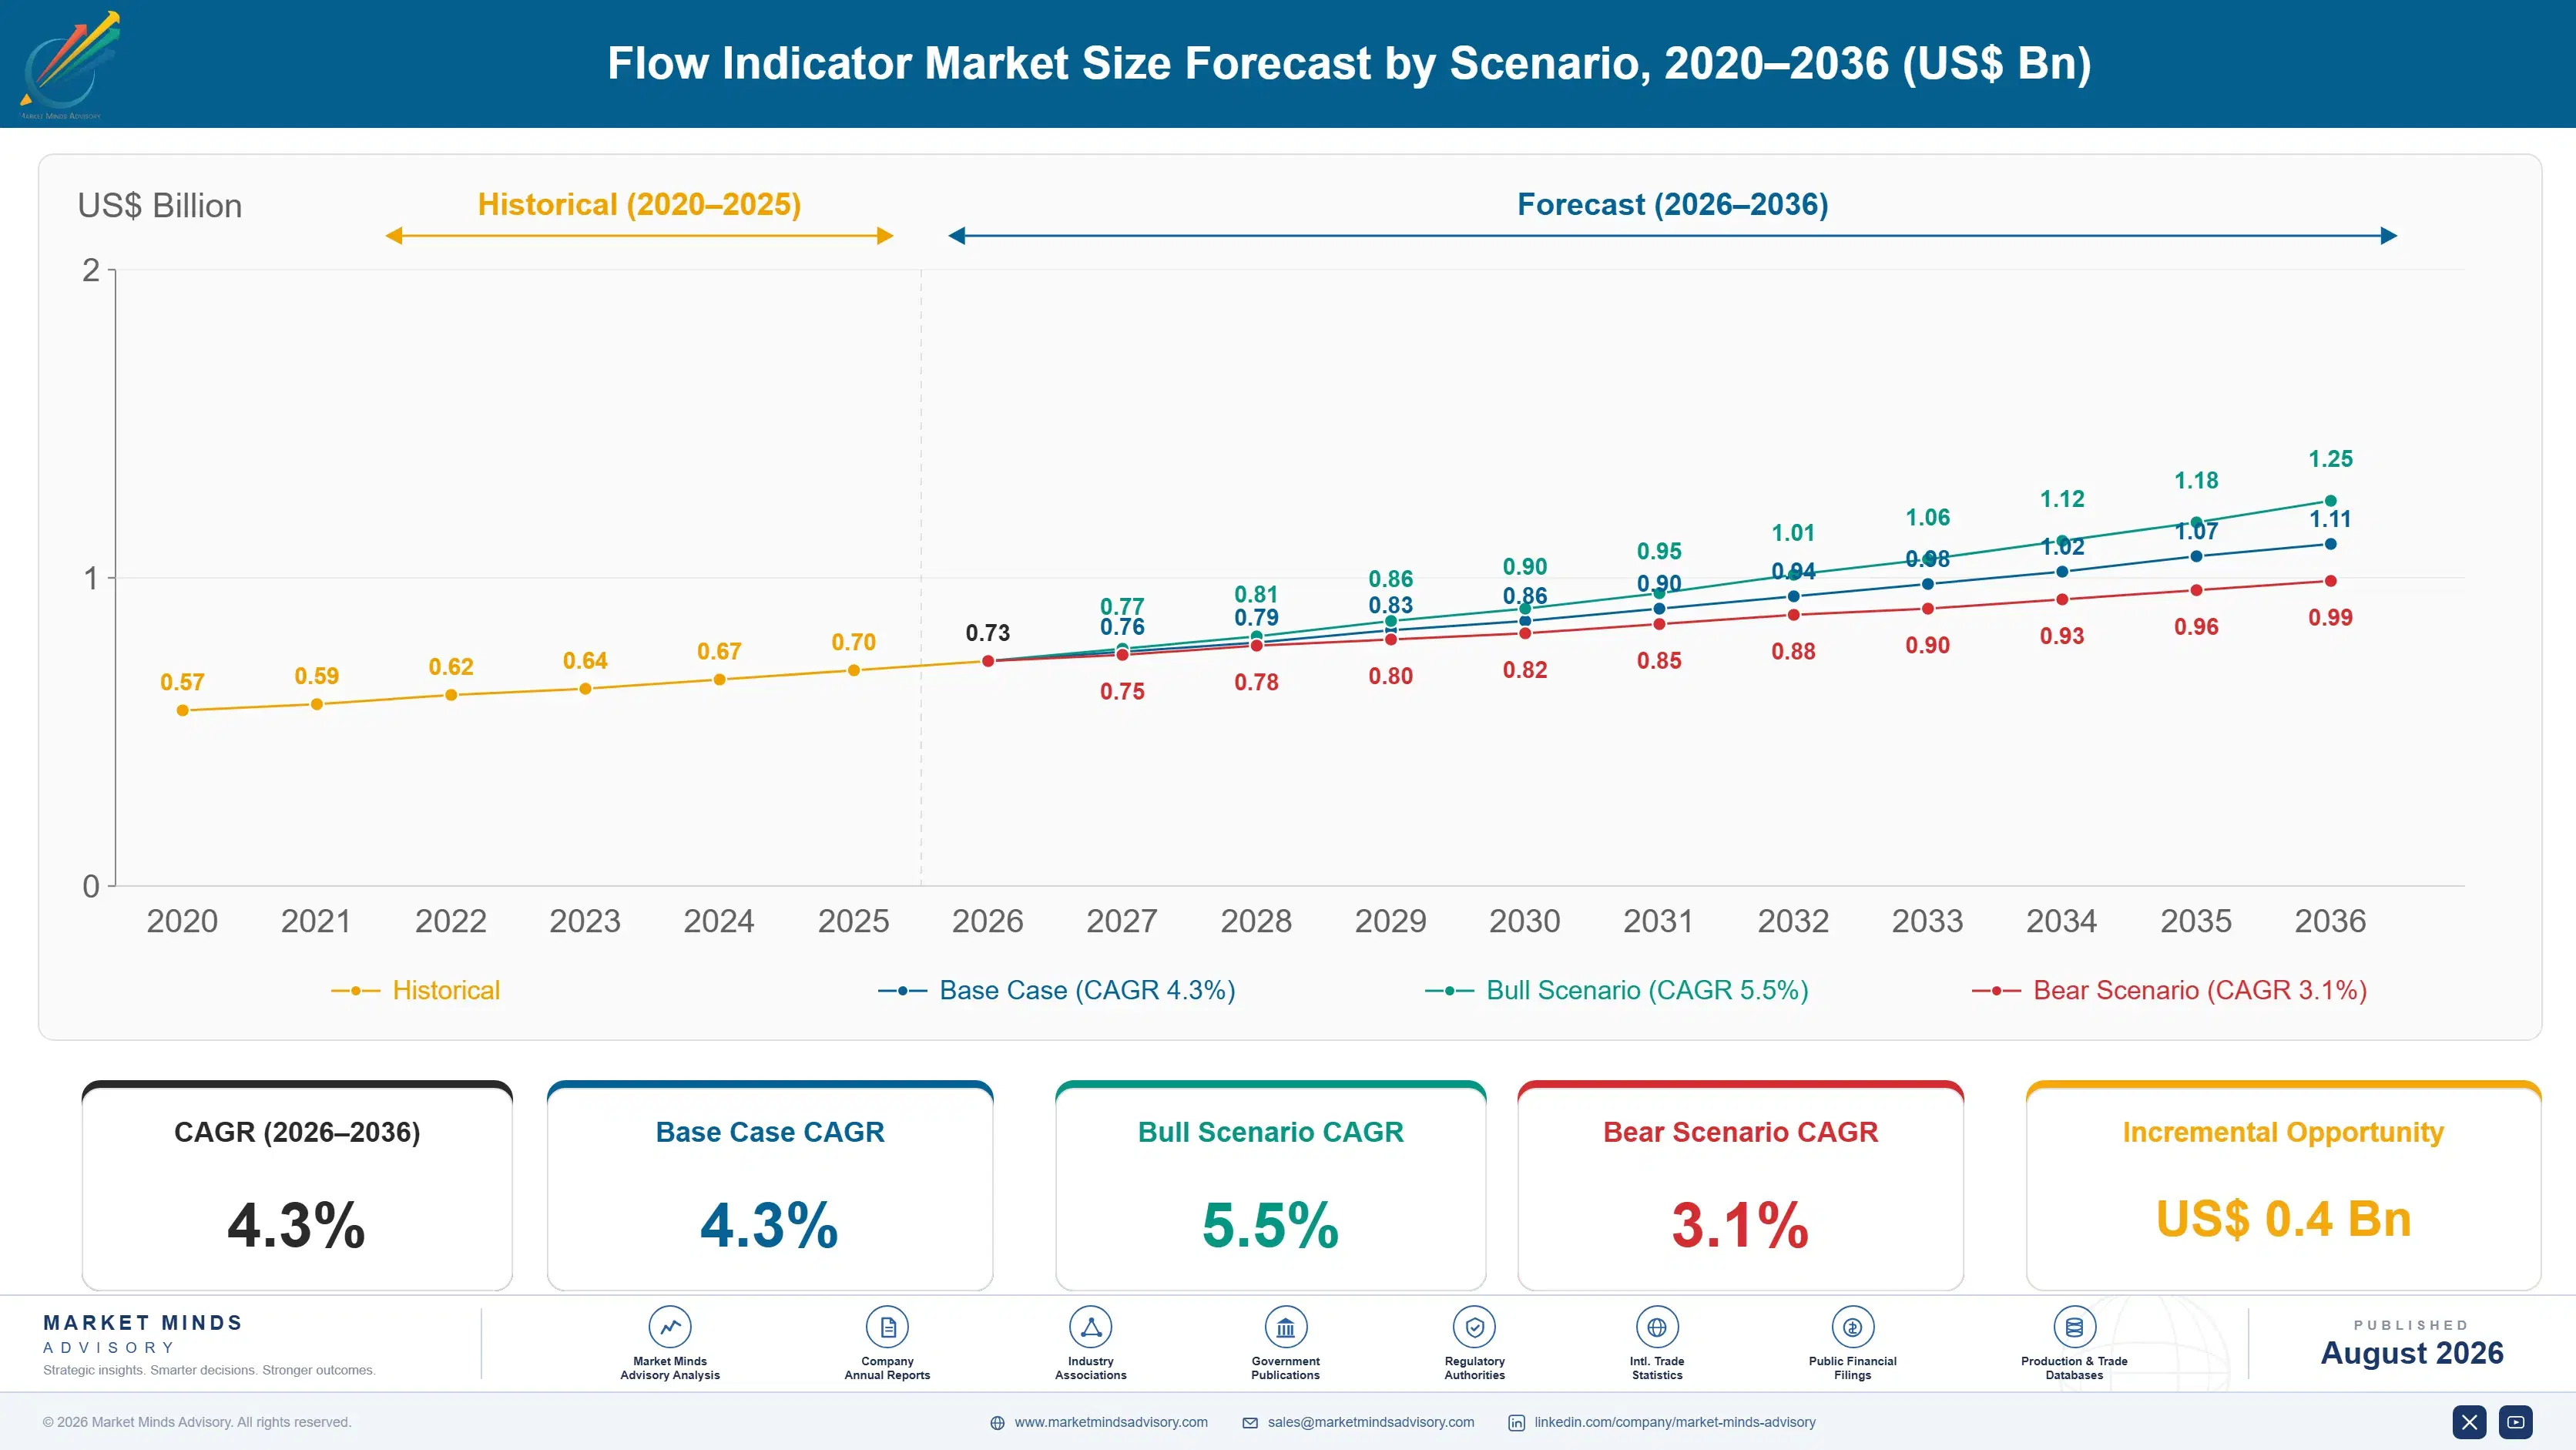
Growth between 2020 and 2025 came from certification and hygiene rather than from volume. Unit shipments were broadly flat across developed markets while the share requiring hazardous area approval or clean-in-place construction rose steadily, taking average selling price up with it. Digital local displays began replacing sight glasses in applications where a misreading is dangerous. A 3.2% historical CAGR is a mix effect carried by a flat installed base.
Three mechanisms carry the 4.3% base case. Hazardous area certification is the largest, since ATEX and IECEx approval is now a procurement gate rather than a feature and uncertified product is not specified into 37% of applications. Hygienic process requirements are the second, as pharmaceutical and food plants need indicators that clean in place and carry documented surface finish. And digital displays keep taking sight glass applications where visual misreading carries real consequence.
The 5.5% bull case turns on process safety guidance treating clouded sight glasses as a recognised hazard, which would convert replacement into a compliance item. The 3.1% bear case is industrial capital deferral, since an indicator is bought with a plant or a line rather than on its own. Neither scenario is about the technology at all.

An Instrument Bought For The Person, Not The Process

This instrument exists for a person, not a process. A technician performing a lockout, a maintenance walkdown, or a hazardous area check wants to look at a pipe and know within a second whether anything is moving. Interrogating a control system takes longer, requires access, and answers a slightly different question. Every automation wave since the 1980s predicted the category would disappear and none has been right.
TOP FIVE CONCENTRATION34%Many regional makers serve a specification almost anybody can meet
AVERAGE SELLING PRICEUSD 340Blended across sight glass, mechanical, and digital indicator types
HAZARDOUS AREA SHARE37%Portion sold into certified explosive atmosphere zones and installations
SERVICE LIFE EXPECTANCY12 to 20 yearsOperating years before an indicator is replaced or refurbished
DISTRIBUTOR CHANNEL SHARE62%Share reaching end users through industrial supply intermediaries
LEADING PRODUCER SHARE29%Manufacturing concentrates where machining and assembly cost least
Certification now decides more than performance does. Hazardous area approval under ATEX or IECEx gates 37% of applications, and an uncertified indicator is not compared on price because it is not compared at all. Hygienic construction with documented surface finish gates most pharmaceutical and food work in the same way. Blended selling price sits at USD 340 and rises steadily as certified share grows.
Distributors move 62% of volume, which puts an intermediary between the manufacturer and the engineer writing the specification. That engineer chooses from what the distributor stocks and lists, so shelf position frequently decides the sale before any product comparison occurs. Manufacturers who understand that spend on distributor listing and training rather than on product literature.
"A clouded sight glass shows no flow when there is flow. Everybody in a plant knows that and nobody has ever costed what it leads to. The day a process safety body writes it down, this quiet little category gets a very loud year."
Senior Analyst, Process Instrumentation Practice · MMA Construction and Industri

Market Trends

Digital Local Displays Replace Sight Glasses Where Misreading Matters

A sight glass fails in the most dangerous way an instrument can: it keeps looking normal. Fouling, clouding, condensation, and product coating all produce a window that shows no movement when the line is flowing, or the reverse, and the operator has no way of knowing which. A digital local display reads a sensor and shows a number that is either present or absent, which removes the ambiguity entirely. Chemical, pharmaceutical, and utility operators are converting on that argument rather than on accuracy, and the segment grows at 8.6% against a market at 4.3%.
Market Impact: Surface finish documented to 0.8 mi
Hazardous Area Certification Became A Procurement Gate

ATEX in Europe and IECEx internationally now function as pass or fail conditions in most process procurement rather than as desirable attributes, and an indicator without the right zone approval never reaches a price comparison. Certification costs a manufacturer testing time, documentation, and an annual audit, which is a fixed burden that falls hardest on smaller regional makers. That has quietly concentrated the certified end of the category while the uncertified end stays fragmented. Roughly 37% of the market now sits behind that gate and the share keeps rising as plants recategorise zones.
Market Impact: Walkdowns required every 30 days

Market Opportunities and Growth Drivers

Hygienic Process Requirements Reshape Material And Finish Specification

A pharmaceutical or food process indicator has to clean in place, carry documented surface roughness, use elastomers with the right regulatory declarations, and survive repeated sterilisation without clouding or crazing. That converts a simple sight fitting into a documented component with a material certificate attached to every unit. Buyers in those industries requalify slowly and pay considerably more, which makes the work valuable to whoever holds the approvals. Manufacturers without hygienic ranges cannot bid at all, and building one takes qualification work rather than a catalogue entry. Nobody builds one of these ranges quickly.
Market Impact: Patents expired over 40 years ago

Plant Walkdown Practice Keeps Local Indication In Specification

Process safety management and mechanical integrity programmes both require physical inspection routes where an operator confirms conditions at the equipment rather than from a screen. A local flow indicator is how that confirmation happens on a pipe, and no amount of instrumentation elsewhere satisfies the requirement. Lockout and tagout procedures work the same way, since an engineer isolating a line wants visual proof it is dead. These are procedural rather than technical requirements, which is exactly why automation has never removed them and shows no sign of doing so now.
Market Impact: Distributors carry 62% of volume

Market Restraints and Challenges

The Product Design Carries Almost No Protectable Content

A paddle in a window with a flanged body is a design that expired from patent protection generations ago, and any competent machine shop with a certification budget can build one that works. The root cause is genuine simplicity rather than any failure of engineering ambition. Commercially it means price competition is permanent in the uncertified brackets and brand carries weight only where approvals or materials create a barrier. Manufacturers are mitigating by concentrating on certified, hygienic, and high-pressure ranges where the documentation rather than the device is what a competitor must replicate.
Market Impact: Digital grows at 8.6% annually

Distributor Intermediation Separates Maker From Specifying Engineer

Around 62% of volume reaches the end user through industrial supply distributors, which means the engineer writing a specification chooses from a stocked list rather than from the market. The root cause is order economics: a three hundred dollar instrument does not justify a direct sales call, so the channel exists for good reason. Commercially it leaves manufacturers competing for listing rather than for application, and losing visibility of why they win or lose. Mitigation runs through distributor training, specification support, and digital selection tools reaching engineers directly. Winning a listing matters more than winning an argument.
Market Impact: Certification gates 37% of applicat
3 additional market trends, 4 additional growth drivers, and 2 additional restraints and challenges are covered in the full report. Contact sales@marketmindsadvisory.com to access the complete intelligence.

Segment CAGR and Growth Architecture

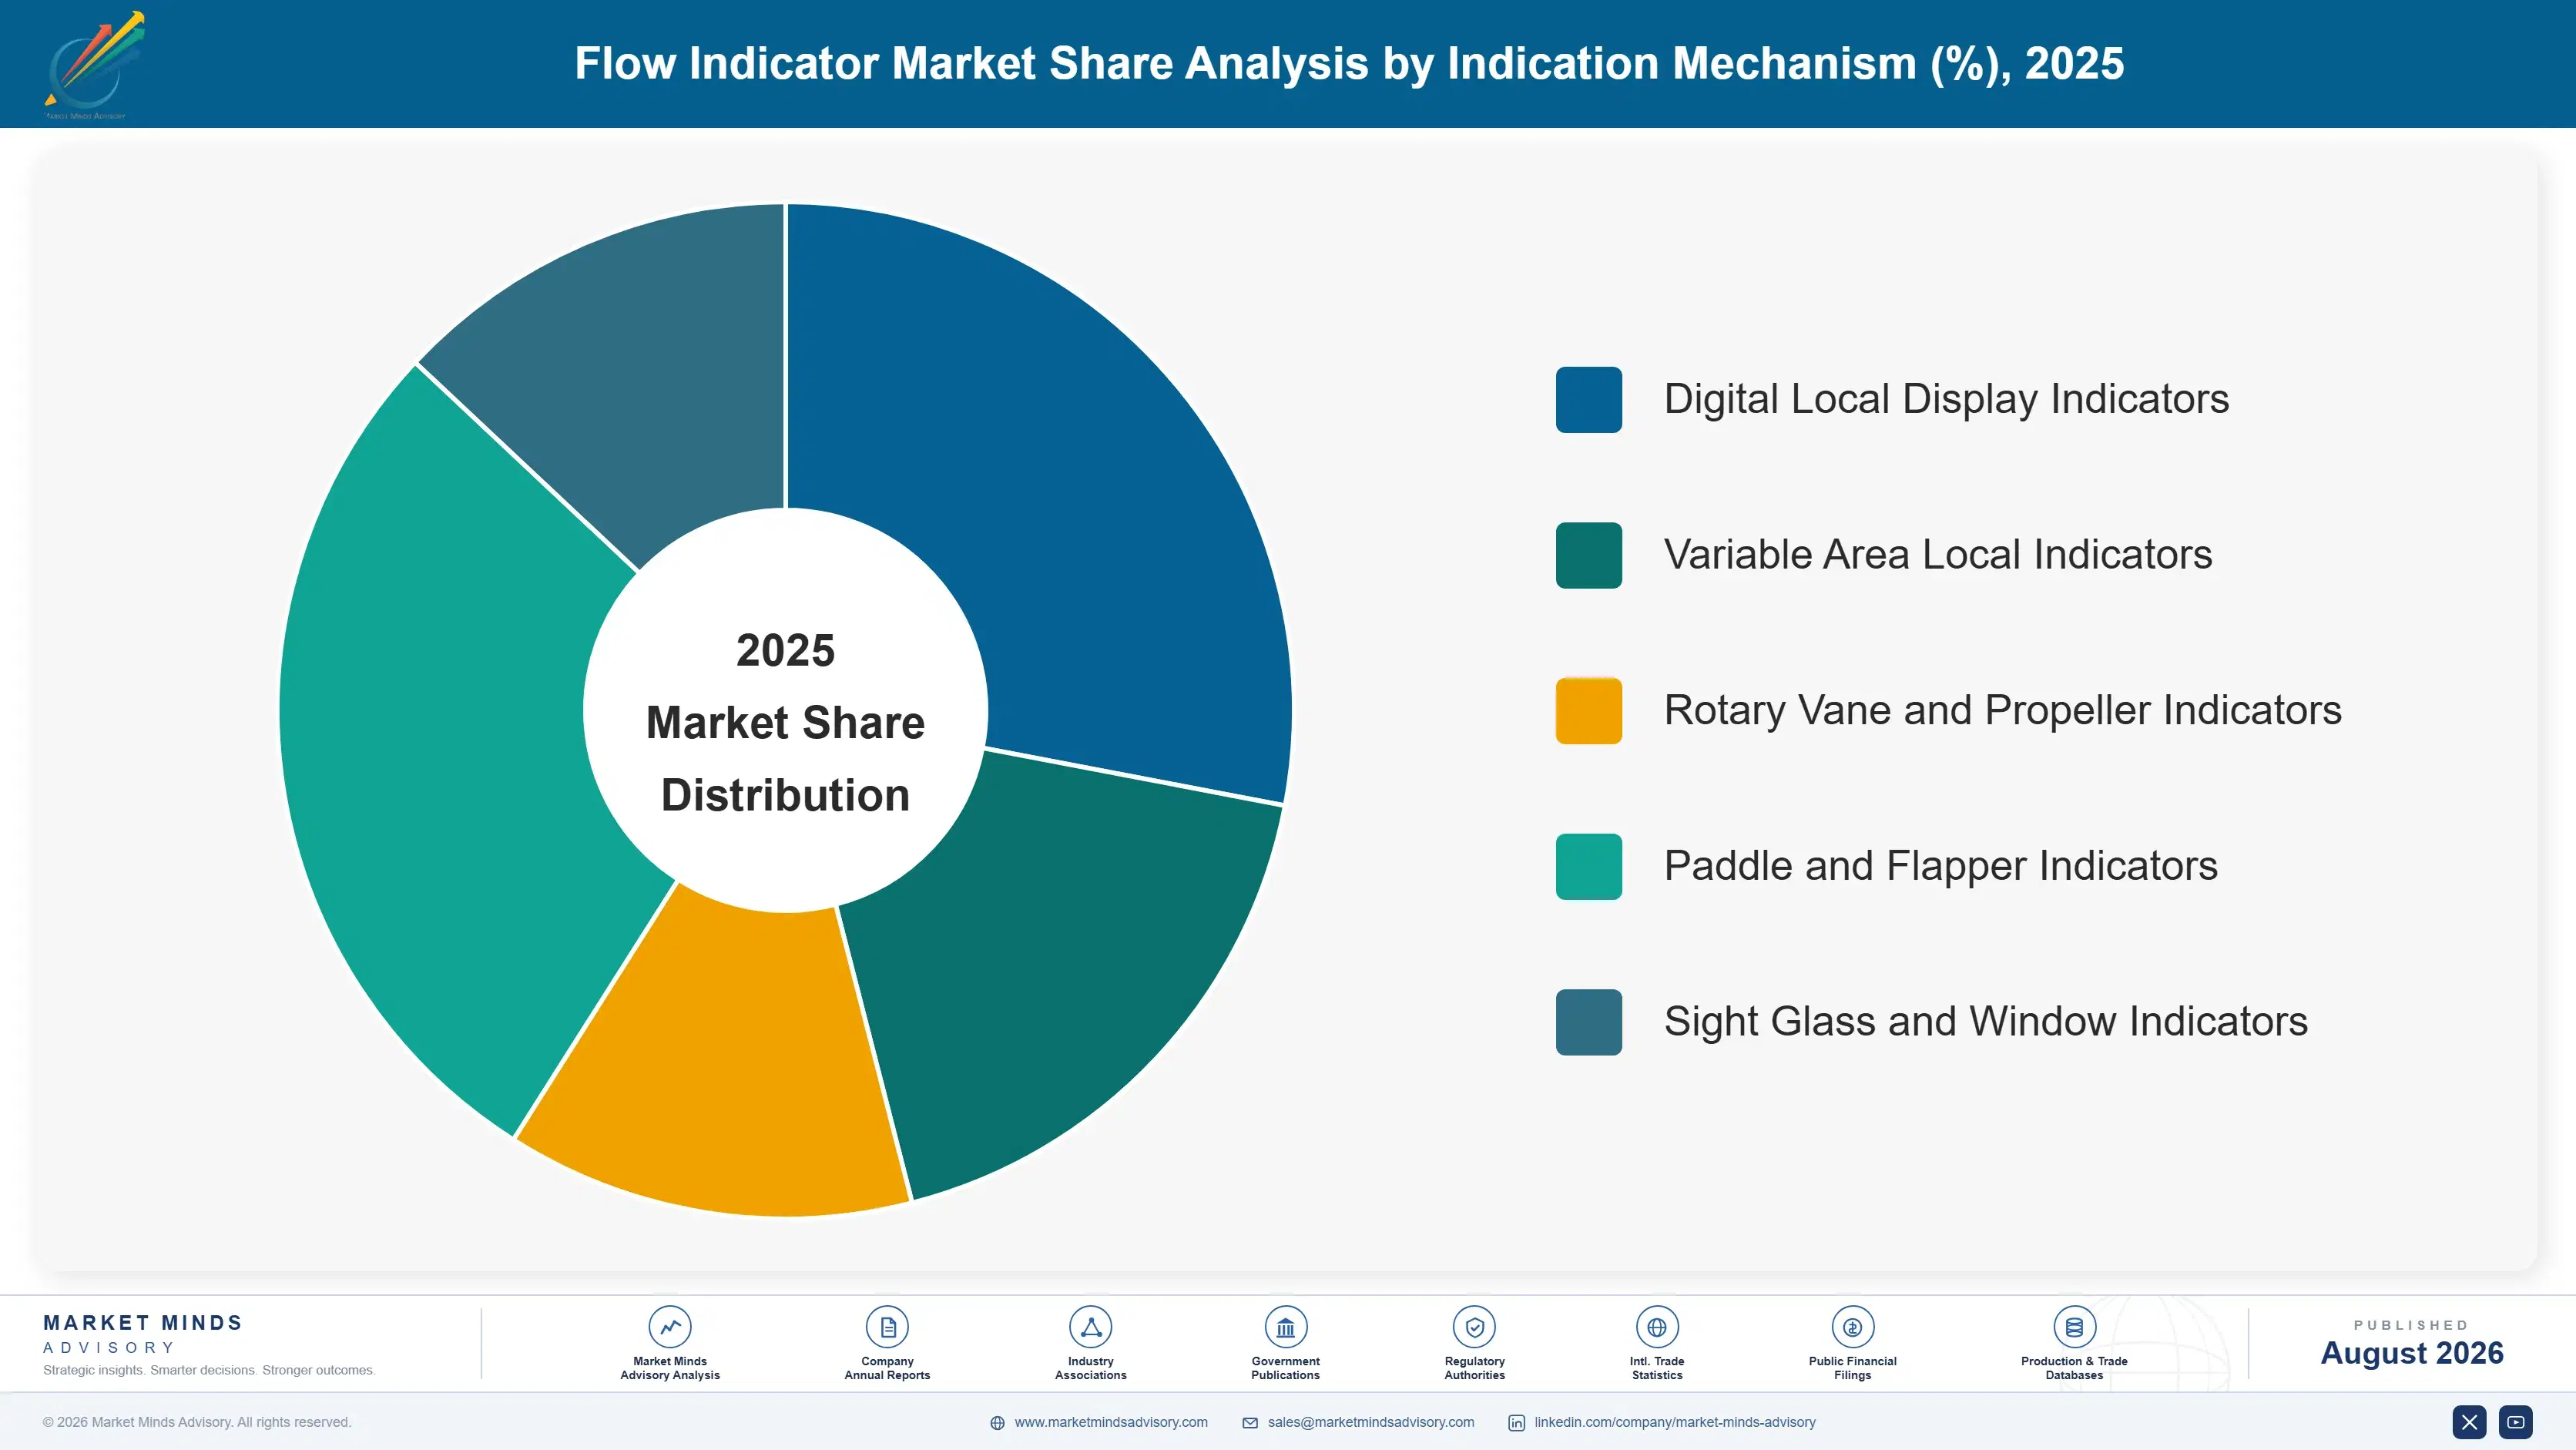
Segmentation follows indication mechanism, meaning how the device tells an operator that fluid is moving, because that choice determines the pressure and temperature envelope, the materials available, the failure mode, and the certifications a unit can realistically carry. Fluid type, line size, and end-use industry are handled in the framework, since each cuts across every mechanism rather than defining one.
flow-indicator-market-market-share-analysis-1787333837561

Digital Local Display Indicators

Digital local displays grow fastest at 8.6%, exactly twice the market rate, and the argument for them is failure mode rather than accuracy. A sight glass that fouls or clouds keeps looking normal while showing the wrong thing, and the operator has no way to tell. A sensor driving a local numeric display is either working and showing a value or plainly not working, which removes the ambiguity that makes the older technology dangerous. Chemical, pharmaceutical, and water utility operators are converting on exactly that basis. Battery and loop-powered variants both exist, and hazardous area approval is available across most of the range, which was the last barrier to specification in the applications that matter most here.
CAGR 8.6%

Variable Area Local Indicators

Local variable area indicators grow at 5.2%, holding applications where an operator needs an approximate rate rather than a simple presence check and where no power is available at the point of measurement. A float rising in a tapered tube against a scale requires nothing but the flow itself, which suits remote installations, purge lines, cooling circuits, and sampling systems. Accuracy is modest and orientation matters, but neither objection applies to the job being done. Glass tube versions face pressure and safety limits that metal tube designs with magnetic followers avoid entirely, and that shift accounts for most of the value growth inside this segment rather than any change in unit demand.
CAGR 5.2%
Full segment breakdown across 7 segments available in the complete report.

Regional Architecture and Country Demand Map

Regional shares here track installed process plant capacity rather than industrial output generally, because an indicator is bought with a pipe run and stays with it. North America, Western Europe, and East Asia divide the market unusually evenly between them. Certification regimes differ enough to fragment supply.

North America

North America holds 28% of value on a large installed base of chemical, refining, pharmaceutical, and water treatment plant that is mostly mature rather than expanding. Process safety management requirements drive walkdown practice harder here than almost anywhere, which keeps local indication written into procedures that automation projects are not permitted to remove. Gulf Coast chemical capacity and Midwest food processing both replace steadily. Hazardous area approval follows a different classification scheme from the European one, which gives domestic manufacturers a documentation advantage. Distributor networks are dense and hold most specification influence. Growth at 4.1% sits close to the global rate, carried by certified and hygienic mix rather than by any expansion in unit shipments across the region.
Share: 28% | CAGR: 4.1% (2026 to 2036)

East Asia

Manufacturing and installation both sit behind East Asia's 24% of value, which is an unusual combination in an instrument category. Chinese chemical, petrochemical, and water treatment capacity continues to be built at a pace no other region matches, and each new plant specifies indicators throughout. Domestic manufacturers supply most of that at prices imported product cannot reach, though certification for export markets remains a barrier several are working through. Japanese and Korean demand is replacement-weighted and specification-driven, with hygienic and semiconductor applications commanding premium pricing. Growth at 5.2% exceeds the global rate on new plant construction rather than on replacement, and the domestic share of that construction keeps rising year after year.
Share: 24% | CAGR: 5.2% (2026 to 2036)
Regional intelligence for 5 additional markets available in the complete report: Western Europe, South Asia and Pacific, Latin America, Middle East and Africa, Eastern Europe. Contact sales@marketmindsadvisory.com.
flow-indicator-market-country-cagr-analysis-1787333838079

Where Indicator Margin Actually Sits

Four levers matter here, and improving the device is not among them, because a paddle in a window was solved a century ago. Certification breadth, distributor listing position, hygienic range depth, and failure mode argument decide outcomes instead. A manufacturer competing on build quality against three others whose quality is also fine is arguing pointlessly.

Certify Across Every Zone Before The Tender Opens

Hazardous area approval gates 37% of applications and functions as a pass or fail condition rather than a preference, which means an uncertified unit is never priced because it is never compared. Certification costs testing time, documentation, and an annual audit, and that fixed burden is precisely why smaller competitors do not carry full zone coverage. A manufacturer holding ATEX, IECEx, and North American approvals across its whole range bids work that half the field cannot enter. The cost is known in advance and the barrier it builds lasts as long as the certification is maintained.
Market Impact: Certification gates 37% of all tend

Buy Distributor Shelf Position, Not Advertising

Distributors carry 62% of volume, and the engineer writing a specification chooses from what is listed and stocked rather than from the market as a whole. That makes listing position, counter staff familiarity, and selection tool presence worth considerably more than any product literature. Winning a listing costs inventory support, training investment, and margin concession, all of which look expensive against a three hundred dollar instrument. Losing it means the manufacturer is invisible at exactly the moment the decision is made, and never learns why. Visibility at the moment of decision is the whole game.
Market Impact: Distributors control 62% of all cat

Sell The Failure Mode, Not The Accuracy

A sight glass fails by continuing to look normal while showing the wrong thing, and every process engineer knows this without ever having costed it. That is a far more persuasive argument for a digital local display than any accuracy specification, because accuracy was never why the instrument was fitted. Framing the sale around what happens when the device is wrong reaches a safety budget rather than an instrumentation one, and safety budgets move on a different approval path. Suppliers leading with resolution answer a question nobody asked, while the digital segment grows at 8.6% on the safety case.
Market Impact: The digital segment grows at 8.6% e

Build A Hygienic Range Before Somebody Asks

Pharmaceutical and food processing buyers need documented surface finish to 0.8 micrometres, clean-in-place construction, declared elastomers, and a material certificate with every unit, none of which can be assembled inside a tender period. A manufacturer without that range does not lose those bids, it never sees them. Building one costs qualification work, documentation systems, and material traceability that a general industrial line does not carry. The reward is a customer set that requalifies slowly, pays considerably more, and rarely revisits the decision once it is made. Documentation is what a competitor has to replicate here.
Market Impact: Hygienic buyers pay roughly 3 times

Who Controls the Margin Pool

Concentration sits at 34% for the top five, low because the underlying product carries almost no protectable design content and any competent shop can build one. The gap between leaders and challengers is certification breadth and distributor listing rather than device performance. All participants here are assessed on one basis, revenue from local flow indication devices and their dedicated fittings. Certification documentation, not device performance, is what a competitor has to build.
Competition runs on four lines. Certification breadth decides which tenders a supplier can enter at all. Distributor listing decides whether a specifying engineer ever sees the product. Material and hygienic range depth decides access to pharmaceutical and food work. Price decides the uncertified general industrial brackets, where regional manufacturers set the level. Those four contests barely overlap with one another.

Two pressures will move positions. Certification cost keeps concentrating the approved end of the category while the uncertified end stays fragmented, which is a slow but one-directional consolidation. Meanwhile digital local displays are taking sight glass applications on a safety argument the mechanical incumbents cannot answer. Positions favour whoever holds full zone certification alongside a credible digital range. Very few suppliers currently hold that combination together.
flow-indicator-market-company-positioning-matrix-1787333838600

Competitive Moat and Risk Dimensions

DWYER INSTRUMENTS

Moat: Distributor listing and range breadth

Dwyer holds listing positions across industrial supply distributors that few instrument makers match, which matters when the channel carries most volume and the engineer chooses from a stocked list. Range breadth across flow, pressure, and level means a distributor stocks one supplier rather than three. Counter staff familiarity built over decades is genuinely hard for a competitor to displace.
DWYER INSTRUMENTS

Risk: Breadth without deep certification

A broad general industrial range reaches the uncertified brackets very effectively and the hazardous area and hygienic ends considerably less so, which leaves the fastest-growing and highest-value work to specialists. Digital local display capability is thinner than the mechanical range suggests. Distributor dependence also means limited visibility of why specifications are won or lost.
KOBOLD MESSRING

Moat: Certification depth and materials range

Kobold carries hazardous area approvals across an unusually wide product range and holds materials and hygienic variants that let it bid work most competitors never see. German engineering documentation is accepted internationally without argument, which shortens qualification considerably. Direct technical selling into process engineering reaches the specifying decision rather than waiting for a distributor to present the option.
KOBOLD MESSRING

Risk: Cost base against Asian competitors

A German manufacturing and certification cost base cannot approach Asian pricing in the uncertified general industrial brackets, which are the volume half of the category. Direct technical selling is expensive against a three hundred dollar instrument and does not scale into smaller accounts. Certification advantage also erodes as Asian manufacturers work through the same approvals themselves.

Players Tracked

Prominent Players

Dwyer Instruments
Kobold Messring
Bürkert
Badger Meter
Krohne

Other Key Players

Emerson
Brooks Instrument
Parker Hannifin
Swagelok
Georg Fischer
GEMÜ
CIRCOR
Klinger
Blue-White Industries
King Instrument
Universal Flow Monitors
Titan Enterprises
Malema Engineering
ONICON
Ernst Flow Industries

Recent Developments

FEBRUARY 2025

Process safety guidance addresses visual indicator reliability

Industry process safety guidance in several jurisdictions began addressing the reliability of visual flow indication under fouling and clouding conditions, treating a misleading indicator as a recognised hazard. These were guidance revisions rather than commercial events, and they strengthen the case for indicators that fail visibly instead.
Signal: Guidance that names a failure mode moves r
AUGUST 2024

Hazardous area approval requirements widen across process procurement

Additional process operators moved hazardous area certification from a preferred attribute to a mandatory condition across whole plant specifications rather than by zone, following insurer and internal audit pressure. These were procurement policy changes rather than transactions, and they exclude uncertified suppliers from tenders they previously reached.
Signal: A procurement policy applied across a whol
MAY 2024

Asian manufacturers complete European certification programmes

Several Chinese and Indian instrument manufacturers completed ATEX and IECEx certification across parts of their flow indication ranges, opening European and Gulf tenders previously closed to them. These were certification milestones rather than transactions, and they erode a documentation advantage European makers held for two decades.
Signal: Certification is a barrier only until comp

Stainless Steel, Glass, Seals, Certification

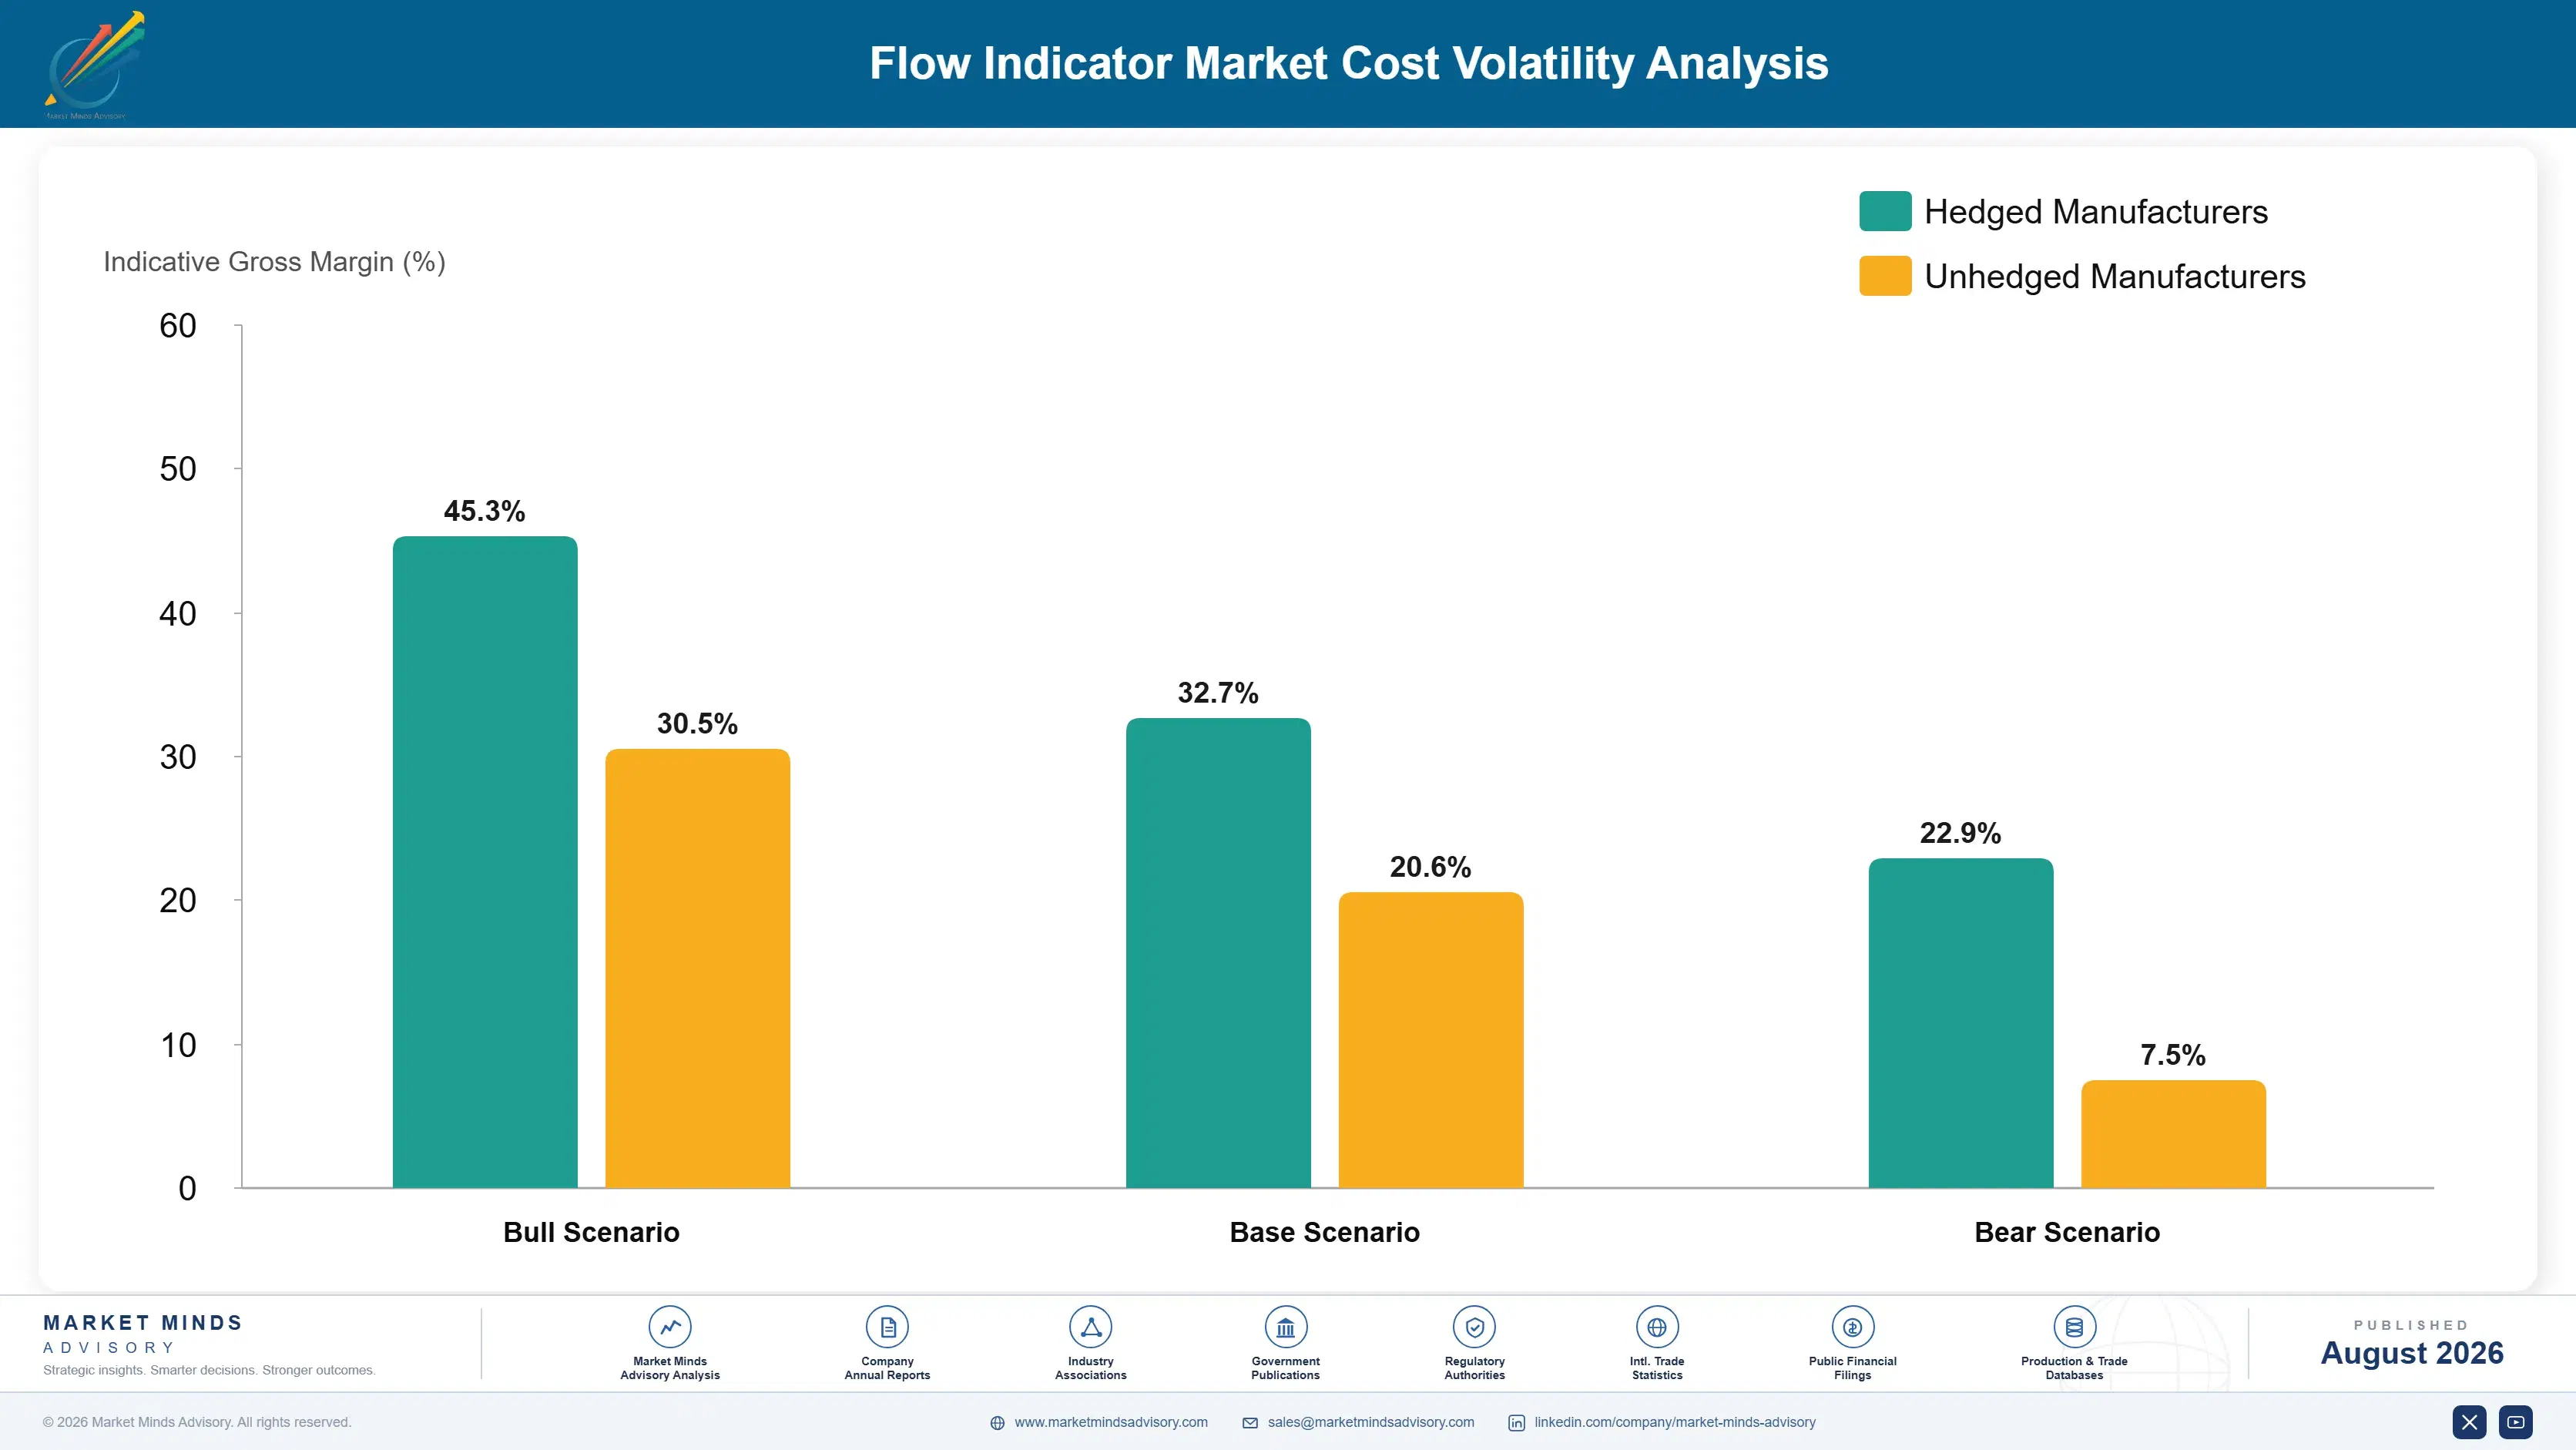
Material and paperwork dominate in roughly equal measure. Stainless steel bar and forgings carry 30% to 42% of unit cost, priced against alloy surcharges nobody here influences. Borosilicate glass and sight windows add 8% to 16% on the visual types. Elastomer seals with regulatory declarations run 6% to 12%. Certification, testing, and documentation account for a further 10% to 18% and rise with every zone covered.
European stainless steel prices rose sharply through 2021 and 2022 as energy costs hit mill production and nickel surcharges moved violently, and the IEA documented the underlying industrial energy constraint. For a manufacturer holding catalogue prices across a distributor listing, pass-through lagged by months. Bürkert and Georg Fischer both disclosed input cost pressure across that period. Several repriced catalogues twice in a year, which distributors dislike.

Each range above exceeds three points because a plain sight glass and a certified digital display share little beyond the body casting. Exposure separates by product mix. A mechanical indicator maker carries steel and glass risk on catalogue prices it cannot move quickly. A digital supplier carries electronics and certification cost instead. Asian manufacturers hold steel proximity and lower machining labour European makers cannot match.
flow-indicator-market-cost-volatility-analysis-1787333838796

Reprice catalogues on a published surcharge, not annually

Stainless steel carries up to 42% of unit cost and moves on alloy surcharges published monthly, while distributor catalogue prices traditionally change once a year. That mismatch is a commodity position taken by accident. A published material surcharge mechanism agreed with distributors in advance costs a negotiation once and removes the exposure permanently, which several suppliers now do routinely.

Certify once across the widest range possible

Certification, testing, and documentation carry 10% to 18% of cost and behave as a fixed burden rather than a per-unit one. Approving a single body platform across many variants spreads that cost across far more units than certifying models individually does. Most certify reactively, model by model, and pay several times over for what one coordinated programme delivers.

Standardise body platforms across the mechanical range

Machined bodies and flanges carry most of the material cost and are largely common across indicator types if a manufacturer designs them that way. Most ranges grew by accretion instead, with each product developed separately and nobody owning the tooling question. Consolidating onto shared platforms costs one redesign cycle and permanently improves machining scale, inventory, and certification economics together.

Portfolio Architecture for Margin Defence

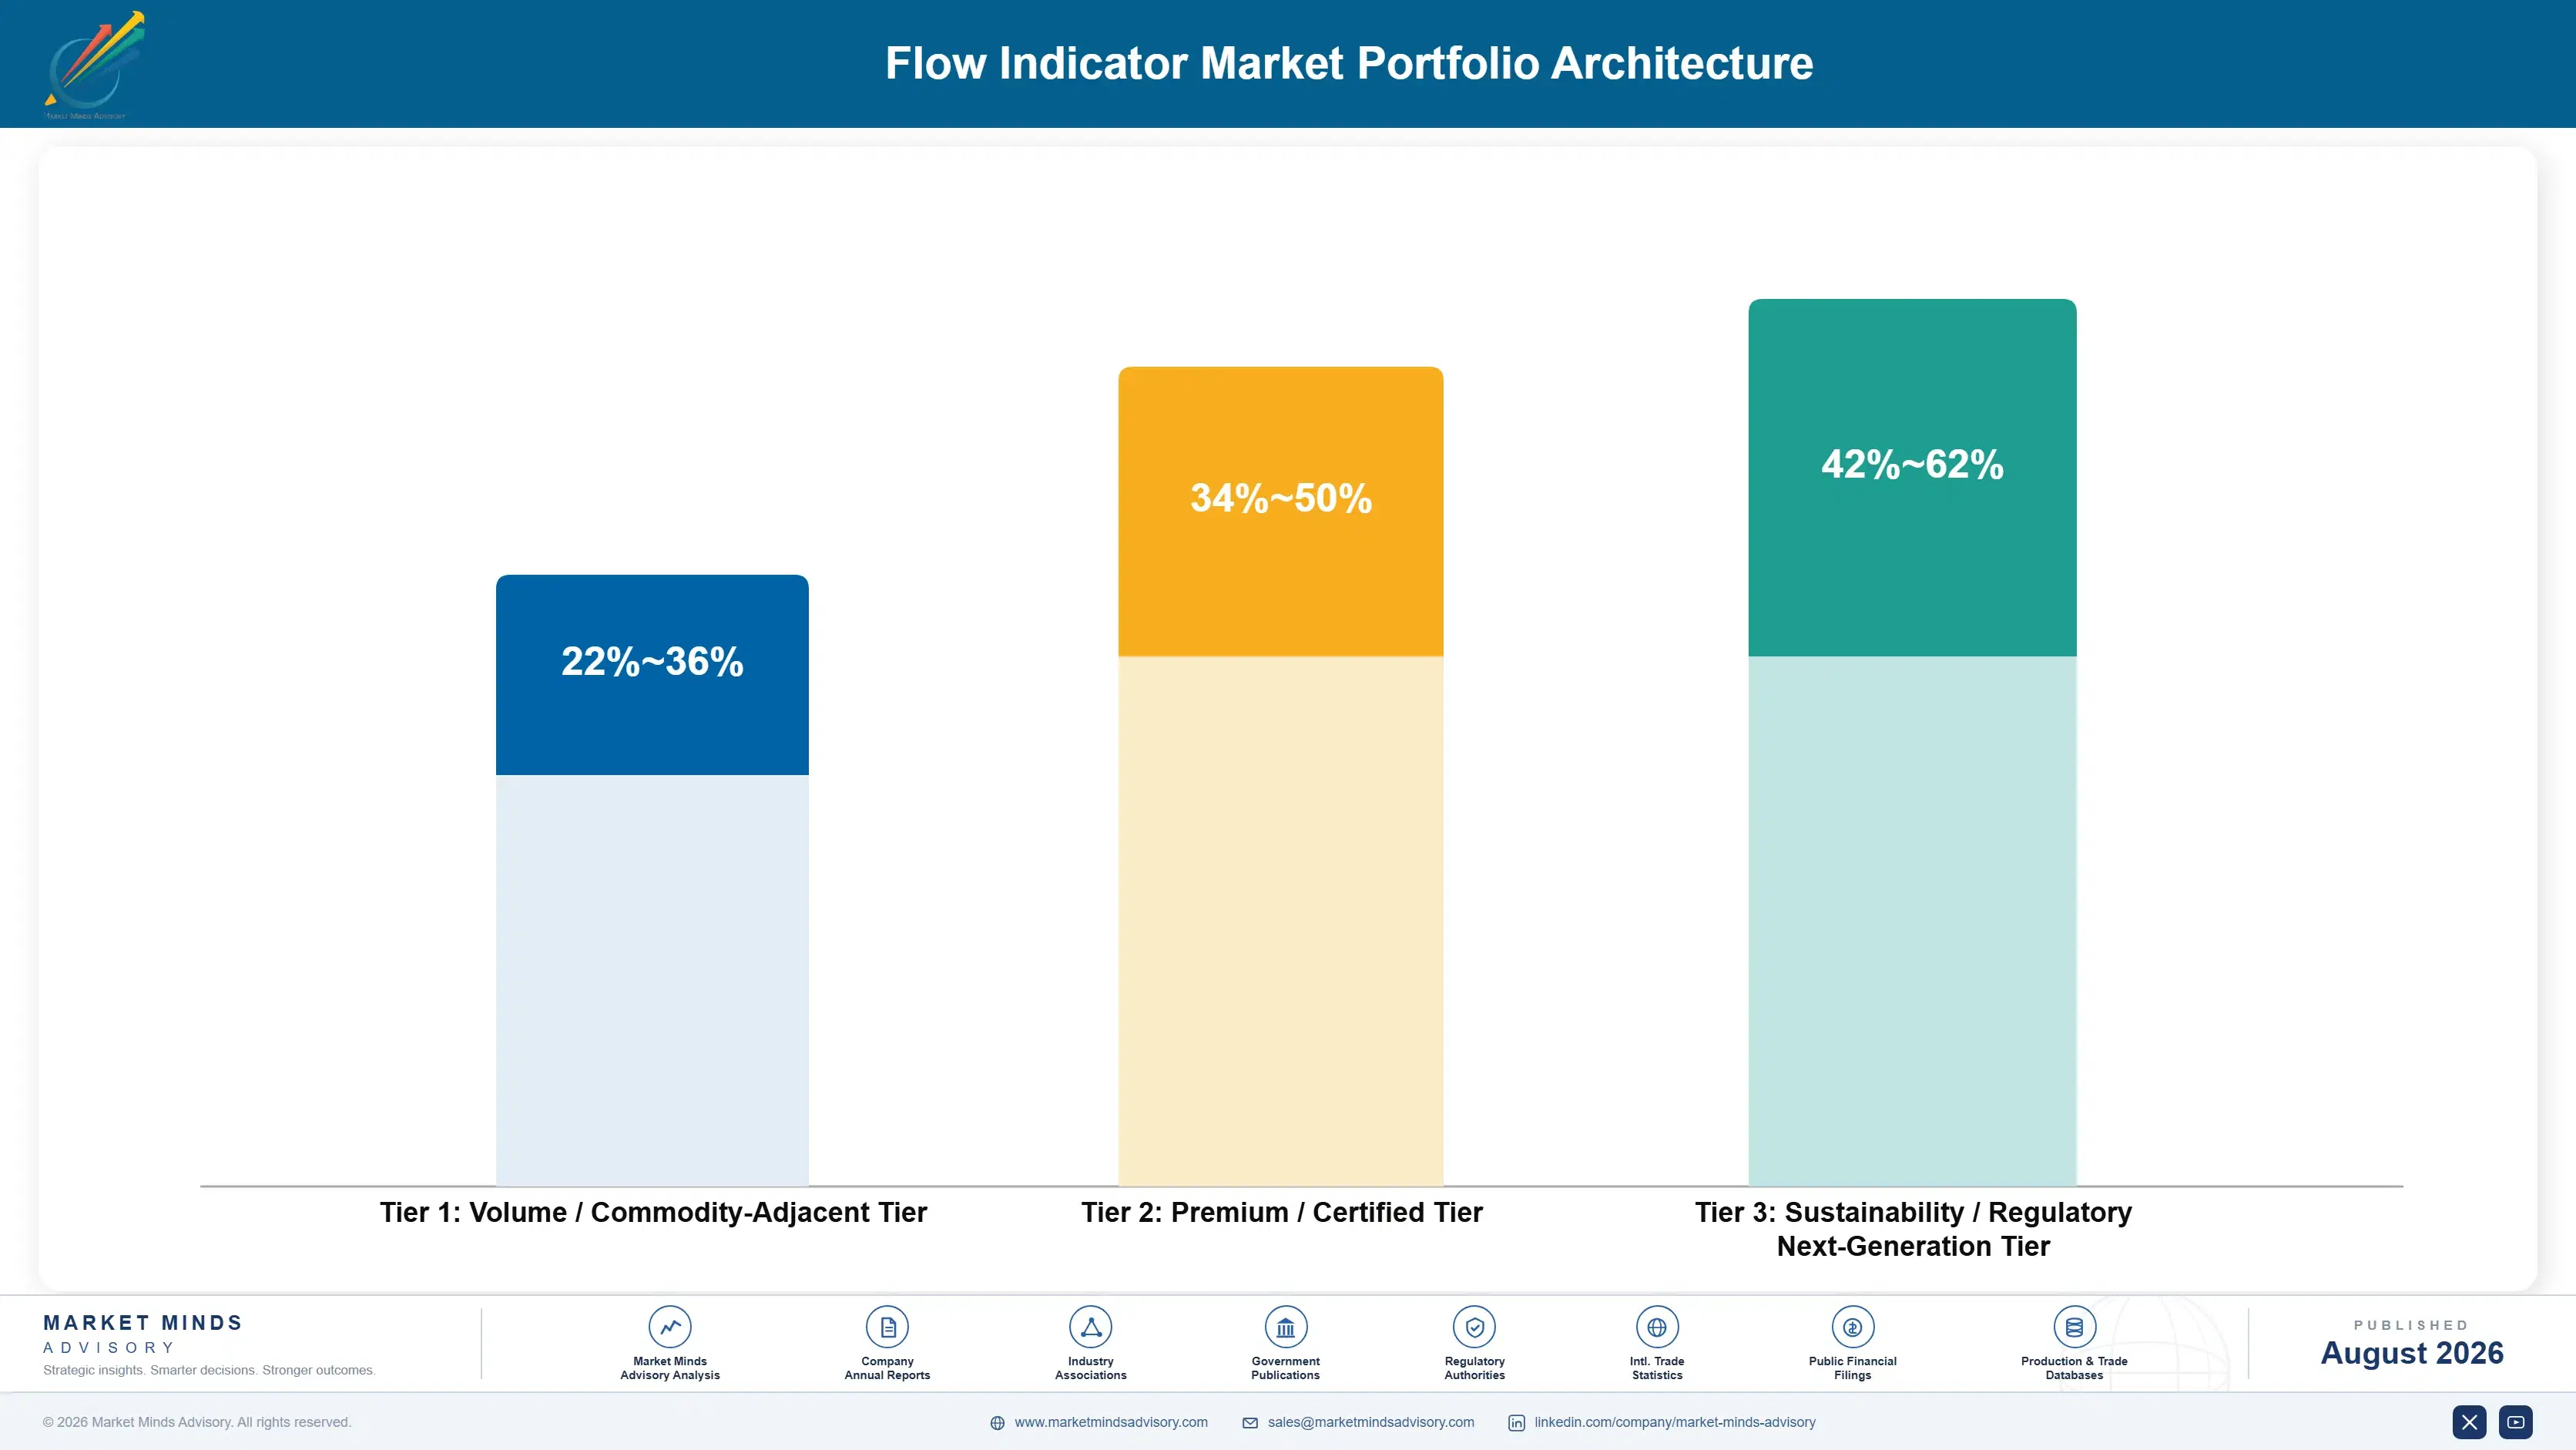
Three tiers sit inside this category and certification draws the lines between them. Uncertified general industrial indicators form the volume tier, sold on price through distribution where regional manufacturers set the level. Hazardous area certified product earns more, because approval is a gate rather than a feature and half the field cannot pass it. Hygienic and digital ranges price highest, since documentation and failure mode arguments reach budgets ordinary instrumentation does not.
The tension is between catalogue volume that holds distributor listings and certified work that earns money. A broad general industrial range is what makes a distributor stock one supplier rather than three, and losing that listing costs visibility across every product. Yet the uncertified brackets carry thin margin against regional competitors. Suppliers handling this well keep breadth to hold the shelf and take profit at the certified end.

High-value pools concentrate where documentation limits competition: full zone hazardous area coverage, hygienic ranges with material certificates, digital displays sold against a failure mode, and anything specified into a plant-wide standard. The commodity end is uncertified sight glasses and paddle indicators sold on price, where the design is unprotectable and Asian manufacturing sets the level for everybody.

Volume / Commodity-Adjacent Tier

Uncertified sight glass, paddle, and rotary vane indicators sold through general industrial distribution. The range is wide because Asian machining cost and Western catalogue overheads produce entirely different economics on physically similar devices.
Gross Margin: 22-36%

Premium / Certified Tier

Hazardous area certified indicators carrying ATEX, IECEx, or North American zone approvals across the range. The range is wide because full zone coverage commands pricing that single-approval product competing on the same shelf cannot.
Gross Margin: 34-50%

Sustainability / Regulatory / Next-Generation Tier

Hygienic clean-in-place ranges with documented finish and digital local display units sold on failure mode. The range is wide because pharmaceutical documentation carries very different margin from a battery-powered display in general industry.
Gross Margin: 42-62%
flow-indicator-market-portfolio-architecture-1787333839297

High-value Sub-segments and Strategic Watch-out

Digital Local Display Indicators

High value and high growth at 8.6%, exactly twice the market rate, because a sensor and a numeric display fail visibly where a sight glass fails silently. Safety rather than accuracy is what sells it, which reaches a different budget and a different approval path entirely.
Gross Margin: 42-62%

Variable Area Local Indicators

High value with steady growth at 5.2%, serving purge lines, cooling circuits, and sampling systems where an approximate rate is wanted and no power exists. Metal tube designs with magnetic followers are taking value from glass tube versions on pressure and safety limits. Pressure limits drive that shift.
Gross Margin: 34-50%

Sight Glass and Window Indicators

The volume core by units at 2.6%, still the default fitting on countless pipe runs and the cheapest way to see whether anything moves. Fouling and clouding make it fail in the most dangerous way an instrument can, which is the whole case against it.
Gross Margin: 22-36%

Paddle and Flapper Indicators

The strategic watch-out at 3.4%, a design with no protectable content that any machine shop with a certification budget can build competently. Price is the only variable in the uncertified brackets and no manufacturer defends a position worth naming there. Certification is the only defensible ground available in it.
Gross Margin: 22-36%

How Indicator Demand Actually Repeats

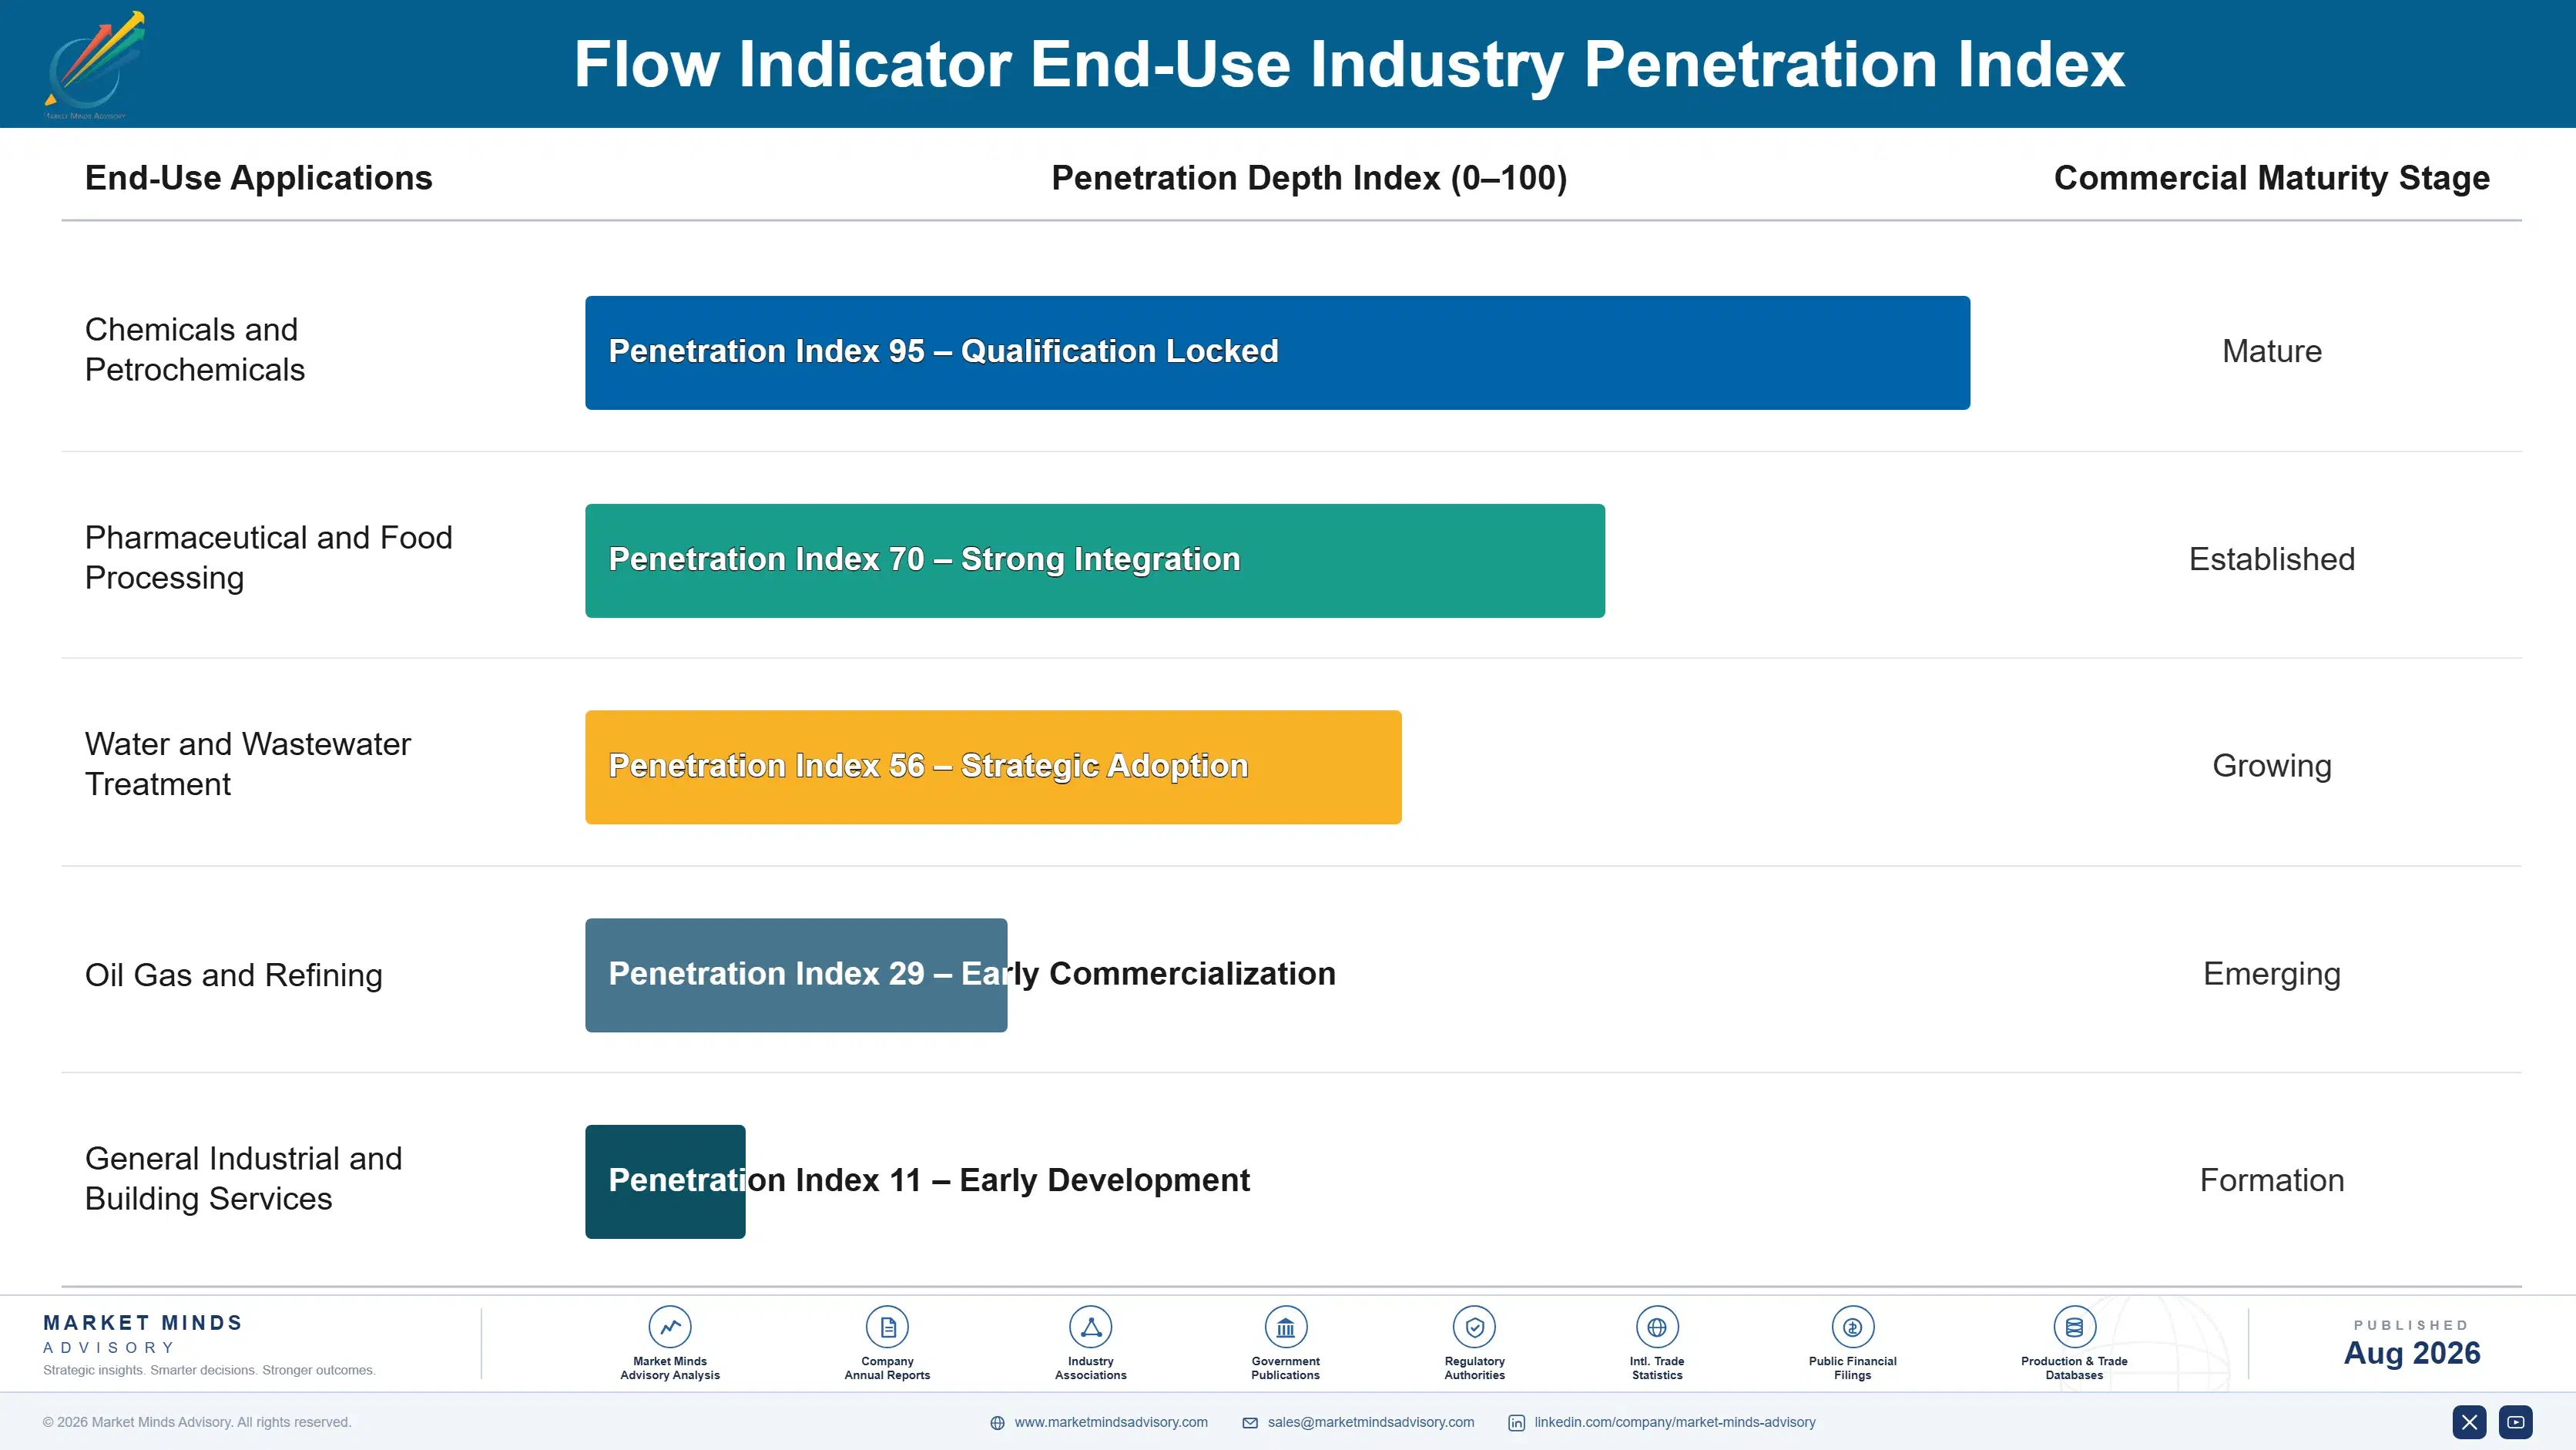
Demand commits at plant design or line specification and then repeats on replacement for twelve to twenty years. An indicator fitted into a pipe run stays there, and at replacement the engineer usually specifies the same thing rather than reopening a three hundred dollar decision. That produces genuine incumbency at almost no defence cost. The real competitive moments are a new plant, a plant-wide specification review, and a certification requirement the incumbent cannot meet.
Stickiness varies with how documented the application is. Pharmaceutical and food processing stick hardest, since requalifying a hygienic component means revisiting validation nobody volunteers for. Hazardous area installations stick nearly as hard through certification records tied to specific part numbers. General chemical and utility work sticks moderately. Water treatment and general industrial stick least, because the buyer compares listings at each replacement and switches.

The buyer has moved from a plant instrument technician to a corporate specification engineer writing plant-wide standards. Twenty years ago a maintenance department bought what it had always bought. Now a standards document names approved suppliers across an estate, turning dozens of small decisions into one. Suppliers still calling on individual plants are competing for orders that a document elsewhere already decided.
flow-indicator-market-end-use-penetration-index-1787333839786

Our Call On Flow Indicators

These are among the four positions where our research anticipates prominent divergence between winners and laggards over the coming forecast period. Each is grounded in the demand model, the regulatory perimeter, and the announced capacity pipeline.
01 / CERTIFICATION COVERAGE PRIORITY

Approval is the gate, not the differentiator

Hazardous area certification now gates 37% of applications and functions as a pass or fail condition, which means an uncertified indicator is never priced against a certified one because it never reaches the comparison at all. Certification carries a fixed cost in testing, documentation, and annual audit that falls hardest on smaller competitors and is precisely why most of them hold partial coverage. A manufacturer with full zone approval across a shared body platform bids work half the field cannot enter.
02 / CHANNEL LISTING DISCIPLINE

The distributor decides before the engineer does

Around 62% of volume reaches end users through industrial distribution, which means the engineer writing a specification chooses from what is stocked and listed rather than from the market as a whole. Listing position, counter staff familiarity, and presence in selection tools therefore decide more sales than any product attribute does, and a manufacturer without them is invisible at the moment of decision. Spending on distributor training and inventory support returns more than the same money spent on product literature ever will.
03 / FAILURE MODE ARGUMENT

Sell what happens when it is wrong

A sight glass fails by continuing to look entirely normal while showing no flow in a flowing line, and every process engineer knows this without anybody having costed the consequences properly. Framing a digital local display around that failure mode reaches a process safety budget rather than an instrumentation one, and safety budgets follow a different and considerably faster approval path. Suppliers leading with resolution and repeatability are answering a question the buyer never asked and does not care about.
04 / HYGIENIC RANGE INVESTMENT

Build the documentation before the enquiry

Pharmaceutical and food buyers require documented surface finish, clean-in-place construction, declared elastomers, and material certificates with every unit, none of which can be assembled during a tender period. A manufacturer without that range does not lose those bids so much as never see them, because the buyer filters on documentation long before any supplier list is drawn up. Building it costs qualification work and traceability systems, and rewards a customer set that requalifies slowly and pays roughly three times more.

Engagement Snapshot From the Field

A live engagement with an industry participant carrying material or product regulatory and market exposure ahead of a defining policy shift, showing how our research translates into a defensible multi-year portfolio strategy.
MARKET MINDS ADVISORY · CLIENT ENGAGEMENT SUMMARY
Flow Indicator Producer Strategic Portfolio Review and Transition Roadmap 2026·Investment Scenario on Flow Indicator Exposure Evaluation 2025-26
CLIENT PROFILE
A European flow instrument manufacturer with roughly USD 54 million in annual revenue engaged MMA after four consecutive years of flat revenue despite a product range widely regarded as technically excellent (client-reported, unverified by MMA). Management believed the problem was awareness and had increased marketing spend twice without any measurable effect on order intake or enquiry volume.
STRATEGIC CHALLENGE
Sales wanted more field engineers to reach specifying customers directly. Marketing wanted a larger campaign budget. Nobody had asked distributors why the client's products were stocked in some branches and not others, and nobody had audited which tenders the range was ineligible to enter. The board needed a position before the next annual planning round closed.
MMA APPROACH
MMA audited the client's certification coverage against the zone requirements written into fifty recent process tenders in its core markets. We interviewed 45 distributor branch managers on how listing and stocking decisions are actually made and what would change them. We then modelled three options: direct sales expansion, a certification programme across shared body platforms, and a distributor listing investment.
KEY FINDINGS
  1. The client's range was ineligible for 41% of audited tenders on certification grounds alone, and in most cases nobody at the company knew the tender had existed (client-reported, unverified by MMA).
  2. Distributor branch managers ranked range breadth and counter staff familiarity above product quality when deciding what to stock, and the client scored poorly on both.
  3. Certifying three shared body platforms rather than eleven individual models reduced the modelled programme cost by more than half with identical coverage.
  4. Direct sales expansion modelled worst of the three options, because a three hundred dollar instrument cannot carry the cost of a field visit.
CLIENT PROFILE
A European flow instrument manufacturer with roughly USD 54 million in annual revenue engaged MMA after four consecutive years of flat revenue despite a product range widely regarded as technically excellent (client-reported, unverified by MMA). Management believed the problem was awareness and had increased marketing spend twice without any measurable effect on order intake or enquiry volume.
STRATEGIC CHALLENGE
Sales wanted more field engineers to reach specifying customers directly. Marketing wanted a larger campaign budget. Nobody had asked distributors why the client's products were stocked in some branches and not others, and nobody had audited which tenders the range was ineligible to enter. The board needed a position before the next annual planning round closed.
MMA APPROACH
MMA audited the client's certification coverage against the zone requirements written into fifty recent process tenders in its core markets. We interviewed 45 distributor branch managers on how listing and stocking decisions are actually made and what would change them. We then modelled three options: direct sales expansion, a certification programme across shared body platforms, and a distributor listing investment.
KEY FINDINGS
  1. The client's range was ineligible for 41% of audited tenders on certification grounds alone, and in most cases nobody at the company knew the tender had existed (client-reported, unverified by MMA).
  2. Distributor branch managers ranked range breadth and counter staff familiarity above product quality when deciding what to stock, and the client scored poorly on both.
  3. Certifying three shared body platforms rather than eleven individual models reduced the modelled programme cost by more than half with identical coverage.
  4. Direct sales expansion modelled worst of the three options, because a three hundred dollar instrument cannot carry the cost of a field visit.
RECOMMENDED STRATEGY
Phase 1: Phase 1 (0 to 9 months): Stop the marketing spend and begin certifying three shared body platforms for full zone coverage. Phase 2: Phase 2 (9 to 22 months): Invest the freed budget in distributor listing, counter training, and stocking support across core territories. Phase 3: Phase 3 (22 to 40 months): Add a hygienic range on the certified platforms and pursue plant-wide specification listings directly.
OUTCOME
The board cancelled the marketing programme and funded certification and distributor investment instead, which the sales director initially resisted and later supported. Tender eligibility rose materially within four quarters and distributor listings expanded across two core territories, with revenue following at unchanged pricing (client-reported, unverified by MMA). The hygienic range remains in development.

Frequently Asked Questions

Foundational context covering the market sizes, CAGR, scope, country, region and competition that inform every finding below. This section is provided to cover basics and most often pre-purchase conversations, answered from the MMA Primary Research Dataset.

What is the current size of the Flow Indicator Market?

The global market is valued at USD 0.7 billion in 2025, covering sight glass, paddle, rotary vane, variable area, and digital local display flow indicators. Transmitting flow meters and custody transfer metering are excluded.

How large will the Flow Indicator Market be by 2036?

The market is forecast to reach USD 1.11 billion by 2036 in the base case, about 1.52 times the 2026 level. That represents incremental value of roughly USD 0.38 billion.

What is the CAGR for the Flow Indicator Market 2026 to 2036?

The market grows at a 4.3% CAGR in the base case, with bull and bear scenarios at 5.5% and 3.1%. The spread turns on process safety guidance and on industrial capital cycles.

Which segment is growing fastest?

Digital local display indicators grow fastest at 8.6%, exactly twice the overall rate, because they fail visibly where a sight glass fails silently. Variable area local indicators follow at 5.2%.

Who are the major companies in the Flow Indicator Market?

Leading participants include Dwyer Instruments, Kobold Messring, Bürkert, Badger Meter, and Krohne. Concentration is low at roughly 34%, because the underlying design carries almost no protectable content.

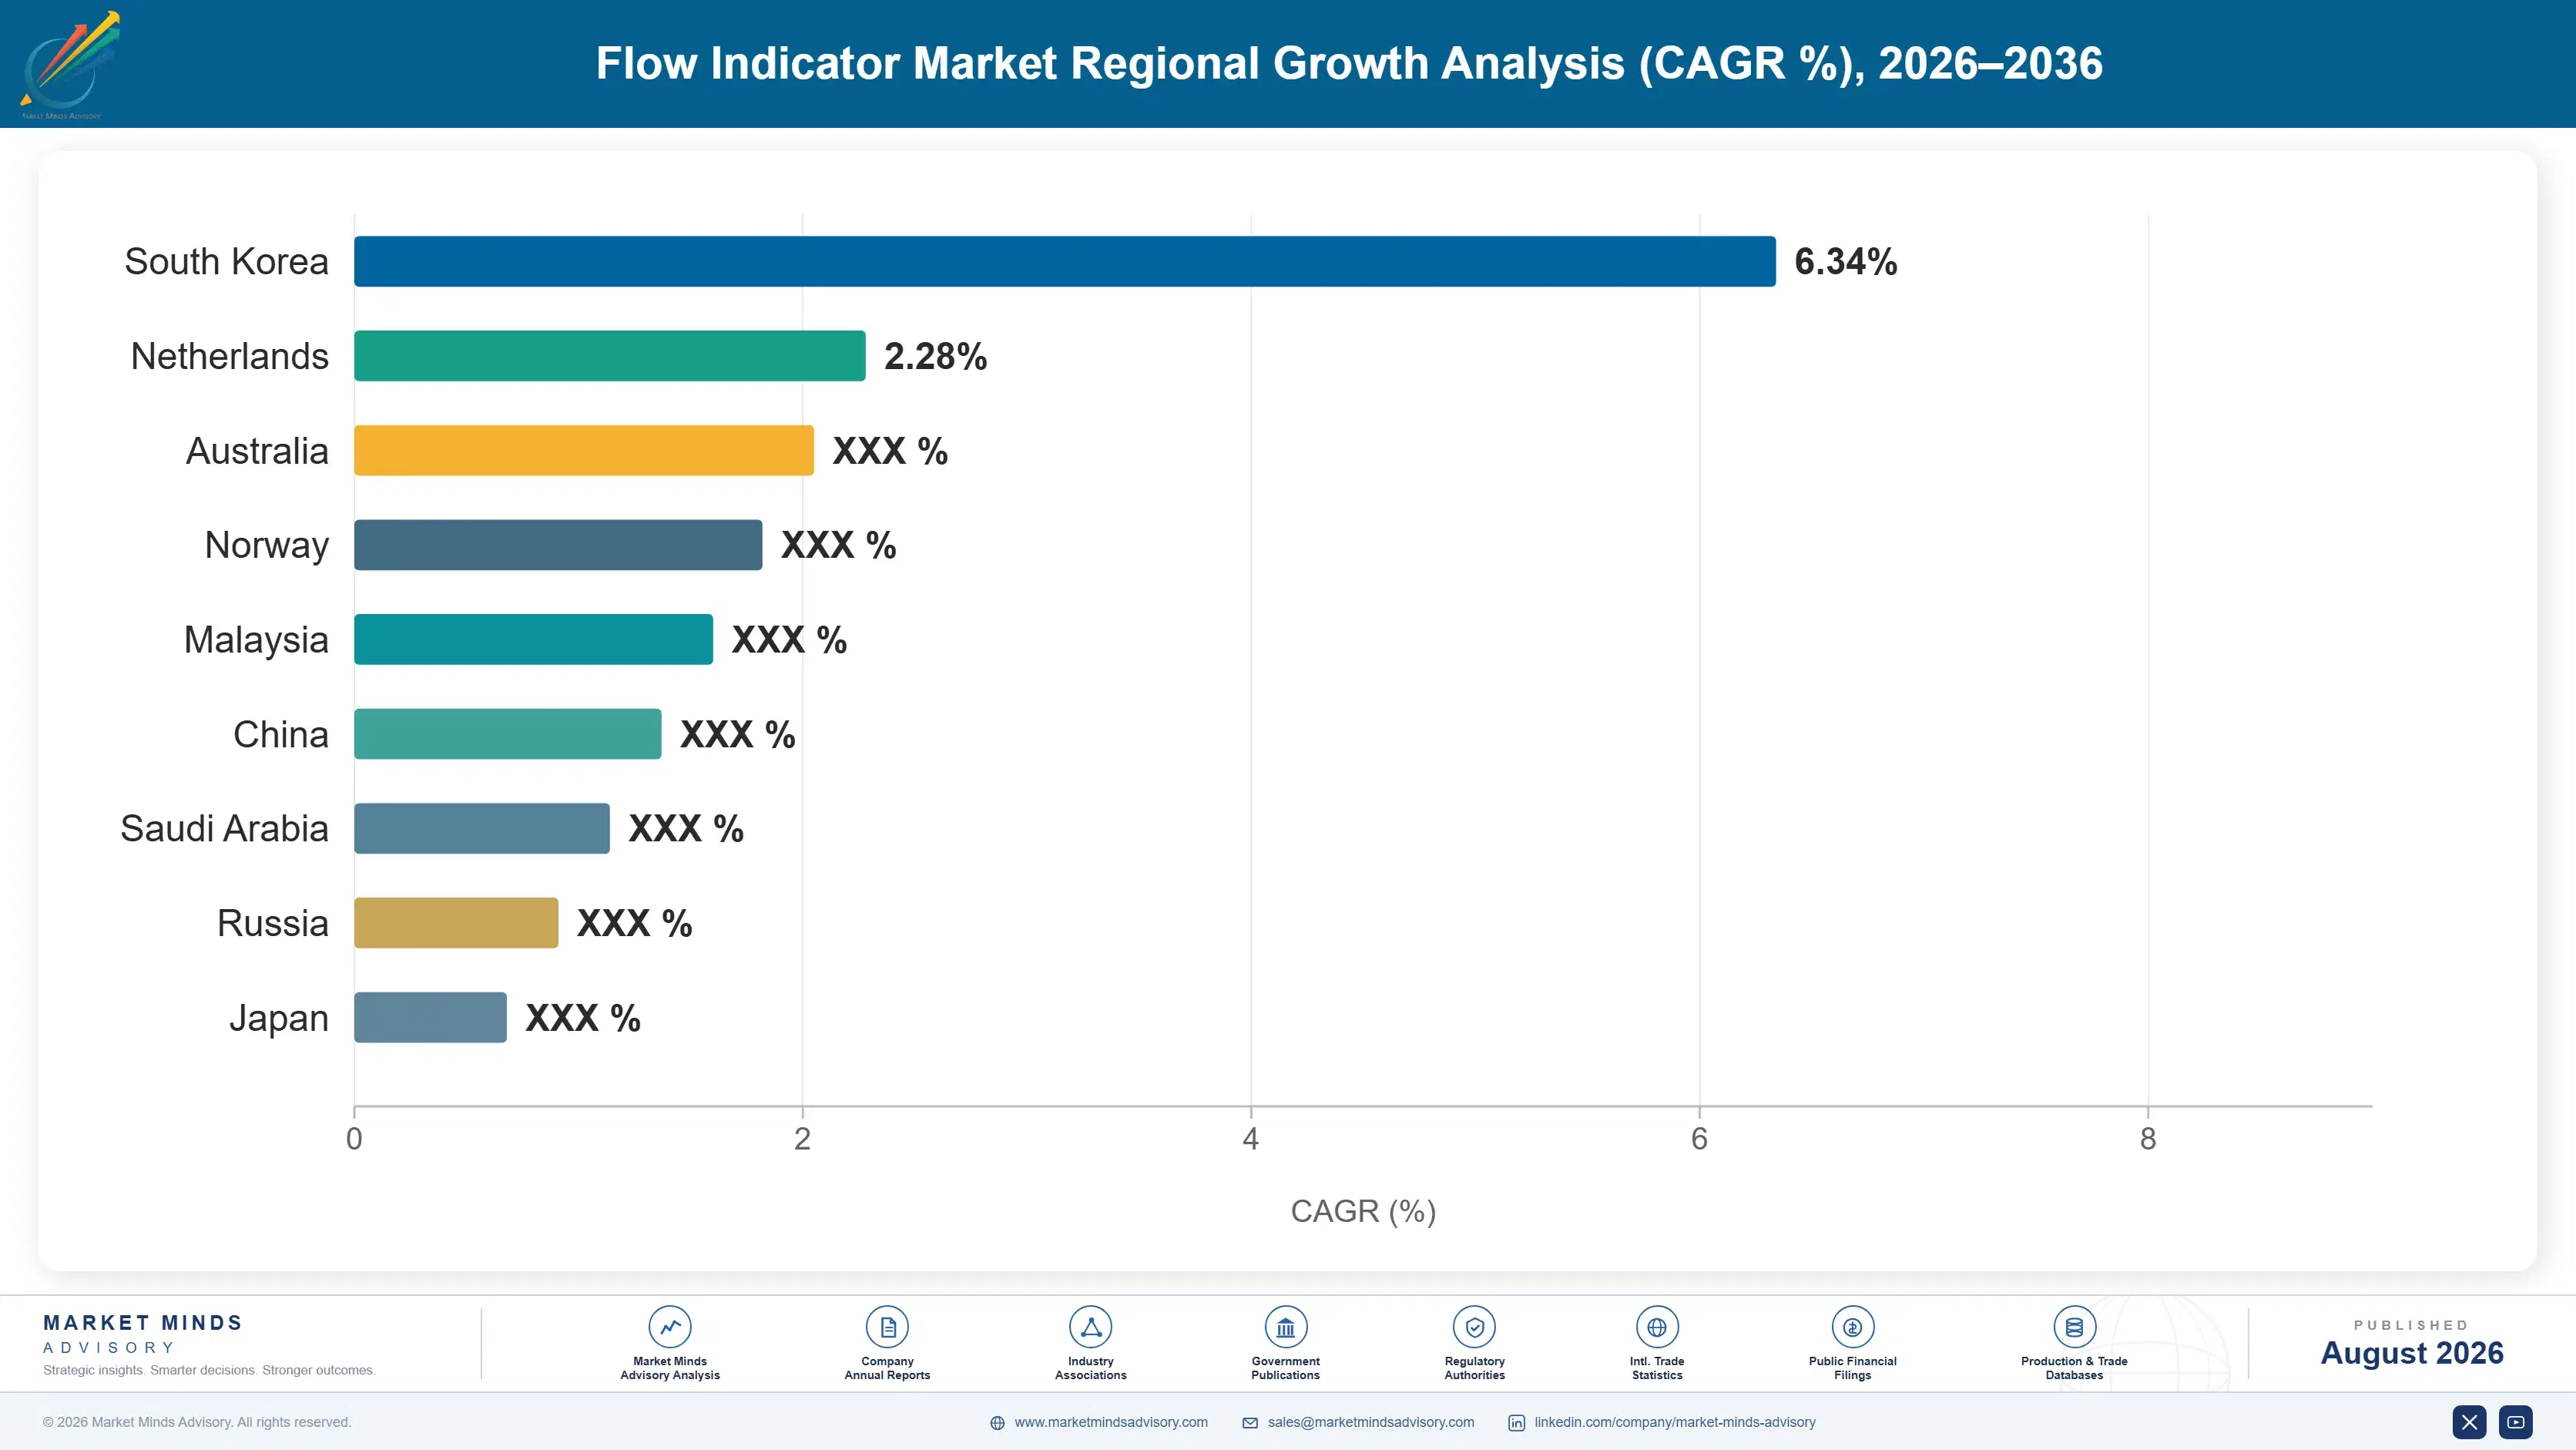
Which country is growing fastest?

India grows fastest at a 6.9% CAGR, driven by pharmaceutical, specialty chemical, and water infrastructure construction across the country. China follows on continued process plant capacity additions.

Report Segmentation Architecture

The full report scope spans multiple orthogonal segmentation dimensions, with cross-tabulated demand data provided for each dimension pair. Coverage extends further to regional breakdowns, trend trajectories, and the competitive detail needed to support segment-level decision-making.

By Indication Mechanism

  • Digital Local Display Indicators
  • Variable Area Local Indicators
  • Rotary Vane and Propeller Indicators
  • Paddle and Flapper Indicators
  • Sight Glass and Window Indicators

By End-Use Industry

  • Chemicals and Petrochemicals
  • Pharmaceutical and Food Processing
  • Water and Wastewater Treatment
  • Oil Gas and Refining
  • General Industrial and Building Services

By Distribution Channel

  • Industrial Supply Distribution
  • Direct Sale to End User
  • Engineering Contractor Project Supply
  • Original Equipment Manufacturer Supply

By Region

  • North America
  • East Asia
  • Western Europe
  • South Asia and Pacific
  • Latin America
  • Middle East and Africa
  • Eastern Europe

Scope, Methodology, and Coverage

Every figure in this report is reproducible from documented input assumptions. The scope below maps the historical period, the forecast horizon, the segmentation dimensions, and the countries covered, alongside the underlying primary and qualitative methodology.
Historical Period
2020 to 2025
Forecast Period
2026 to 2036
Base Year
2025 (USD billions; MMA Primary Research Dataset, August 2026)
Market Definition
The flow indicator market comprises the manufacture and sale of devices providing local visual indication of fluid flow within a pipeline, valued at manufacturer selling prices to industrial distributors, engineering contractors, equipment builders, and end users. It spans sight glass and window indicators, paddle and flapper types, rotary vane and propeller designs, drip and bullseye fittings, local variable area indicators in glass and metal tube construction, and digital local display units powered by battery, loop, or line supply, together with the flanges, unions, seals, and mounting fittings supplied as part of the device. Transmitting flow meters of every principle including Coriolis, electromagnetic, ultrasonic, vortex, thermal mass, and turbine types where a signal is output for control or recording, custody transfer metering, flow switches used solely for interlock without visual indication, level and pressure instrumentation, and process control systems are excluded. Calibration and instrument servicing sold independently sit outside scope.
Quantitative Units
USD billions (current prices); volume in millions of units shipped
Segmentation Dimensions
By Indication Mechanism; By End-Use Industry; By Distribution Channel; By Region
Regions Covered
North America, East Asia, Western Europe, South Asia and Pacific, Latin America, Middle East and Africa, Eastern Europe
Countries Covered
USA, Canada, Mexico, Germany, Switzerland, Ireland, France, Italy, Spain, UK, Netherlands, Sweden, Finland, China, Japan, South Korea, Taiwan, India, Australia, Singapore, Thailand, Vietnam, Indonesia, Brazil, Mexico, Chile, Peru, Colombia, Argentina, Saudi Arabia, United Arab Emirates, Qatar, Egypt, South Africa, Turkey, Poland, Czechia, Hungary, Romania, and additional markets relevant to this sector
Key Companies Profiled
Dwyer Instruments, Kobold Messring, Bürkert, Badger Meter, Krohne, Emerson, Brooks Instrument, Parker Hannifin, Swagelok, Georg Fischer, GEMÜ, CIRCOR, Klinger, Blue-White Industries, King Instrument, Universal Flow Monitors, Titan Enterprises, Malema Engineering, ONICON, Ernst Flow Industries
Quantitative Methodology
Primary survey, n=3,800 respondents, Q4 2025, six countries; demand-side model with trade association cross-validation
Qualitative Methodology
47 expert interviews, Q4 2025; applied to validate demand model assumptions, identify emerging dynamics, and assess competitive positioning
Report Format
PDF and XLSX data workbook (Word format preview document)
Publisher
Market Minds Advisory
Report Code
MMA-2026-CON-484
Published
August 2026
Contact
sales@marketmindsadvisory.com | www.marketmindsadvisory.com

Purchase the full Flow Indicator Market Report (2026 to 2036).

The full MMA Flow Indicator report sizes the market across five indication mechanisms, five end-use industries, four distribution channels, and seven regions through 2036. It profiles 20 participants on a consistent basis of local flow indication revenue, scoring each on certification coverage, distributor listing position, hygienic range depth, and digital capability. Scenario models quantify how process safety guidance, hazardous area procurement policy, and industrial capital cycles move both volume and achievable margin. The report also includes certification coverage benchmarking by supplier and zone, distributor listing analysis across major industrial channels, tender eligibility assessment, and hygienic range mapping for pharmaceutical and food applications.
Five-mechanism and four-channel market sizing to 2036
Twenty-participant benchmark on local flow indication revenue
Certification coverage benchmarking by supplier and zone
Distributor listing analysis across major industrial channels
Tender eligibility assessment against current procurement policy
Hygienic range mapping for pharmaceutical and food applications

Built For The People Who Decide

From boardroom strategy to bench-side execution, this report is read cover-to-cover by leaders shaping the next decade of their industry, turning demand scenarios, market dynamics and valuation benchmarks into decisions.
CXOs/ Presidents/ VPs/ Managers
M&A and Corporate Development
Strategy Teams and R&D Heads
Procurement and Product Directors
Regulatory and Compliance Leaders
Investor Relations and Equity Analysts