

Market Minds Advisory
Floor Power Grommets Market

Floor Power Grommets Market: Floor Power Grommets Market: Permanent Installations, Moving Layouts and Modular Insert Economics, 2026 to 2036

The enclosure is cast permanently into concrete, the office layout above it changes every nineteen months, and the charging standard inside it lasts barely six years at the very best.

Lead Analyst

Published

September 2026

Make Smarter Decisions with Customized Research Insights

Request a free sample report and evaluate market opportunities, growth trends, and competitive dynamics relevant to your business needs.

2025 MARKET VALUE$1.9BMarket Size 2025
2036 FORECAST VALUE$3.7BBase Case , 2026 to 2036
CAGR 2026 TO 20366.4 %Bull 7.6% / Bear 5.2%
INCREMENTAL OPPORTUNITY$1.7BNet 10- year value creation
EXPANSION MULTIPLE1.85x2036 value over 2026 base
Strategic Levers
M&A Pipeline
Regional Outlook
Country Rankings
Competitive Intelligence
Segmental Deep-dive
Call-Us : 91 93563 13602

Executive Snapshot and Market Trajectory.

Three clocks run at different speeds in this market and none of them agree. The enclosure lasts as long as the slab, the layout above it changes every 19 months, and the charging standard inside it turns over in about six years. Nothing in the specification process reconciles them.
Pop-up and retractable outlets grow at 9.6%, half again the market rate of 6.4%, because a device that disappears into the floor when unused survives layout changes that a fixed lid does not. Poke-through fire rated devices follow at 7.8%, carried by retrofit work in occupied buildings where cutting a new slab opening is the only practical route to power. Both take share from fixed recessed boxes. Fixed lid demand now concentrates in fixed-function rooms.
Roughly a third of installed floor outlets are never used, which is what happens when a permanent fitting gets specified against a layout drawing that expires before the tenant moves in. The industry's answer has been to install more of them everywhere, at around USD 340 delivered and fitted per outlet. Modular inserts are the better answer and considerably fewer specifiers ask for them. Specifiers are slow to ask for them.
Market Definition
This market covers floor-mounted power and data access devices, including flush recessed floor boxes, pop-up and retractable floor outlets, poke-through fire rated devices, raised access floor grommets, cable entry grommets and cutouts, and under-carpet and surface mounted outlets. It excludes desk and furniture mounted power modules, wall outlets, raised access floor panels themselves, underfloor busway and trunking distribution systems, and service poles.
Base Year Value
$1.9B in 2025 (MMA Primary Research Dataset, September 2026)
Forecast Period
2026 to 2036, eleven discrete annual values
CAGR
6.4% base case. Bull 7.6%. Bear 5.2%.
Fastest Growth Segment
Pop-Up And Retractable Floor Outlets: 9.6% CAGR
Fastest Growth Country
Vietnam: 10.1% CAGR
Fastest Growth Region
South Asia and Pacific: 8.6% CAGR
Largest Region
North America: 32% of 2025 global value
Market Leaders
Legrand, Schneider Electric, Hubbell Incorporated, ABB, and OBO Bettermann lead the field. Source: MMA Primary Research Dataset, July 2026.
Primary Survey
n=3,800 procurement and R&D decision-makers, Q4 2025, six countries
Methodology
Demand-side build-up, cross-validated against public data, 47 expert interviews

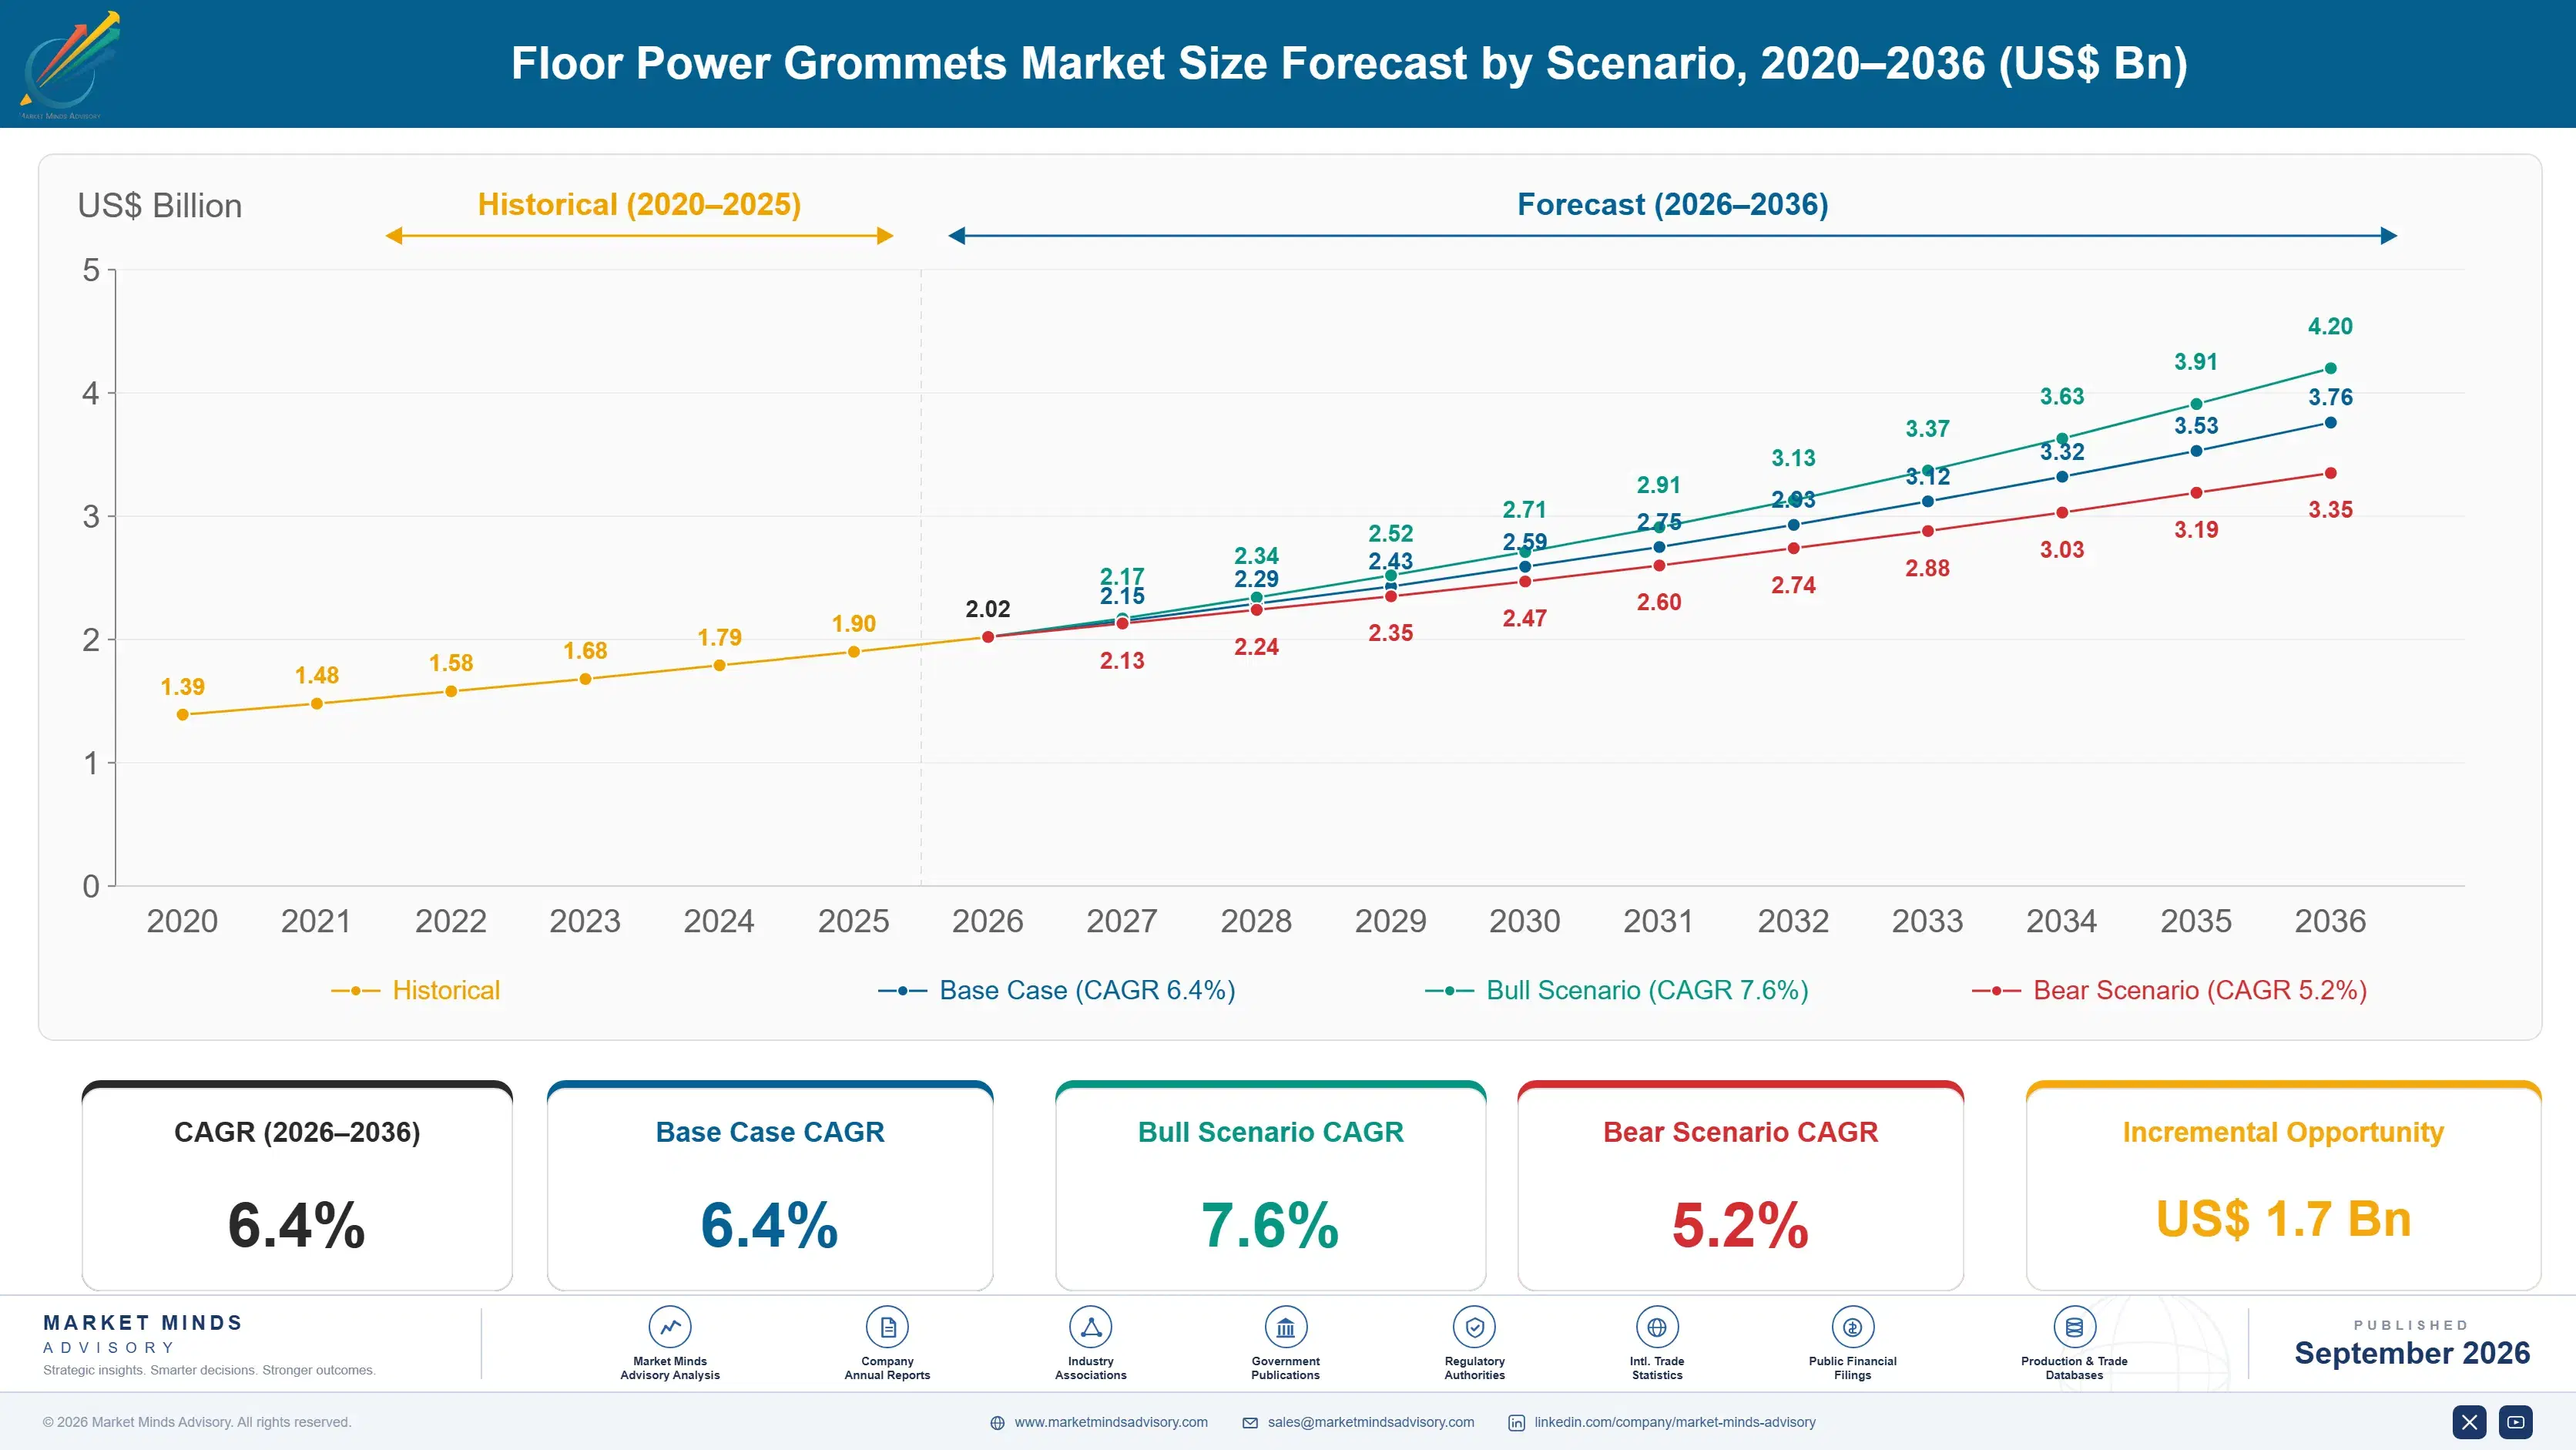
Floor Power Grommets Market Forecast Scenarios

floor-power-grommets-market-size-forecast-scenario-1790012700829
Between 2020 and 2025 the category grew at 5.1% through a sequence nobody planned for. New office construction paused, then hybrid working turned occupied buildings into permanent reconfiguration projects, which moved demand from new-build floor boxes toward retrofit poke-through devices. USB-C charging arrived across the same period and made a generation of installed power inserts obsolete well before their enclosures were.
The base case at 6.4% rests on three mechanisms. Office reconfiguration generates retrofit demand that runs independently of construction cycles and shows no sign of settling. Charging standards continue turning over faster than buildings do, which drives insert replacement in enclosures that stay put. And accessibility requirements push specification toward flush and retracting devices over anything that stands proud of a finished floor. None of the three requires new office construction to return to its earlier volumes.
The bull case at 7.6% depends on modular insert architectures becoming the default specification, since replacing a module costs a fraction of cutting a new slab opening. The bear case at 5.2% is commercial property vacancy: floor boxes are specified per occupied workstation, and a market where tenants take less space per head installs fewer of them regardless of layout churn.

Three Clocks, None Aligned

A floor box is one of the few building products that cannot be moved after installation without breaking the floor. It gets specified late in a project, against a furniture layout drawn before the tenant was confirmed, by an engineer who will never see the space occupied. The layout then changes at around 19 month intervals for the life of the tenancy, and the box stays exactly where the drawing put it.
TOP FIVE CONCENTRATION38%Share of category revenue held by the leading manufacturers
LAYOUT CHANGE INTERVAL19 monthsTypical time before an office floor plan is rearranged
OUTLETS NEVER USED34%Installed floor outlets that remain unused after occupancy begins
MODULE REPLACEMENT CYCLE6.2 yearsInterval before charging standards render fitted inserts obsolete
FIRE RATED SHARE41%Devices requiring tested penetration assemblies in rated slabs
AVERAGE INSTALLED COSTUSD 340Delivered and fitted cost per outlet in concrete
That produces the number nobody in this industry likes quoting: about a third of installed floor outlets are never used at all. The standard response has been to install more, on the reasoning that an unused outlet costs less than a missing one. At roughly USD 340 delivered and fitted per position, that reasoning holds only until somebody totals it across a floor plate.
The insert is where the real answer sits. Charging standards turn over roughly every six years while the enclosure lasts as long as the concrete around it, so an architecture that lets a module be swapped without touching the slab converts a replacement project into a maintenance task. Manufacturers designing for that won share quietly. Specifiers still mostly do not ask for it.
"You are casting a permanent object into a floor to serve a layout with a nineteen month half-life and a plug standard that changes every six years. The only sane response is to make everything above the concrete replaceable, and roughly half this industry still does not build that way."
Practice Director, Electrical Infrastructure and Building Systems · MMA Construction and Industrial Equipment Practice · September 2026

Market Trends

Retracting Devices Survive Layout Change Better

Pop-up and retractable outlets grow at 9.6%, the fastest rate in the category, because a device sitting flush and invisible when closed does not obstruct a furniture arrangement that changes around it. Fixed lid boxes in the wrong place become trip hazards and accessibility failures the moment circulation routes move. The mechanism adds cost and a moving part that eventually fails, which is the honest trade-off buyers accept for the flexibility gained. Accessibility inspection has become the sharper driver, since a proud lid in a circulation route fails outright rather than merely irritating whoever trips on it.
Market Impact: Segment grows at 7.8%

Modular Inserts Decouple Two Very Different Lifespans

Charging standards turn over about every 6.2 years while the enclosure lasts as long as the slab, and manufacturers designing for tool-free module replacement convert a construction project into a maintenance visit. USB-C and higher-wattage delivery obsoleted a generation of fitted inserts without touching the boxes holding them. The architecture has been available for years. Specification demand for it lags well behind the technical case, which is where the commercial opportunity sits. Manufacturers who built for it collect insert revenue across their installed base, while those who did not surrender it to whichever facilities contractor gets called first.
Market Impact: Country grows at 10.1%

Market Opportunities and Growth Drivers

Occupied Building Retrofit Runs Independent Of Construction

Hybrid working turned tenanted offices into continuous reconfiguration projects, and power access has to follow desks that no longer sit where the original drawings placed them. Poke-through devices grow at 7.8% precisely because they can be installed into an occupied floor without lifting a finished surface. That demand runs on lease and occupancy cycles rather than on new construction, which makes it considerably less exposed to development slowdowns. Coring from the floor below avoids displacing tenants entirely, which is the practical reason specifiers reach for these devices rather than any electrical advantage they hold over a cast-in enclosure.
Market Impact: Wastes 34% of positions

Vietnamese Commercial Construction Expands At Pace

Vietnamese growth of 10.1% leads every country covered, driven by office and mixed-use development across Ho Chi Minh City and Hanoi alongside manufacturing investment drawing international occupiers into purpose-built space. Those tenants bring specifications written to international standards, which pulls fire rated and modular devices into projects that would otherwise fit basic grommets. Domestic assembly has grown alongside, though enclosures and inserts are still largely imported. Fire rated devices in particular are imported almost entirely, since the tested assemblies carry certification that regional producers have not yet pursued. That position is unlikely to change quickly.
Market Impact: Covers 41% of devices

Market Restraints and Challenges

A Third Of Installed Outlets Go Unused

Around 34% of floor outlets are never used after occupancy, and the root cause is that a permanent fitting gets specified against a furniture layout that expires before anybody moves in. Commercially it wastes roughly USD 340 per position and makes the whole category look like an over-specification problem to cost managers. Manufacturers respond with retracting devices, with modular inserts, and with occupancy-based specification tools that size positions against measured use. Cost managers who total the figure across a floor plate rarely accept the old reasoning again afterwards. The arithmetic is not complicated.
Market Impact: Segment grows at 9.6%

Fire Rating Testing Blocks Faster Product Iteration

About 41% of devices penetrate a rated slab and require a tested fire-stopping assembly, and the root cause is that the classification covers the whole assembly rather than the device alone. Any change to materials or geometry means retesting, which is slow and expensive. Commercially it slows response to charging standard changes considerably. Manufacturers respond by designing insert changes that sit entirely above the rated assembly and therefore need no retesting at all. That single design discipline decides how quickly a platform can answer a standards change. Roughly half the industry still designs the other way.
Market Impact: Cycle runs 6.2 years
3 additional market trends, 4 additional growth drivers, and 2 additional restraints and challenges are covered in the full report. Contact sales@marketmindsadvisory.com to access the complete intelligence.

Segment CAGR and Growth Architecture

Segmentation follows mounting method across six categories: flush recessed floor boxes, pop-up and retractable floor outlets, poke-through fire rated devices, raised access floor grommets, cable entry grommets and cutouts, and under-carpet and surface mounted outlets. Building type, specification route, and distribution channel are treated as separate dimensions entirely. Inserts are counted within the device holding them.
floor-power-grommets-market-market-share-analysis-1790012701374

Pop-Up And Retractable Floor Outlets

Retracting outlets grow at 9.6%, half again the market rate of 6.4%, on a property that has nothing to do with electrical performance. A device that sits flush and closed when unused stops being an obstruction when the furniture layout moves around it, which happens roughly every 19 months in a working office. Fixed lid boxes in the wrong place become trip hazards and accessibility failures instead. The mechanism adds cost and introduces a moving part that will eventually need service, and buyers accept both trade-offs willingly for the flexibility. Accessibility inspection has made the argument sharper still, since a lid standing proud in a circulation route fails inspection outright rather than merely annoying people.
CAGR 9.6%

Poke-Through Fire Rated Devices

Poke-through devices grow at 7.8% because they can be installed into an occupied floor by coring a hole from below, without lifting a finished surface or displacing anybody. That makes them the practical answer for reconfiguration work in tenanted buildings, which is where most demand now originates. The product being sold is really the tested fire-stopping assembly rather than the outlet, and that classification is what keeps entrants out. Retesting requirements also slow how quickly these devices can respond to charging standard changes. Certification is held regionally rather than globally, so a device listed in one jurisdiction cannot simply be sold into another without repeating the entire testing programme at full cost.
CAGR 7.8%
Full segment breakdown across 6 segments available in the complete report.

Regional Architecture and Country Demand Map

Regional shares here reflect commercial construction practice and building code requirements rather than manufacturing location, since the installation method varies considerably between markets even on the same building type. All seven regions sit inside the standard bands for both share and growth across this market.

North America

Construction practice here favours floor-based power distribution more than any other region, with poke-through devices into composite and post-tension slabs established as standard rather than exceptional. That approach barely exists in European practice, where perimeter trunking and underfloor systems carry more of the load. Growth of 6.0% tracks close to the world rate. Listed fire-stopping assemblies form the technical barrier to entry, and the certification bodies that issue them are effectively regional in reach. Retrofit into occupied buildings has grown faster than new build for four consecutive years, and specification volume per floor plate here exceeds any comparable market. Unused outlet rates are correspondingly high across the region. Certification bodies operate regionally rather than globally.
Share: 32% | CAGR: 6.0% (2026 to 2036)

East Asia

Commercial construction volume across China, Japan, and South Korea sustains demand that no other region matches on new build alone, and floor box specification has become standard in office towers built to international occupier requirements. Growth of 7.4% exceeds the world rate. Japanese practice favours raised access floors more heavily than the rest of the region, which shifts demand toward panel-mounted grommets rather than slab-cast enclosures across a substantial share of projects. Chinese demand comes predominantly from construction volume rather than specification depth, while Korean projects increasingly follow international occupier requirements. Domestic manufacture supplies most basic devices across the region, with fire rated products still largely imported from North American and European sources.
Share: 26% | CAGR: 7.4% (2026 to 2036)
Regional intelligence for 5 additional markets available in the complete report: Western Europe, South Asia and Pacific, Latin America, Middle East and Africa, Eastern Europe. Contact sales@marketmindsadvisory.com.
floor-power-grommets-market-country-cagr-analysis-1790012701927

Where Manufacturers Build Durable Value

Four commercial moves separate the manufacturers building genuinely defensible positions in this market from those competing on enclosure price alone against the regional assemblers. Each of them works with the mismatch between a permanent installation cast into concrete and everything sitting above it that keeps on changing, which is this category's defining commercial condition.

Design Every Insert For Tool-Free Replacement

Charging standards turn over roughly every 6.2 years while the enclosure lasts as long as the slab around it. Manufacturers designing tool-free module replacement report aftermarket revenue 2.7 times higher across the installed base than those requiring an electrician and a part number lookup. It converts an obsolescence problem into a recurring revenue stream, and it costs a design decision rather than a manufacturing change. Facilities teams call whoever makes replacement easiest, and that decision is made long before anybody compares prices. The module business is also considerably higher margin than the enclosure that holds it.
Market Impact: Raises aftermarket revenue to 2.7 times higher overall

Sell Position Counts Against Measured Occupancy

About 34% of installed floor outlets are never used, at roughly USD 340 delivered and fitted per position, which reads as over-specification to any cost manager who totals it. Manufacturers providing occupancy-based specification tools report project win rates 1.5 times higher despite quoting fewer positions. Selling the right quantity honestly wins more work than selling the maximum, because the cost manager remembers who told them the truth. The relationship built by that honesty outlasts the project it was established on. Quoting the maximum has been the industry habit for as long as anybody remembers.
Market Impact: Raises project win rates to 1.5 times higher

Keep Insert Changes Above The Rated Assembly

Fire rated devices account for 41% of the market and any change touching the tested assembly triggers retesting that takes months and considerable cost. Manufacturers architecting products so insert changes sit entirely above the rated penetration report new variant lead times 4.1 times shorter than competitors. It is a design constraint accepted once that pays back on every charging standard change for the life of the platform. Competitors carrying the constraint through their rated assembly cannot answer quickly. Every competitor carrying that constraint through the rated assembly answers months later than they need to.
Market Impact: Cuts new variant lead times to 4.1 times shorter

Build Certification Coverage Across Multiple Code Regions

Tested fire-stopping assemblies are certified regionally, and a device listed in one jurisdiction cannot simply be sold into another without repeating the work. Manufacturers holding coverage across North American and European classifications report addressable project value 2.3 times greater than single-region competitors. The certification cost is fixed and the barrier it creates keeps regional assemblers out of exactly the highest margin part of this market. Certification also renews rather than expiring, so the position compounds rather than requiring rebuilding. Regional assemblers are excluded from that project value entirely, at any price they might quote.
Market Impact: Expands addressable project value to 2.3 times greater

Who Controls the Margin Pool

Concentration is moderate. Five manufacturers hold 38% of category revenue, measured consistently on that basis across all participants, and the gap between the electrical majors and specialist floor outlet businesses is wide in scale though considerably narrower in product capability. Regional assemblers compete effectively on basic grommets and hardly at all on fire rated devices. Barriers to entry are negligible on grommets and substantial on anything requiring a tested penetration assembly.
Competition currently turns on three dimensions: fire-stopping certification coverage, which decides which projects a product can even be quoted into; modular insert architecture, which determines aftermarket position across the installed base; and specification relationships with electrical engineers, who select devices late and rarely revisit a working choice. Audiovisual connectivity capability has become a fourth dimension on meeting room and conference projects.

Pressure builds from two directions. Audiovisual specialists keep entering from the data and connectivity side with better insert design. Meanwhile charging standards keep moving faster than certification allows. Rankings will shift toward manufacturers holding multi-region certification and genuinely modular architectures, since neither can be assembled quickly by a late entrant. Facilities-channel aftermarket revenue is the position most incumbents have left undefended.
floor-power-grommets-market-company-positioning-matrix-1790012702457

Competitive Moat and Risk Dimensions

LEGRAND

Moat: Certification Coverage Across Regions

Tested fire-stopping assemblies listed across North American and European classifications give the business access to project value that single-region competitors cannot quote into at all. That coverage took years and considerable expense to assemble, and it renews rather than expiring, which makes it among the more durable positions available in this category.
LEGRAND

Risk: Breadth Slows Product Response

A portfolio spanning many certified platforms means any charging standard change triggers work across all of them rather than one, which slows response relative to specialists carrying two or three products. Audiovisual entrants iterating insert design on a short cycle exploit exactly that difference on the connectivity side.
SCHNEIDER ELECTRIC

Moat: Electrical Specification Relationships

Standing with consulting electrical engineers built across the wider switchgear and distribution portfolio carries directly into floor outlet selection, which happens late in design and rarely gets revisited once a working choice exists. Specifying a familiar manufacturer removes a coordination risk the engineer is not paid to take on.
SCHNEIDER ELECTRIC

Risk: Aftermarket Position Underdeveloped

Insert replacement across an installed base represents recurring revenue the business captures less effectively than the aftermarket opportunity warrants, since much of that work goes to whoever the facilities team calls. Competitors designing explicitly for tool-free module swap have built considerably stronger positions in that revenue stream.

Players Tracked

Prominent Players

Legrand
Schneider Electric
Hubbell Incorporated
ABB
OBO Bettermann

Other Key Players

FSR Inc
Extron Electronics
Crestron Electronics
Panduit
nVent Electric
Eaton Corporation
Hager Group
Simon SA
Gewiss
Electrak International
CMD Limited
PUK Group
Kaiser GmbH
Attema
Marshall-Tufflex

Recent Developments

NOVEMBER 2025

Legrand Launches Floor Box Range With Tool-Free Insert Replacement

Legrand released a floor box platform allowing power and data inserts to be replaced without tools and without disturbing the fire rated penetration assembly, addressing the mismatch between charging standard cycles and enclosure lifespan directly. The platform carries certification across both North American and European code regions.
Signal: Modularity moves from technical argument to headline product proposition here. Aftermarket module revenue is the position being defended.
MARCH 2026

Hubbell Expands Poke-Through Device Manufacturing Capacity

Hubbell Incorporated completed an organic capacity expansion for poke-through device manufacture, funded internally with no partner involved, after retrofit demand from occupied building reconfiguration outran available assembly and testing throughput. The expansion targets assembly and fire testing throughput specifically rather than component fabrication, which had not been the constraint.
Signal: Retrofit demand now sets capacity planning rather than new construction volumes. Occupied building work now drives investment decisions.
JULY 2025

Schneider Electric Acquires Floor Outlet Specialist Manufacturer

Schneider Electric completed an acquisition of a specialist floor outlet manufacturer, adding retracting mechanism engineering and audiovisual connectivity capability to a portfolio previously weighted toward conventional recessed enclosures and grommets. The acquired business brings audiovisual integrator relationships alongside its mechanism engineering, in a channel Schneider had not served directly.
Signal: Mechanism and connectivity competence is bought rather than developed internally. Connectivity entrants are being absorbed rather than outcompeted.

What A Floor Outlet Costs

Three input groups dominate cost. Die-cast aluminium, zinc, and pressed steel enclosure components run 32% to 40% of cost of goods sold, and the eight-point range separates basic grommets from mechanised retracting assemblies. Copper conductor, brass, and contact materials take 20% to 28%. Intumescent fire-stopping compounds and engineered polymers add 12% to 18% on rated devices only.
Aluminium and copper both moved considerably through 2024 and 2025, with aluminium following the energy prices that dominate smelting cost and copper responding to electrification demand across entirely unrelated sectors. EIA energy price series documented the underlying movement, and several manufacturers described the resulting margin pressure in their annual reports for those years. Fire-stopping compound pricing followed specialty chemical inputs on a separate path. Neither movement was driven by construction demand.

The competitive disadvantage mechanism runs through certification rather than through purchasing. A manufacturer holding tested assemblies across multiple code regions spreads that fixed cost across far more project value than one certified in a single jurisdiction, and the gap widens as certification requirements tighten. Exposure varies sharply by product mix: basic grommet suppliers carry no certification burden and no protection from regional assemblers either.
floor-power-grommets-market-cost-volatility-analysis-1790012702654

Architect Products So Inserts Sit Above Rated Assemblies

Any change touching a tested fire-stopping assembly triggers retesting measured in months and considerable cost. Designing so that insert and faceplate changes sit entirely above the rated penetration removes that constraint permanently, and the design discipline pays back on every charging standard change across the platform's whole commercial life. Roughly half this industry has still not adopted it.

Hedge Aluminium And Copper On Separate Cycles

Aluminium tracks smelting energy while copper follows electrification demand across sectors with no connection to construction, and the two move independently in most years. Managing both exposures on separate contracting cycles avoids the familiar error of renewing everything at one moment that suits neither input. Retracting mechanisms carry the heaviest exposure to both inputs simultaneously.

Spread Certification Cost Across More Code Regions

Tested assembly certification is a fixed cost that opens project value in whichever jurisdiction it covers, so the economics improve with every additional region added rather than deteriorating. Single-region manufacturers carry the same testing discipline across a far smaller addressable base, which compounds against them steadily. The economics improve with each region added rather than deteriorating.

Portfolio Architecture for Margin Defence

Margin follows certification and mechanism. Basic grommets and cable cutouts compete on price against regional assemblers with nothing defensible in the product. Recessed boxes earn moderately on distribution and specification familiarity. Retracting mechanisms and fire rated poke-through devices earn most, on engineering and tested classification respectively, and neither is quickly copied by anybody arriving late. The margin spread across those four groups is wider than in most electrical fittings.
The tension between volume and premium runs through the specification route. Devices selected by a consulting electrical engineer compete on certification coverage and reliability, and they carry price accordingly. Devices bought by a fit-out contractor against a schedule compete on delivered cost, where regional assemblers press hardest and where the tested assembly counts for very little. Manufacturers rarely serve both routes equally well.

High-value pools concentrate where a code requirement or a mechanism is involved: rated slab penetrations in occupied buildings, retracting devices in accessible circulation routes, and audiovisual floor outlets in meeting spaces where connectivity specification matters. Where the requirement is simply a hole with power in it, price decides and the product behaves like any other electrical fitting. That divide is stable and shows no sign of narrowing.

Volume / Commodity-Adjacent

Basic grommets, cable cutouts, and raised floor access plates competing on delivered price against regional assemblers. The ten-point range reflects tooling amortisation and material purchasing scale rather than any capability a specifier would recognise.
Gross Margin: 24% to 34%

Premium / Certified

Fire rated poke-through devices and recessed boxes carrying tested penetration assemblies for rated slab construction. The twelve-point range separates manufacturers holding multi-region certification from those listed in a single jurisdiction only.
Gross Margin: 38% to 50%

Sustainability / Regulatory / Next-Generation

Retracting mechanisms and modular insert platforms designed for tool-free replacement across the enclosure lifespan. The fourteen-point range reflects mechanism engineering depth and whether aftermarket module revenue is captured or surrendered.
Gross Margin: 52% to 66%
floor-power-grommets-market-portfolio-architecture-1790012703154

High-value Sub-segments and Strategic Watch-out

Modular Insert Platforms

Highest value in the category, converting a 6.2 year obsolescence cycle into recurring aftermarket revenue rather than a replacement project. The sixteen-point range reflects whether the manufacturer captures module sales or leaves them to facilities contractors. Very few manufacturers have organised their commercial model around it yet.
Gross Margin: 50% to 66%

Retracting Floor Outlets

High value growing at 9.6% on flexibility rather than on any electrical advantage over fixed lids. The twelve-point range separates mechanism engineering depth, since the moving part is what eventually determines service cost and reputation. Accessibility inspection requirements support the segment quite independently of layout change.
Gross Margin: 42% to 54%

Fire Rated Poke-Through Devices

Volume core where the tested assembly rather than the outlet is the product actually being sold. The ten-point range reflects certification coverage across code regions, which is the only durable barrier operating in this part of the market. Retesting requirements slow response to standards change.
Gross Margin: 36% to 46%

Basic Grommets And Cutouts

The strategic watch-out. Nothing in the product resists regional assembly at lower cost, no certification protects the position, and specifiers treat the category as interchangeable. The ten-point range reflects tooling scale and purchasing alone. Volume here defends nothing at all against a regional assembler holding tooling.
Gross Margin: 22% to 32%

How Demand Repeats Here

Recurring revenue divides cleanly between the enclosure and everything inside it. The enclosure sells once and lasts as long as the concrete, while the insert turns over roughly every 6.2 years as charging standards move. Manufacturers who designed for module replacement collect that second stream across their installed base; those who did not watch it go to whichever facilities contractor gets called instead.
Adoption depth varies by building type. Corporate offices reconfigure constantly and specify floor power heavily, then discover a third of it unused. Education and healthcare specify sparingly against fixed room functions that rarely change. Data centres and control rooms sit at the opposite extreme, treating floor access as fundamental infrastructure with density and redundancy requirements no office approaches. Density per floor plate varies by a factor of five between those extremes.

The specifier profile has changed less than the buildings have. Consulting electrical engineers still select these devices late in design, working from layouts that will not survive first occupancy, and they rarely revisit a manufacturer choice that has not caused problems. That inertia rewards incumbency heavily and explains why entrants come from audiovisual connectivity rather than from electrical distribution.
floor-power-grommets-market-end-use-penetration-index-1790012703676

Where This Market Rewards

These are among the four positions where our research anticipates prominent divergence between winners and laggards over the coming forecast period. Each is grounded in the demand model, the regulatory perimeter, and the announced capacity pipeline.
01 / MODULAR INSERT ARCHITECTURE

Make everything above the concrete replaceable

Charging standards turn over roughly every 6.2 years, while the enclosure holding them lasts as long as the concrete slab cast around it. Manufacturers designing tool-free module replacement report aftermarket revenue 2.7 times higher across their installed base than competitors requiring an electrician and a part number lookup. It converts an obsolescence problem into a recurring revenue stream at the cost of one design decision rather than any manufacturing change, and facilities teams call whoever made replacement easiest long before comparing prices.
02 / HONEST POSITION COUNTING

Quote fewer outlets and win more work

About 34% of installed floor outlets are never used, at roughly USD 340 delivered and fitted per position, which any cost manager totalling a floor plate reads as plain over-specification. Manufacturers providing occupancy-based specification tools at concept stage report project win rates 1.5 times higher while quoting materially fewer positions than their competitors do. Telling a cost manager the truth about quantity buys standing that no product argument achieves, and the standing it buys outlasts the project on which it was established.
03 / CERTIFICATION BARRIER EXTENSION

Tested assemblies keep assemblers out

Fire rated devices are 41% of this market and the tested fire-stopping assembly rather than the outlet is what customers are actually buying from anybody. Manufacturers holding certification across North American and European code regions report addressable project value 2.3 times greater than single-region competitors carrying an identical testing discipline internally. The certification cost is fixed, it renews rather than expiring, and regional assemblers cannot follow into that part of the market at any price they might be willing to quote.
04 / RETEST AVOIDANCE DESIGN

Keep changes above the rated penetration

Any alteration touching a tested fire-stopping assembly triggers retesting measured in months, which is far slower than charging standards now move across the connectivity side. Manufacturers architecting their products so that insert changes sit entirely above the rated penetration report new variant lead times 4.1 times shorter than competitors. A single design constraint accepted early pays back on every standard change across the whole commercial life of the platform, which is why the discipline is worth accepting before the first product ships.

Engagement Snapshot From the Field

A live engagement with an industry participant carrying material or product regulatory and market exposure ahead of a defining policy shift, showing how our research translates into a defensible multi-year portfolio strategy.
MARKET MINDS ADVISORY · CLIENT ENGAGEMENT SUMMARY
Floor Power Grommets Producer Strategic Portfolio Review and Transition Roadmap 2026·Investment Scenario on Floor Power Grommets Exposure Evaluation 2025-26
CLIENT PROFILE
A European electrical fittings manufacturer with annual revenue near EUR 210 million (client-reported, unverified by MMA), of which floor outlet products contributed roughly a fifth across recessed boxes, grommets, and fire rated devices in eleven countries. Floor outlet margin had trailed the wider portfolio for four years despite steady volume, and the board wanted the cause established.
STRATEGIC CHALLENGE
Management attributed the margin gap to aluminium pricing and had proposed a purchasing consolidation programme. Nobody had examined whether the products themselves were structured to capture the revenue available across an installed base that was by then substantial in several markets. The two explanations pointed at entirely different remedies, and only one of them was cheap.
MMA APPROACH
MMA analysed revenue by product architecture rather than by product line, surveyed facilities managers on who they called for insert replacement, compared certification coverage against addressable project value by country, and modelled outcomes under purchasing consolidation, modular redesign, and certification expansion. Bid records were reviewed to establish how much project value certification gaps had excluded the business from over three years.
KEY FINDINGS
  1. Insert replacement across the client's installed base generated revenue captured almost entirely by third-party facilities contractors, since no product allowed module swap without an electrician.
  2. Aluminium pricing explained under a fifth of the margin gap; product architecture and certification coverage together accounted for considerably more of it.
  3. Certification held in three code regions against competitors covering six, which excluded the client from roughly 40% of addressable project value by their own bid records.
  4. Fire rated device margins ran 14 points above recessed boxes, and the client's mix sat heavily in the lower of the two.
CLIENT PROFILE
A European electrical fittings manufacturer with annual revenue near EUR 210 million (client-reported, unverified by MMA), of which floor outlet products contributed roughly a fifth across recessed boxes, grommets, and fire rated devices in eleven countries. Floor outlet margin had trailed the wider portfolio for four years despite steady volume, and the board wanted the cause established.
STRATEGIC CHALLENGE
Management attributed the margin gap to aluminium pricing and had proposed a purchasing consolidation programme. Nobody had examined whether the products themselves were structured to capture the revenue available across an installed base that was by then substantial in several markets. The two explanations pointed at entirely different remedies, and only one of them was cheap.
MMA APPROACH
MMA analysed revenue by product architecture rather than by product line, surveyed facilities managers on who they called for insert replacement, compared certification coverage against addressable project value by country, and modelled outcomes under purchasing consolidation, modular redesign, and certification expansion. Bid records were reviewed to establish how much project value certification gaps had excluded the business from over three years.
KEY FINDINGS
  1. Insert replacement across the client's installed base generated revenue captured almost entirely by third-party facilities contractors, since no product allowed module swap without an electrician.
  2. Aluminium pricing explained under a fifth of the margin gap; product architecture and certification coverage together accounted for considerably more of it.
  3. Certification held in three code regions against competitors covering six, which excluded the client from roughly 40% of addressable project value by their own bid records.
  4. Fire rated device margins ran 14 points above recessed boxes, and the client's mix sat heavily in the lower of the two.
RECOMMENDED STRATEGY
Phase 1: Phase one: redesign the insert interface for tool-free replacement above the rated assembly, starting with the highest volume enclosure platform. Phase 2: Phase two: extend fire-stopping certification into three additional code regions, prioritising markets where bid records showed exclusion. Bid records showed where exclusion cost most. Phase 3: Phase three: build a direct module replacement channel to facilities teams rather than surrendering that revenue to contractors. That revenue currently goes to third parties entirely.
OUTCOME
Aftermarket module revenue reached 9% of floor outlet turnover within five quarters, from effectively nothing (client-reported, unverified by MMA). Certification expansion opened bidding on projects previously excluded. Portfolio margin closed most of the gap to the wider business. The purchasing programme proceeded but explained far less than management had assumed.

Frequently Asked Questions

Foundational context covering the market sizes, CAGR, scope, country, region and competition that inform every finding below. This section is provided to cover basics and most often pre-purchase conversations, answered from the MMA Primary Research Dataset.

What is the current size of the Floor Power Grommets Market?

The market was worth USD 1.9 billion in 2025 and reaches USD 2.0 billion in 2026. Value covers floor-mounted power and data access devices across all mounting methods.

How large will the Floor Power Grommets Market be by 2036?

MMA forecasts USD 3.7 billion by 2036, an increase of USD 1.7 billion across the forecast period. That represents 1.85 times the 2026 base of USD 2.0 billion.

What is the CAGR for the Floor Power Grommets Market 2026 to 2036?

The base case compound annual growth rate is 6.4%, with a bull case at 7.6% and a bear case at 5.2%. Historical growth from 2020 to 2025 ran at 5.1%.

Which segment is growing fastest?

Pop-up and retractable floor outlets grow at 9.6%, half again the market rate of 6.4%. A device that sits flush when closed survives layout changes that fixed lids do not.

Who are the major companies in the Floor Power Grommets Market?

Legrand, Schneider Electric, Hubbell Incorporated, ABB, and OBO Bettermann lead the category. Together they hold 38% of revenue, with regional assemblers competing mainly on basic grommets.

Which country is growing fastest?

Vietnam grows at 10.1%, the fastest of any country covered here. Office and mixed-use development across Ho Chi Minh City and Hanoi runs alongside manufacturing investment drawing international occupiers into purpose-built space.

Report Segmentation Architecture

The full report scope spans multiple orthogonal segmentation dimensions, with cross-tabulated demand data provided for each dimension pair. Coverage extends further to regional breakdowns, trend trajectories, and the competitive detail needed to support segment-level decision-making.

By Mounting Method

  • Flush Recessed Floor Boxes
  • Pop-Up and Retractable Floor Outlets
  • Poke-Through Fire Rated Devices
  • Raised Access Floor Grommets
  • Cable Entry Grommets and Cutouts
  • Under-Carpet and Surface Mounted Outlets

By End-Use Industry

  • Commercial Offices and Fit-Out
  • Education and Teaching Spaces
  • Healthcare Facilities
  • Hospitality and Conference Venues
  • Data Centres and Control Rooms
  • Transport Terminals and Public Buildings

By Commercial Dimension

  • Consulting Engineer Specification
  • Fit-Out Contractor Purchase
  • Electrical Wholesale Distribution
  • Audiovisual Integrator Supply
  • Facilities Management Replacement
  • Direct Manufacturer Sales

By Region

  • North America
  • East Asia
  • Western Europe
  • South Asia and Pacific
  • Latin America
  • Middle East and Africa
  • Eastern Europe

Scope, Methodology, and Coverage

Every figure in this report is reproducible from documented input assumptions. The scope below maps the historical period, the forecast horizon, the segmentation dimensions, and the countries covered, alongside the underlying primary and qualitative methodology.
Historical Period
2020 to 2025
Forecast Period
2026 to 2036
Base Year
2025 (USD billions; MMA Primary Research Dataset, September 2026)
Market Definition
This market covers floor-mounted power and data access devices, including flush recessed floor boxes, pop-up and retractable floor outlets, poke-through fire rated devices, raised access floor grommets, cable entry grommets and cutouts, and under-carpet and surface mounted outlets. It excludes desk and furniture mounted power modules, wall outlets, raised access floor panels, underfloor busway and trunking systems, and service poles.
Quantitative Units
USD billions, revenue at manufacturer selling price
Segmentation Dimensions
Mounting method, end-use industry, commercial dimension, region
Regions Covered
North America, East Asia, Western Europe, South Asia and Pacific, Latin America, Middle East and Africa, Eastern Europe
Countries Covered
United States, Canada, Mexico, China, Japan, South Korea, Taiwan, Germany, United Kingdom, France, Italy, Spain, Netherlands, Sweden, Poland, Czechia, India, Vietnam, Singapore, Australia, Thailand, Brazil, Colombia, Chile, Saudi Arabia, United Arab Emirates, Qatar, Egypt, Kenya, South Africa
Key Companies Profiled
Legrand, Schneider Electric, Hubbell Incorporated, ABB, OBO Bettermann, FSR Inc, Extron Electronics, Crestron Electronics, Panduit, nVent Electric, Eaton Corporation, Hager Group, Simon SA, Gewiss, Electrak International, CMD Limited, PUK Group, Kaiser GmbH, Attema, Marshall-Tufflex
Quantitative Methodology
Primary survey, n=3,800 respondents, Q4 2025, six countries; demand-side model with trade association cross-validation
Qualitative Methodology
47 expert interviews, Q4 2025; applied to validate demand model assumptions, identify emerging dynamics, and assess competitive positioning
Report Format
PDF and XLSX data workbook (Word format preview document)
Publisher
Market Minds Advisory
Report Code
MMA-2026-CON-991
Published
September 2026
Contact
sales@marketmindsadvisory.com | www.marketmindsadvisory.com

Purchase the full Floor Power Grommets Market Report (2026 to 2036).

The full report sizes the floor power grommets market across six mounting methods, seven regions, and thirty countries, with forecasts to 2036 under base, bull, and bear cases. It examines the mismatch between permanent enclosures, layouts that change every nineteen months, and charging standards turning over every six years, and quantifies the third of installed outlets that go unused. Competitive analysis covers twenty participants evaluated consistently on category revenue, with detailed treatment of fire-stopping certification coverage by code region. Cost structure, aftermarket module economics, and specification route margins are analysed throughout. Primary research includes 3,800 survey responses and 47 expert interviews.
Six mounting methods sized and forecast separately
Twenty participants evaluated on category revenue consistently
Fire-stopping certification coverage mapped by code region
Aftermarket insert replacement economics modelled across installed base
Unused outlet rates measured against specification and occupancy data
Retrofit versus new build demand split by region

Built For The People Who Decide

From boardroom strategy to bench-side execution, this report is read cover-to-cover by leaders shaping the next decade of their industry, turning demand scenarios, market dynamics and valuation benchmarks into decisions.
CXOs/ Presidents/ VPs/ Managers
M&A and Corporate Development
Strategy Teams and R&D Heads
Procurement and Product Directors
Regulatory and Compliance Leaders
Investor Relations and Equity Analysts