Market Minds Advisory
Floor Degreasers Market

Floor Degreasers Market: Floor Degreasers Market: Dilution Compliance, Alkalinity Trade-Offs and Liability-Driven Specification, 2026 to 2036

The chemistry almost never fails in this market. The dilution does, because most operatives mix by eye and give roughly a fifth of the contact time the label asks for.

Lead Analyst

Published

September 2026

Make Smarter Decisions with Customized Research Insights

Request a free sample report and evaluate market opportunities, growth trends, and competitive dynamics relevant to your business needs.

2025 MARKET VALUE$3.2BMarket Size 2025
2036 FORECAST VALUE$5.8BBase Case , 2026 to 2036
CAGR 2026 TO 20365.4 %Bull 6.6% / Bear 4.2%
INCREMENTAL OPPORTUNITY$2.4BNet 10- year value creation
EXPANSION MULTIPLE1.71x2036 value over 2026 base
Strategic Levers
M&A Pipeline
Regional Outlook
Country Rankings
Competitive Intelligence
Segmental Deep-dive
Call-Us : 91 93563 13602

Executive Snapshot and Market Trajectory.

Only 31% of applications are mixed within the dilution range the label specifies, and operatives give about 22% of the stated dwell time. A good product used that way performs worse than a mediocre one used correctly. Every performance complaint in this category is really a dosing complaint.
Enzymatic and biological degreasers grow at 8.1%, half again the market rate of 5.4%, and they are also the chemistry least compatible with how the work actually gets done. Enzymes need contact time and temperature that a kitchen closedown at midnight rarely allows. Neutral pH daily products follow at 7.3%, and they suit the shift pattern considerably better. Periodic alkaline deep cleaning still runs alongside them.
The alkalinity trade-off is the quieter problem. High-pH builders cut grease fastest and attack the floor doing it, so kitchen flooring is replaced at around 6.8 years where the substrate would otherwise last far longer. Almost nobody prices that against the chemical saving, and the two budgets sit with different people. Underneath both sits slip liability rather than cleanliness, and underwriters now ask operators what they use before agreeing terms. That question changed everything.
Market Definition
This market covers chemical formulations supplied for removing grease, oil, and fatty soils from hard floor surfaces in commercial, industrial, and institutional settings, including alkaline built degreasers, solvent-based degreasers, enzymatic and biological degreasers, terpene and citrus degreasers, neutral pH daily degreasers, and encapsulating and emulsifying degreasers. It excludes general purpose floor cleaners without degreasing function, floor finishes, sealers and strippers, equipment and machinery degreasers, household consumer products, and cleaning machinery.
Base Year Value
$3.2B in 2025 (MMA Primary Research Dataset, September 2026)
Forecast Period
2026 to 2036, eleven discrete annual values
CAGR
5.4% base case. Bull 6.6%. Bear 4.2%.
Fastest Growth Segment
Enzymatic And Biological Degreasers: 8.1% CAGR
Fastest Growth Country
Indonesia: 9.6% CAGR
Fastest Growth Region
South Asia and Pacific: 7.5% CAGR
Largest Region
East Asia: 29% of 2025 global value
Market Leaders
Ecolab, Solenis, Zep Inc, Betco Corporation, and State Industrial Products lead the field. Source: MMA Primary Research Dataset, July 2026.
Primary Survey
n=3,800 procurement and R&D decision-makers, Q4 2025, six countries
Methodology
Demand-side build-up, cross-validated against public data, 47 expert interviews

Floor Degreasers Market Forecast Scenarios

floor-degreasers-market-size-forecast-scenario-1790013366338
Between 2020 and 2025 the category grew at 4.3% through a disrupted period for its main end markets. Food service volumes collapsed and recovered, industrial floor area kept expanding through both, and hygiene attention raised specification standards without much changing how the work was performed on the ground. Concentrate took share from ready-to-use formats throughout, on freight cost rather than performance.
The base case at 5.4% rests on three mechanisms. Slip and fall liability continues driving specification in North America and increasingly elsewhere, since insurers now ask what is being used. Organised food service expands rapidly across Southeast Asia and India, creating floor area that did not previously exist. And dosing systems spread, which raises effective consumption by correcting the dilution most sites currently get wrong. None of the three requires food service volumes to grow beyond current levels.
The bull case at 6.6% depends on dispenser-linked concentrate becoming the default supply model, which would fix dilution compliance and raise measured chemical usage simultaneously. The bear case at 4.2% is contract cleaning price pressure: facilities budgets are squeezed hardest on consumables, and a purchasing team comparing price per litre without regard to dilution will always choose the cheaper product.

What Actually Goes Wrong

Almost every performance complaint in this category is a dilution complaint wearing different clothes. Field observation finds 31% of applications mixed inside the label range, with the rest guessed from a jug, and dwell times running at roughly a fifth of what the formulation was designed around. The chemistry is then blamed, the specifier changes brand, and the new product fails in exactly the same way.
TOP FIVE CONCENTRATION33%Share of category revenue held by the leading suppliers
CORRECT DILUTION COMPLIANCE31%Applications mixed within the range the label specifies
DWELL TIME ACHIEVED22%Proportion of stated label contact time given in practice
CONCENTRATE FORMAT SHARE68%Volume sold as concentrate rather than ready to use
FLOOR REPLACEMENT INTERVAL6.8 yearsTypical kitchen flooring life under repeated high alkalinity
SLIP CLAIM COST SHARE44%Liability claims in food service attributed to grease
The alkalinity question is more expensive and much less discussed. High-pH built degreasers cut grease fastest, and repeated exposure degrades sealed concrete, vinyl, terrazzo, and natural stone. Commercial kitchen flooring is being replaced at around 6.8 years where the substrate itself would last considerably longer. The chemical budget and the capital works budget sit with different people, so nobody ever compares the two numbers.
Underneath both sits liability rather than cleanliness. Grease residue accounts for roughly 44% of slip claim cost in food service, and insurers increasingly ask operators what product is specified and how it is dosed. That question has done more to change purchasing behaviour than any performance claim, because it converts a consumables decision into a risk management one with a documented answer.
"Nobody in this market has a chemistry problem. They have a jug of concentrate, a mop bucket, and somebody at eleven at night who has been told to be finished by half past. Fix the dosing and the product you already bought starts working, which is not what most suppliers want to hear."
Practice Director, Industrial and Institutional Cleaning Chemistry · MMA Chemicals and Materials Practice · September 2026

Market Trends

Dispenser-Linked Concentrate Now Replaces Manual Dilution

Concentrate now accounts for 68% of volume, and the products travelling with a wall-mounted dosing unit perform very differently from those poured out of a jug. Dilution compliance rises from around 31% to well above ninety where dispensers are installed and maintained, which usually resolves the performance complaint the site had been raising. Suppliers gain something more valuable than a sale, since a dispenser plumbed into a wall makes switching brands a physical undertaking. Usage data logged by the unit also answers the documentation question underwriters increasingly put to operators.
Market Impact: Covers 44% of claims
Enzymes Grow Fastest And Fit Practice Worst

Enzymatic degreasers grow at 8.1%, the fastest rate here, on drain-line benefits and effluent compliance that alkaline chemistry cannot match at all. They also need contact time measured in tens of minutes and temperatures a cooling kitchen floor does not hold, which is precisely what a midnight closedown cannot provide. The segment growing quickest is therefore the one least suited to how the work is actually performed on most sites. Sites that restructured their cleaning schedule around the chemistry report the results the label promises, and the large majority of sites have made no such change at all.
Market Impact: Country grows at 9.6%

Market Opportunities and Growth Drivers

Insurers Now Ask What Product Is Specified

Grease residue accounts for roughly 44% of slip claim cost across food service, and liability underwriters increasingly require operators to document which degreaser is used and how it is dosed before quoting terms. That converts a consumables purchase into a risk management decision with an auditable answer, which moves it away from the lowest price per litre. The change has done more for premium specification than any performance argument the industry ever made. Operators with documented dosing practice have secured better terms, which gives a facilities team a financial argument that cleaning performance alone never provided.
Market Impact: Cuts floor life to 6.8 years

Southeast Asian Organised Food Service Expands Rapidly

Indonesian growth of 9.6% leads every country covered, driven by quick service restaurant and organised food retail expansion creating commercial kitchen floor area at a pace no mature market approaches. Malaysian, Vietnamese, and Filipino demand follows a comparable path. These operators specify to international chain standards from the outset, which pulls professional degreaser chemistry into sites that would previously have used general purpose cleaner. Local blending capacity has grown alongside the demand, since freight on diluted product is uneconomic and concentrate blending plants are inexpensive to establish once volumes justify one. Import dependence has fallen accordingly.
Market Impact: Affects 68% of volume

Market Restraints and Challenges

High Alkalinity Shortens Floor Life Considerably

Built alkaline degreasers cut grease fastest and degrade the substrate while doing it, with commercial kitchen flooring replaced at around 6.8 years where it should last far longer. The root cause is that hydroxide attacks cementitious and resilient surfaces cumulatively rather than immediately, so damage appears long after the purchasing decision. Commercially the chemical budget and capital works budget sit with different people. Suppliers respond with buffered systems and substrate-matched product recommendations. Buffered chemistry cleans measurably less well, which is the trade-off nobody wants to state plainly. Nobody wants to state that plainly.
Market Impact: Covers 68% of volume

Price Per Litre Comparison Defeats Dilution Economics

Facilities purchasing teams compare concentrate prices per litre without adjusting for dilution ratio, so a product diluting at one in a hundred loses to one diluting at one in twenty on the quotation sheet. The root cause is that procurement systems record purchase price rather than cost in use. Commercially it drives specification toward weaker chemistry. Suppliers respond with cost-in-use calculators, dispenser-linked supply, and contracts priced per square metre cleaned. Presenting the arithmetic where the decision is actually taken remains the harder part of the problem. Buyers accept the arithmetic readily once shown.
Market Impact: Segment grows at 8.1%
4 additional market trends, 3 additional growth drivers, and 2 additional restraints and challenges are covered in the full report. Contact sales@marketmindsadvisory.com to access the complete intelligence.

Segment CAGR and Growth Architecture

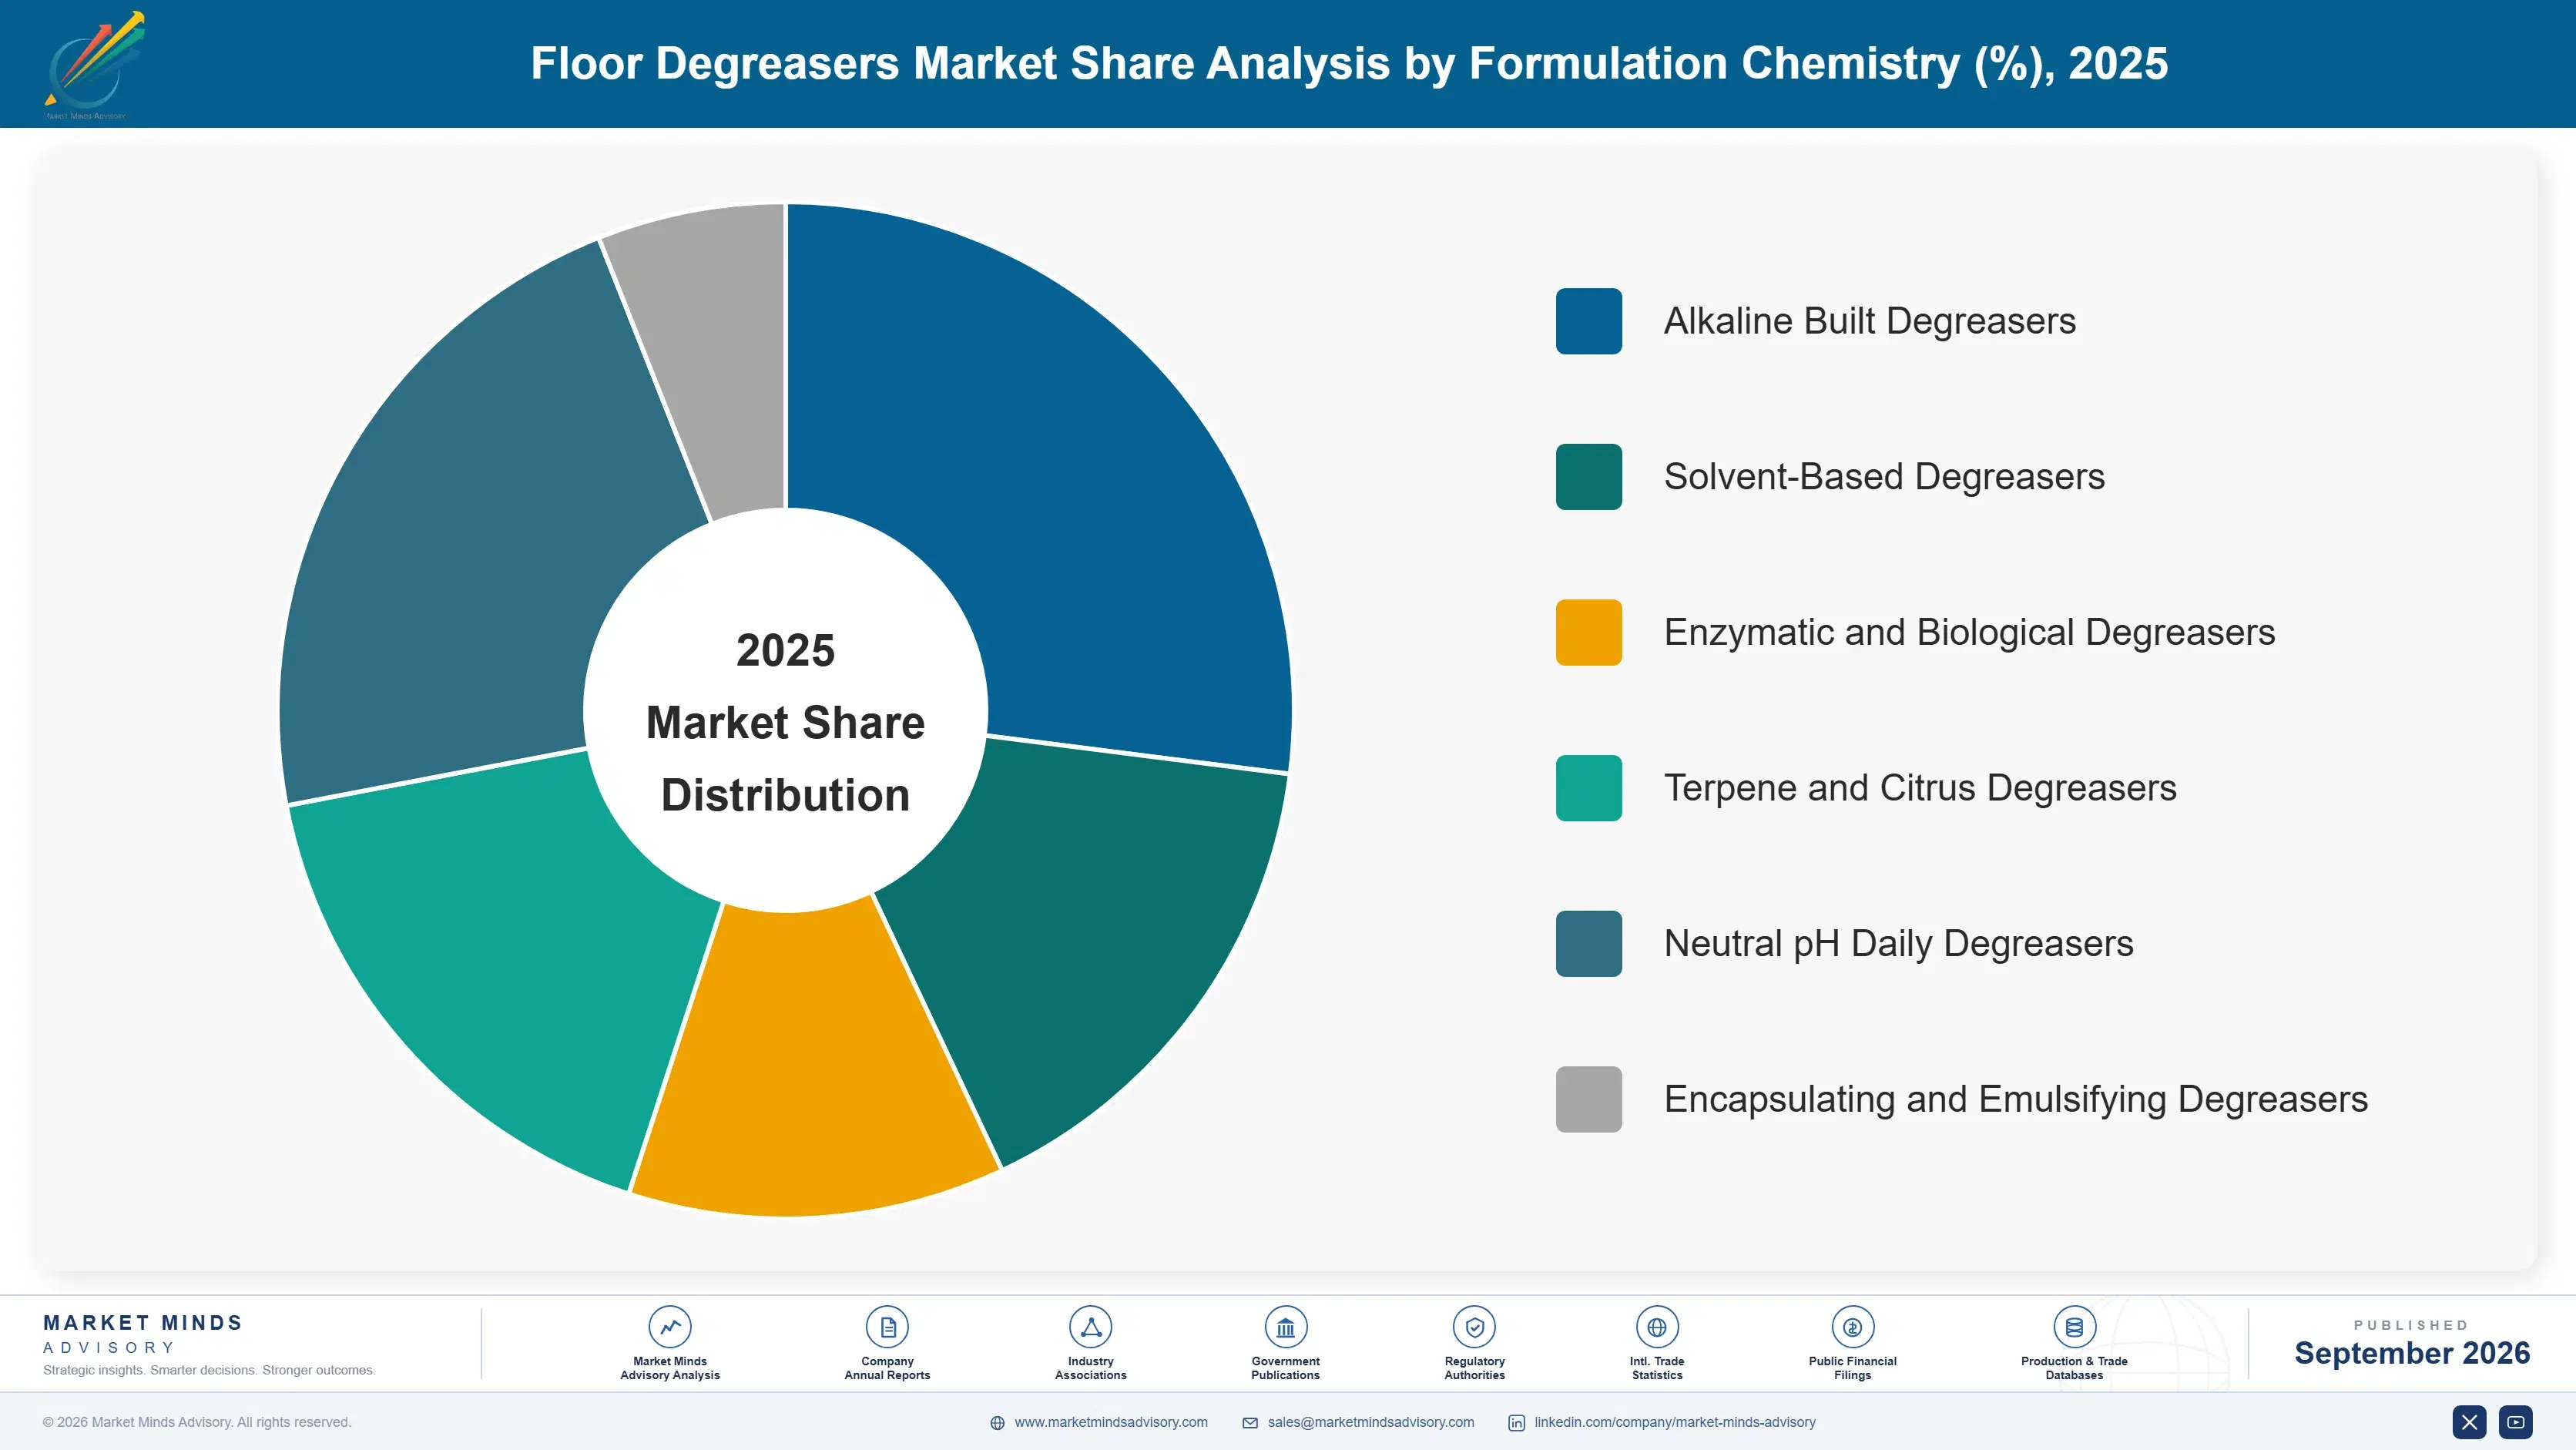
Segmentation follows formulation chemistry across six categories: alkaline built degreasers, solvent-based degreasers, enzymatic and biological degreasers, terpene and citrus degreasers, neutral pH daily degreasers, and encapsulating and emulsifying degreasers. Supply format, end-use setting, and dosing method are treated as separate dimensions rather than mixed into this hierarchy. Dispenser hardware is treated separately from the chemistry it delivers.
floor-degreasers-market-market-share-analysis-1790013366896

Enzymatic And Biological Degreasers

Enzymatic degreasers grow at 8.1%, half again the market rate of 5.4%, on benefits that appear downstream rather than on the floor. Lipase and protease systems continue working in drain lines and grease traps, which reduces blockage callouts and helps with effluent discharge limits that alkaline chemistry actively worsens. The difficulty is operational rather than chemical: enzymes need contact time in tens of minutes and a warm surface, and a closedown crew working to a finish time gives neither. Sites that restructured their cleaning schedule around the chemistry report results the label promises, and most sites have not. Effluent limits rather than floor appearance are what pull this chemistry forward commercially.
CAGR 8.1%

Neutral pH Daily Degreasers

Neutral pH daily products grow at 7.3% by fitting the way sites actually work rather than by cleaning better than anything else. They tolerate the short dwell times a closedown allows, they do not attack sealed concrete, vinyl, or terrazzo, and they can be used daily without the substrate damage that built alkaline chemistry accumulates over years. Grease removal is genuinely weaker per application, which matters less than it sounds when the alternative is a strong product diluted wrongly. Periodic alkaline deep cleaning still runs alongside, which is the sensible combination most specifiers reach eventually. Substrate compatibility documentation is what justifies the premium these products carry over commodity alkaline concentrate.
CAGR 7.3%
Full segment breakdown across 6 segments available in the complete report.

Regional Architecture and Country Demand Map

Regional shares here reflect the commercial and industrial floor area held under professional cleaning contract rather than population or manufacturing output, since consumption follows contracted square metres directly. All seven regions sit inside the standard bands for both share and growth across this particular market.

East Asia

Commercial kitchen and industrial floor area across China, Japan, and South Korea exceeds any other region, and food processing plants in particular consume degreaser at volumes food service never approaches per site. Growth of 6.4% runs above the world rate. Japanese operators hold the strongest dosing discipline observed anywhere, with dispenser penetration well above the world average. Chinese demand skews toward alkaline built chemistry on price, and substrate damage from that choice is correspondingly widespread across the market. Korean food processing has adopted enzymatic chemistry faster than the regional average, driven by discharge limits tightening around industrial effluent over recent years. Substrate damage from that choice is widespread and rarely costed against the chemical saving anywhere in the region.
Share: 29% | CAGR: 6.4% (2026 to 2036)

North America

Slip and fall liability drives specification here more than anywhere, with underwriters routinely asking operators to document which product is used and how it is dosed before agreeing terms. Growth of 4.8% is moderate. Quick service restaurant density is the highest of any region, and chain specification means a single decision covers thousands of sites at once. Dispenser-linked supply is well established, which is why measured dilution compliance sits above the world figure. Regional blenders compete hard on price per litre into independent operators and contract cleaning firms, where no dispenser estate exists and procurement compares purchase price rather than cost in use across the tender. Chain estates behave entirely differently.
Share: 28% | CAGR: 4.8% (2026 to 2036)
Regional intelligence for 5 additional markets available in the complete report: Western Europe, South Asia and Pacific, Latin America, Middle East and Africa, Eastern Europe. Contact sales@marketmindsadvisory.com.
floor-degreasers-market-country-cagr-analysis-1790013367422

Where Suppliers Build Durable Accounts

Four commercial moves separate suppliers holding accounts for years from those winning a tender and losing it at the next review on price. Each addresses one of the honest weaknesses here: dilution failure, substrate damage, procurement arithmetic, and the fact that liability now decides more than performance. Only one of the four involves the chemistry itself at all.

Put A Dispenser On Every Wall

Dilution compliance runs at roughly 31% where product is poured from a jug and rises above ninety where a maintained dosing unit is fitted, which usually resolves the performance complaint the site had been making. Suppliers installing dispensers report account retention 3.2 times higher than those supplying concentrate alone. A unit plumbed into a wall makes switching a physical undertaking rather than a purchase order amendment, which is worth more than the chemistry. Maintenance visits also generate the dosing records underwriters ask for. Hardware cost is recovered within the first contract term.
Market Impact: Raises account retention rates to 3.2 times higher

Price The Floor Alongside The Chemical

Built alkaline chemistry shortens kitchen flooring life to around 6.8 years against substrates that would otherwise last far longer, and the capital cost of that sits with a different budget holder entirely. Suppliers presenting combined chemical and flooring lifecycle cost report specification wins 2.3 times higher on multi-site accounts. It converts a consumables conversation into a facilities cost one, which is a room where premium chemistry can be defended properly. Estates teams recognise the number immediately once somebody puts it in front of them, and they have generally never seen it presented alongside a chemical quotation before.
Market Impact: Raises specification win rates to 2.3 times higher

Quote Cost In Use Not Price Per Litre

Procurement systems record purchase price rather than diluted cost, so a concentrate diluting at one in a hundred loses to one diluting at one in twenty on any quotation sheet. Suppliers providing cost-in-use calculations at tender report win rates 1.9 times higher against cheaper headline prices. The arithmetic is simple, buyers accept it readily once shown, and remarkably few suppliers bother to present it at the point where the decision is made. The comparison also exposes weak chemistry that survives only on headline price. Weak chemistry surviving on headline price is exposed immediately.
Market Impact: Raises tender win rates to 1.9 times higher

Sell Into The Insurance Conversation Directly

Grease accounts for roughly 44% of slip claim cost in food service, and underwriters now ask operators to document product and dosing before agreeing terms. Suppliers providing that documentation as a standard service report account values 2.6 times greater than those supplying product alone. It moves the purchase out of consumables procurement into risk management, where price per litre is no longer the governing consideration for anybody involved. Very few suppliers currently offer the documentation as a standard part of supply, which leaves the position open to whoever builds the reporting first.
Market Impact: Raises average account values to 2.6 times greater

Who Controls the Margin Pool

Concentration is moderate. Five suppliers hold 33% of category revenue, measured consistently on that basis across all participants, and the gap between the integrated service majors and regional blenders is wide in service capability while considerably narrower in formulation. Dispenser installed base rather than product performance is what separates the leaders from the rest. Barriers to entry in blending are minimal, which is why the field never consolidates despite decades of acquisition activity across the sector.
Competition currently turns on three dimensions: dispenser installed base, which makes switching physical rather than administrative; documentation service supporting liability and effluent compliance; and substrate-matched product recommendation, where suppliers who advise honestly on alkalinity hold accounts that price competition cannot easily take. Cost-in-use presentation is a fourth dimension, and it decides tenders where procurement would otherwise compare purchase price alone across quotations.

Pressure builds from two directions. Regional blenders undercut on price per litre where procurement compares that number. Meanwhile contract cleaning budgets tighten across mature markets. Rankings will shift toward suppliers holding dispenser estates and insurance documentation capability, since neither can be assembled at tender speed. Effluent competence is becoming a fourth differentiator as discharge limits tighten across mature markets.
floor-degreasers-market-company-positioning-matrix-1790013367940

Competitive Moat and Risk Dimensions

ECOLAB

Moat: Installed Dispenser Estate Scale

A dispenser estate built across decades makes brand switching a physical operation involving plumbing and site visits rather than a purchase order change, which protects accounts through procurement reviews that pure product suppliers routinely lose. Service engineers visiting sites also generate the dosing compliance data that supports the liability documentation customers increasingly require.
ECOLAB

Risk: Premium Position Under Budget Pressure

Contract cleaning budgets are squeezed hardest on consumables, and a facilities buyer comparing price per litre without adjusting for dilution reaches an unfavourable conclusion. Defending premium pricing depends on cost-in-use arithmetic reaching the person making the decision, which does not always happen inside larger organisations.
SOLENIS

Moat: Water And Effluent Competence

Depth in water treatment chemistry transfers directly into drain-line and effluent outcomes, which is where enzymatic degreasers earn their premium and where alkaline chemistry actively creates problems. That capability addresses a compliance question customers face regardless of how clean the floor looks, and few floor care specialists can speak to it credibly.
SOLENIS

Risk: Enzyme Practice Gap Persists

Enzymatic products need dwell time and warmth that closedown crews working to a finish time do not provide, so field results routinely fall short of laboratory performance. Customers attribute the shortfall to the product rather than to the schedule, and correcting that requires operational change the supplier cannot impose on a site.

Players Tracked

Prominent Players

Ecolab
Solenis
Zep Inc
Betco Corporation
State Industrial Products

Other Key Players

Spartan Chemical Company
NCH Corporation
Simoniz USA
Buckeye International
Hillyard
Charlotte Products
Nyco Products
ITW Pro Brands
Kiehl Group
Dr. Schnell
Werner and Mertz
Christeyns
Bio-Circle Surface Technology
Chemische Fabrik Dr. Weigert
Nilfisk

Recent Developments

JANUARY 2026

Ecolab Launches Closed-Loop Dosing Unit For Degreaser Concentrate

Ecolab released a closed-loop dosing unit supplied with degreaser concentrate cartridges, removing manual dilution entirely and logging usage data that operators can present to liability underwriters as documented evidence of dosing practice. The cartridge format also removes any opportunity for site staff to over-concentrate the mix.
Signal: Switching a brand now becomes a plumbing decision rather than a simple purchase order amendment anywhere.
JULY 2025

Solenis Expands Enzymatic Degreaser Concentrate Capacity

Solenis completed an organic capacity expansion for enzymatic degreaser concentrate production, funded internally with no partner involved, after effluent compliance demand across European food processing outran available blending and stabilisation throughput. Enzyme stabilisation had been the limiting step rather than blending capacity itself. Output serves European and North American markets.
Signal: Effluent limits rather than floor cleanliness are pulling enzymatic volume forward. Discharge limits now drive investment more than cleaning does.
NOVEMBER 2025

Zep Acquires Industrial Degreaser Specialist

Zep Inc completed an acquisition of an industrial degreaser specialist, adding heavy-duty food processing formulations and substrate compatibility data to a portfolio previously weighted toward commercial food service and general facilities work. The acquired business brings six years of substrate exposure records across several flooring types.
Signal: Substrate compatibility data is being bought rather than generated internally. Compatibility evidence takes many years to accumulate independently.

What A Degreaser Costs

Three input groups dominate cost. Surfactants and alkaline builders run 34% to 42% of cost of goods sold, and the eight-point range separates commodity caustic and silicate systems from engineered low-foam surfactant blends. Solvents including glycol ethers and terpenes take 20% to 28%. Packaging, water, and freight add 18% to 26%, which is why concentrate has taken 68% of volume from ready-to-use formats.
Caustic soda and ethylene oxide derivative pricing moved considerably through 2024 and 2025 as chlor-alkali and oxidation capacity adjusted to demand across several unrelated sectors simultaneously, and American Chemistry Council data documented the underlying movement. Several formulators described the resulting margin pressure in their annual reports for those years. Terpene pricing followed citrus harvest conditions on a completely separate path throughout. None of the three moved for reasons connected to cleaning demand.

The competitive disadvantage mechanism runs through service rather than through blending cost. A regional blender matching a major on formulation still competes on price per litre alone, while a supplier with a dispenser estate and dosing documentation competes on a basis the blender cannot enter at all. Exposure varies by model: product-only suppliers carry full price exposure, while service-attached suppliers convert it into contract revenue.
floor-degreasers-market-cost-volatility-analysis-1790013368139

Attach Dosing Hardware To Every Concentrate Contract

Dilution compliance at roughly 31% means most sites are effectively buying a weaker product than the one specified, then blaming the chemistry when results disappoint everybody. Hardware fixes that at modest cost, and it makes brand switching a physical operation rather than a purchase order amendment at the next procurement review. The hardware pays for itself in retained accounts.

Blend Regionally To Remove Diluted Product Freight

Packaging, water, and freight run up to 26% of cost of goods sold, which is why concentrate has taken most of the volume from ready-to-use formats already. Regional blending near demand removes most of the remaining freight burden, and blending plants are inexpensive to establish once volumes justify them. Regional blending also shortens lead times considerably.

Contract Caustic And Solvent On Separate Cycles

Caustic soda follows chlor-alkali economics while glycol ethers track oxidation capacity and terpenes follow citrus harvests, so all three inputs move independently across most years. Managing them on separate contracting cycles avoids renewing everything at a single moment that suits none of the three. Terpene supply in particular tightens whenever citrus harvests disappoint, entirely independently of anything happening in petrochemicals.

Portfolio Architecture for Margin Defence

Margin follows service attachment rather than chemistry. Commodity alkaline concentrate competes on price per litre against regional blenders with equivalent formulations. Solvent and terpene products earn moderately on performance perception. Enzymatic systems earn better on effluent outcomes, and dispenser-linked supply earns most, because the hardware converts a repeat purchase into a contract that survives procurement review. The margin spread across those four groups is wide for a consumable input.
The tension between volume and premium runs through who makes the decision. A facilities buyer comparing quotations chooses the cheapest litre and the site then underperforms. A risk or operations manager assessing slip liability and floor lifecycle chooses differently and pays considerably more, and the supplier's whole task is reaching the second person rather than the first.

High-value pools concentrate where consequences are documented: food service chains facing slip liability, food processors under effluent discharge limits, and multi-site operators calculating flooring replacement across estates. Where cleaning is a line item in a contract cleaning tender with no measured outcome attached, price decides and any competent alkaline concentrate will do. That divide follows documentation rather than site type.

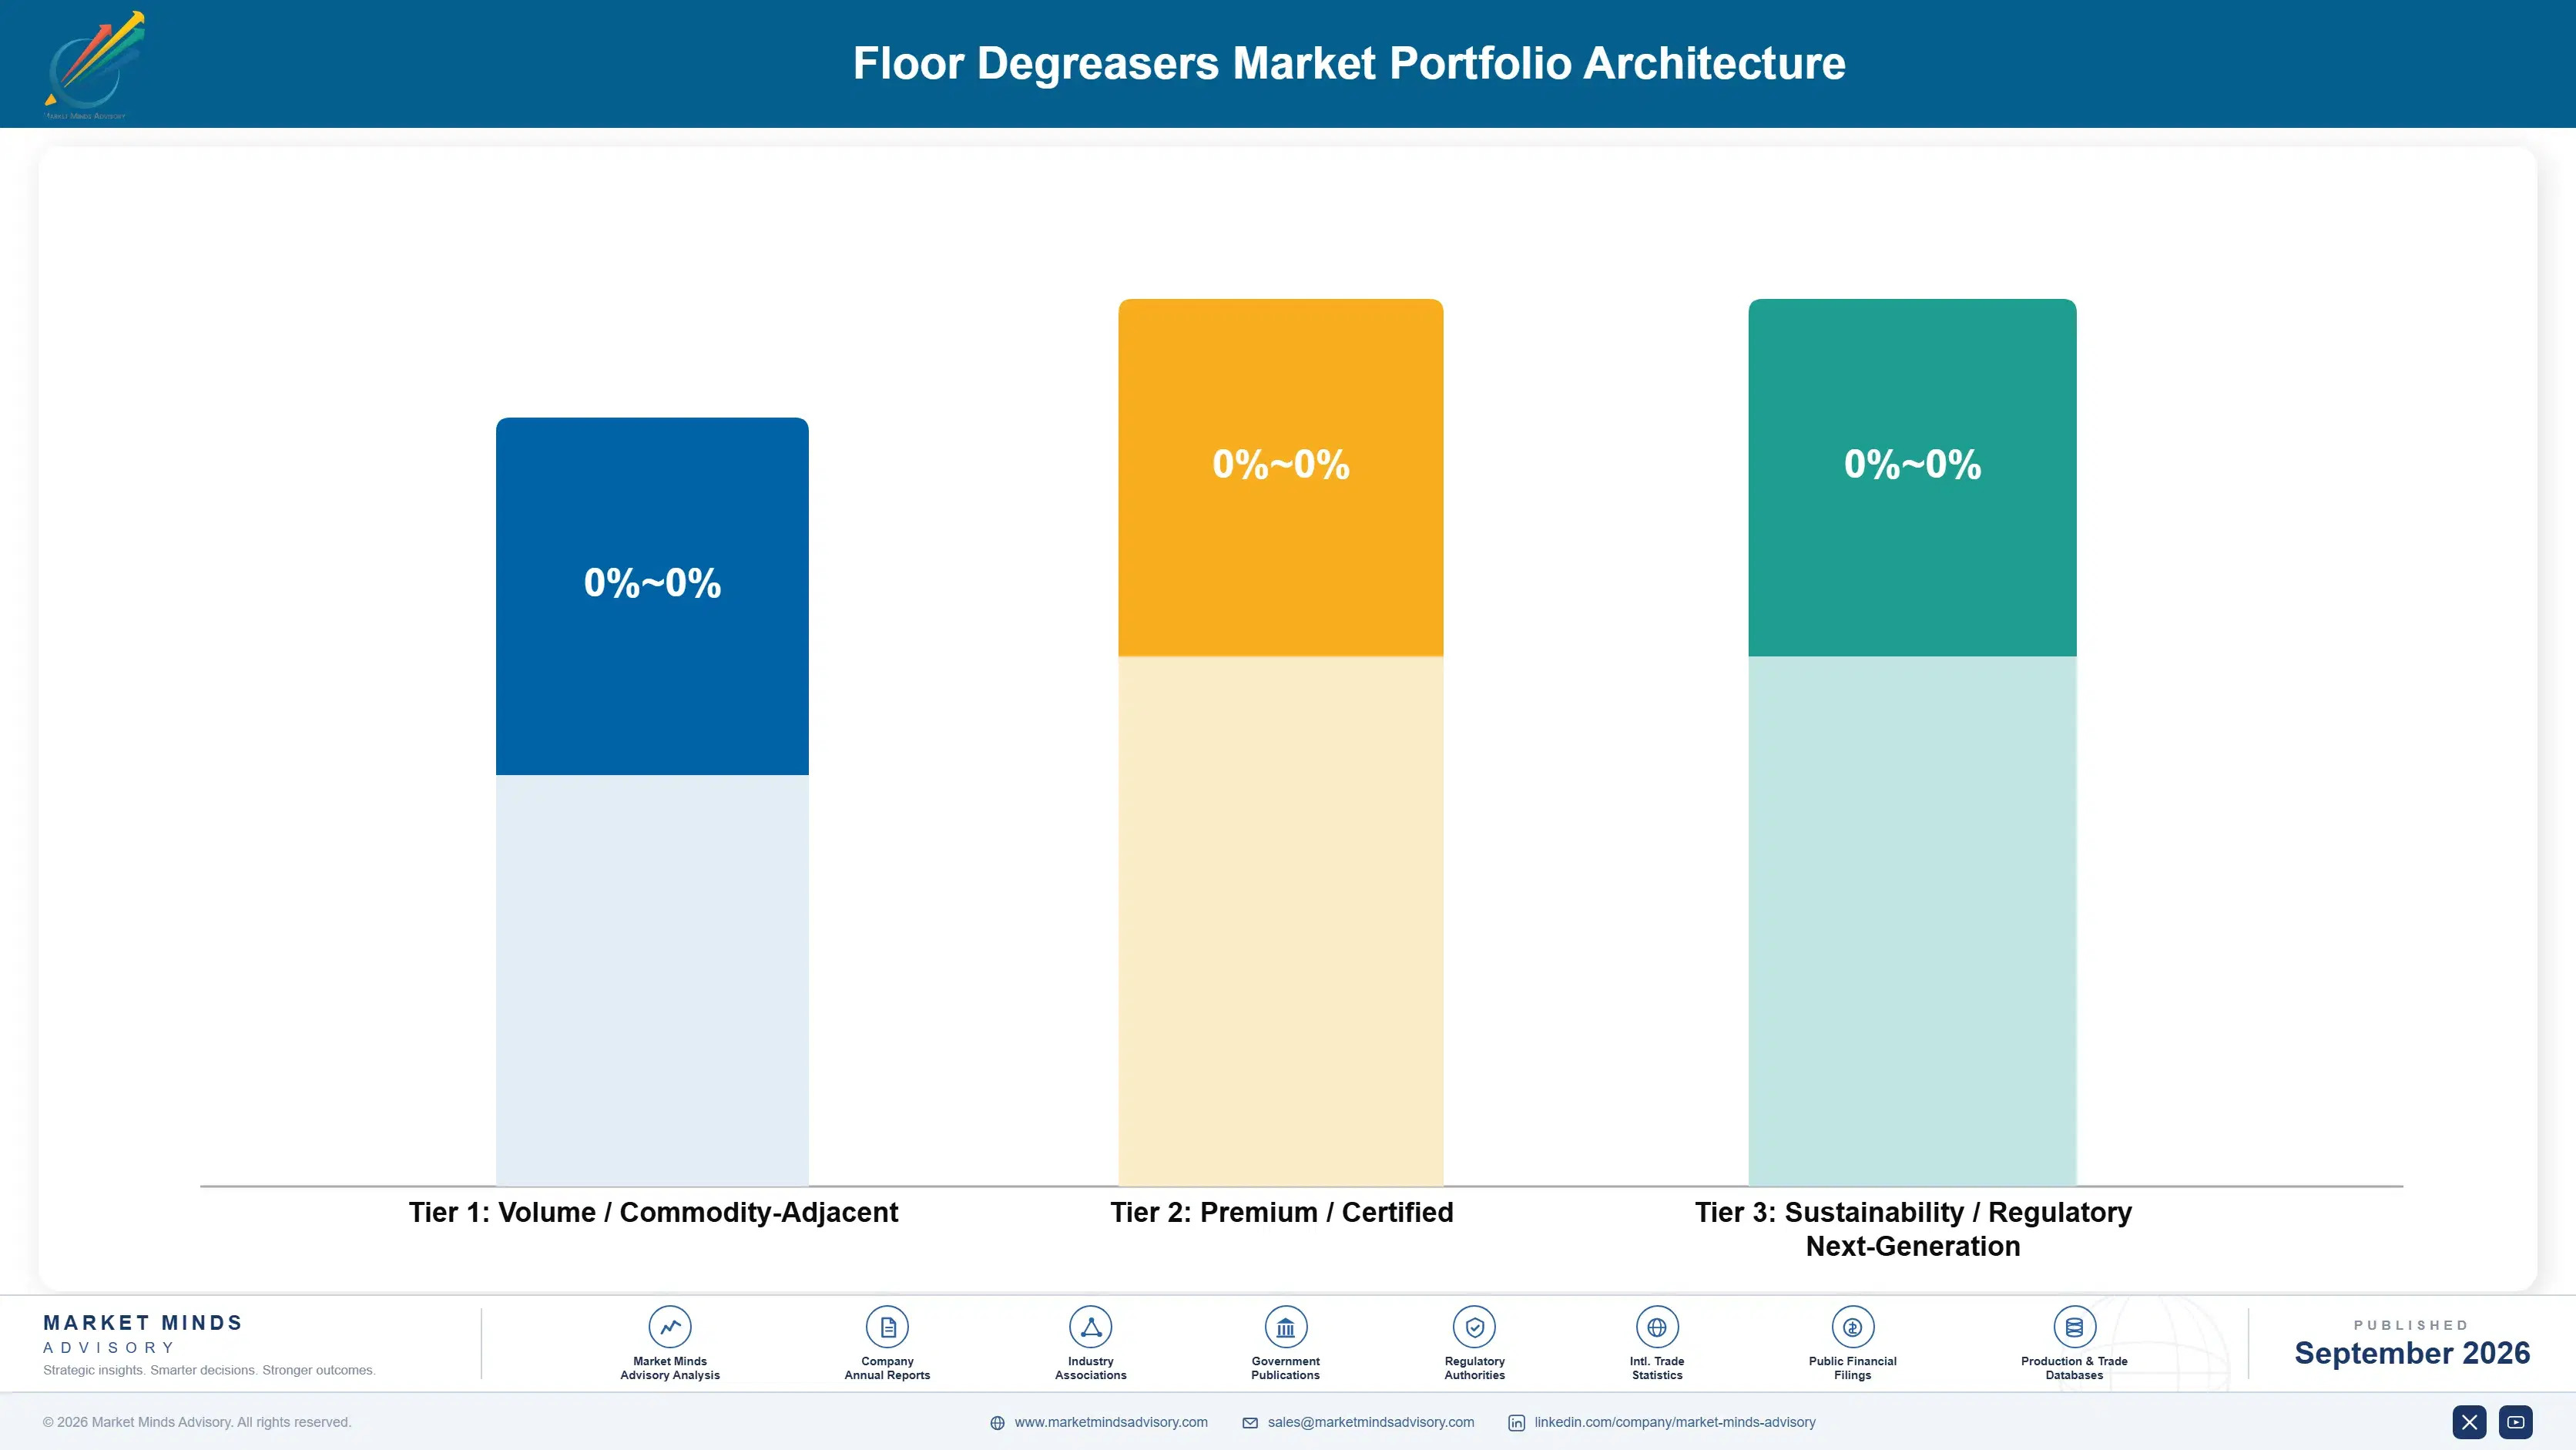
Volume / Commodity-Adjacent

Commodity alkaline built and solvent concentrates supplied against tender specifications with no service attached. The ten-point range reflects blending scale and raw material purchasing rather than any formulation advantage a customer could identify on site.
Gross Margin: 22% to 32%

Premium / Certified

Neutral pH daily systems and substrate-matched products supplied with compatibility guidance and application training for site teams. The twelve-point range separates suppliers providing genuine technical service from those attaching a data sheet to a delivery.
Gross Margin: 36% to 48%

Sustainability / Regulatory / Next-Generation

Enzymatic systems and dispenser-linked concentrate supplied with dosing data and liability documentation for underwriters. The fourteen-point range reflects whether hardware and reporting accompany the chemistry or the customer manages both independently.
Gross Margin: 50% to 64%
floor-degreasers-market-portfolio-architecture-1790013368640

High-value Sub-segments and Strategic Watch-out

Dispenser-Linked Concentrate Supply

Highest value in the category, since installed hardware converts a repeat purchase into a contract surviving procurement review. The fourteen-point range reflects whether usage data and liability documentation accompany the units or hardware is simply installed. Installation cost is recovered within the first contract term.
Gross Margin: 52% to 66%

Enzymatic And Biological Systems

High value growing at 8.1% on drain-line and effluent outcomes that alkaline chemistry actively worsens rather than helps. The fourteen-point range reflects whether operational support accompanies supply, since dwell time practice decides the result entirely. Schedule change is the barrier rather than product cost. Very few sites have changed it.
Gross Margin: 40% to 54%

Neutral pH Daily Products

Volume core growing at 7.3% by suiting the shift patterns sites actually run rather than by cleaning most effectively. The twelve-point range reflects substrate compatibility documentation, which is what justifies the premium over commodity alkaline chemistry. Grease removal per application is genuinely weaker. It matters less than it sounds.
Gross Margin: 34% to 46%

Commodity Alkaline Concentrate

The strategic watch-out. Regional blenders match the formulation, procurement compares price per litre, and nothing in the product resists that comparison at all. The ten-point range reflects raw material purchasing and blending scale alone. Switching happens at every tender without hesitation. No hardware defends the position at all.
Gross Margin: 20% to 30%

How This Demand Recurs

Consumption is continuous and entirely non-discretionary, since floors get cleaned every day a site operates regardless of budget conditions. What varies is which product does it and at what dilution, not whether the work happens. That makes the category unusually stable through economic cycles and unusually vulnerable to price substitution, because the volume is guaranteed while the supplier holding it is not.
Attachment depth follows hardware and documentation rather than satisfaction. Sites with installed dosing units and liability reporting stay with a supplier for many years, since switching means plumbing work and a new evidence trail for underwriters. Sites buying concentrate in drums switch at every tender without hesitation. The chemistry is broadly interchangeable, and everybody involved understands that perfectly well. Hardware is what makes the difference, not preference.

The buyer profile has moved from facilities purchasing toward risk and compliance. Degreaser was a consumables line item and has become part of a slip liability file and an effluent discharge record, which changed who signs and what evidence they need. Suppliers still selling on cleaning performance are addressing a person who no longer makes the decision alone.
floor-degreasers-market-end-use-penetration-index-1790013369132

Where This Market Rewards

These are among the four positions where our research anticipates prominent divergence between winners and laggards over the coming forecast period. Each is grounded in the demand model, the regulatory perimeter, and the announced capacity pipeline.
01 / DOSING HARDWARE ATTACHMENT

The dispenser holds the account, not chemistry

Dilution compliance runs at roughly 31% where concentrate is poured out of a jug, and rises above ninety at sites where a maintained dosing unit has been fitted properly. Suppliers installing and maintaining dispensers report account retention 3.2 times higher than competitors supplying the same concentrate into the same sites. Hardware plumbed into a wall makes switching a physical undertaking rather than a purchase order amendment at the next review, and maintenance visits generate exactly the dosing records underwriters now ask for.
02 / SUBSTRATE LIFECYCLE COSTING

Strong chemistry is eating the floor

Built alkaline degreasers shorten commercial kitchen flooring life to around 6.8 years, against substrates that would comfortably last a good deal longer than that under gentler chemistry. Suppliers presenting combined chemical and flooring lifecycle cost together report specification wins 2.3 times higher on multi-site estate accounts. The capital works budget and the consumables budget sit with different people, which is precisely why nobody has ever compared the two figures, and estates teams recognise the figure immediately once somebody presents it to them.
03 / COST IN USE PRESENTATION

Price per litre is the wrong number

Procurement systems record purchase price rather than diluted cost, so a concentrate diluting at one in a hundred loses on any quotation sheet to one diluting at one in twenty. Suppliers presenting full cost-in-use calculations at tender stage report win rates 1.9 times higher against cheaper headline prices. The arithmetic is straightforward and buyers accept it readily, yet remarkably few suppliers present it where the decision actually gets made, which leaves the position available to whichever supplier bothers to bring it.
04 / LIABILITY DOCUMENTATION SERVICE

Underwriters now ask the buying question

Grease residue accounts for roughly 44% of slip claim cost across food service, and underwriters increasingly require documented product and dosing evidence before agreeing terms with operators. Suppliers providing that documentation as a standard part of their service report account values 2.6 times greater than competitors supplying product alone. It moves the purchase from consumables procurement into risk management, where price per litre stops governing anything, and very few suppliers currently offer that reporting as a standard part of supply.

Engagement Snapshot From the Field

A live engagement with an industry participant carrying material or product regulatory and market exposure ahead of a defining policy shift, showing how our research translates into a defensible multi-year portfolio strategy.
MARKET MINDS ADVISORY · CLIENT ENGAGEMENT SUMMARY
Floor Degreasers Producer Strategic Portfolio Review and Transition Roadmap 2026·Investment Scenario on Floor Degreasers Exposure Evaluation 2025-26
CLIENT PROFILE
A quick service restaurant operator running 640 company-owned sites across four countries, with annual cleaning consumables spend near USD 11 million (client-reported, unverified by MMA). Slip claims had risen for three consecutive years despite two degreaser brand changes, and kitchen flooring was being replaced far sooner than the estates team had budgeted for. The board wanted the pattern explained before another tender.
STRATEGIC CHALLENGE
Operations attributed the slip claims to product performance and had begun tendering for a third supplier. Nobody had measured what dilution sites actually mixed, what dwell time closedown crews gave, or whether the flooring replacement pattern connected to the chemistry being specified. Two brand changes had already produced no measurable improvement in either slip incidence or flooring condition across the estate.
MMA APPROACH
MMA measured mixed concentration and dwell time across forty-one sites unannounced, compared slip claim incidence against dosing accuracy site by site, and assessed flooring condition against cumulative alkaline exposure using estates replacement records covering the preceding six years. Cost in use was recalculated across all three brands at both label and observed dilution, which nobody at the operator had previously attempted.
KEY FINDINGS
  1. Only 27% of sites mixed within the label range, and observed dwell times averaged under a fifth of the specified contact time across every site visited.
  2. Slip claim incidence correlated with dosing accuracy rather than with which of the three brands the site had been using at the time.
  3. Flooring replacement intervals averaged 6.4 years against a substrate design life above twelve, with the shortest intervals at the sites using the most concentrated alkaline product.
  4. The third tender would have changed the label on the drum and nothing measurable about site outcomes, since dosing practice was identical across all brands.
CLIENT PROFILE
A quick service restaurant operator running 640 company-owned sites across four countries, with annual cleaning consumables spend near USD 11 million (client-reported, unverified by MMA). Slip claims had risen for three consecutive years despite two degreaser brand changes, and kitchen flooring was being replaced far sooner than the estates team had budgeted for. The board wanted the pattern explained before another tender.
STRATEGIC CHALLENGE
Operations attributed the slip claims to product performance and had begun tendering for a third supplier. Nobody had measured what dilution sites actually mixed, what dwell time closedown crews gave, or whether the flooring replacement pattern connected to the chemistry being specified. Two brand changes had already produced no measurable improvement in either slip incidence or flooring condition across the estate.
MMA APPROACH
MMA measured mixed concentration and dwell time across forty-one sites unannounced, compared slip claim incidence against dosing accuracy site by site, and assessed flooring condition against cumulative alkaline exposure using estates replacement records covering the preceding six years. Cost in use was recalculated across all three brands at both label and observed dilution, which nobody at the operator had previously attempted.
KEY FINDINGS
  1. Only 27% of sites mixed within the label range, and observed dwell times averaged under a fifth of the specified contact time across every site visited.
  2. Slip claim incidence correlated with dosing accuracy rather than with which of the three brands the site had been using at the time.
  3. Flooring replacement intervals averaged 6.4 years against a substrate design life above twelve, with the shortest intervals at the sites using the most concentrated alkaline product.
  4. The third tender would have changed the label on the drum and nothing measurable about site outcomes, since dosing practice was identical across all brands.
RECOMMENDED STRATEGY
Phase 1: Phase one: halt the supplier tender and install wall-mounted dosing units across all sites before making any further change to the chemistry. Phase 2: Phase two: move daily cleaning to a neutral pH product with periodic alkaline deep clean, protecting substrate while retaining grease removal. Phase 3: Phase three: build dosing and product documentation into the liability file presented at insurance renewal each year. Underwriters had begun asking for exactly that evidence.
OUTCOME
Slip claim incidence fell 38% across the following four quarters (client-reported, unverified by MMA). Dilution compliance reached 91% at sites with maintained dispensers. Flooring replacement forecasts were extended by four years across the estate. Consumables spend rose slightly while total cost including flooring capital fell substantially across the estate.

Frequently Asked Questions

Foundational context covering the market sizes, CAGR, scope, country, region and competition that inform every finding below. This section is provided to cover basics and most often pre-purchase conversations, answered from the MMA Primary Research Dataset.

What is the current size of the Floor Degreasers Market?

The market was worth USD 3.2 billion in 2025 and reaches USD 3.4 billion in 2026. Value covers professional floor degreasing chemistry across commercial, industrial, and institutional settings.

How large will the Floor Degreasers Market be by 2036?

MMA forecasts USD 5.8 billion by 2036, an increase of USD 2.4 billion across the forecast period. That represents 1.71 times the 2026 base of USD 3.4 billion.

What is the CAGR for the Floor Degreasers Market 2026 to 2036?

The base case compound annual growth rate is 5.4%, with a bull case at 6.6% and a bear case at 4.2%. Historical growth from 2020 to 2025 ran at 4.3%.

Which segment is growing fastest?

Enzymatic and biological degreasers grow at 8.1%, half again the market rate of 5.4%. Drain-line and effluent benefits drive that, though dwell time requirements suit few sites.

Who are the major companies in the Floor Degreasers Market?

Ecolab, Solenis, Zep Inc, Betco Corporation, and State Industrial Products lead the category. Together they hold 33% of revenue, with dispenser estates rather than formulation separating them.

Which country is growing fastest?

Indonesia grows at 9.6%, driven by quick service restaurant and organised food retail expansion creating commercial kitchen floor area at a pace no mature market approaches.

Report Segmentation Architecture

The full report scope spans multiple orthogonal segmentation dimensions, with cross-tabulated demand data provided for each dimension pair. Coverage extends further to regional breakdowns, trend trajectories, and the competitive detail needed to support segment-level decision-making.

By Formulation Chemistry

  • Alkaline Built Degreasers
  • Solvent-Based Degreasers
  • Enzymatic and Biological Degreasers
  • Terpene and Citrus Degreasers
  • Neutral pH Daily Degreasers
  • Encapsulating and Emulsifying Degreasers

By End-Use Industry

  • Commercial Food Service and Restaurants
  • Food and Beverage Processing
  • Healthcare and Institutional Facilities
  • Manufacturing and Industrial Plants
  • Retail and Grocery
  • Transport and Logistics Facilities

By Commercial Dimension

  • Direct Supply To Chain Operators
  • Contract Cleaning Company Supply
  • Janitorial Distributor Supply
  • Dispenser-Linked Service Contracts
  • Foodservice Equipment Distribution
  • Online and Cash and Carry Purchase

By Region

  • East Asia
  • North America
  • Western Europe
  • South Asia and Pacific
  • Latin America
  • Middle East and Africa
  • Eastern Europe

Scope, Methodology, and Coverage

Every figure in this report is reproducible from documented input assumptions. The scope below maps the historical period, the forecast horizon, the segmentation dimensions, and the countries covered, alongside the underlying primary and qualitative methodology.
Historical Period
2020 to 2025
Forecast Period
2026 to 2036
Base Year
2025 (USD billions; MMA Primary Research Dataset, September 2026)
Market Definition
This market covers chemical formulations supplied for removing grease, oil, and fatty soils from hard floor surfaces in commercial, industrial, and institutional settings, across alkaline built, solvent-based, enzymatic and biological, terpene and citrus, neutral pH daily, and encapsulating and emulsifying degreasers. It excludes general purpose floor cleaners without degreasing function, floor finishes, sealers and strippers, equipment degreasers, household products, and cleaning machinery.
Quantitative Units
USD billions, revenue at supplier selling price
Segmentation Dimensions
Formulation chemistry, end-use industry, commercial dimension, region
Regions Covered
East Asia, North America, Western Europe, South Asia and Pacific, Latin America, Middle East and Africa, Eastern Europe
Countries Covered
China, Japan, South Korea, Taiwan, United States, Canada, Mexico, Germany, United Kingdom, France, Italy, Spain, Netherlands, Sweden, Poland, Czechia, Indonesia, India, Vietnam, Malaysia, Philippines, Thailand, Australia, Brazil, Colombia, Chile, Saudi Arabia, United Arab Emirates, Kenya, South Africa
Key Companies Profiled
Ecolab, Solenis, Zep Inc, Betco Corporation, State Industrial Products, Spartan Chemical Company, NCH Corporation, Simoniz USA, Buckeye International, Hillyard, Charlotte Products, Nyco Products, ITW Pro Brands, Kiehl Group, Dr. Schnell, Werner and Mertz, Christeyns, Bio-Circle Surface Technology, Chemische Fabrik Dr. Weigert, Nilfisk
Quantitative Methodology
Primary survey, n=3,800 respondents, Q4 2025, six countries; demand-side model with trade association cross-validation
Qualitative Methodology
47 expert interviews, Q4 2025; applied to validate demand model assumptions, identify emerging dynamics, and assess competitive positioning
Report Format
PDF and XLSX data workbook (Word format preview document)
Publisher
Market Minds Advisory
Report Code
MMA-2026-CHM-231
Published
September 2026
Contact
sales@marketmindsadvisory.com | www.marketmindsadvisory.com

Purchase the full Floor Degreasers Market Report (2026 to 2036).

The full report sizes the floor degreaser market across six formulation chemistries, seven regions, and thirty countries, with forecasts to 2036 under base, bull, and bear cases. It quantifies how far field dilution and dwell time depart from label specification, sets out the flooring lifecycle cost of built alkaline chemistry, and examines how slip liability underwriting has changed who makes the purchasing decision. Competitive analysis covers twenty participants evaluated consistently on category revenue, with detailed treatment of dispenser installed base as the durable competitive asset. Cost structure, cost-in-use economics, and service attachment margins are analysed throughout. Primary research includes 3,800 survey responses and 47 expert interviews.
Six formulation chemistries sized and forecast separately
Twenty participants evaluated on category revenue consistently
Field dilution and dwell time measured against label specification
Flooring lifecycle cost modelled against cumulative alkaline exposure
Dispenser installed base assessed as competitive asset by supplier
Slip liability documentation practice compared across major markets

Built For The People Who Decide

From boardroom strategy to bench-side execution, this report is read cover-to-cover by leaders shaping the next decade of their industry, turning demand scenarios, market dynamics and valuation benchmarks into decisions.
CXOs/ Presidents/ VPs/ Managers
M&A and Corporate Development
Strategy Teams and R&D Heads
Procurement and Product Directors
Regulatory and Compliance Leaders
Investor Relations and Equity Analysts